UMN-TH-4013/21, FTPI-MINN-21/06
Impact of Current Results on Nucleosynthesis∗
Abstract
The impact of recent results on Big Bang Nucleosynthesis is assessed. These include the Planck likelihood distributions for the baryon density; recent progress in helium abundance determinations; and a recent cross section measurement for .
1 Introduction
As one of the deepest probes of early universe cosmology, Big Bang Nucleosynthesis (BBN) [1, 2, 3, 4, 5, 6, 7, 8], has the ability to set constraints on a wide spectrum of extensions of the Standard Model [9, 10, 11, 12]. These can often be cast in the form of a constraint on the number of neutrino flavors exceeding the Standard Model value of 3. These limits only have meaning if we are confident that BBN accurately accounts for the abundances of the light elements. This concordance in turn depends on accurate measurements of the baryon density, and cross section measurements, and of course accurate astrophysical abundance determinations.
The baryon density can be accurately determined from cosmic microwave background (CMB) anisotropy measurements. Beginning with WMAP [13] and more recently Planck [14], within the standard model, BBN is effectively a parameter free theory [15]. Precise knowledge of the baryon density allows for well defined likelihood distributions for the BBN predictions [6, 8, 9, 16, 17, 18]. These in turn can be convolved with observational likelihood functions to set constraints on the number of neutrino flavors.
In this note, I will highlight the impact of 1) recent Planck data, 2) recent progress in abundance determinations, and 3) recent cross section measurements of .
2 The Impact of the Planck Likelihoods
Certainly the most revolutionary change in BBN analyses has been the ability to accurately fix the baryon density from CMB observations. Standard model results for BBN are shown in Fig. 1 which plots the light element abundances as a function of the baryon density, (upper scale) and (lower scale). In the left panel, the mass fraction, , for He is shown while the abundances of D, , and by number are shown relative to H. The line through each colored band is the mean value as a function of [8]. The thickness of each curve depicts the spread in the predicted abundances. The relative uncertainty, (the thickness of the curves, relative to the central value) is shown more clearly in the right panel.
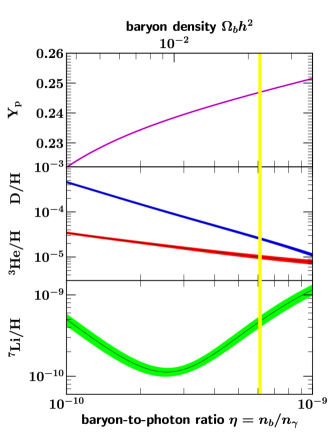
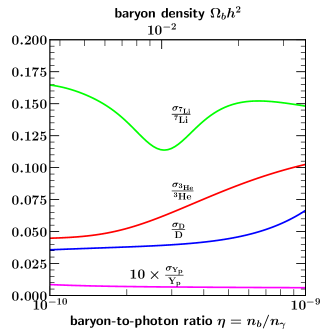
The vertical line in Fig. 1, shows the Planck determined value of the baryon density . As one can see, the relative thinness of the Planck line implies, that there are definite predictions from BBN for each of the light element abundances.
More formal analysis requires the construction of likelihood functions. Planck has provided many likelihood chains from CMB anisotropy and other measurements. We have taken the Planck likelihood chains which are based on temperature and polarization data, T+TE+EE+lowE, as well as CMB lensing [8]. Furthermore, we use the chains that do not assume any BBN relation between the helium abundance and baryon density. Thus for fixed , we have a likelihood function (and a separate likelihood function, , when is not fixed). In addition, from a Monte Carlo, we can construct a BBN likelihood function for each element, , (and similarly when is not fixed), and from the observations, . BBN results are obtained by a convolution of the CMB and BBN likelihoods by integrating over . The result for each light element is shown in Fig. 2 (left) by the purple shaded curves. The yellow-shaded curves correspond to the observational likelihood with the exception of where reliable primordial abundance measurements do not exist. Interestingly, by integrating alone over , we can determine the CMB likelihood for . This is shown by the cyan shaded curve. We see excellent agreement for D/H, good agreement for , and strong discrepancy in constitutes the persistent lithium problem [19].
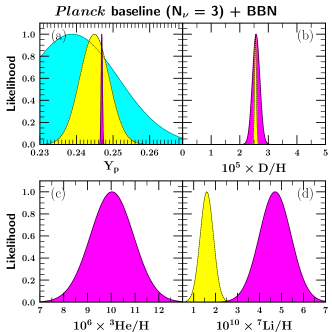
While the CMB plays a dominant role in determining the baryon density, BBN is able to refine this determination. In Table 1, the mean values of from the various convolutions of likelihood functions are given with their 1 uncertainties. Also shown is the value of at the peak of the likelihood. As one can infer from the BBN results shown in Fig. 1, BBN and the observed helium abundance alone is not very apt at fixing . Deuterium does much better, though the uncertainty in is still 4 times greater than the CMB alone. The primary cause for a deviation in the CMB value of is including the BBN relation between and . This case is labeled CMB+BBN, and does not use any abundance measurements. The last line of the table gives the final result which includes the abundance measurements of D and He, with . One can repeat the process when is not held fixed [8] and the best fit value of drops to . By marginalizing over , we can obtain likelihood functions for , giving a mean value of when all likelihoods are convolved.
| Constraints Used | mean | peak |
| CMB-only | 6.104 | |
| BBN+ | 4.920 | |
| BBN+D | 6.145 | |
| BBN++D | 6.140 | |
| CMB+BBN | 6.129 | |
| CMB+BBN+ | 6.128 | |
| CMB+BBN+D | 6.129 | |
| CMB+BBN++D | 6.129 |
3 Towards Precision abundance determinations
The abundance is determined from emission line data from extragalactic HII regions [20]. To account for systematics, a Markov-Chain Monte Carlo approach using the abundance as one of the several input parameters has been adopted [21, 22]. The abundance is determined simultaneously with several other physical input parameters which include the electron density, temperature, optical depth, neutral hydrogen fraction, as well as parameters for underlying absorption and reddening. The measured flux of six He and three H lines (relative to H), are compared with model predictions to obtain a statistic. The importance of an additional IR line for was proposed [23] and when available showed marked improvements in the accuracy of the abundance determinations [24].
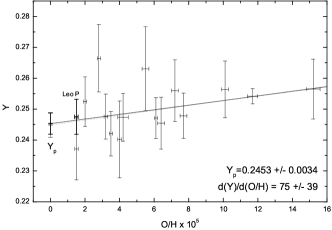
Most recently, it was shown that adding an additional 2 He lines, and nine H lines to fit nine input parameters can greatly improve the the accuracy of the fit [25]. An example of the potential improvement was demonstrated on data from Leo P. Table 2 shows the improvement made in going from nine emission line ratios to fit eight parameters made in 2013 [26], to 21 emission line ratios to fit nine parameters. All of the parameters are found with smaller uncertainties (sometimes significantly smaller) and a factor of 3 improvement in the helium mass fraction uncertainty. The primordial abundance is extracted from a linear fit to the data with respect to the oxygen abundance and is shown in Fig. 3 [25]. The resulting primordial abundance is found to be , a 15% improvement solely due to Leo P. This is to be compared with the uncertainty of 0.0002 in the BBN calculation.
| Skillman et al. (2013) [26] | Aver et al. (2021) [25] | |
| Emission lines | 9 | 21 |
| Free Parameters | 8 | 9 |
| He+/H+ | 0.0837 | 0.0823 |
| ne [cm-3] | 1 | 39 |
| aHe [Å] | 0.50 | 0.42 |
| 0.00 | 0.00 | |
| Te [K] | 17,060 | 17,400 |
| C(H) | 0.10 | 0.10 |
| aH [Å] | 0.94 | 0.51 |
| aP [Å] | - | 0.00 |
| 104 | 0 | 0 |
| 3.3 | 15.3 | |
| p-value | 7% | 23% |
| O/H 105 | 1.5 0.1 | 1.5 0.1 |
| Y | 0.2509 0.0184 | 0.2475 0.0057 |
4 The impact of New Cross Section Measurements
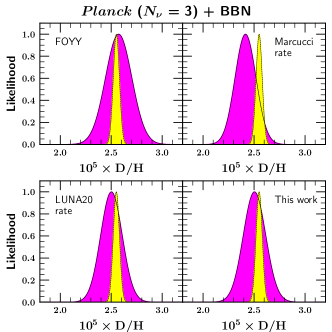
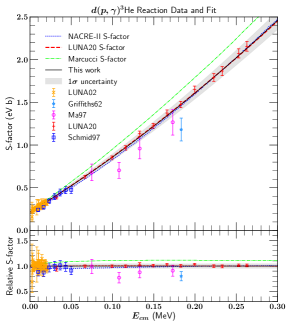
In contrast to , the observed uncertainty in D/H is compared with the theoretical uncertainty of , due to uncertainties in the experimental cross sections. Recently, the cross section was remeasured by the LUNA collaboration [27] in the BBN energy range with significantly higher accuracy than previous measurements. This data is shown in Fig. 4 along with previous data as labeled. Also shown are several fits: one based on NACRE-II data [28], a theory-based cross section [29], the LUNA collaboration fit [27] and our fit including previous data [30]. The latter two are very similar, as the fit is driven by LUNA data.
While the new cross section affects slightly the abundances of and , the dominant effect is on D/H, as might be expected. The effect of the cross section on the CMB-BBN likelihood functions is shown in the right set of figures in Fig. 2. In the upper left is the previous result (as in the upper right of the left panel) [8]. The theory cross section, has a significantly larger rate and therefore predicts substantially less D/H. The two bottom figures are based on the LUNA fit and the combined fit [30]. The mean value of D/H () for each case is , , and . The new cross section shifts slightly the best value for to . The residual error is due to the remaining uncertainty in He and H. For related studies of this new cross section, see Ref. [31].
When is not held fixed at the Standard Model value of 3, the likelihood analysis leads to a mean value of implying a 95% upper limit of and provides strong constraints on physics beyond the Standard Model.
Acknowledgments
I thank E. Aver, B. Fields, E. Skillman, and T.-H. Yeh for fruitful collaborations that lead to the results presented here. This work was supported in part by DOE grant DE-SC0011842.
References
References
- [1] K. A. Olive, G. Steigman and T. P. Walker, Phys. Rept. 333, 389 (2000) [astro-ph/9905320].
- [2] R. H. Cyburt, B. D. Fields and K. A. Olive, New Astron. 6 (1996) 215 [arXiv:astro-ph/0102179].
- [3] E. Vangioni-Flam, A. Coc and M. Casse, Astron. Astrophys. 360, 15 (2000) [astro-ph/0002248]; A. Coc, E. Vangioni-Flam, P. Descouvemont, A. Adahchour and C. Angulo, Ap. J. 600 (2004) 544 [arXiv:astro-ph/0309480].
- [4] R. H. Cyburt, Phys. Rev. D 70 (2004) 023505 [arXiv:astro-ph/0401091].
- [5] F. Iocco, G. Mangano, G. Miele, O. Pisanti and P. D. Serpico, Phys. Rept. 472, 1 (2009) [arXiv:0809.0631 [astro-ph]].
- [6] R. H. Cyburt, B. D. Fields, K. A. Olive and T.-H. Yeh, Rev. Mod. Phys. 88, 015004 (2016) [arXiv:1505.01076 [astro-ph.CO]].
- [7] C. Pitrou, A. Coc, J. P. Uzan and E. Vangioni, Phys. Rept. 754, 1 (2018) [arXiv:1801.08023 [astro-ph.CO]].
- [8] B. D. Fields, K. A. Olive, T. H. Yeh and C. Young, JCAP 03, 010 (2020) [erratum: JCAP 11, E02 (2020)] [arXiv:1912.01132 [astro-ph.CO]].
- [9] P. J. Kernan and L. M. Krauss, Phys. Rev. Lett. 72, 3309 (1994) [astro-ph/9402010]; L. M. Krauss and P. J. Kernan, Phys. Lett. B 347, 347 (1995) [astro-ph/9408023]; C. J. Copi, D. N. Schramm and M. S. Turner, Phys. Rev. D 55 (1997) 3389 [astro-ph/9606059]; K. A. Olive and D. Thomas, Astropart. Phys. 7 (1997) 27 [hep-ph/9610319]; K. A. Olive and D. Thomas, Astropart. Phys. 11, 403 (1999) [hep-ph/9811444].
- [10] E. Lisi, S. Sarkar and F. L. Villante, Phys. Rev. D 59, 123520 (1999) [hep-ph/9901404]; S. Sarkar, Rept. Prog. Phys. 59, 1493 (1996) [hep-ph/9602260].
- [11] R. H. Cyburt, B. D. Fields, K. A. Olive and E. Skillman, Astropart. Phys. 23, 313 (2005) [astro-ph/0408033].
- [12] G. Mangano and P. D. Serpico, Phys. Lett. B 701, 296 (2011) [arXiv:1103.1261 [astro-ph.CO]].
- [13] D. N. Spergel et al. [WMAP Collaboration], Astrophys. J. Suppl. 148, 175 (2003) [astro-ph/0302209].
- [14] N. Aghanim et al. [Planck], Astron. Astrophys. 641, A6 (2020) [arXiv:1807.06209 [astro-ph.CO]].
- [15] R. H. Cyburt, B. D. Fields and K. A. Olive, Astropart. Phys. 17 (2002) 87 [arXiv:astro-ph/0105397].
- [16] L. M. Krauss and P. Romanelli, Astrophys. J. 358, 47 (1990); M. S. Smith, L. H. Kawano and R. A. Malaney, Astrophys. J. Suppl. 85, 219 (1993).
- [17] B. D. Fields and K. A. Olive, Phys. Lett. B 368, 103 (1996) [hep-ph/9508344]; B. D. Fields, K. Kainulainen, K. A. Olive and D. Thomas, New Astron. 1, 77 (1996) [astro-ph/9603009].
- [18] R. H. Cyburt, B. D. Fields and K. A. Olive, Phys. Lett. B 567, 227 (2003) [astro-ph/0302431].
- [19] R. H. Cyburt, B. D. Fields and K. A. Olive, JCAP 0811, 012 (2008) [arXiv:0808.2818 [astro-ph]].
- [20] Y. I. Izotov, T. X. Thuan and G. Stasińska, Astrophys. J. 662, 15 (2007) [arXiv:astro-ph/0702072].
- [21] E. Aver, K. A. Olive and E. D. Skillman, JCAP 1103, 043 (2011) [arXiv:1012.2385 [astro-ph.CO]] (AOS2).
- [22] E. Aver, K. A. Olive and E. D. Skillman, JCAP 1204, 004 (2012) [arXiv:1112.3713 [astro-ph.CO]] (AOS3).
- [23] Y. I. Izotov, T. X. Thuan and N. G. Guseva, Mon. Not. Roy. Astron. Soc. 445, 778 (2014) [arXiv:1408.6953 [astro-ph.CO]] (ITG14).
- [24] E. Aver, K. A. Olive and E. D. Skillman, JCAP 07, 011 (2015) [arXiv:1503.08146 [astro-ph.CO]] (AOS4).
- [25] E. Aver, D. A. Berg, K. A. Olive, R. W. Pogge, J. J. Salzer and E. D. Skillman, JCAP 03, 027 (2021) [arXiv:2010.04180 [astro-ph.CO]].
- [26] E. D. Skillman, J. J. Salzer, D. A. Berg, R. W. Pogge, N. C. Haurberg, J. M. Cannon, E. Aver, K. A. Olive, R. Giovanelli, M. P. Haynes, E. A. K. Adams, K. B. W. McQuinn and K. L. Rhode, Astron. J. 146, 3 (2013) [arXiv:1305.0277 [astro-ph.CO]].
- [27] V. Mossa, K. Stöckel, F. Cavanna, F. Ferraro, M. Aliotta, F. Barile, D. Bemmerer, A. Best, A. Boeltzig and C. Broggini, et al. Nature 587, 210 (2020).
- [28] Y. Xu, K. Takahashi, S. Goriely, M. Arnould, M. Ohta and H. Utsunomiya, Nucl. Phys. A 918, 61 (2013) [arXiv:1310.7099 [nucl-th]].
- [29] L. E. Marcucci, G. Mangano, A. Kievsky and M. Viviani, Phys. Rev. Lett. 116, no. 10, 102501 (2016) Erratum: [Phys. Rev. Lett. 117, no. 4, 049901 (2016)] [arXiv:1510.07877 [nucl-th]].
- [30] T. H. Yeh, K. A. Olive and B. D. Fields, JCAP 03, 046 (2021) [arXiv:2011.13874 [astro-ph.CO]].
- [31] C. Pitrou, A. Coc, J. P. Uzan and E. Vangioni, Mon. Not. Roy. Astron. Soc. 502, no.2, 2474-2481 (2021) [arXiv:2011.11320 [astro-ph.CO]]; O. Pisanti, G. Mangano, G. Miele and P. Mazzella, JCAP 04, 020 (2021) [arXiv:2011.11537 [astro-ph.CO]].