∎
e1davide.chiesa@mib.infn.it \thankstexte2lorenzo.pagnanini@lngs.infn.it \thankstexte3stefano.pozzi@mib.infn.it
Background identification in cryogenic calorimeters through delayed coincidences
Abstract
Localization and modeling of radioactive contaminations is a challenge that ultra-low background experiments are constantly facing. These are fundamental steps both to extract scientific results and to further reduce the background of the detectors. Here we present an innovative technique based on the analysis of delayed coincidences in 232Th and 238U decay chains, developed to investigate the contaminations of the ZnSe crystals in the CUPID-0 experiment. This method allows to disentangle surface and bulk contaminations of the detectors relying on the different probability to tag delayed coincidences as function of the decay position.
Keywords:
double beta decay scintillating calorimeters background analysis1 Introduction
Experiments searching for rare events, such as neutrinoless double-beta () decay Dolinski:2019nrj , demand for a detailed background understanding in order to implement possible reduction techniques and to collect crucial information for next-generation experiments CUPIDInterestGroup:2019inu . Depending on the detector features, different techniques are adopted to perform this analysis, exploiting all the information contained in the data themselves, such as particle energy, event topology, time correlation, and particle type. Cryogenic calorimeters Pirro:2017ecr ; app11041606 developed to search for the decay have already demonstrated how to use these techniques to understand and reduce the background. For example, thanks to the experience gained with the Cuoricino experiment Andreotti:2010vj , a new conceptual design was introduced for the detector holder, thus mitigating the background due to degraded-energy -particles emitted by copper contaminations in the CUORE-0 experiment Alessandria:2012zp . CUORE-0 in turns provided the first background model for cryogenic calorimeters Alduino:2016vtd , on which the CUORE background budget Alduino:2017qet is based. Over the past decade, we reached a deeper understanding of the background and we further reduced it through scintillating calorimeters Pirro:2005ar ; Arnaboldi:2010gj ; Artusa:2016maw ; Armengaud:2017hit , which introduced the groundbreaking possibility to identify the interacting particles.
CUPID-0 is the first 10 kg-scale demonstrator of such technique and allowed to reach the lowest background ever measured by cryogenic calorimeters, i.e. counts/ in the region of interest around the 82Se decay Q-value (= 2997.9 0.3 keV Lincoln:2012fq ), characterized by an average energy resolution of (20.05 0.34) keV FWHM Azzolini:2019tta ; Beretta:2019bmm . Such impressive low background rate was achieved by combining the -particle identification (and rejection) with the analysis of time-delayed coincidences. In particular, we tagged potential 212Bi decays and we vetoed any event occurring within 7 half-lives of its daughter 208Tl ( min), that decays with a high Q-value (5 MeV). In this way, we reduced the background in the region of interest by a factor 4, at the cost of only 6% dead time Azzolini:2019tta .
In general, event-tagging based on time-correlations is a widespread tool to identify, quantify, and reduce the background of rare event experiments Friedman:2019guf ; Hachiya:2020mpu . Therefore, we decided to analyze the delayed coincidences due the -decay sequences in 232Th and 238U chains to improve the CUPID-0 background model Azzolini:2019nmi . Indeed, the -decay features, especially the short range of energy deposition, allow to study the contaminant localization. In this paper, we describe how we analyzed the delayed coincidences in the CUPID-0 data to extract information about the position (bulk vs surface) of crystal contaminations. This is very important to help designing next-generation bolometric experiments searching e.g. for decay, because the background index induced by such contaminations strongly depends on the their location.
2 Experimental setup
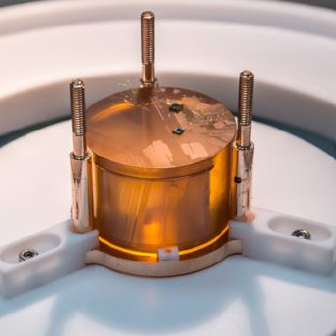
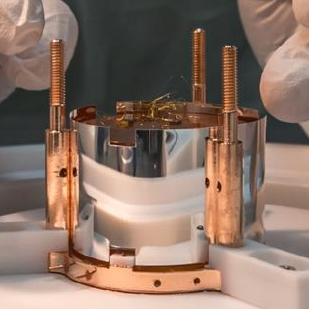
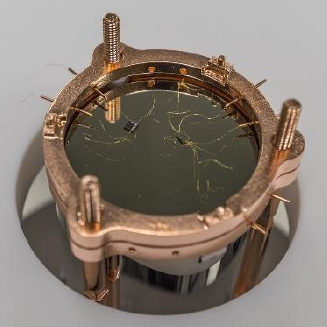
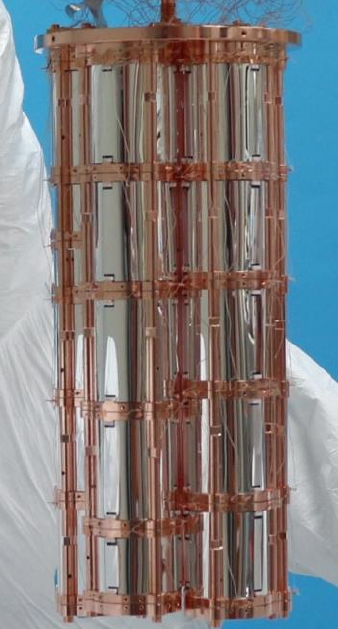
CUPID-0 is the first 10 kg-scale CUPID CUPIDInterestGroup:2019inu demonstrator using enriched scintillating calorimeters to search for decay of 82Se. The CUPID-0 detector is an array of 24 Zn82Se crystals 95% enriched in 82Se and two ZnSe crystals with natural Se, for a total mass of 10.5 kg. When a particle interacts in a ZnSe crystal, it produces a measurable temperature rise proportional to the energy deposit, and a light emission that allows for particle identification. The typical rise and decay times of signal pulses in ZnSe crystals are 14 ms and 36 ms, respectively Azzolini:2018tum . The ZnSe crystals are held in a copper frame through small PTFE clamps and laterally surrounded by 70 m thick VikuitiTM reflective foil to enhance light collection. To measure the light signal, 170 m thick germanium wafers operated as calorimetric detectors Beeman:2013zva are faced to the ZnSe crystals. Both light detectors and ZnSe crystals are equipped with a Neutron Transmutation Doped (NTD) Ge thermistor Haller , acting as temperature-voltage transducer. The detector is operated at a base temperature of 10 mK in an Oxford 1000 3He/4He dilution refrigerator located underground in the Hall A of the Laboratori Nazionali del Gran Sasso (Italy). The reader can find some pictures of the detector in Fig. 1 and more details in Ref. Azzolini:2018tum .
3 Data production
In this work, we analyze the spectrum of -particles detected by CUPID-0 Phase I, which lasted from June 2017 to December 2018 with a live-time of 74% for physics runs. The continuum data stream from ZnSe detectors is amplified and filtered with a 120 dB/decade, six-pole anti-aliasing active Bessel filter and saved on disk with a sampling frequency of 1 kHz by a custom DAQ software package DiDomizio:2018ldc . We run a derivative trigger to identify the heat pulses and save a 5 s window for each detected signal. We save the trigger timestamp of each event with a 1 ms precision, given by the sampling frequency. To get the energy deposited in each event, we extract the pulse amplitude by applying a software matched-filter Gatti:1986cw , which improves the signal-to-noise ratio and, thus, the energy resolution. We convert the pulse amplitude into energy by fitting a parabolic function with zero intercept to the energy of the most intense -peaks produced by 238U and 232Th internal contaminations of ZnSe crystals Azzolini:2019nmi . We select particle events by requiring a non-zero light signal simultaneously recorded by light detectors and we tag the -particles relying on the light pulse shape parameter defined in Ref. Azzolini:2018yye , which allows to discriminate 99.9% of events from ones at energies 2 MeV. We tag the events that simultaneously trigger more than one crystal within a 20 ms time window, assigning a multiplicity label () equal to the number (#) of crystals hit. Since the total event rate is approximately 50 mHz, the probability of accidental coincidences is almost negligible (). Finally, we analyze the waveform of each triggered event to label piled-up events (1 s before and 4 s after trigger) for which the energy reconstruction is not reliable. The data from two enriched crystals, not properly working Azzolini:2018tum , and from the two natural crystals are not considered in the current analysis, therefore the total active mass of the detector is 8.74 kg, with a corresponding exposure of 9.95 kg yr.
4 Search for delayed coincidences
In CUPID-0, the -particles are not able to pass through the reflecting foils surrounding the ZnSe detectors, therefore we search for time-correlated events occurring in the same crystal. The factors that mostly affect the capability to correctly identify delayed coincidences are the time resolution of the detector and the event rate (). The first sets a constraint on the minimum half-life of the daughter nuclide that allows for the two events to be resolved in time. The latter, together with the time window opened to search for delayed coincidences (), determines the probability of random coincidences:
Since has to be kept 1 and must be chosen of the order of a few half-lives of the daughter nuclide (), the event rate restricts the possibility of searching for delayed coincidences in isotopes with only.
In CUPID-0, the detector time resolution is of the order of few ms and the rate of events is at maximum Hz/crystal and, on average, Hz/crystal. Therefore, the most suitable -decay sequences in 238U and 232Th chains for this analysis are:
In order to search for delayed coincidences produced by crystal contaminations, we process the data as follows.
-
1.
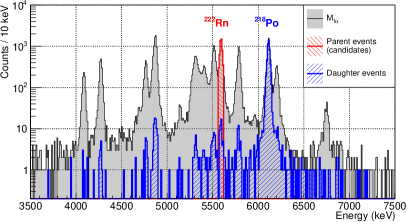
We label as candidate parents () all the single-hit () not piled-up -events at the Q-value peak of the first decay in the sequence, within a energy resolution range. This is a good compromise to select a large fraction of candidate parents, without including too much background from the continuum underlying the peaks (see red histograms in Fig. 2). This selection focuses the analysis on crystal contaminations, being the only ones that can produce a signal event at the Q-value.
-
2.
At each candidate parent, we tag as daughters all the events occurring in the same crystal within a time window of the second decay (blue histograms in Fig. 2). The length of the coincidence window is optimized to select a large fraction of signal (97%), while keeping random coincidences at a negligible level. We only require that a daughter is an -event, without applying multiplicity and pile-up cuts. In this way, we can identify a delayed coincidence even if an uncorrelated event simultaneously triggers another detector or if pile-up occurs. The latter case is particularly frequent in the 220RnPo decay sequence.
-
3.
When two candidate parent events occur in the same detector within , we discard both parents and their daughters from the analysis. In this way, we reduce the contribution from random delayed coincidences and we avoid ambiguity in the assessment of the between couples of parent-daughter events. The expected number of these random coincidences between parent candidates is given by:
(1) where is the number of candidate parent events detected by each channel , and is their rate. In Table 1 (last row), we check that the number of random coincidences between parent events found in the data () is compatible with the expected value calculated through Eq. 1, finding a very good agreement in both chains.
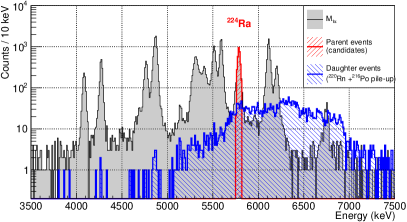
The energy spectra of parent and daughter events resulting from this analysis are shown in Fig. 2, together with the spectrum of the -events passing the pile-up rejection cut ().
In the search for 222Rn 218Po delayed coincidences belonging to the 238U chain, the spectrum of daughter events exhibits a clear peak at the 218Po Q-value (Fig. 2 (left)), demonstrating the effectiveness of this technique. Since the time window used in this case is relatively long (15.5 min), we also observe random daughter events corresponding to a fraction of 1% of the spectrum. To determine the number of detected delayed coincidences (), i.e. couples of time-correlated parent-daughter events, we exploit the daughter energy signature and we count the number of events falling in a energy resolution range centered at the 218Po Q-value.
In the 232Th chain we have a different situation due to the pile-up between 220Rn and 216Po events. Indeed, when searching for daughters of 224Ra decay, most of the selected events are tagged as piled-up and their energies are misreconstructed by the standard data processing (which just discards them). This is why in Fig. 2 (right), where we plot all daughter events including those miscalibrated due to the pile-up, we observe a continuous bump instead of two peaks at the 220Rn and 216Po Q-values. Nevertheless, having a good energy reconstruction of these events is not essential, because the information about time correlation is sufficient for the goal of the analysis presented hereafter, which requires to be determined. For this purpose, we simply count the number of 224Ra events followed by a 220Rn 216Po - piled-up event, that provides an unambiguous signature to identify this sub-chain of 3 consecutive decays. We conservatively discard the piled-up events spaced less than 80 ms in time because above this threshold we are able to precisely trace back the second pulse amplitude to a full-energy 216Po decay deposition.
| Decay chain | 238U | 232Th |
|---|---|---|
| Parent | 222Rn | 224Ra |
| Daughter | 218Po | 220Rn 216Po |
| Parent Range (keV) | ||
| Daughter Range (keV) | - | |
| (s) | 930 | 278 |
| (Parent Candidates) | 4938 | 3133 |
| (Delayed Coincidences) | 4442 | 2030 |
| / | / 47 | / 4 |
In Table 1, we summarize the parameters used to search for delayed coincidences in 238U and 232Th chains and we report the corresponding results obtained for and . As observed in previous studies Pagnanini:2018sgy ; Azzolini:2018tum , contaminations are not homogeneously distributed over all detectors because of an increasing improvement of their radiopurity in the different production batches. Thus, the number of observed delayed coincidences in the different crystals reflects this inhomogeneity. Nevertheless, we find that the ratio is nearly constant in almost all crystals.
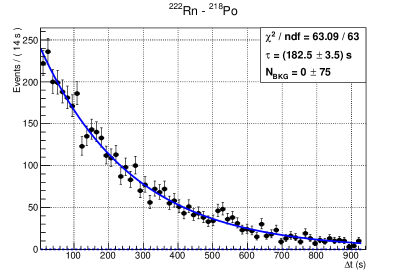
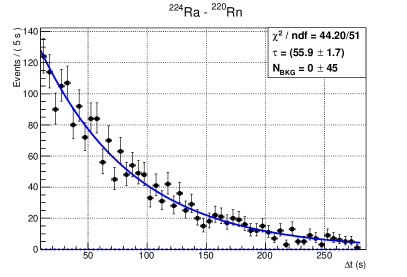
In order to check our selection of delayed coincidences and quantify the amount of random ones, we analyze the time distribution of the between couples of parent-daughter events. Indeed, the of physical time-correlated events follows an exponential distribution with a characteristic time parameter equal to the mean-life of the daughter, whereas the distribution of random coincidences can be approximated as flat when .
As shown in Fig. 3, the measured of the delayed coincidences identified in the 238U (left) and 232Th (right) chains are distributed with an exponential profile compatible with the half-lives of 218Po SINGH2019405 and 220Rn BROWNE20111115 , respectively. The flat background results to be compatible with zero in both cases, pointing us out a negligible number of random coincidences. This is also confirmed by calculating the expected value of random coincidences:
| (2) |
where is the -event rate of unpaired daughter-like events (i.e. having the same signature of daughters in term of energy for 218Po or pile-up structure for 220Rn 216Po) not in delayed coincidence with a parent. According to Eq. 2, in both 238U and 232Th decay chain analysis.
5 Localization of crystal contaminations
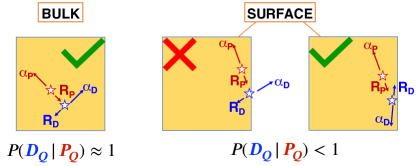
In the experiments searching for rare events, it is fundamental to localize the radioactive contaminations because the background rejection techniques have different efficiencies depending on their position. In cryogenic calorimeters, surface contaminations are of particular concern because the whole crystal volume is sensitive in detecting particle interaction, without any dead-layer. A very effective way traditionally used to identify surface contaminations of cryogenic calorimeters consists in analyzing the spectrum of events comprised of recoil coincidences in neighbours crystals Alduino:2016vtd . This method cannot be applied to CUPID-0 Phase I data analysis, because the reflective foil around the ZnSe crystals absorbs the -particles escaping from their surfaces, preventing the detection of recoil events. To overcome such limitation, we conceived an innovative method based on the analysis of - delayed coincidences. As shown in the next section, both bulk and surface contaminations produce candidate parent events at the Q-value, allowing to search for delayed coincidences with the procedure introduced in Sect. 4. Since the ratio between the number of detected delayed coincidences () to the number of candidate parents () depends on the source location, we can extract information about it. As sketched in Fig. 4, if the contamination is in the crystal bulk, the probability to detect a full-energy daughter event given a candidate parent observed at the Q-value, , is almost 1. Conversely, when contaminations are on crystal surfaces, the -particles have a not negligible probability to escape the detector. Thus in this case, the conditional probability to detect a daughter event at the Q-value is significantly .
In order to determine the activity ratio between surface () and bulk () contaminations of a particular decay sub-chain, we solve the following system of equations:
| (3) |
in which the number of candidate parents () and the number of delayed coincidences () are expressed as a function of the contaminant activities (), the measurement livetime (), and the detection efficiencies (). In this system, the different value of exploited to disentangle bulk and surface contaminations (hereafter labeled as ) enters in the terms, which can be expressed as .
By solving the system in Eq. 3, we finally obtain the formula to calculate :
| (4) |
The physical constraint to be respected in order to get positive results for is:
| (5) |
This is consistent with the fact that in an experiment we can expect to observe delayed coincidences from a combination of bulk and surface contaminations. If one of them is dominant, the experimental ratio will approach the range limits.
6 Evaluation of delayed coincidence probability
In the previous section, we showed that the ratio between the activity of surface and bulk crystal contaminations can be determined from the experimental data once the efficiencies ( and ) and the probabilities to detect delayed coincidences ( and ) are known. We evaluate these parameters through Monte Carlo simulations.
We simulate the background sources identified in Sect. 4 with a Monte Carlo tool, named Arby, based on the Geant4 toolkit Geant4 , version 10.02. The particles generated by the radioactive decays of interest are propagated using the G4EmLivermore physics list. The decay chains of 232Th and 238U can be simulated completely or in part, to reproduce secular equilibrium breaks. For each energy deposit in the detector, we record the information about the crystal where the interaction took place, the amount of deposited energy, and the time elapsed since the previous event in the decay chain. In order to make the simulation output as similar as possible to the experimental data, we implement the detector response and the data production features in a second step. We associate to each decay an absolute time randomly sampled on the time scale of the experimental data taking, with the exception of the decays occurring within 1 hour from their predecessors in order to preserve the time correlations of interest for this analysis. We account for the detector time resolution by summing up the energy depositions that occur in the same crystal within a ms window, and we group into multiplets the events involving different crystals within ms.
We simulate bulk contaminations by generating the decays in random positions uniformly distributed within the whole crystal volume. The usual approach for simulating surface contaminations in cryogenic calorimeters is to sample the decay positions from an exponential distribution , where is the so-called depth parameter. This parameter is usually chosen in the range from few nm up to tens of m, in order to reproduce the signatures from shallower to deeper contaminations observed in the experimental data Alduino:2016vtd ; Azzolini:2019nmi . Different values of the depth parameter can be traced back to different contamination mechanisms. For example, the exposure of a material to the air is expected to produce a very shallow contamination, whereas the treatment of crystal surfaces ARNABOLDI20102999 can originate deeper contaminations.
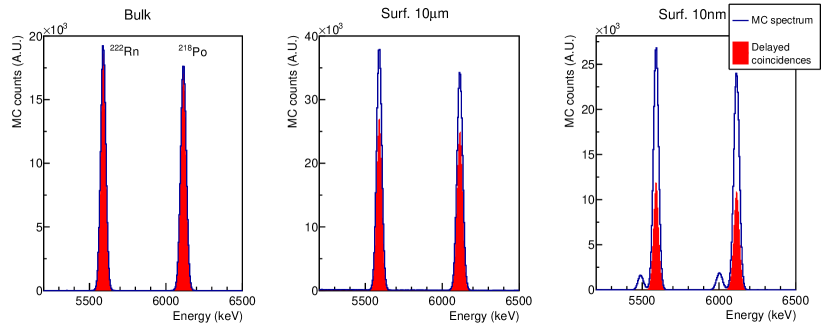
In Fig. 5 we show the result obtained for the 238U chain simulated in the bulk of crystals and on their surfaces with two different depth parameters. We set the two values equal to 10 nm and 10 m, being much lower and on the same scale of the -particle range, respectively. Even for very shallow surface contaminations, we get a significant fraction of events reconstructed at the -decay Q-value. We process the Monte Carlo outputs with the same procedure used to tag the delayed coincidences in the experimental data and we highlight the parent-daughter coincident events in the plot. As expected, the ratio of delayed coincidences over the number of parent candidates decreases as the contamination is simulated in a shallower layer near the crystal surfaces.
The analysis method presented in Sect. 5, provides a single parameter to quantify the activity of surface contaminations, thus a unique model must be chosen to describe them. According to Fig. 5, the deeper surface contaminations (10 m) produce a delayed coincidence signal which can be viewed as a combination of a bulk contamination and a shallower surface one. Therefore, in our analysis, we choose the simulations with nm to model surface contaminations and to study the ratio between bulk and surface activities.
| Isotope | Bulk | Surface |
|---|---|---|
| 222Rn | = 84.9% | = 39.6% |
| 218Po | = 96.5% | = 44.2% |
| 224Ra | = 79.5% | = 36.1% |
| 220Rn– 216Po | = 65.7% | = 14.3% |
In Table 2, we report the values of , , , and obtained from the MC simulations of 238U and 232Th decay chains. The efficiencies are computed by taking into account that a range was used to select the candidate parents in the experimental data. As expected from a simple geometric reasoning about escape process, the efficiencies and the probabilities related to surface contaminations are about half with respect to the bulk ones. The only exception is the probability to detect a delayed 220Rn–216Po piled-up event. This is because we are searching for a triple -decay sequence and we have to discard a fraction of piled-up events with ms to be consistent with the experimental data processing.
7 Results and discussion
| Decay chain | 238U | 232Th |
|---|---|---|
| 0.24 0.06 | ||
| (Bq) | ||
| (Bq) |
In this section we report the results of the delayed coincidence analysis based on the CUPID-0 data, obtained by combining the experimental data ( and ) with the Monte Carlo evaluations summarized in Table 2. The values reported in Table 1 can not be directly used to calculate the activity ratio , because they include a fraction of background events. Indeed, other radioactive sources can produce some events falling in the energy range of candidate parents. We exploit the CUPID-0 background model Azzolini:2019nmi to assess such contribution, which results on the percent scale for both parent peaks in the 232Th and 238U chains. The values obtained after subtracting the expected background counts are reported in Table 3, with an uncertainty that takes into account the Poisson fluctuations. The uncertainty associated to is the Binomial one with successes given trials. After calculating with Eq. 4, we solve the system in Eq. 3 to get and .
The results of this analysis prove that most of CUPID-0 crystal contaminants are located in their bulk. For the 238U sub-chain we get that 20% of decays occur near crystal surfaces, whereas for the 232Th sub-chain this fraction is constrained in a range between zero and a 13% 1 upper limit. This information was used to set prior constraints in the CUPID-0 background model Azzolini:2019nmi , allowing for the disentanglement of surface vs bulk crystal contaminations.
Given the total mass ( kg) and surface ( cm2) of ZnSe crystals used for this analysis, we calculate the specific activities of the -decay sequences for the 238U sub-chain:
and for the 232Th one:
It is worth noting that, because of secular equilibrium break, these results refer only to the second parts of 238U and 232Th decay chains, which are characterized by higher activities with respect to the first parts (see Azzolini:2019nmi for more details).
7.1 Systematics discussion
The results of this analysis depend on the efficiencies and probabilities related to surface contaminations reported in Table 2. These parameters are affected by the escape probabilities of s and nuclear recoils. The escape probability is significantly affected when the contamination depth is changed from nm to a value on the same scale of the range. For example, by analyzing our data with m, the activity ratios would scale up by a factor . This confirms that, for our analysis, a deep surface contamination is equivalent to a combination of a bulk and a shallow surface contamination. On the other hand, according to our MC simulations, we can consider the nuclear recoil escape as a second order effect for nm. Since in the experimental spectrum there are no emerging peaks at the energies of the isotopes analyzed in this work, we can exclude that shallower contaminations (10 nm) can significantly affect our results.
8 Conclusions
In this work, we presented an innovative analysis technique to study the background sources in cryogenic calorimeters relying on the time-correlation of -decay sequences in 238U and 232Th chains. This method allowed us to disentangle surface and bulk contaminations of ZnSe crystals exploiting the different probability to detect delayed coincidences depending on the contamination depth (see Fig. 5). In particular, we demonstrated that the 238U and 232Th contaminants of CUPID-0 detectors are mainly located in the bulk of crystals. This technique, that was applied for the first time to set prior constraints in the CUPID-0 background model Azzolini:2019nmi , can be adopted also in other experiments for broader purposes. For example, in the analysis of CUORE data Adams:2021rbc , delayed coincidences could help to better constrain the background sources Adams:2021xiz and to reject the time-correlated events falling in the region of interest. Moreover, the R&D activities for CUPID Armatol:2020oxe ; Armatol:2020rtb , CUPID-Mo Armengaud:2019rll ; Armengaud:2019loe ; Armengaud:2020luj , and in general the experiments searching for rare events can profit from this technique to study the radioactive contaminations of detector components and to select ultra-pure materials, with also the possibility to analyze other decay sequences in 238U, 232Th and 235U chains Nastasi:2021 . Finally, the analysis of delayed coincidences in CUPID-0 allowed to measure the half-life of 216Po Beretta:2021 .
9 Acknowledgments
This work was partially supported by the European Research Council (FP7/2007-2013) under contract LUCIFER no. 247115. We thank M. Iannone for his help in all the stages of the detector assembly, A. Pelosi for constructing the assembly line, M. Guetti for the assistance in the cryogenic operations, R. Gaigher for the mechanics of the calibration system, M. Lindozzi for the cryostat monitoring system, M. Perego for his invaluable help in many tasks, the mechanical workshop of LNGS (E. Tatananni, A. Rotilio, A. Corsi, and B. Romualdi) for the continuous help in the overall set-up design. We acknowledge the Dark Side Collaboration for the use of the low-radon clean room. This work makes use of the DIANA data analysis and APOLLO data acquisition software which has been developed by the Cuoricino, CUORE, LUCIFER and CUPID-0 collaborations. This work makes use of the Arby software for Geant4 based Monte Carlo simulations, that has been developed in the framework of the Milano – Bicocca R&D activities and that is maintained by O. Cremonesi and S. Pozzi.
References
- (1) M.J. Dolinski, A.W. Poon, W. Rodejohann, Ann. Rev. Nucl. Part. Sci. 69, 219 (2019). doi:10.1146/annurev-nucl-101918-023407
- (2) W. Armstrong, et al., arXiv 1907.09376 (2019)
- (3) S. Pirro, P. Mauskopf, Ann. Rev. Nucl. Part. Sci. 67, 161 (2017). doi:10.1146/annurev-nucl-101916-123130
- (4) M. Beretta, L. Pagnanini, Applied Sciences 11(4) (2021). doi:10.3390/app11041606
- (5) E. Andreotti, et al., Astropart. Phys. 34, 822 (2011). doi:10.1016/j.astropartphys.2011.02.002
- (6) F. Alessandria, et al., Astropart. Phys. 45, 13 (2013). doi:10.1016/j.astropartphys.2013.02.005
- (7) C. Alduino, et al., Eur. Phys. J. C 77(1), 13 (2017). doi:10.1140/epjc/s10052-016-4498-6
- (8) C. Alduino, et al., Eur. Phys. J. C 77(8), 543 (2017). doi:10.1140/epjc/s10052-017-5080-6
- (9) S. Pirro, S. Capelli, M. Pavan, E. Previtali, J. Beeman, P. Gorla, Phys. Atom. Nucl. 69, 2109 (2006). doi:10.1134/S1063778806120155
- (10) C. Arnaboldi, C. Brofferio, O. Cremonesi, L. Gironi, M. Pavan, G. Pessina, S. Pirro, E. Previtali, Astropart. Phys. 34, 797 (2011). doi:10.1016/j.astropartphys.2011.02.006
- (11) D. Artusa, et al., Eur. Phys. J. C 76(7), 364 (2016). doi:10.1140/epjc/s10052-016-4223-5
- (12) E. Armengaud, et al., Eur. Phys. J. C 77(11), 785 (2017). doi:10.1140/epjc/s10052-017-5343-2
- (13) D. Lincoln, et al., Phys. Rev. Lett. 110(1), 012501 (2013). doi:10.1103/PhysRevLett.110.012501
- (14) O. Azzolini, et al., Phys. Rev. Lett. 123(3), 032501 (2019). doi:10.1103/PhysRevLett.123.032501
- (15) M. Beretta, et al., JINST 14(08), P08017 (2019). doi:10.1088/1748-0221/14/08/P08017
- (16) M. Friedman, et al., Nucl. Instrum. Meth. A 940, 93 (2019). doi:10.1016/j.nima.2019.05.100
- (17) T. Hachiya, J. Phys. Conf. Ser. 1468(1), 012257 (2020). doi:10.1088/1742-6596/1468/1/012257
- (18) O. Azzolini, et al., Eur. Phys. J. C79(7), 583 (2019). doi:10.1140/epjc/s10052-019-7078-8
- (19) O. Azzolini, et al., Eur. Phys. J. C78(5), 428 (2018). doi:10.1140/epjc/s10052-018-5896-8
- (20) J.W. Beeman, et al., JINST 8, P07021 (2013). doi:10.1088/1748-0221/8/07/P07021
- (21) E.E. Haller, N.P. Palaio, W.L. Hansen, E. Kreysa, Neutron Transmutation Doping of Semiconductor Materials (Springer, 1984)
- (22) S. Di Domizio, et al., JINST 13(12), P12003 (2018). doi:10.1088/1748-0221/13/12/P12003
- (23) E. Gatti, P.F. Manfredi, Riv. Nuovo Cim. 9N1, 1 (1986). doi:10.1007/BF02822156
- (24) O. Azzolini, et al., Eur. Phys. J. C78(9), 734 (2018). doi:10.1140/epjc/s10052-018-6202-5
- (25) L. Pagnanini, Advanced search for neutrinoless double beta decay in selenium-82 with CUPID-0. Ph.D. thesis, SISSA (2018)
- (26) B. Singh, et al., Nuclear Data Sheets 160, 405 (2019). doi:10.1016/j.nds.2019.100524
- (27) E. Browne, J. Tuli, Nuclear Data Sheets 112(4), 1115 (2011). doi:10.1016/j.nds.2011.03.002
- (28) S. Agostinelli, et al., Nucl. Instr. Meth. A 506, 250 (2003)
- (29) C. Arnaboldi, et al., Journal of Crystal Growth 312(20), 2999 (2010). doi:10.1016/j.jcrysgro.2010.06.034
- (30) D.Q. Adams, et al., (2021). ArXiv: 2104.06906
- (31) D.Q. Adams, et al., Phys. Rev. Lett. 126(17), 171801 (2021). doi:10.1103/PhysRevLett.126.171801
- (32) A. Armatol, et al., Eur. Phys. J. C 81(2), 104 (2021). doi:10.1140/epjc/s10052-020-08809-8
- (33) A. Armatol, et al., JINST 16(02), P02037 (2021). doi:10.1088/1748-0221/16/02/P02037
- (34) E. Armengaud, et al., Eur. Phys. J. C 80(7), 674 (2020). doi:10.1140/epjc/s10052-020-8203-4
- (35) E. Armengaud, et al., Eur. Phys. J. C 80(1), 44 (2020). doi:10.1140/epjc/s10052-019-7578-6
- (36) E. Armengaud, et al., Phys. Rev. Lett. 126, 181802 (2021). doi:10.1103/PhysRevLett.126.181802
- (37) G. Baccolo, et al., (2021). ArXiv: 2105.03140
- (38) O. Azzolini, et al., (2021). ArXiv: 2105.03329