Ordering leads to multiple fast tracks in simulated collective escape of human crowds
Abstract
Elucidating emergent regularities in intriguing crowd dynamics is a fundamental scientific problem arising in multiple fields. In this work, based on the social force model, we simulate the typical scenario of collective escape towards a single exit and reveal the striking analogy of crowd dynamics and crystallisation. With the outflow of the pedestrians, crystalline order emerges in the compact crowd. In this process, the local misalignment and global rearrangement of pedestrians are well rationalized in terms of the characteristic motions of topological defects in the crystal. Exploiting the notions from the physics of crystallisation further reveals the emergence of multiple fast tracks in the collective escape.
I Introduction
Collective motion of pedestrians is a common phenomenon in various daily scenarios of urban life, and once driven by life-threatening panic, overcrowding and stampede may lead to fatalities Helbing and Molnar (1995); Helbing et al. (2005, 2007); Gravish et al. (2015); Tao and Dong (2017); Rogsch et al. (2010); Adrian et al. (2019); Gibelli and Bellomo (2019); Rahouti et al. (2018); Feliciani and Nishinari (2018). Understanding crowd dynamics is thus crucial for achieving safety and efficiency at both individual and collective levels Smith and Dickie (1993); Helbing et al. (2000); Batty et al. (2003); Metivet et al. (2018). Observations show that the majority of pedestrians walk in groups Moussaïd et al. (2010), and the size of free-forming groups conforms to Poisson distribution, indicating the existence of statistical regularity in complicated crowd behaviours James (1953); Sumpter (2006); Castellano et al. (2009). Collective phenomena, such as oscillational behaviour Schadschneider et al. (2009) and the fast-is-slower Lakoba et al. (2005); Zuriguel et al. (2020) and stop-and-go Chraibi et al. (2015); Boltes et al. (2018); Cordes et al. (2019) effects, are experimentally observed Helbing et al. (2000); Helbing and Johansson (2009). Quantitative measurement of pedestrian flows further reveals an analogy with the Navier-Stokes equations that originally describe dynamics of fluids Henderson (1971, 1974). The phenomenological fluid-dynamic approach captures macroscopic behaviours of crowd dynamics by averaging the behaviours of neighbouring individuals Helbing (1998); Bauer et al. (2007).
Further scrutiny of individual pedestrians could provide valuable microscopic information that yields insights into the intriguing crowd dynamics Helbing et al. (2000, 2003); Castellano et al. (2009); Czirók and Vicsek (2012); Chraibi et al. (2018); Corbetta et al. (2018); Das et al. (2020). Following this idea, a social force model (SFM) has been proposed to simulate the motion of human crowds Helbing (1991); Helbing and Molnar (1995); Helbing et al. (2000). The basic idea underlying the SFM is to treat pedestrians as particles with a simplified will. Specifically, this model features a mixture of both physical and socio-psychological forces influencing the walking behaviour of pedestrians, and it has the unique advantage of incorporating new forces as our understanding of pedestrians is advanced Helbing and Molnar (1995); Helbing et al. (2000); Moussaïd et al. (2010). Much has been learned about the law of crowd dynamics by applying the SFM in various situations Helbing et al. (2000, 2007); Moussaïd et al. (2010); Colombi and Scianna (2017).
While the SFM could conveniently provide detailed dynamical information of crowd motion by specifying proper values of model parameters Helbing et al. (2000), the challenge is to exploit the simulated data from a suitable perspective for revealing the underlying regularities. In this work, we resort to the analogy of crowd dynamics and crystallisation process Nelson (2002); Yao and Olvera de la Cruz (2014); Yao (2016), and gain insights into the intriguing collective motion. Specifically, we simulate the typical scenario of collective escape towards a single exit using the generalized social force model that incorporates the random behaviours of pedestrians. Our simulations show the rapid ordering of the initially randomly distributed pedestrians. In the compact “crystallised” crowd, local misalignments emerge at random sites, which are recognised as topological defects in two-dimensional crystal Chaikin and Lubensky (2000); Nelson (2002). With the outflow of pedestrians, the microscopic crystalline structure underlying the crowd is under persistent transformation, which exactly corresponds to the characteristic annihilation and glide motion of topological defects in the crystal. From the striking analogy between crowd dynamics and crystallisation process, and in combination with statistical analysis, we demonstrate the emergence of multiple fast tracks resulting from the spontaneously formed crystal structure in the escaping crowd. This work reveals the regularities in crowd dynamics from the perspective of crystallisation, and may provide useful information for understanding crowd behaviours in evacuation.
II Model and method
We simulate the crowd dynamics of pedestrians based on the SFM Helbing et al. (2000). It assumes a mixture of physical and socio-psychological forces influencing the crowd behaviour by considering personal motivations and environmental constraints. In this model, each pedestrian of mass and velocity tends to move by a desired speed along a certain direction during the acceleration time . The resulting personal desire force is:
| (1) |
Here, we note that the pedestrians are polarised to proceed towards the exit, since the desired direction of motion always points to the exit in the model. Furthermore, pedestrians psychologically tend to keep a social distance between each other and avoid hitting walls. This is modelled by introducing “interaction force” between pedestrians and and between pedestrian and the wall, respectively. The total interaction force is
| (2) |
Combining eqn (1) and (2), we obtain the acceleration equation
| (3) |
The position vector is updated by the velocity .
The interaction force between pedestrian and is specified as follows. With the distance between the two pedestrians’ centres of mass, the psychological tendency of pedestrian to stay away from pedestrian is described by a repulsive interaction force , where and are constants, indicating the strength and the range of the interaction, and is the normalised directional vector pointing from pedestrian to . The pedestrians touch each other if their distance is smaller than the sum of their radius and . In our model, we specify a uniform value for the size of each pedestrian (see Table 1) Helbing et al. (2000). While in reality the size of human body among the crowd is not uniform, previous work on 2D crystallisation shows that the size-polydispersity effect must be strong enough to disrupt the crystalline order Yao and Olvera de la Cruz (2014). The factor of size polydispersity among adult pedestrians is thus ignored in this work. Inspired by granular interactions, two additional forces are included in the model, which are essential for understanding the particular effects in panicking crowds: a “body force” counteracting body compression and a “sliding friction force” impeding relative tangential motion, if pedestrians and are close enough. Here means the tangential direction and the tangential velocity difference, while and are large constants, representing the bump and the friction effect. In summary, the interaction force between pedestrians and is given by
| (4) |
where the indicator function is zero for and it is equal to otherwise.
The interaction with the walls is treated analogously. By denoting as the distance to wall , as the direction perpendicular to it, and as the direction tangential to it, we have
| (5) |
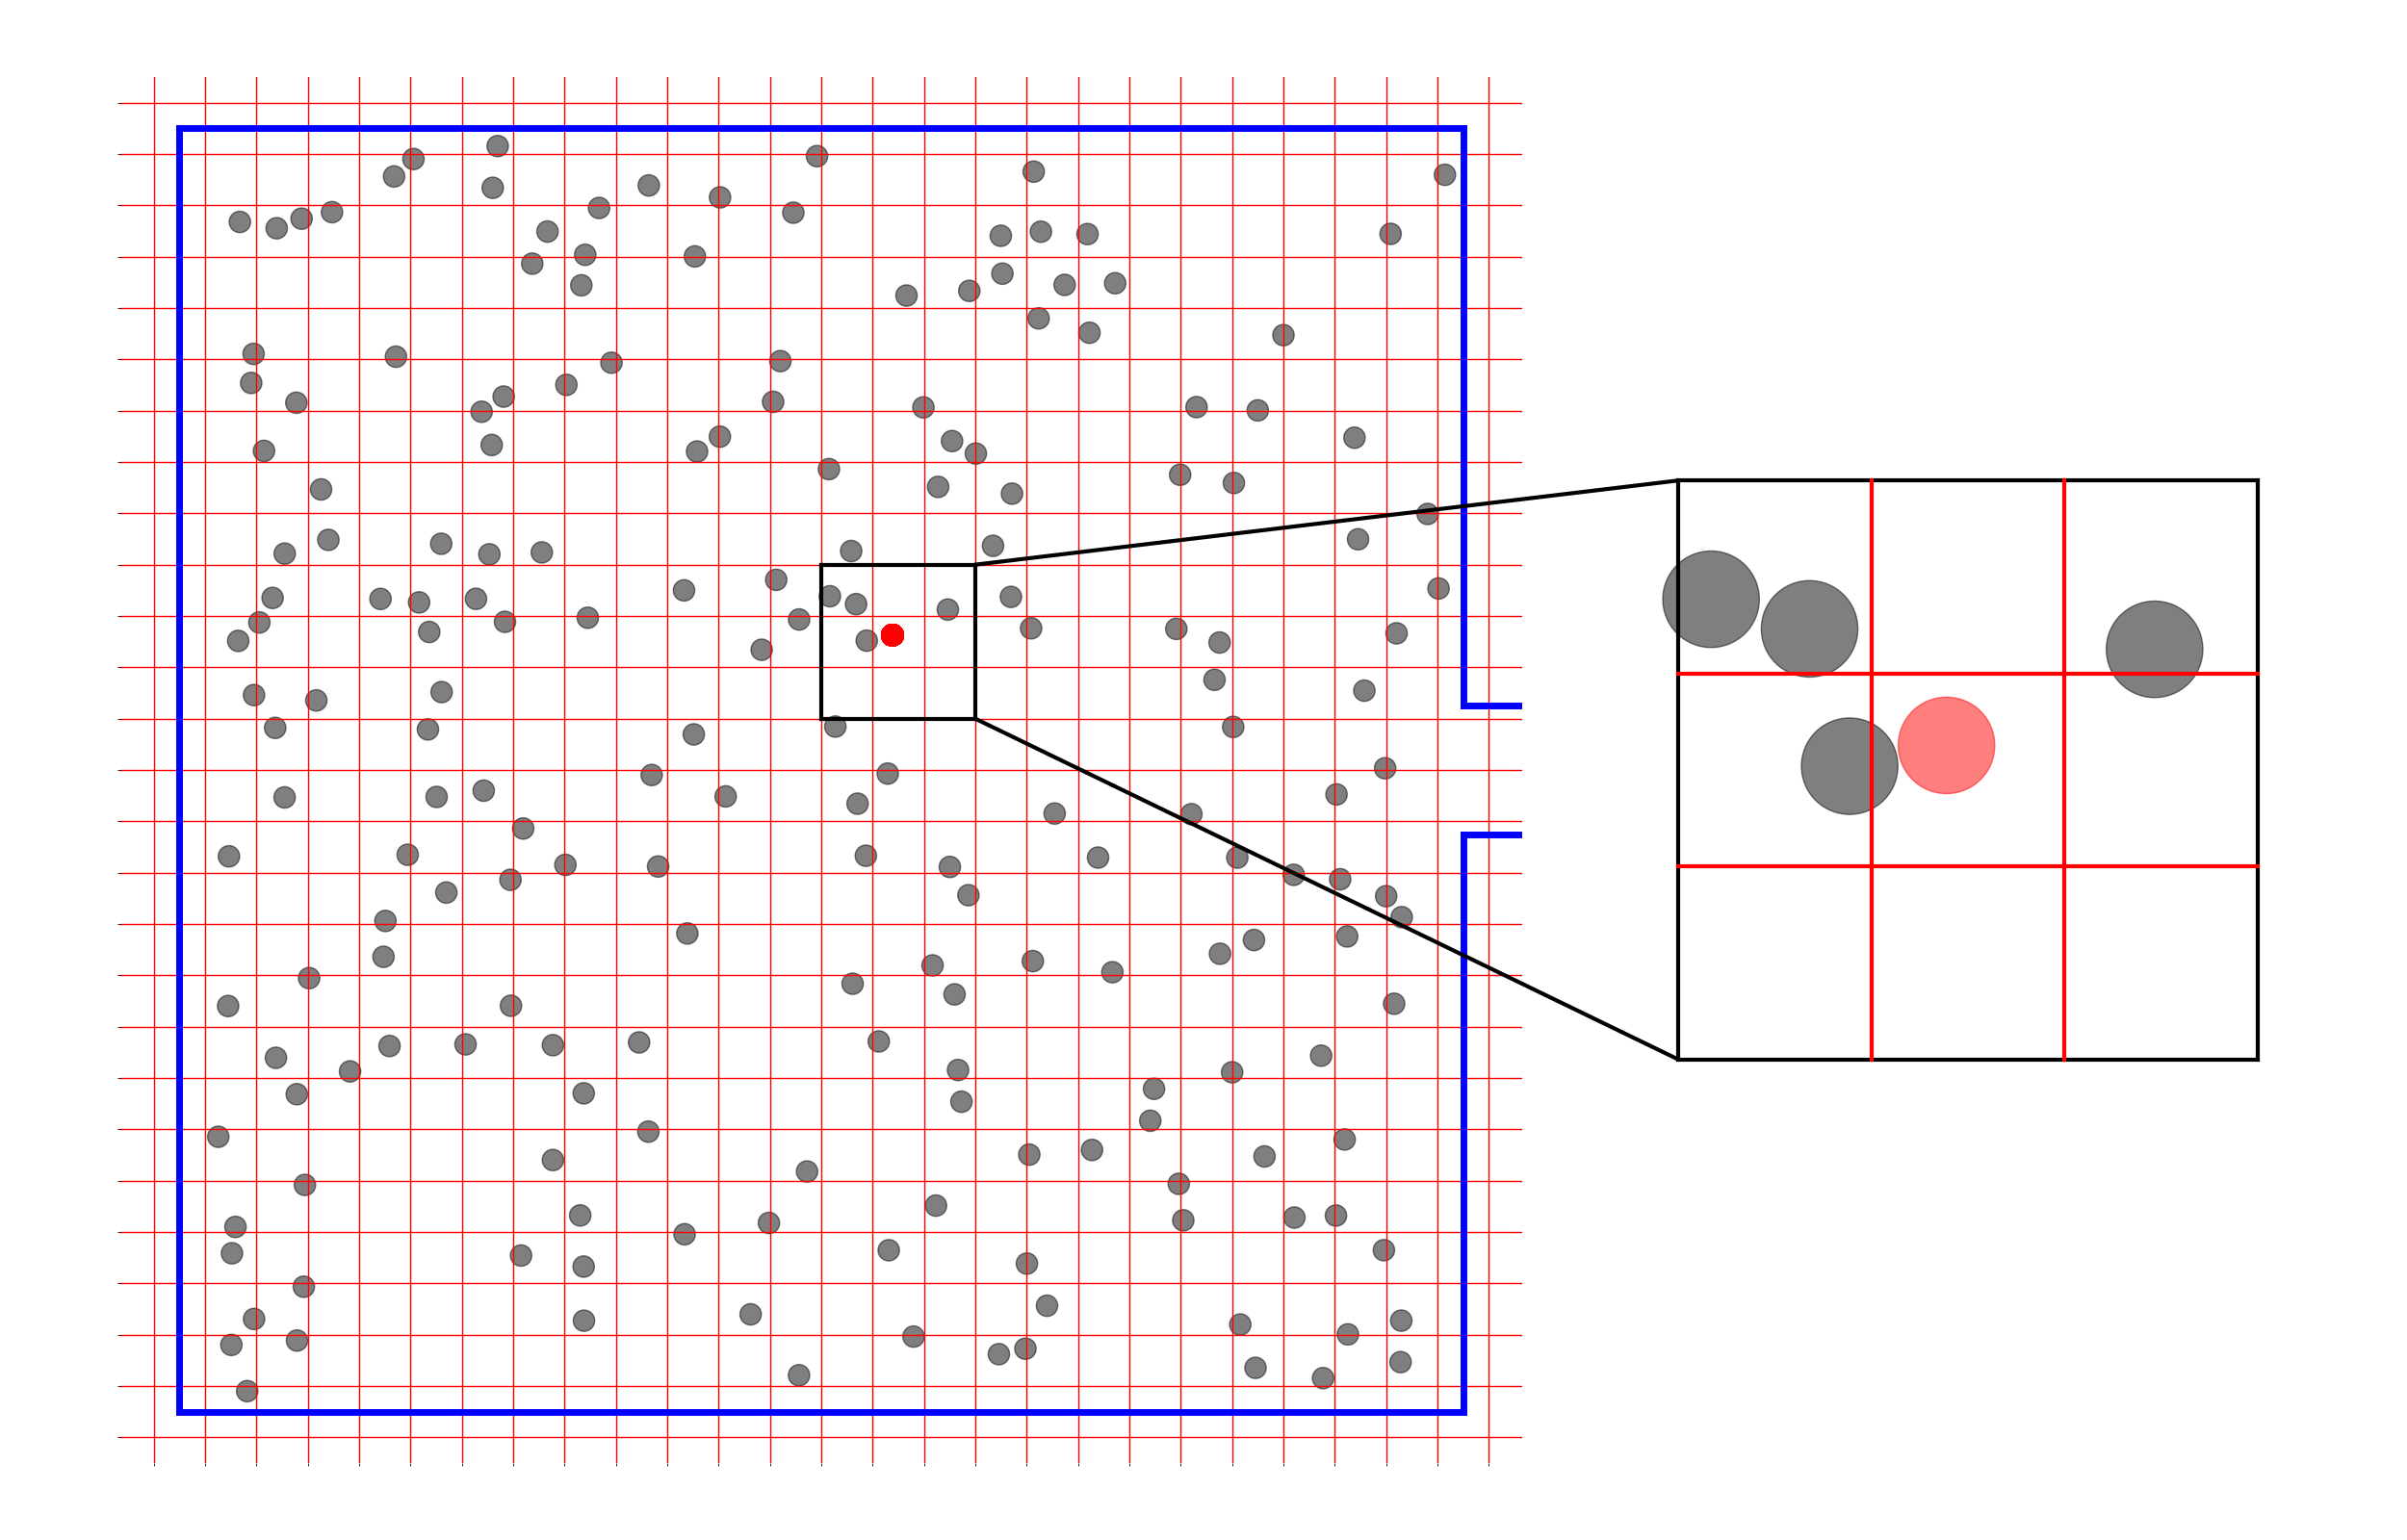
In the implementation of the SFM for large-scale systems, the most time-consuming part is to compute the interaction forces. For a -particle system, the maximum number of pairwise interactions is , which leads to time complexity. In this work we adopt the cell-list method Matin et al. (2003) to avoid repeated calculation of pairwise interactions and thus significantly reduce the time complexity from to Dobson et al. (2016). The cell-list method achieves this goal by dividing the physical space of the system into equal grids called cells. Each particle is assigned to a specific cell. In a two-dimensional system, each cell has eight neighbouring cells and a cell together with its eight neighbouring cells are called a cell neighbourhood (see Fig. 1). For each particle, we only need to calculate the interacting forces between the particles within the cell neighbourhood.
III Results and discussion
In this work we use the SFM to study a typical scenario of collective escape towards a single exit (see Fig. 1). Initially, pedestrians are randomly distributed in a square room of side length , and the parameter values used in our simulation are presented in Table 1, which largely follow Ref.12. For simplicity, the values for , , , , and for each pedestrian are taken to be identical. The moment when the crowd start to run towards the exit is denoted as . In our simulation, the state of motion is updated according to eqn (3) by the time step . In particular, the interaction forces between pedestrians are computed by the cell-list method. The edge length of each cell is set to be to ensure that the contribution from the next nearest neighbouring cells is negligibly small. The escape time for individual pedestrians is denoted as , and the evacuation time for all the pedestrians to leave the room is denoted as .
| Variable | Value | Description |
|---|---|---|
| side length of the room | ||
| number of pedestrians | ||
| mass of pedestrians | ||
| desired velocity | ||
| acceleration time | ||
| radius of pedestrians | ||
| interaction strength | ||
| interaction range | ||
| bump effect | ||
| friction effect | ||
| time step in simulation |
III.1 Collective escape statistics
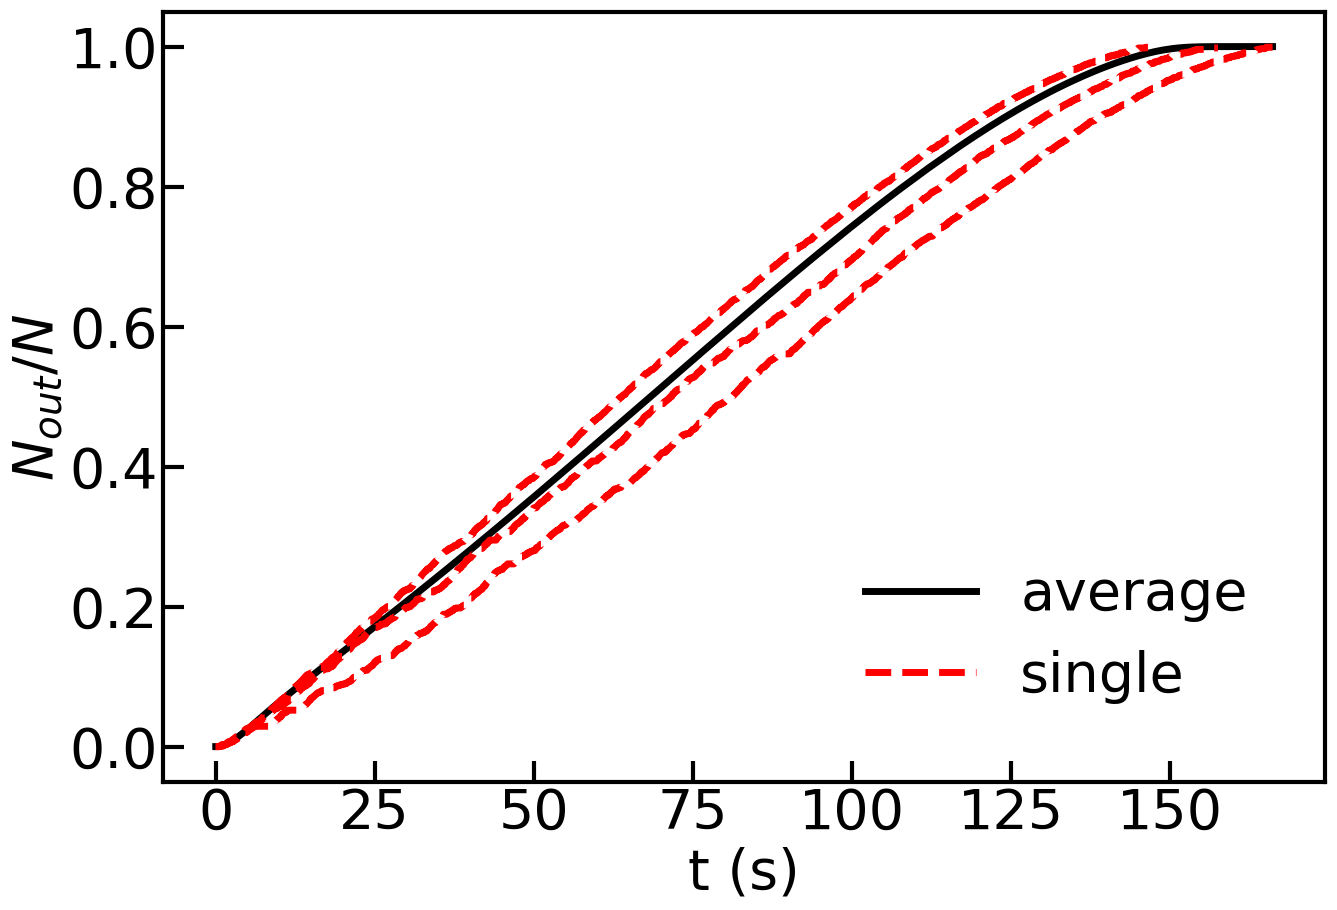
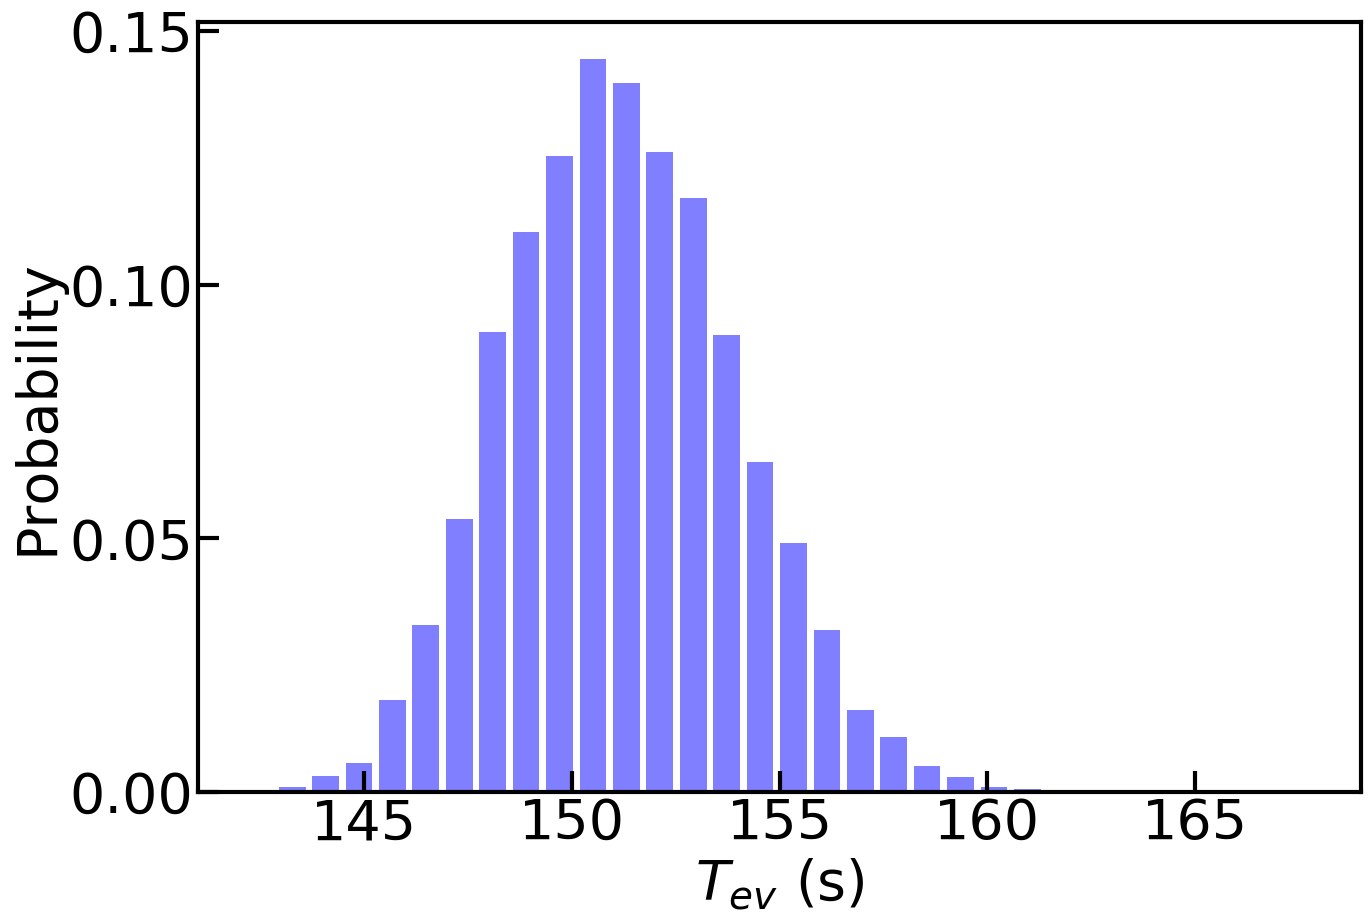
We analyze several statistics regarding escape of the pedestrians. First, the simulations allow us to track the instantaneous collective escape rate, which is defined as the percentage of the pedestrians who have successfully exited the room: where is the number of escaped pedestrians. The rate is plotted against time in Fig. 2. The black curve is the average instantaneous escape rate over 6000 independent simulations with random initial conditions, and the red dashed curves show the results of several randomly selected sample simulation trials. From the figure, we see that, despite of the highly nonlinear behaviors of individual pedestrians, the collective escape rate exhibits a rather linear dependence on time over a long duration, indicating a steady outflow of pedestrians. The escape curve becomes saturated only at the end of the escape event, and the plateau lasts for a relatively short duration. The evacuation time of independent simulations is also analyzed statistically, and the results are shown in Fig. 2. The histogram of is approximately a normal distribution. The curve of the collective escape rate and the histogram of the evacuation time imply the existence of statistical regularities underlying the highly complicated individual motions of pedestrians.
III.2 Formation of multiple fast tracks
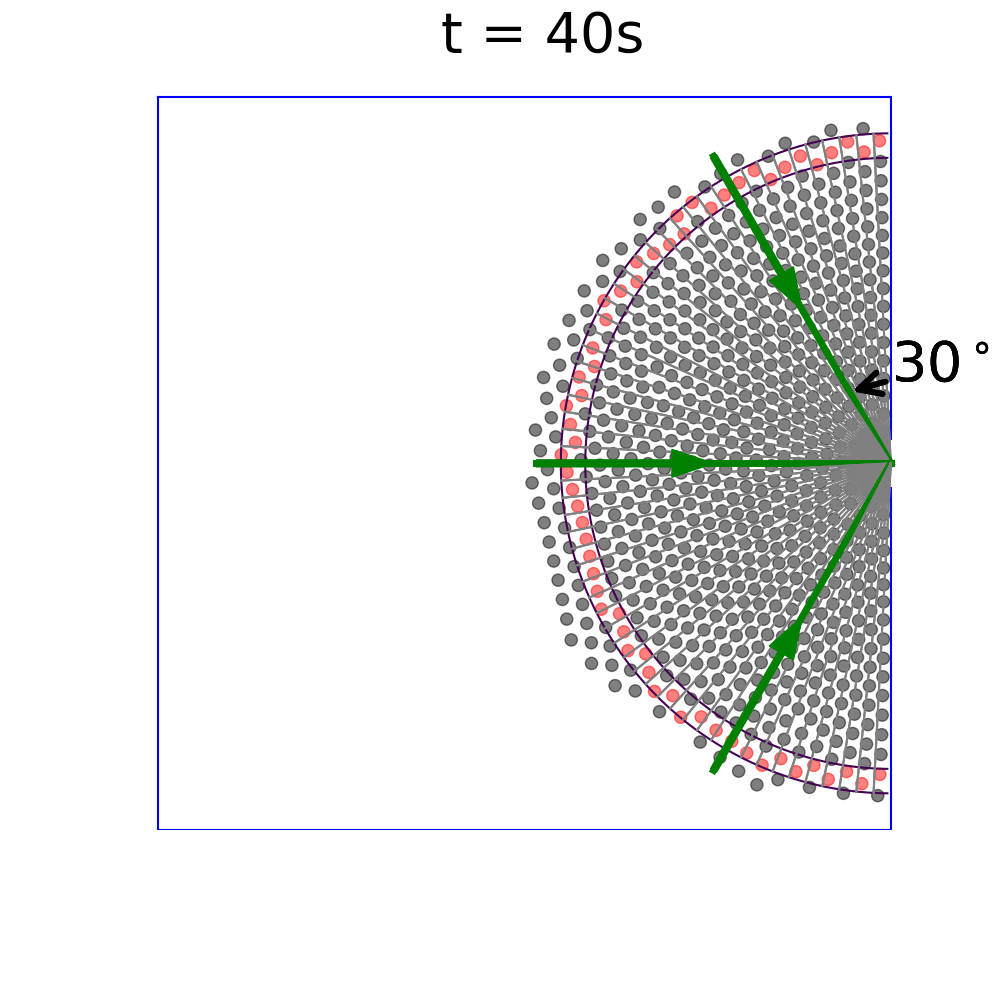
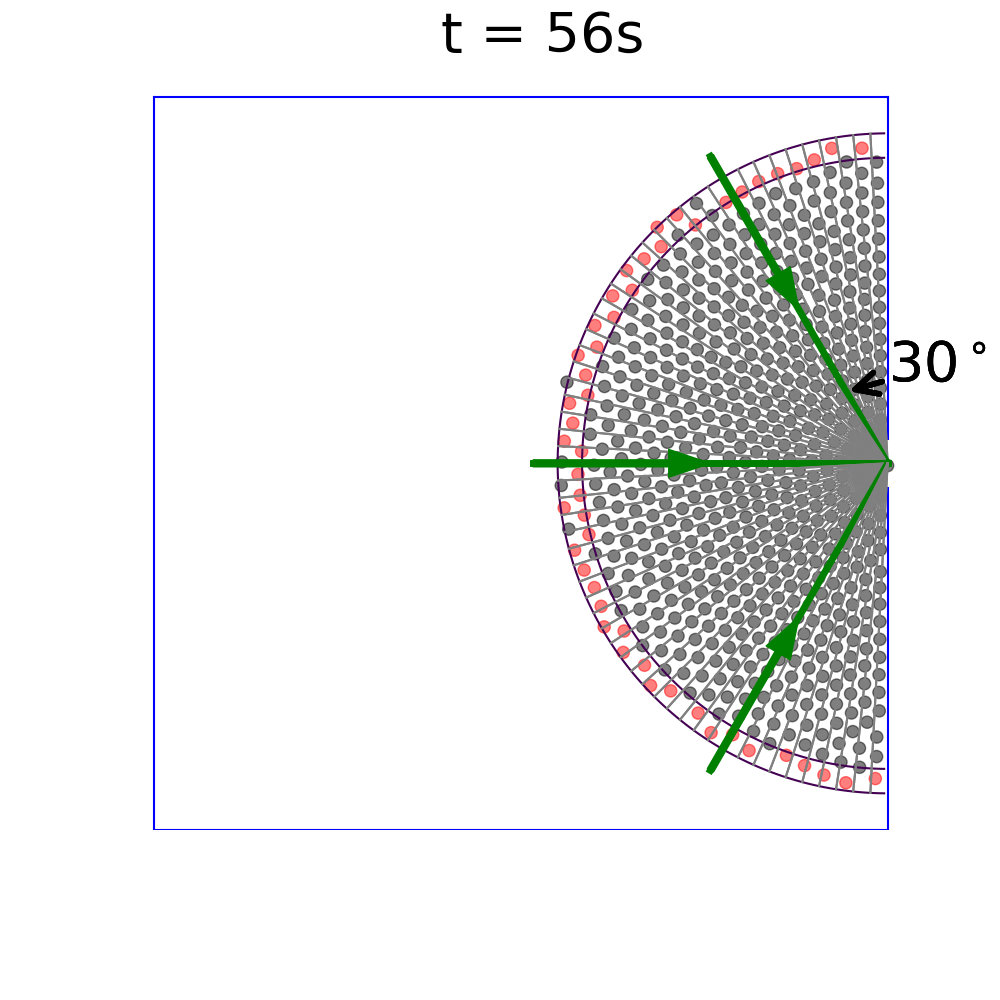
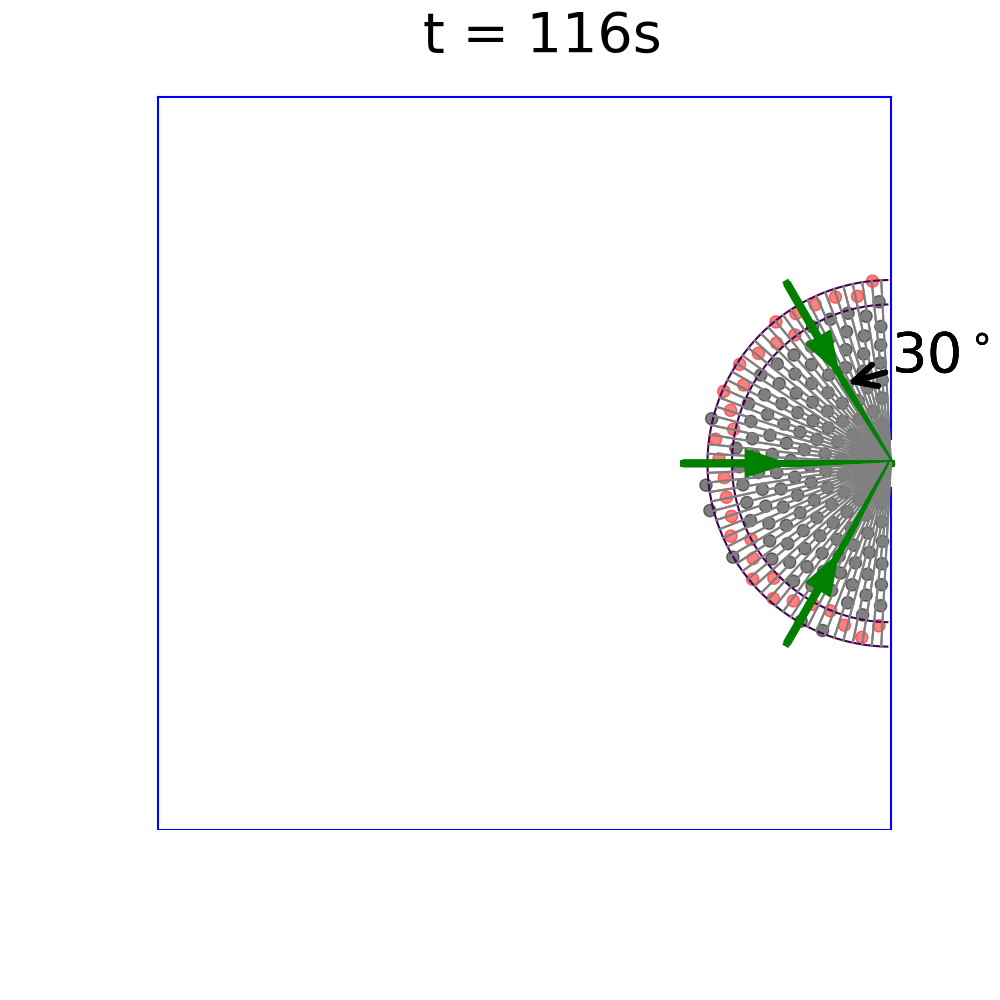
In this section we further explore the escape dynamics of the crowd by examining the motion of individual pedestrians. In particular we are interested in this question: Where are the relatively safer spots in the collective running of the pedestrians towards the exit? To address this question, we focus on a group of pedestrians within a narrow annulus around the exit, and track the escape time of these pedestrians. The selected pedestrians are indicated by red dots, as shown in Fig. 3. The distance between these pedestrians and the exit is approximately equal. In simulations, the annulus is created by drawing two adjacent circles centered at the door with the radii and , respectively. The annulus is then equally divided into a number of zones. The spanning angle of each zone is specified to ensure that each zone is occupied by pedestrians. We perform abundant independent simulations with random initial conditions.
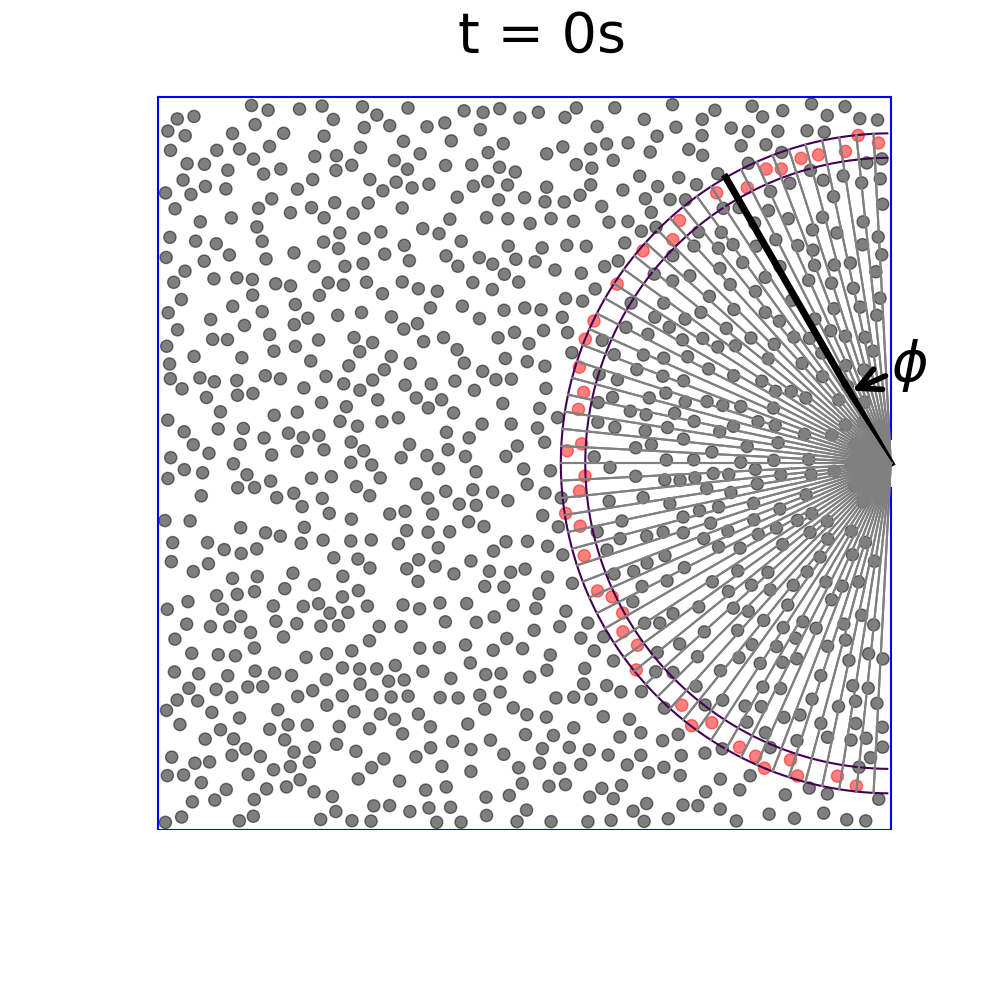
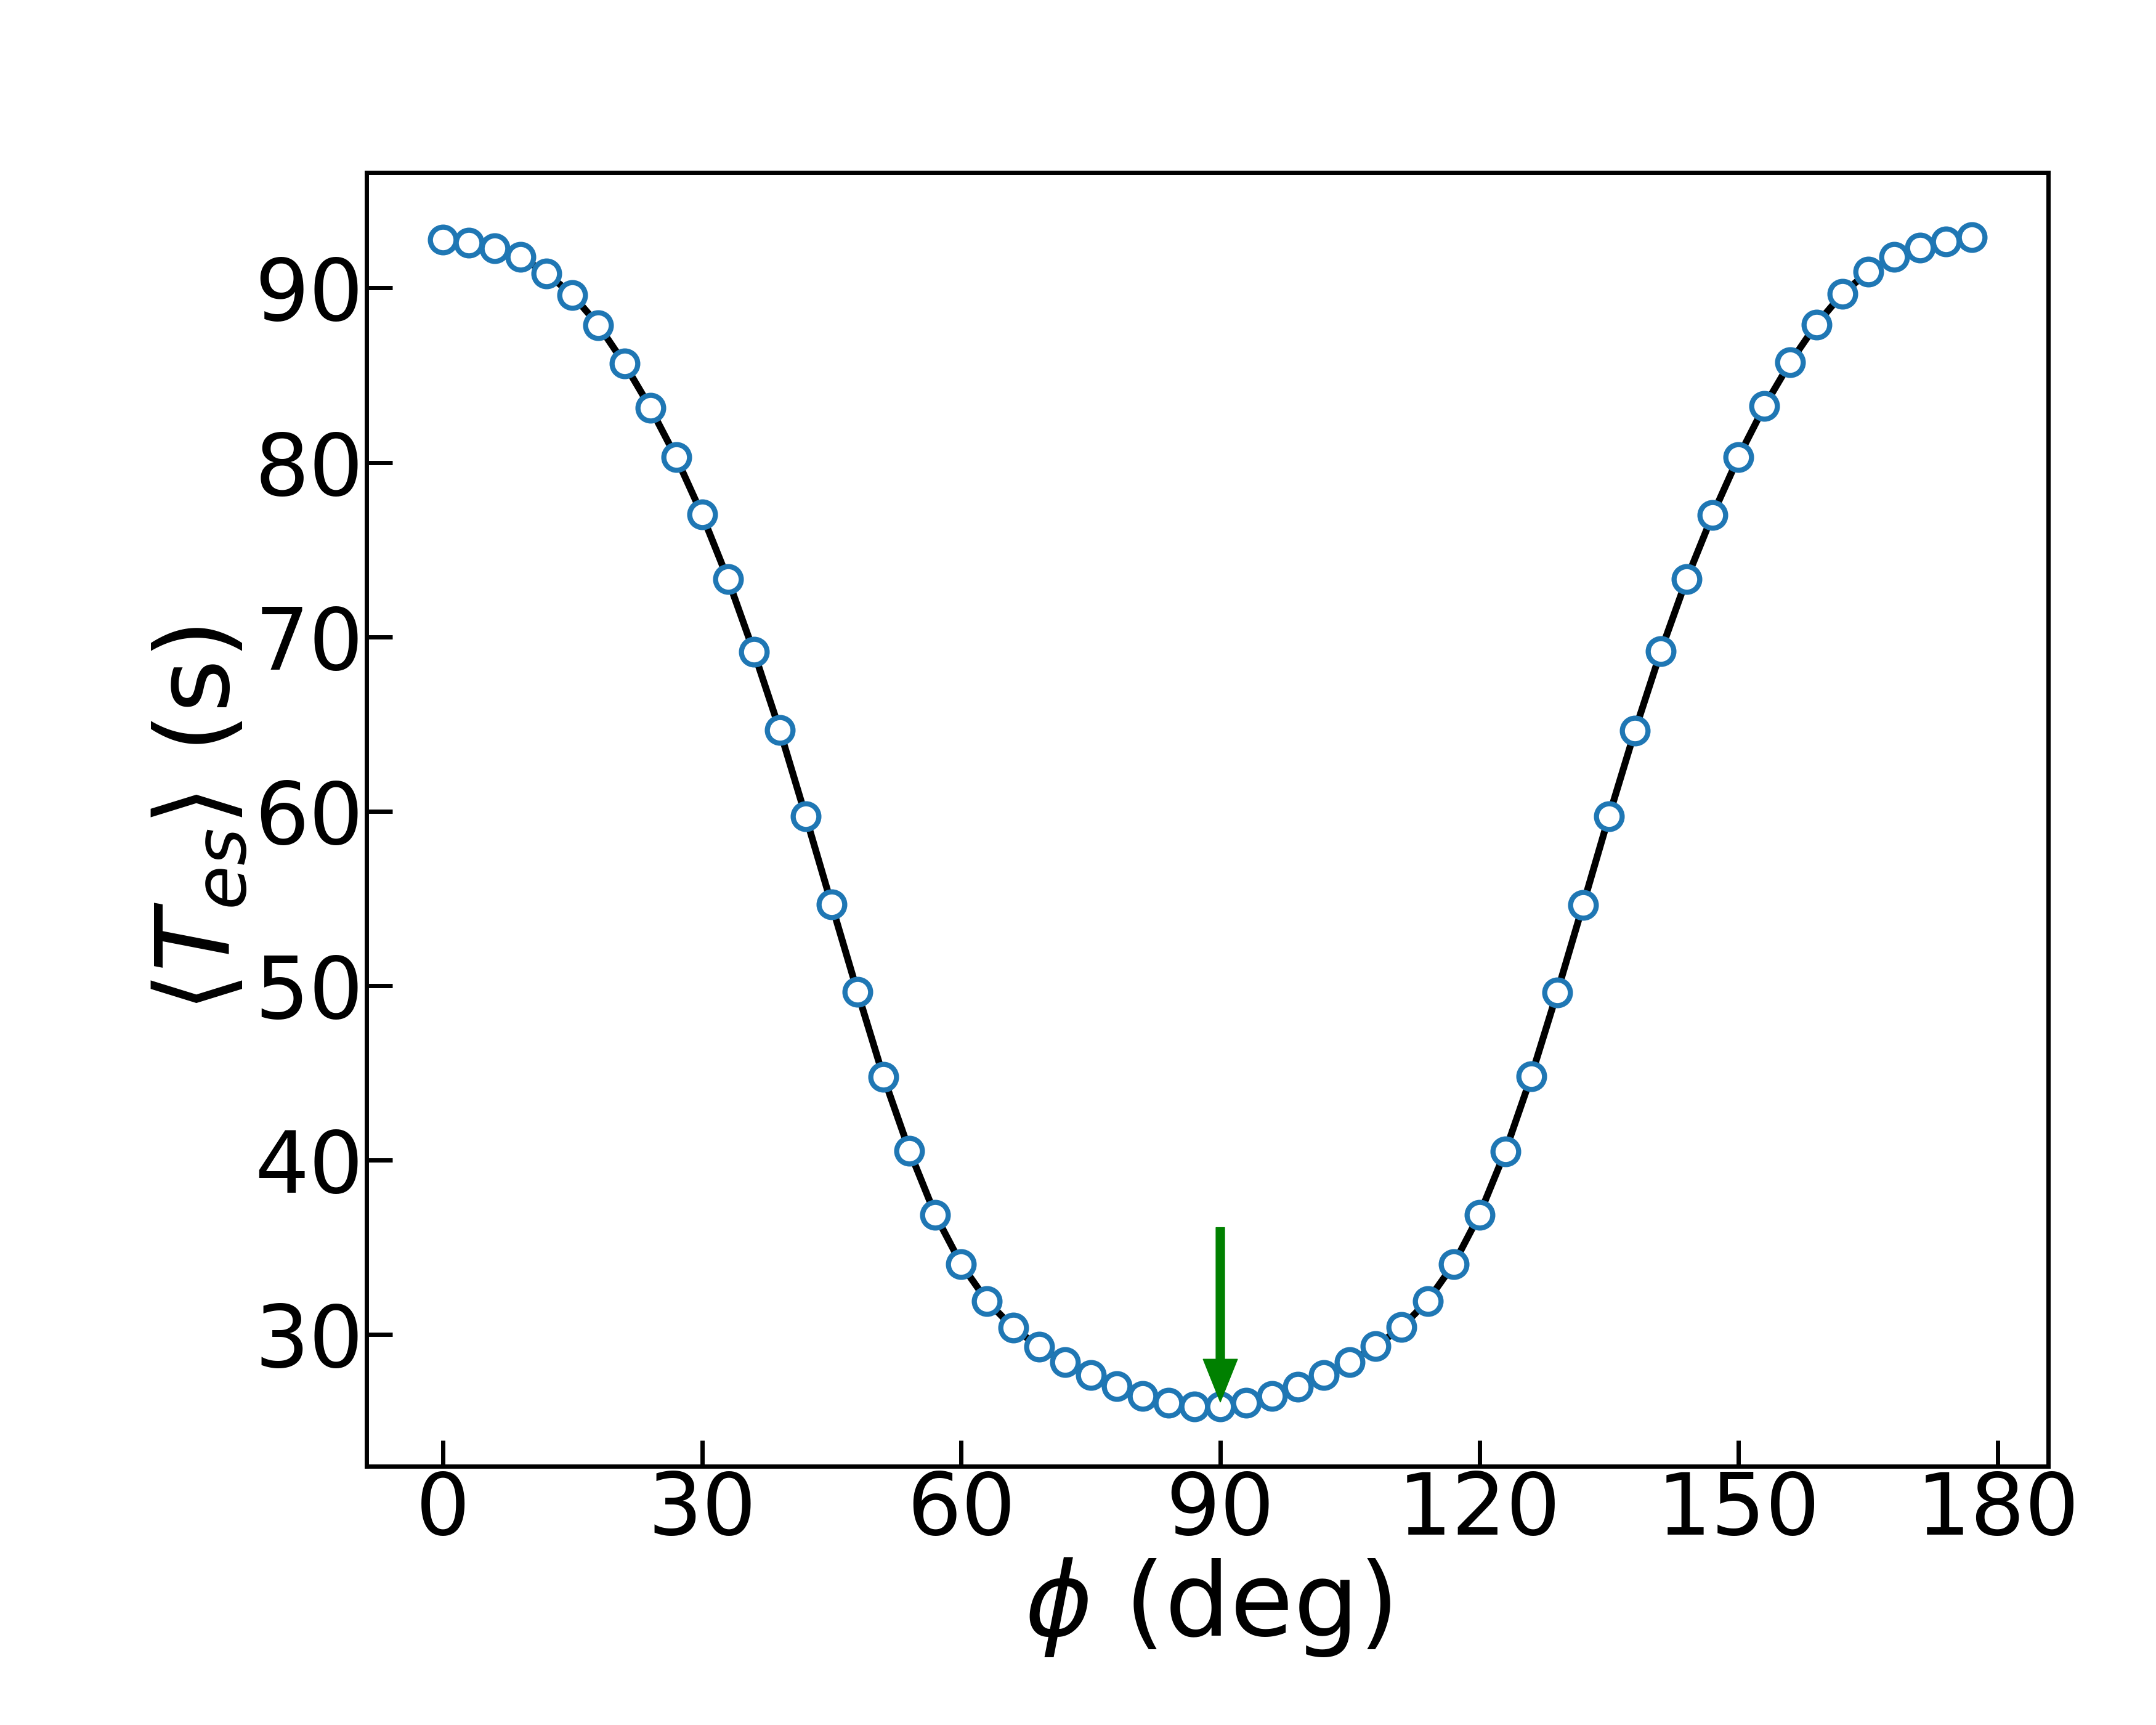
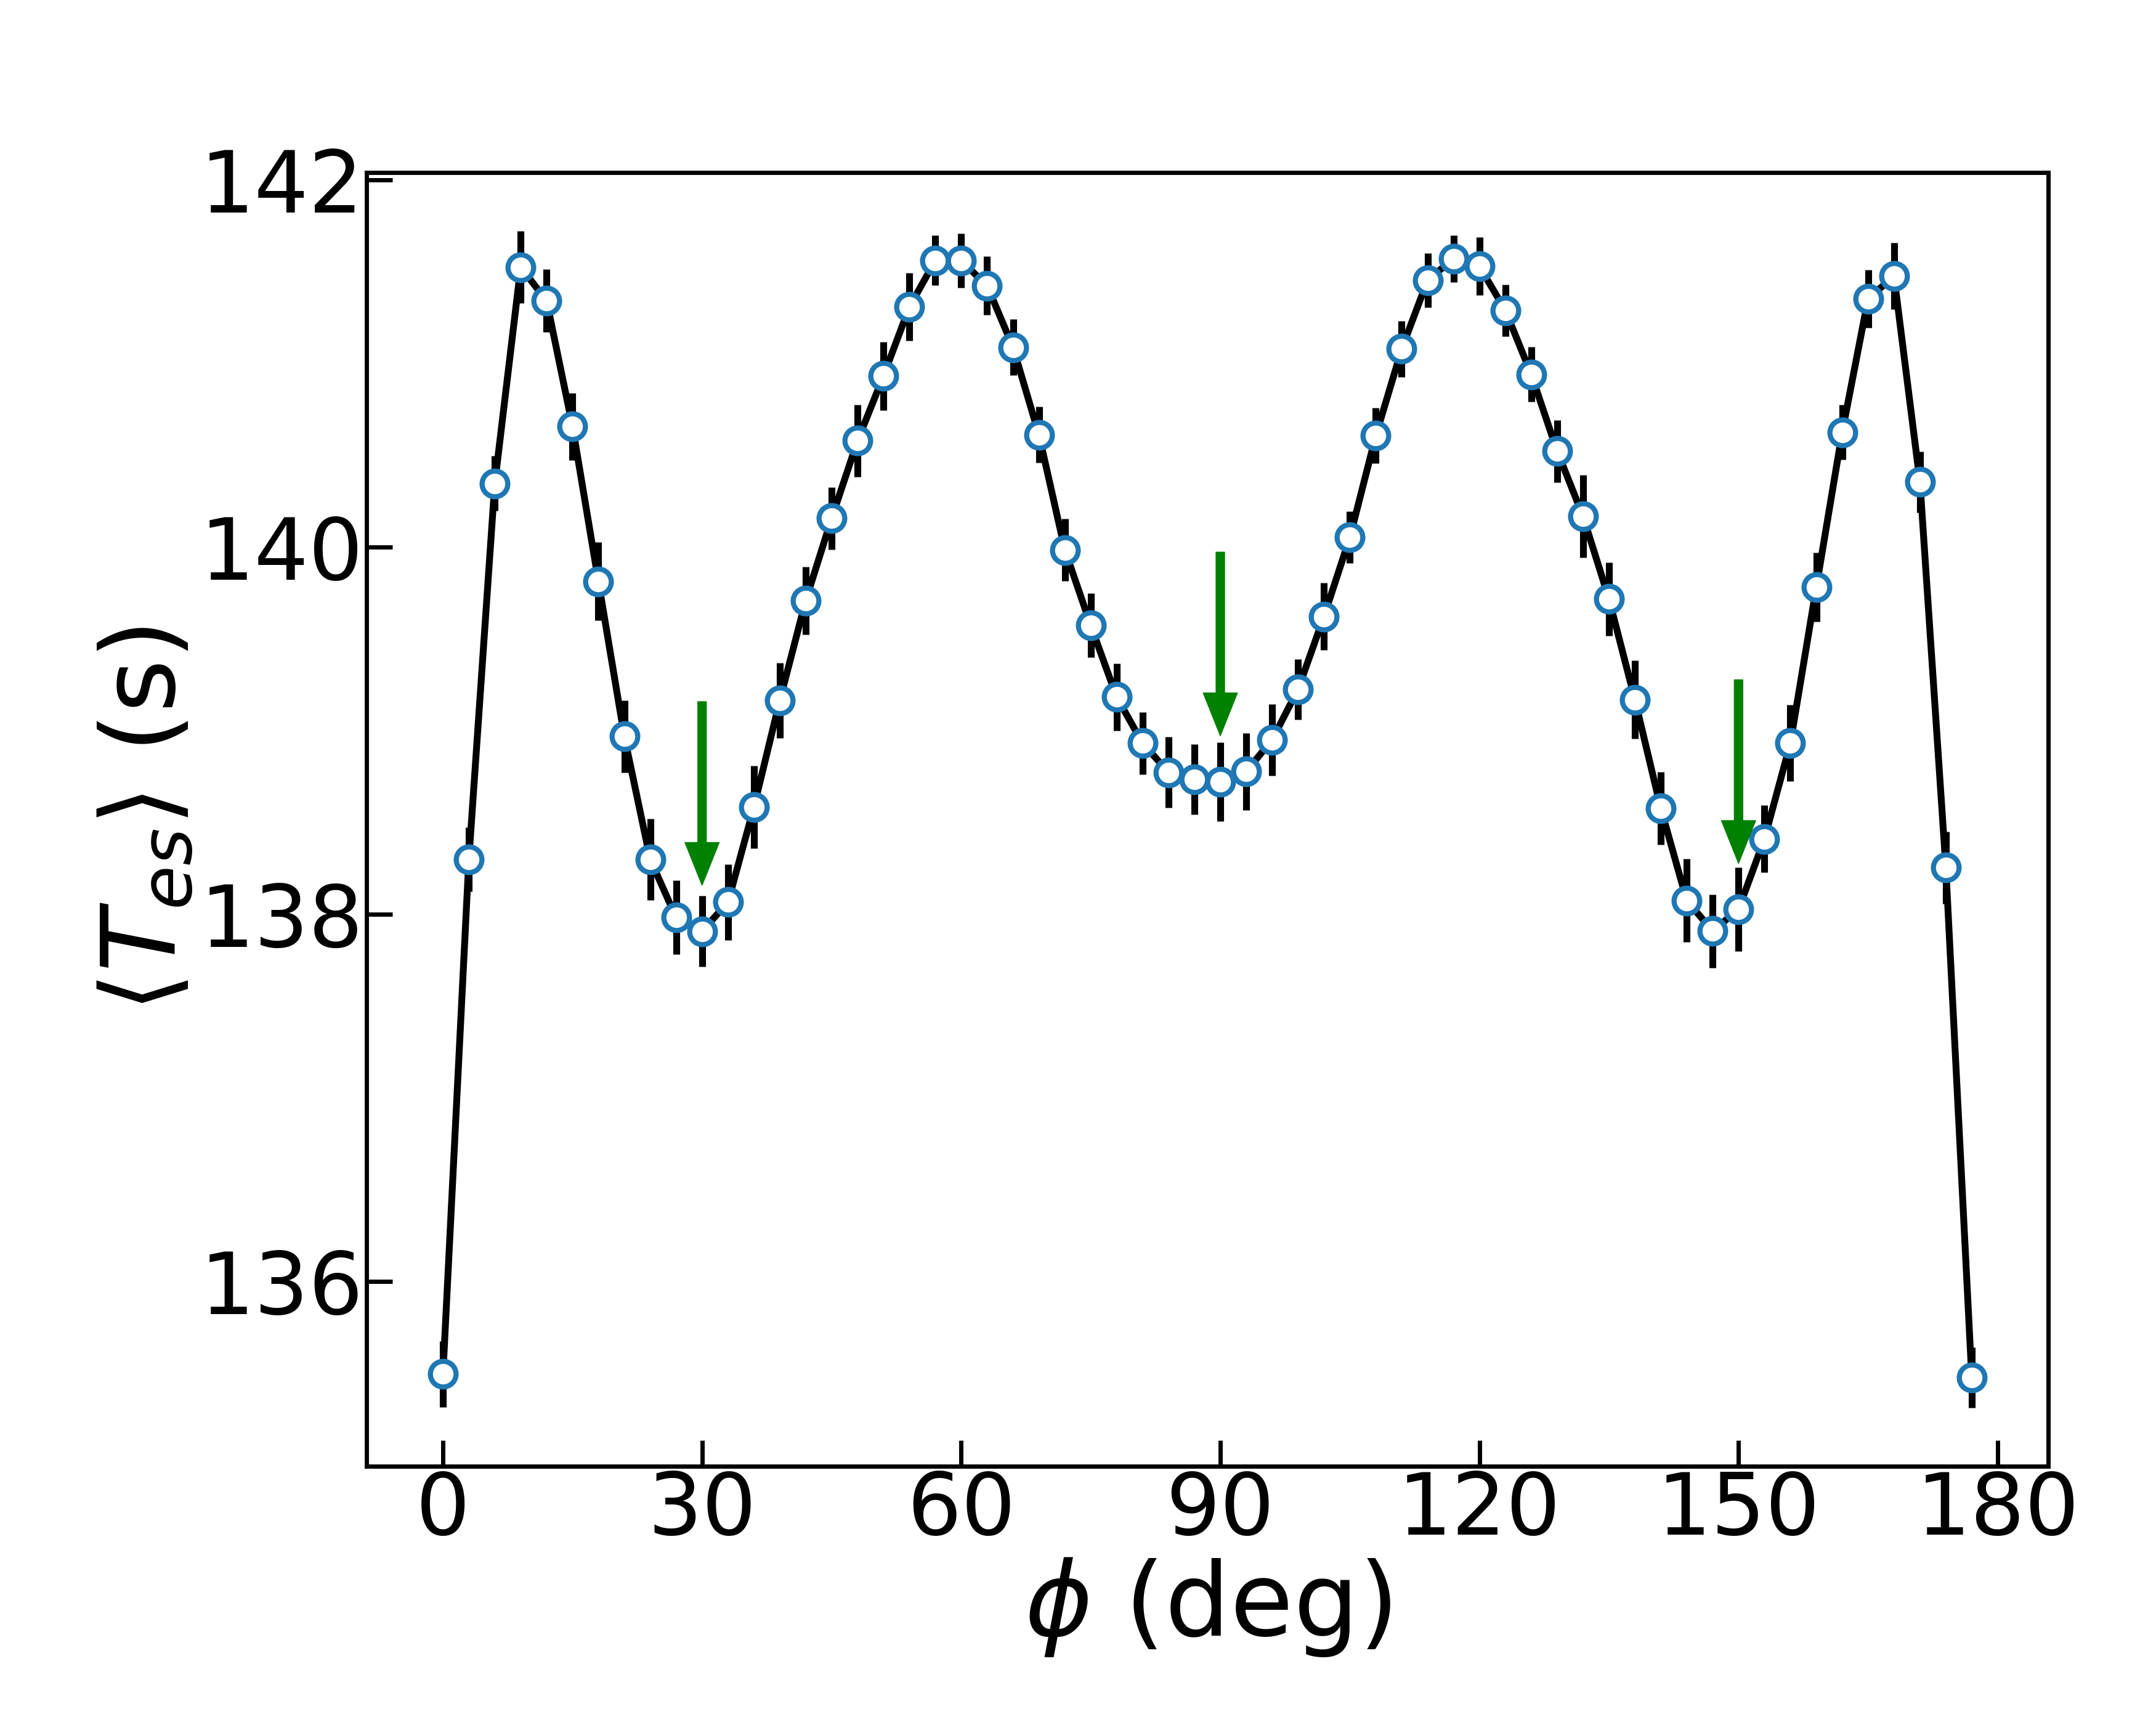
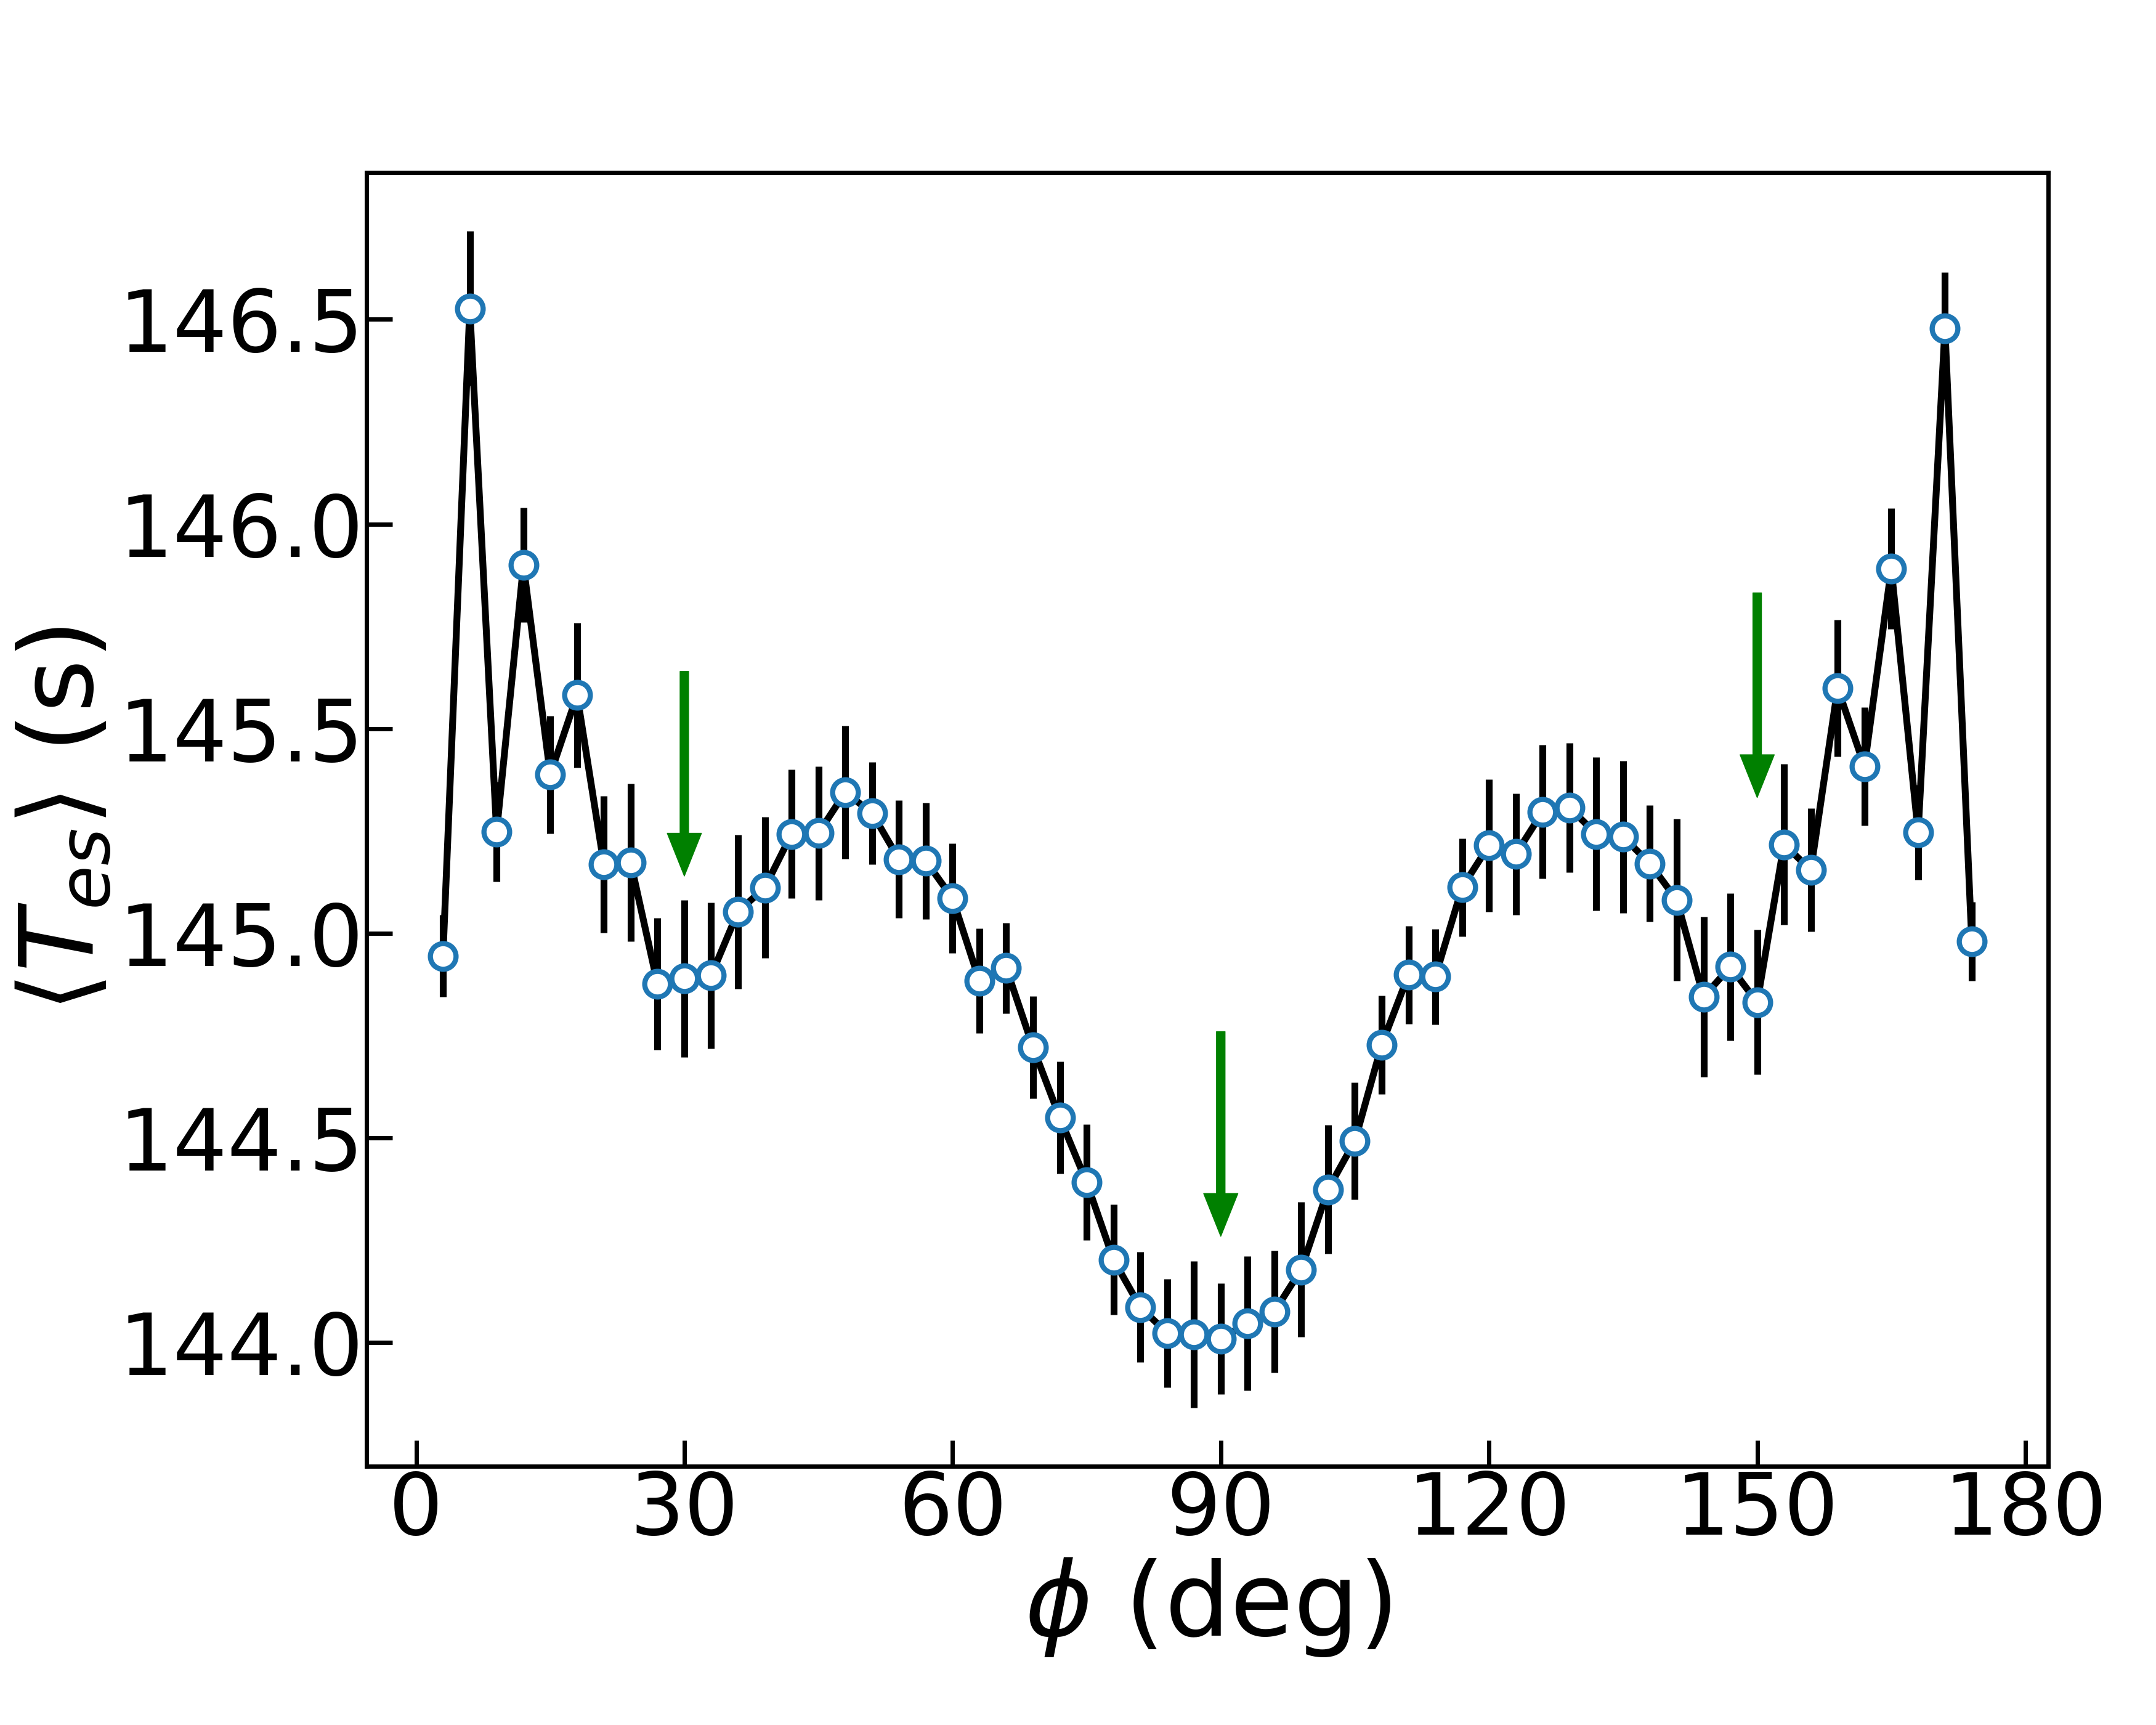
By statistical analysis of the escape time of these pedestrians, we identify the safe spots where pedestrians spend the least time to escape. The lower panel in Fig. 3 shows anisotropic feature in the escape of crowd. The average escape time strongly depends on the angle , which is defined in the upper panel in Fig. 3. Remarkably, reaches a deep minimum at . The average escape time of the pedestrians near is only about a fourth of those near the wall. Therefore, the pedestrians who are initially along the axis perpendicular to the door spend significantly less time to escape than those near the wall. Note that analysis of the empirical data of individual crowd escape events also shows the anisotropy feature in the distributions of escape time, density and velocity in typical room evacuations Garcimartín et al. (2017); Zuriguel et al. (2020).
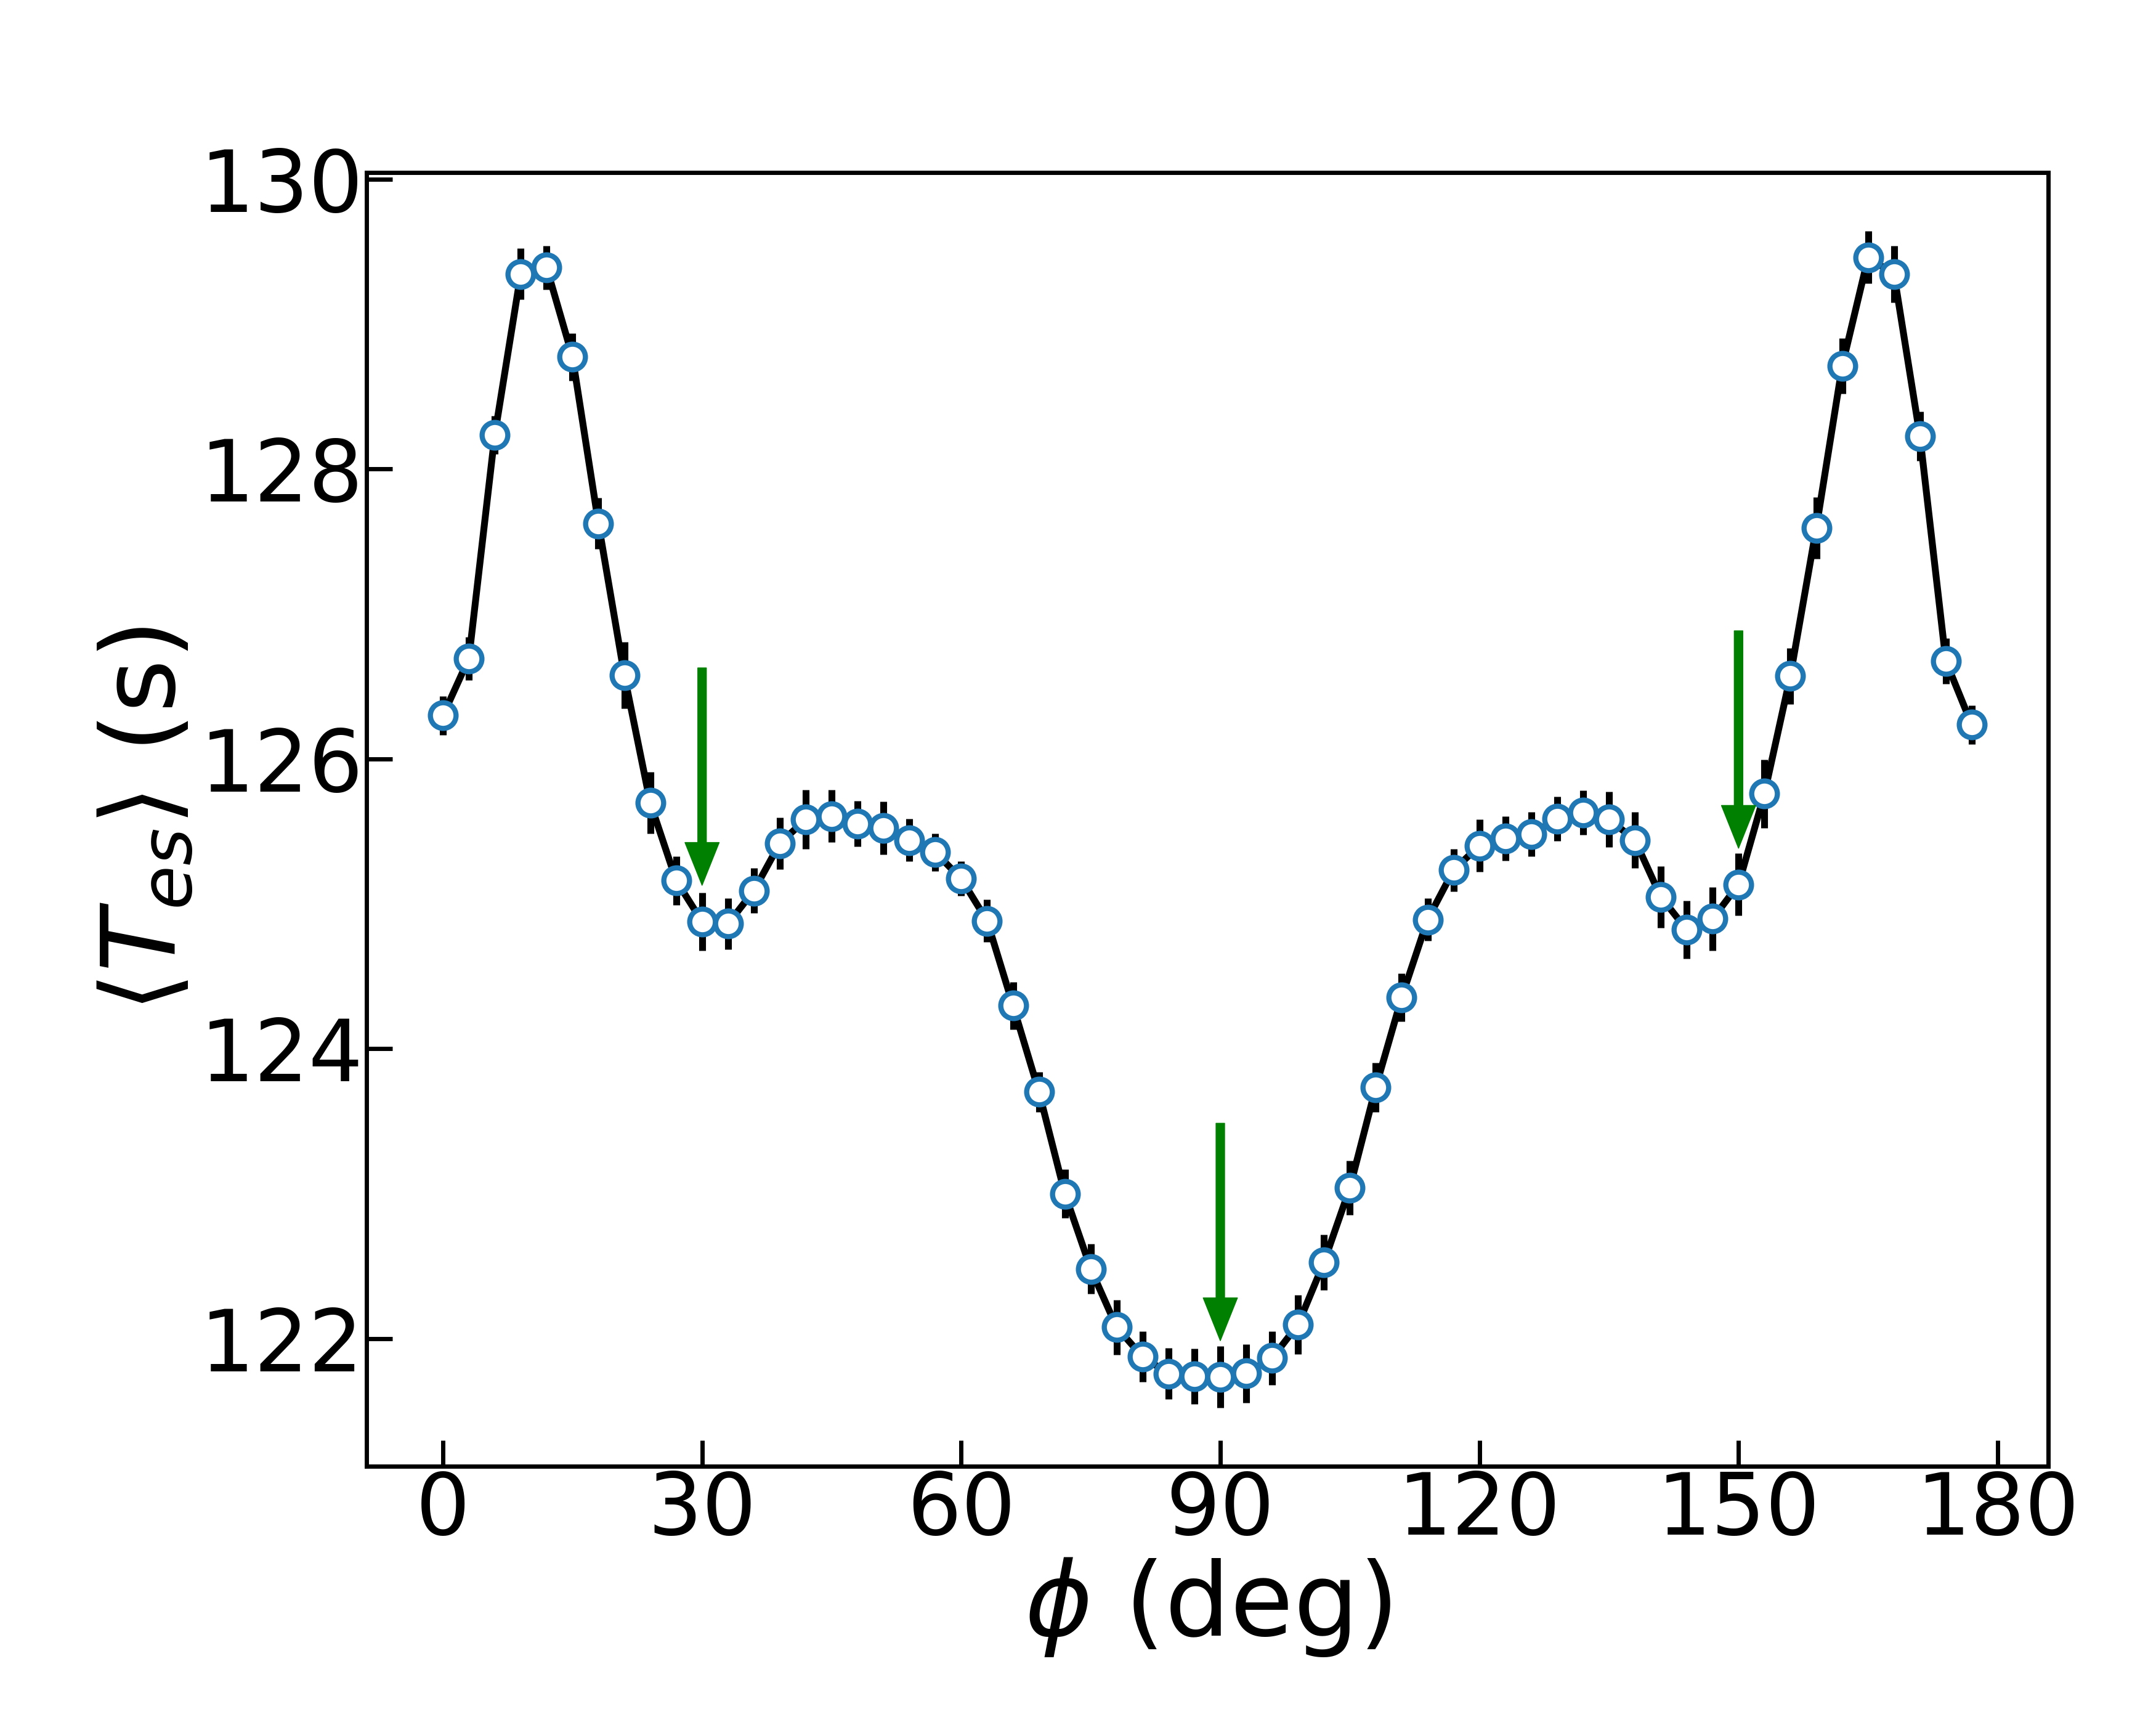
With the continuous outflow of the pedestrians, the crowd spontaneously form a compact circular configuration, as shown in Fig. 3- 3. Note that no clogging occurs at the exit in our system due to the relatively low desired speed (); clogging may occur at high speed () Helbing et al. (2000). The local minima developed on the - curves in Fig. 3 - 3 correspond to the relatively safe spots. Remarkably, with the outflow of the pedestrians, the trajectories of these safe spots constitute three straight lines along the specific angles of , and , as indicated by the green lines in the upper panels in Fig. 3. These lines are recognized as the fast tracks in the collective escape of the crowd.
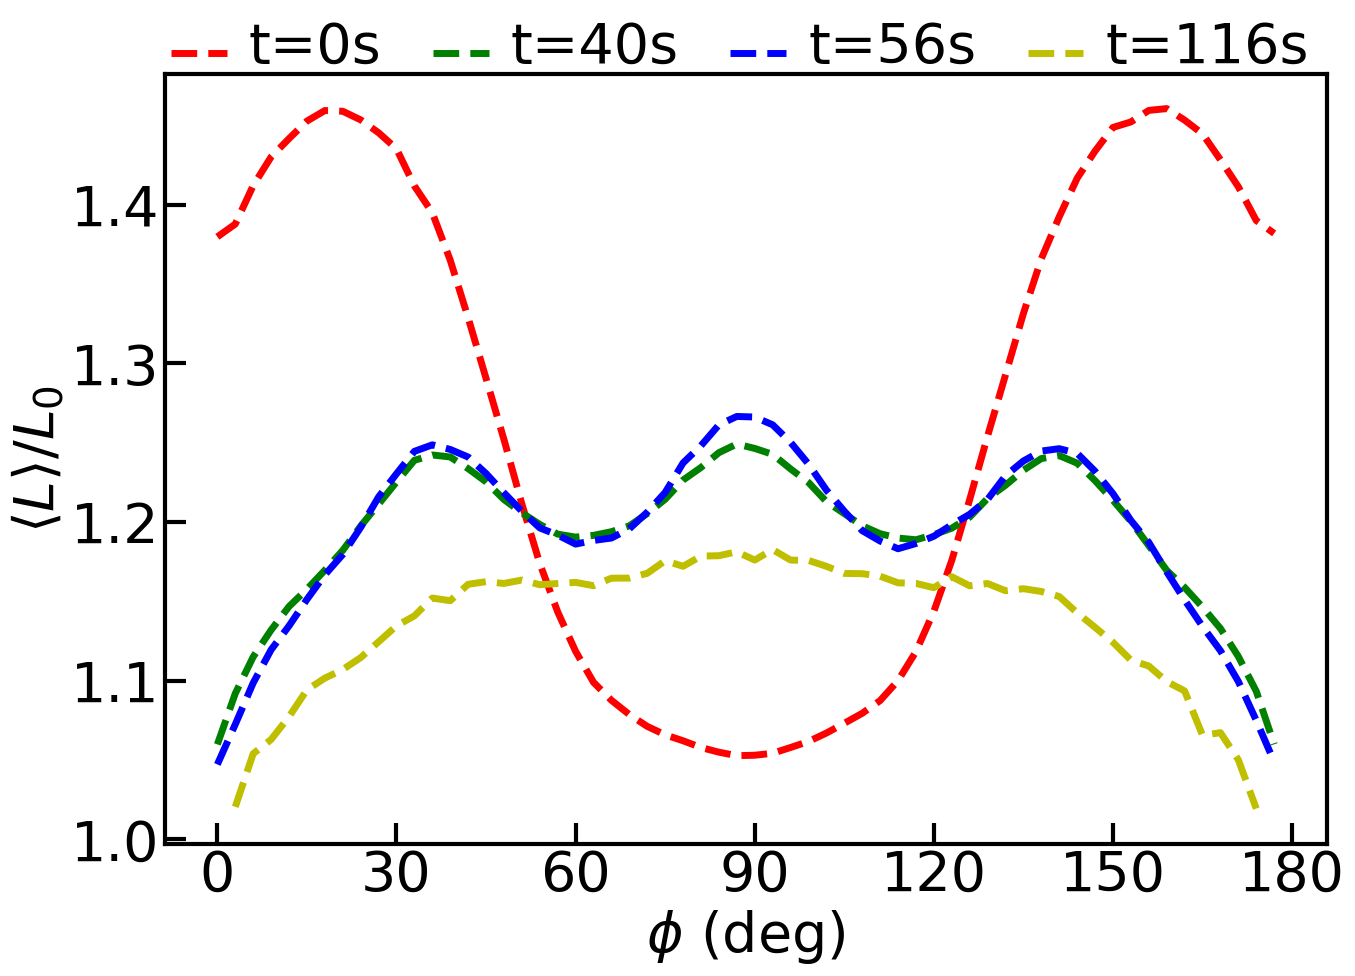
Here, it is natural to ask if the anisotropic feature of escape time originates from the -dependent trajectories of pedestrians. To check this point, we examine the dependence of on the angle . is the mean actual length of the trajectory over independent simulation runs, and is the length of the straight line connecting the initial and final positions of a pedestrian at a specific angle . The actual trajectories of the pedestrians at and are indicated by the green and red curves in Fig. 5. The plot of versus the angle is presented in Fig. 5. From the curves, which correspond to the four cases in Fig. 3, we see that the local minima do not match the angles of the fast tracks. As such, the emergence of the optimal angles could not be understood by the trajectory-based analysis. We are therefore led to examine the system from a new perspective.
III.3 The perspective of crystallisation and topological defects
The special angles of the fast tracks revealed in the preceding section provide an important clue. The appearance of these discrete fast tracks may be related to a global order developed in the compact packing of pedestrians.
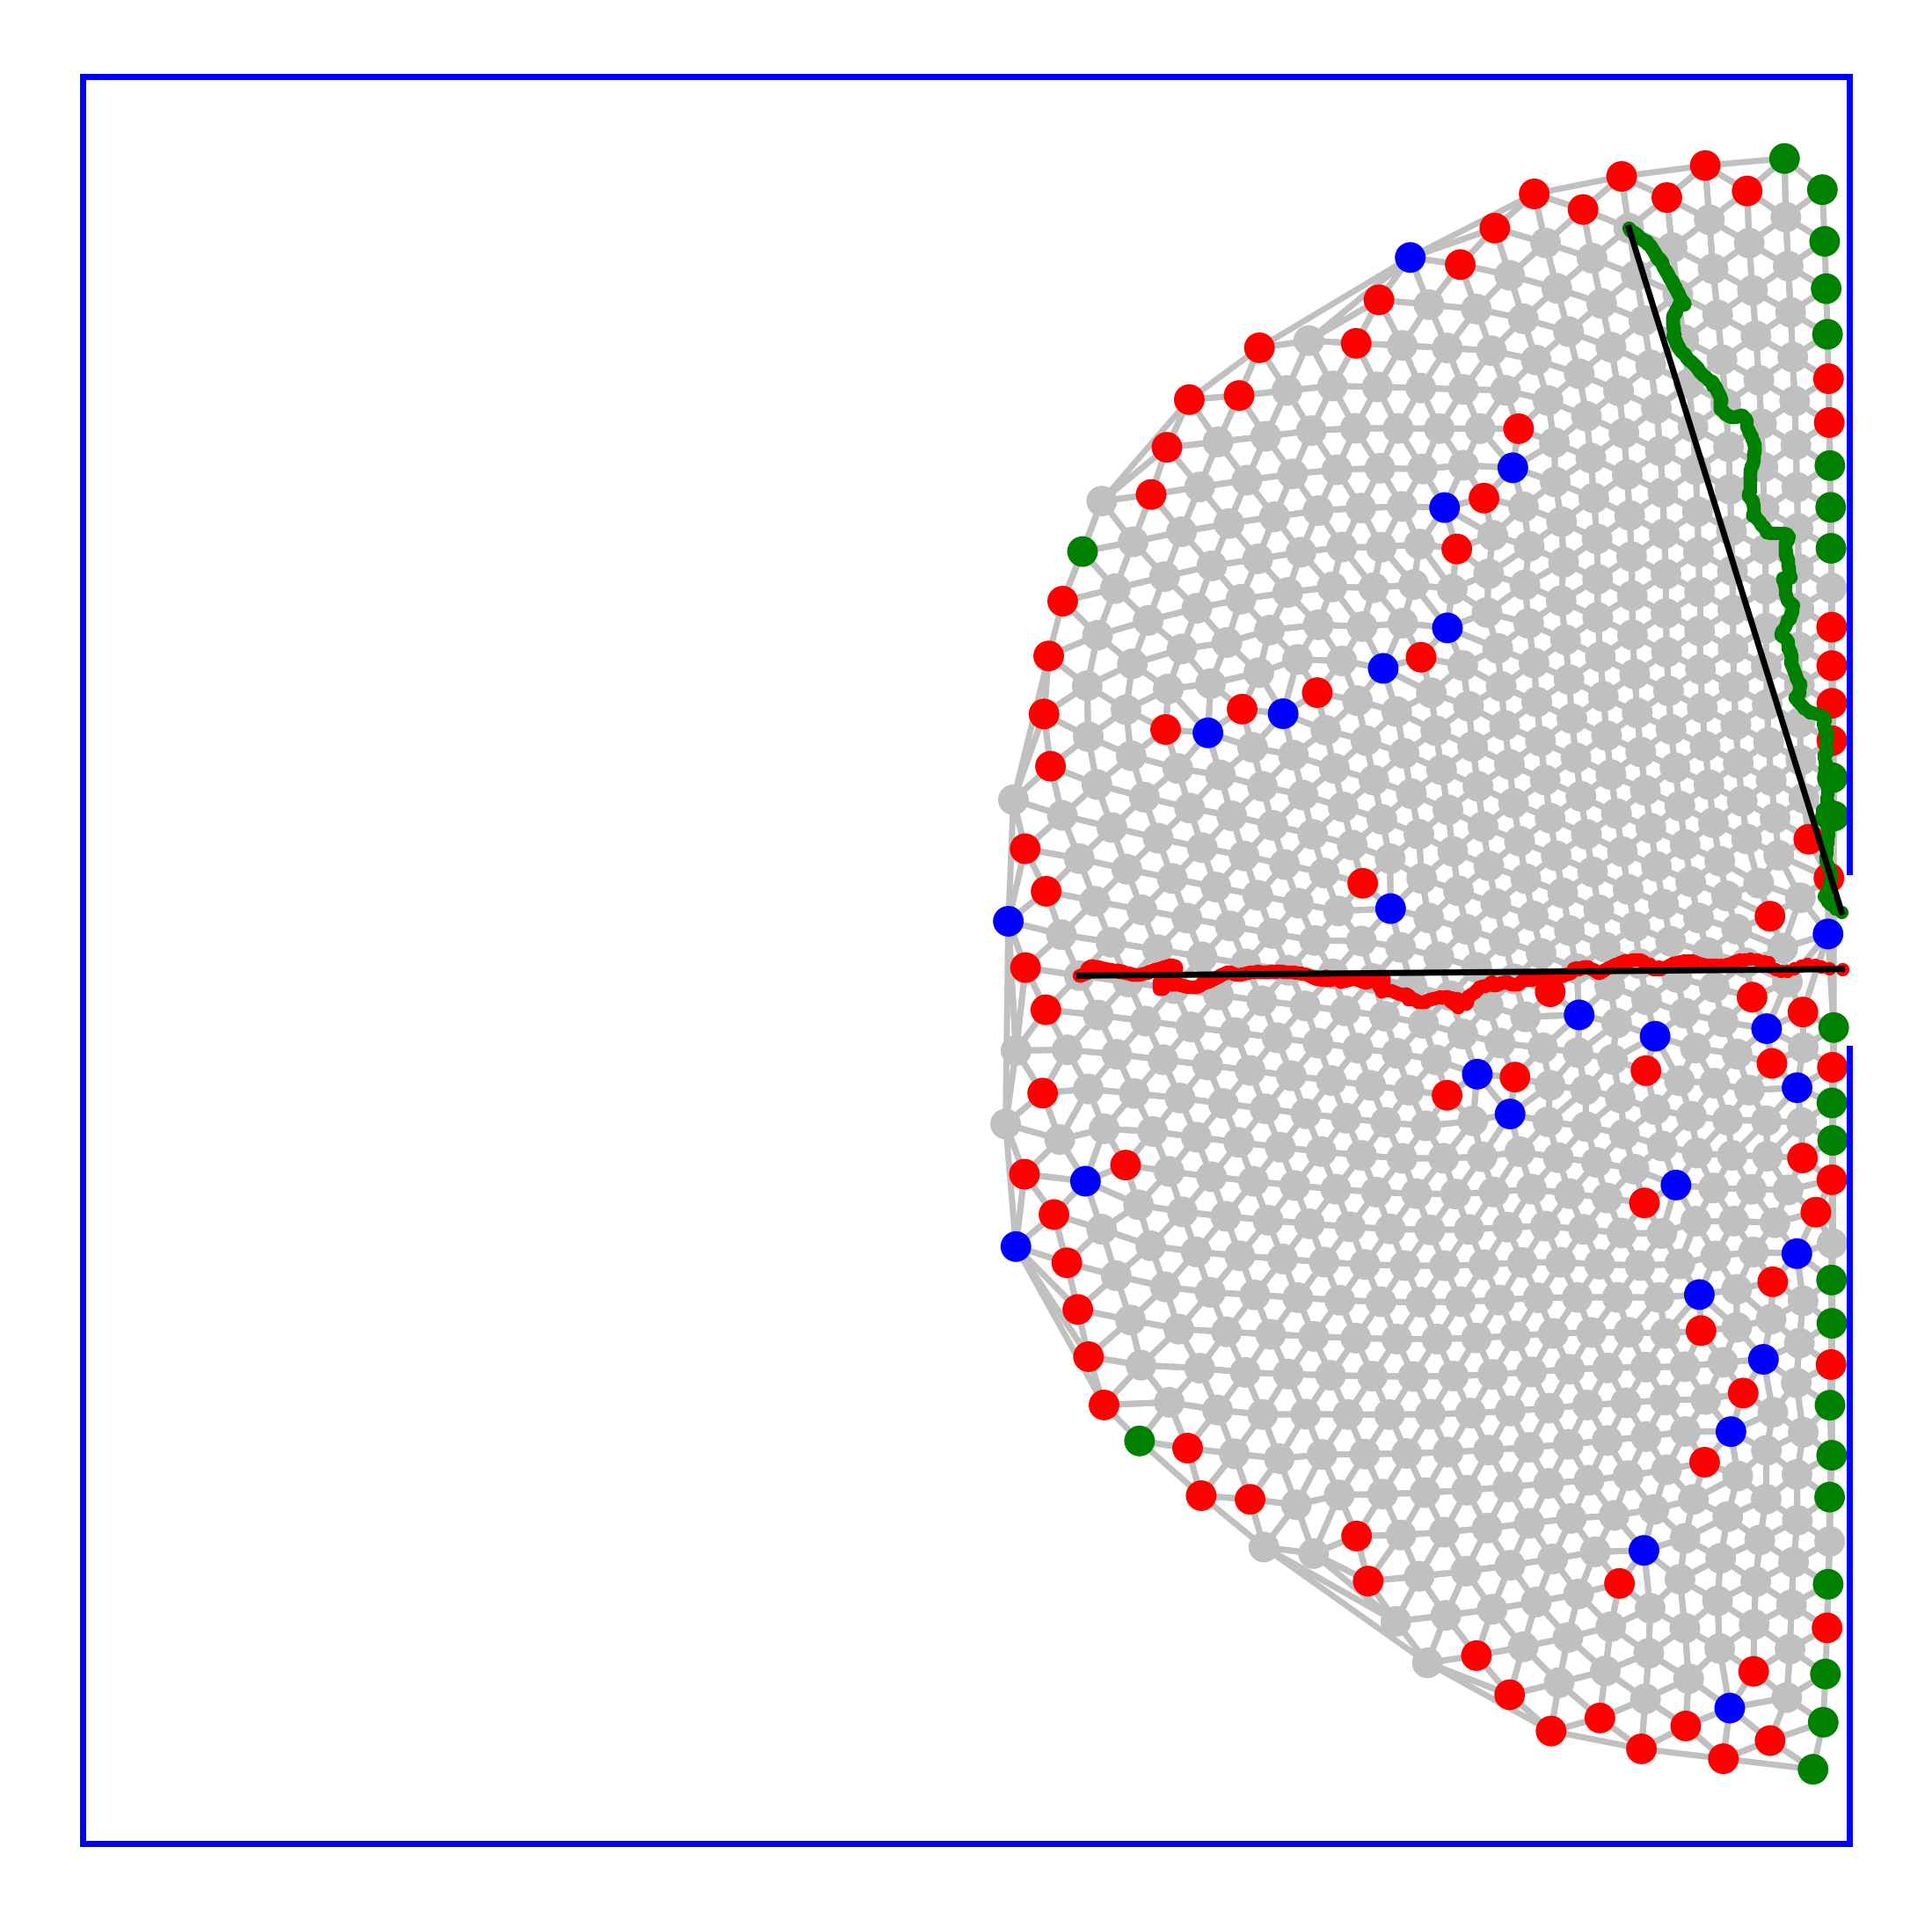
To reveal the positional order of the pedestrians, we treat each pedestrian as a point and perform Delaunay triangulation of instantaneous crowd configuration by establishing bonds between each pedestrian and the nearest neighbours Chaikin and Lubensky (2000); Nelson (2002). This technique has been widely used to quantitatively analyze crystalline structures Chaikin and Lubensky (2000); Nelson (2002). An example of Delaunay triangulation is shown in Fig. 5. We see the regular arrangement of pedestrians in the form of a 2D triangular lattice; each vertex represents a pedestrian. Such a triangular lattice is disturbed by defects as indicated by colored dots. Specifically, the red and blue dots represent pedestrians for whom the number of nearest neighbours (i.e., the coordination number) deviates from six. Note that in a perfect triangular lattice, the coordination number for each vertex is always six. These coloured dots therefore indicate the local disruption of the crystalline order. They are known as topological defects, since they cannot be eliminated by continuous deformation of the medium Chaikin and Lubensky (2000); Nelson (2002). A vertex with coordination number and are named five- and seven-fold disclinations, respectively. These disclinations are elementary topological defects in crystal lattice.
Interestingly, like electric charges, the disclinations carry topological charge that reflects their intrinsic property. Specifically, the topological charge of an -fold disclination is . Charge is positive if and negative if . According to elasticity theory, topological charges of the same sign repel and unlike signs attract, which is analogous to electric charges Chaikin and Lubensky (2000); Yao and Olvera de la Cruz (2014). The five-fold (red dots) and seven-fold (blue dots) disclinations tend to form pairs known as dislocations, as shown in Figs. 4-4.
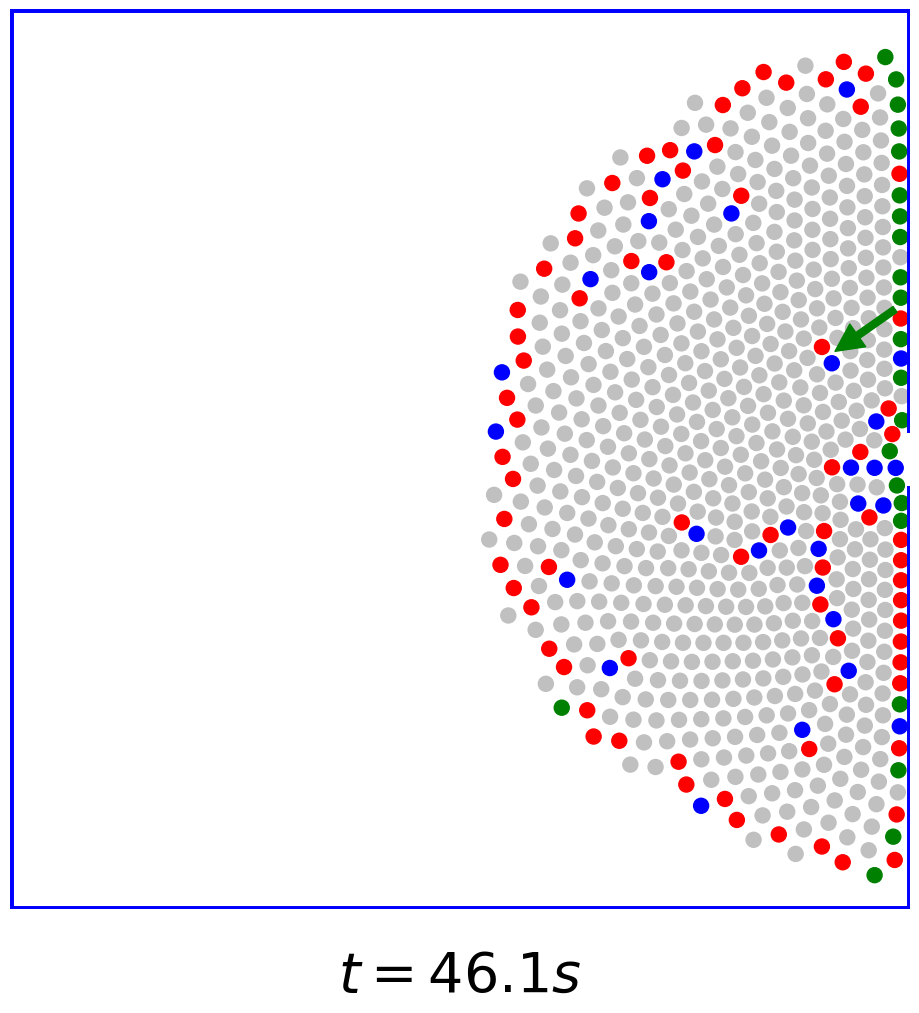
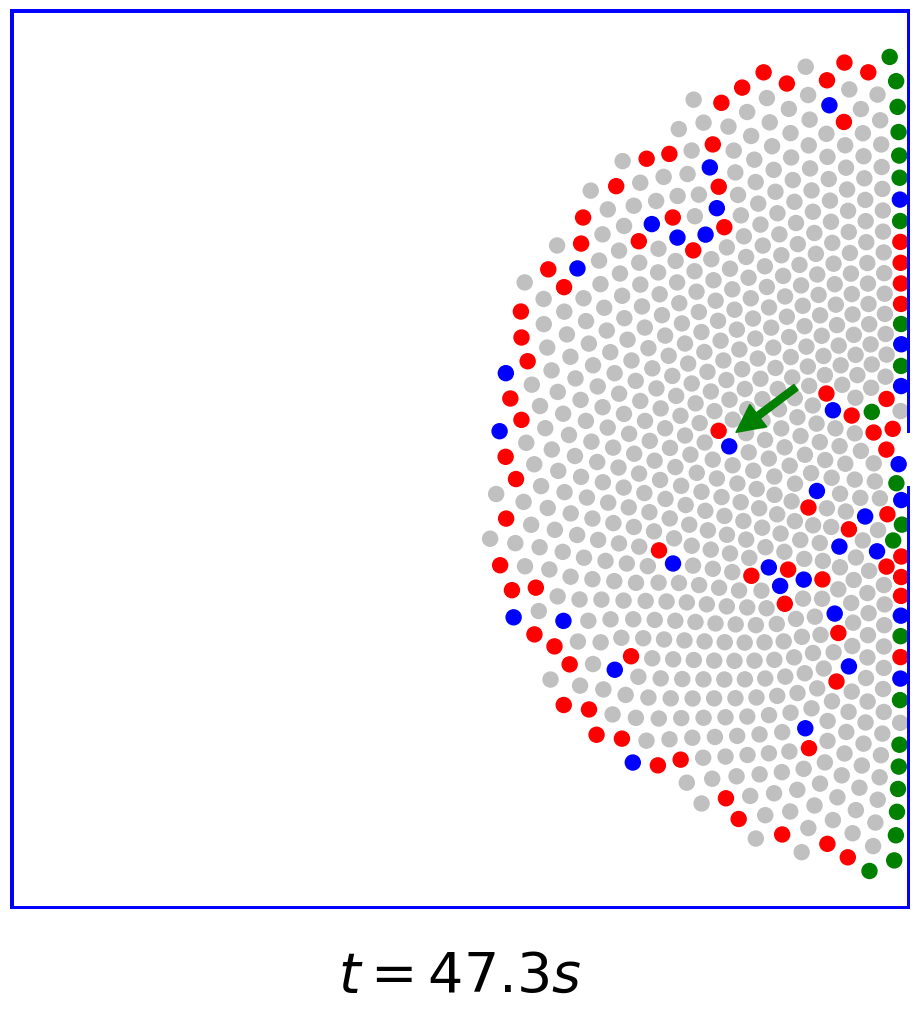
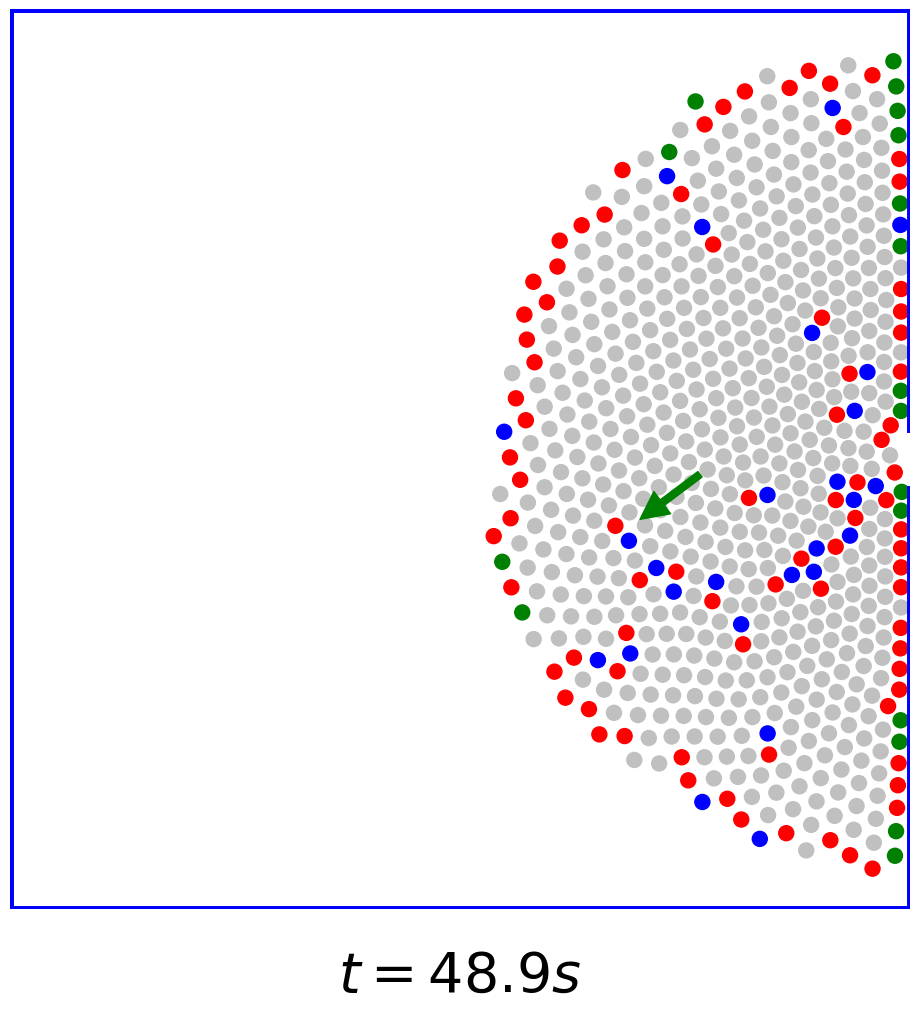
In connection with our system, the complicated process of achieving crystalline order in the compact crowd could be clarified by the concept of topological defects. With the outflow of pedestrians, the microscopic crystalline structure underlying the crowd is under persistent transformation. Simulations show that this dynamical process exactly corresponds to the characteristic annihilation and glide motion of topological defects in the crystal. Annihilation of positive and negative topological charges reduces the number of defects and leads to ordered arrangement of pedestrians. Furthermore, dislocations are abundantly generated near the exit with the outflow of pedestrians, and they tend to glide swiftly towards the boundary of the crowd. These two processes are crucial for achieving the crystallised state out of the initially highly disordered configuration Yao and Olvera de la Cruz (2014); Yao (2016). In Figs. 4 - 4, we show that the dislocation as indicated by the green arrow swiftly glides along the direction that is perpendicular to the line connecting the five- and seven-fold disclinations Chaikin and Lubensky (2000). In this typical scenario of glide motion, it takes about 2.7 seconds for the dislocation to move from the position at Fig. 4 to that at Fig. 4. In contrast, it takes about 8.4 seconds for a pedestrian of typical speed of to cover the same distance.
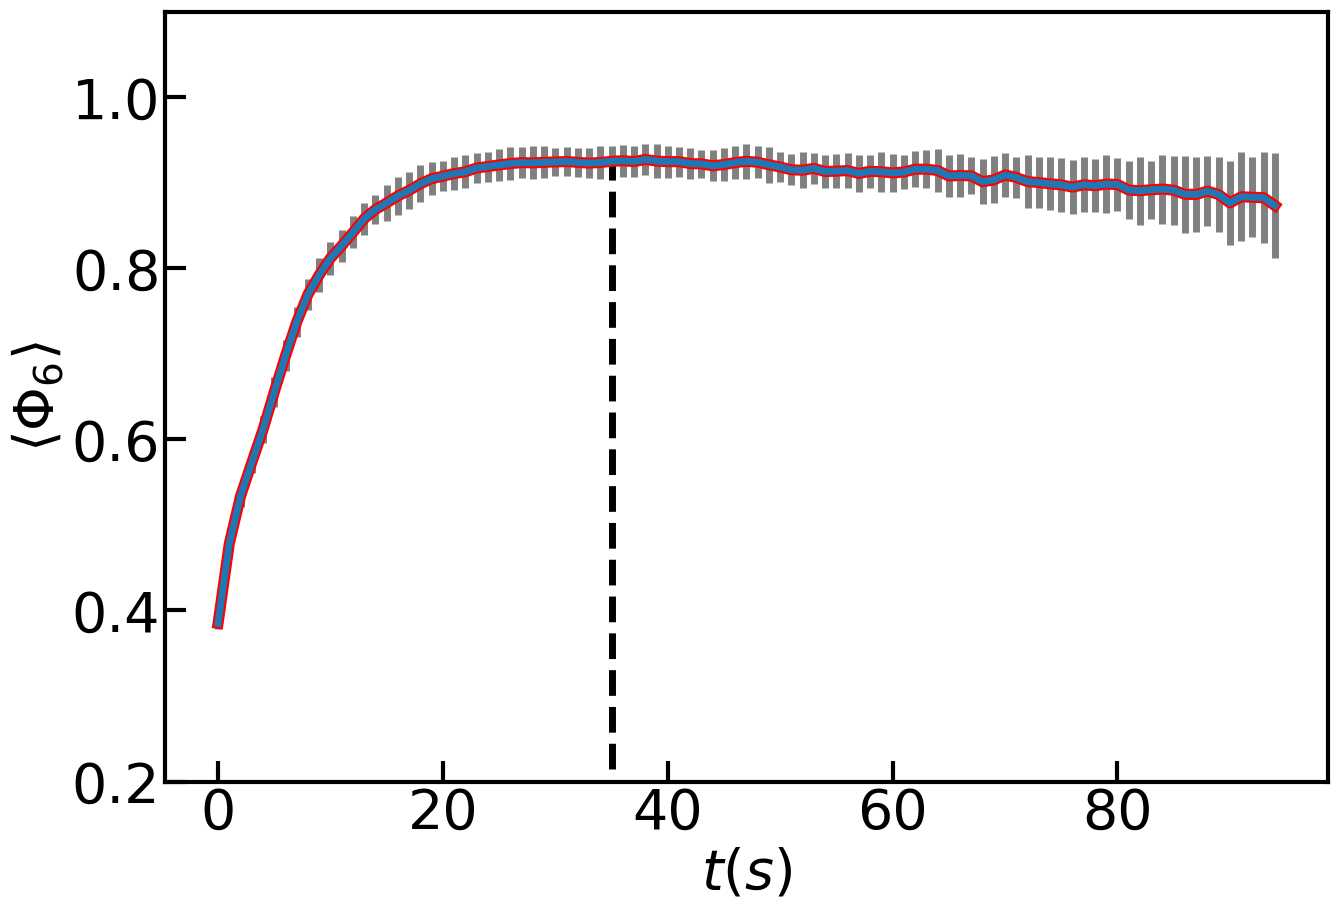
The crystallisation process could be characterized by the six-fold bond-orientational order parameter Nelson (2002)
| (6) |
where is the coordination number of the particle , is the angle between the line connecting the particles and and some chosen reference line, and is the total number of particles. Note that, to characterize the interior crystalline order, a few layers of particles near the boundary and the exit are excluded in the calculation for the order parameter. The temporal variation of is presented in Fig. 4; the error bars are obtained by statistical analysis of 100 independent simulations. The vertical dashed line indicates the time when the three fast tracks appear. This observation indicates the strong connection of the emergence of the three fast tracks and the full development of the crystalline order.
In the crystallised configuration of pedestrians, the principal axes of crystal are invariant regardless of the microscopic motions of topological defects. In fact, the transformation of the global crystalline structure which could modify the orientations of the principal crystallographic axes, requires the appearance of isolated disclinations; this is a highly energetically costly process Yao and Olvera de la Cruz (2014). In simulations, we observe that the orientations of the fast tracks are always along the three specific directions in the entire evacuation process. The central fast track that is perpendicular to the wall emerges even before the crystalline order is developed, as shown in Fig. 3. And in general it does not correspond to the principal axes of the crystal. The other two fast tracks make an angle of with respect to the central one; this specific angle is a signature of the triangular lattice. The stability of the global crystalline order well explains the invariance of the orientations of the fast tracks. To conclude, the formation of the fast tracks in the collective escape of human crowds has strong connection with the global crystalline order developed in the configuration of pedestrians.
III.4 Effects of uncertainty in human behaviours
As mentioned earlier, the motion of pedestrians is unambiguously determined by the physical and socio-psychological forces. However, the behaviours of pedestrians in a crowded environment could exhibit some degree of uncertainty as affected by fluctuating psychological state and rapidly varying local environment. We model the uncertainties in human behaviour by incorporating a random force into the model. Here, we emphasize that adding a noise term to the original deterministic SFM also provides an opportunity to test the robustness of the model. The generalized social force model is
| (7) |
in which the noise term is given by
| (8) |
The white noise follows a two-dimensional Gaussian distribution . This approach takes into account the flexible usage of space by pedestrians, which is essential to reproduce the empirical observations in a natural and robust way Helbing et al. (2005). The prefactor in eqn (8) reflects the relative strength of the noise force in comparison with the personal desire force. Note that eqn (7) represents a particular active Brownian dynamics Schweitzer and Farmer (2007). The active force originates from the tendency for each pedestrian to move towards the exit, and the noise term is for modelling the uncertainties in human behaviour. While the values of the parameters in the model are specified according to Ref.12 by comparison with experiments, the variation of these parameters implies the richness in the collective dynamics of the active agents. The investigation of eqn (7) as a model of active Brownian dynamics in the parameter space is beyond the scope of this work.
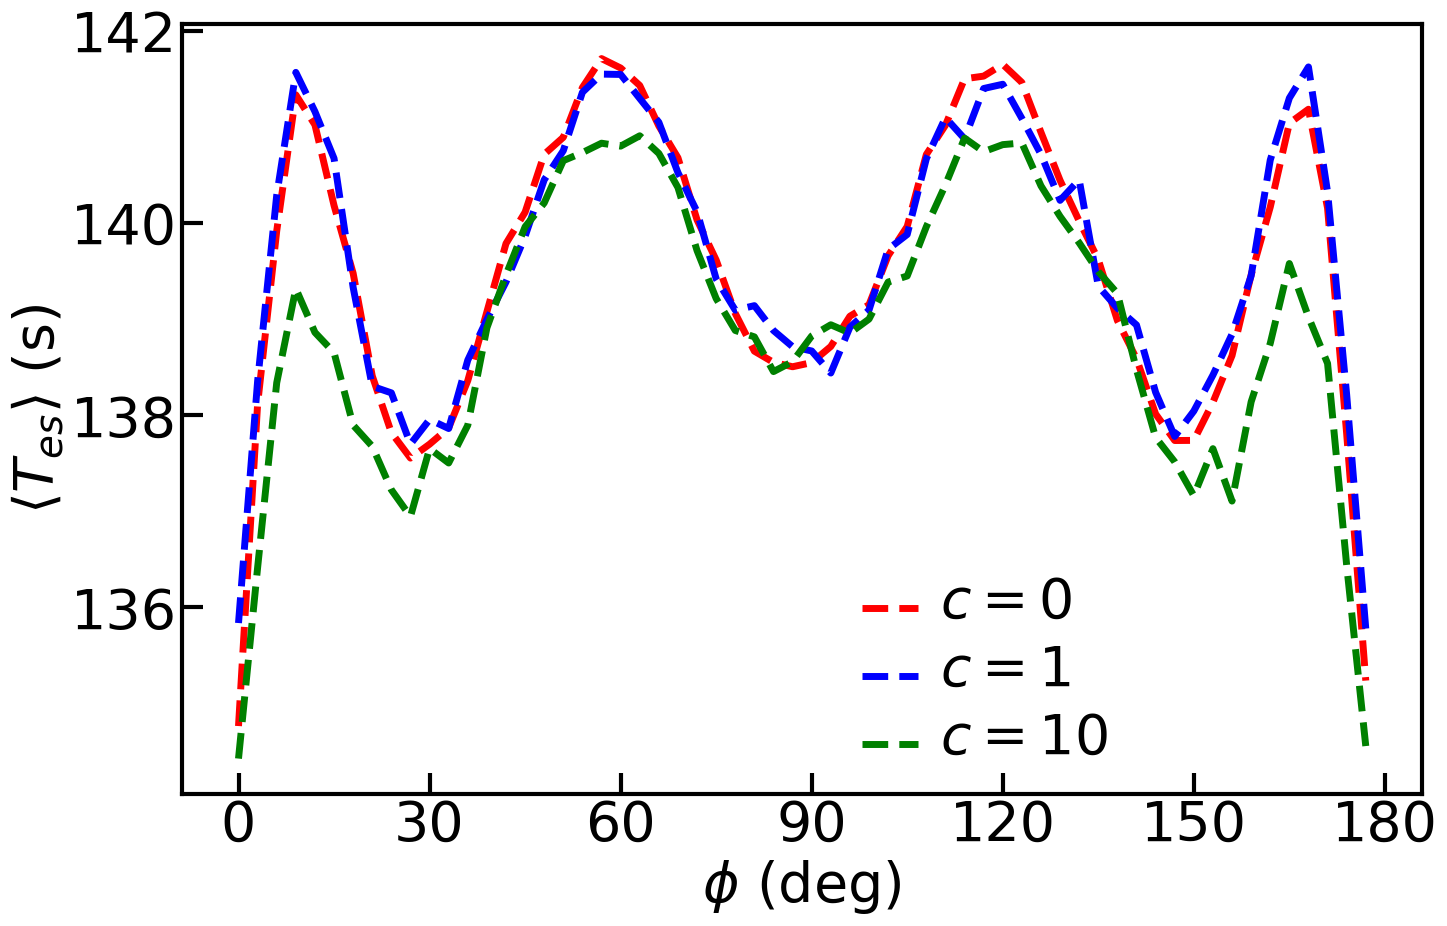
To systematically investigate the effect of the random behaviour of pedestrians, we vary the strength of the noise by tuning the value of in eqn.(8). Crystallisation phenomenon is observed uniformly as the value of is increased from 0.1 up to 100. The plot of versus under varying is presented in Fig. 6. For reference, the noise-free case of is also plotted. Figure 6 shows that adding a modest noise force does not qualitatively alter the behaviours of the system, suggesting the robustness of the model. When the value of is as large as 100, the crowd exhibits global migration which obscures the concept of fast tracks. We also notice that the collision of the crowd with the wall leads to a density wave propagating through the entire system. See Supplemental Materials for the videos of the simulated crowd dynamics at , , and using the parameters in Table 1.
III.5 Dilemma of escape strategy
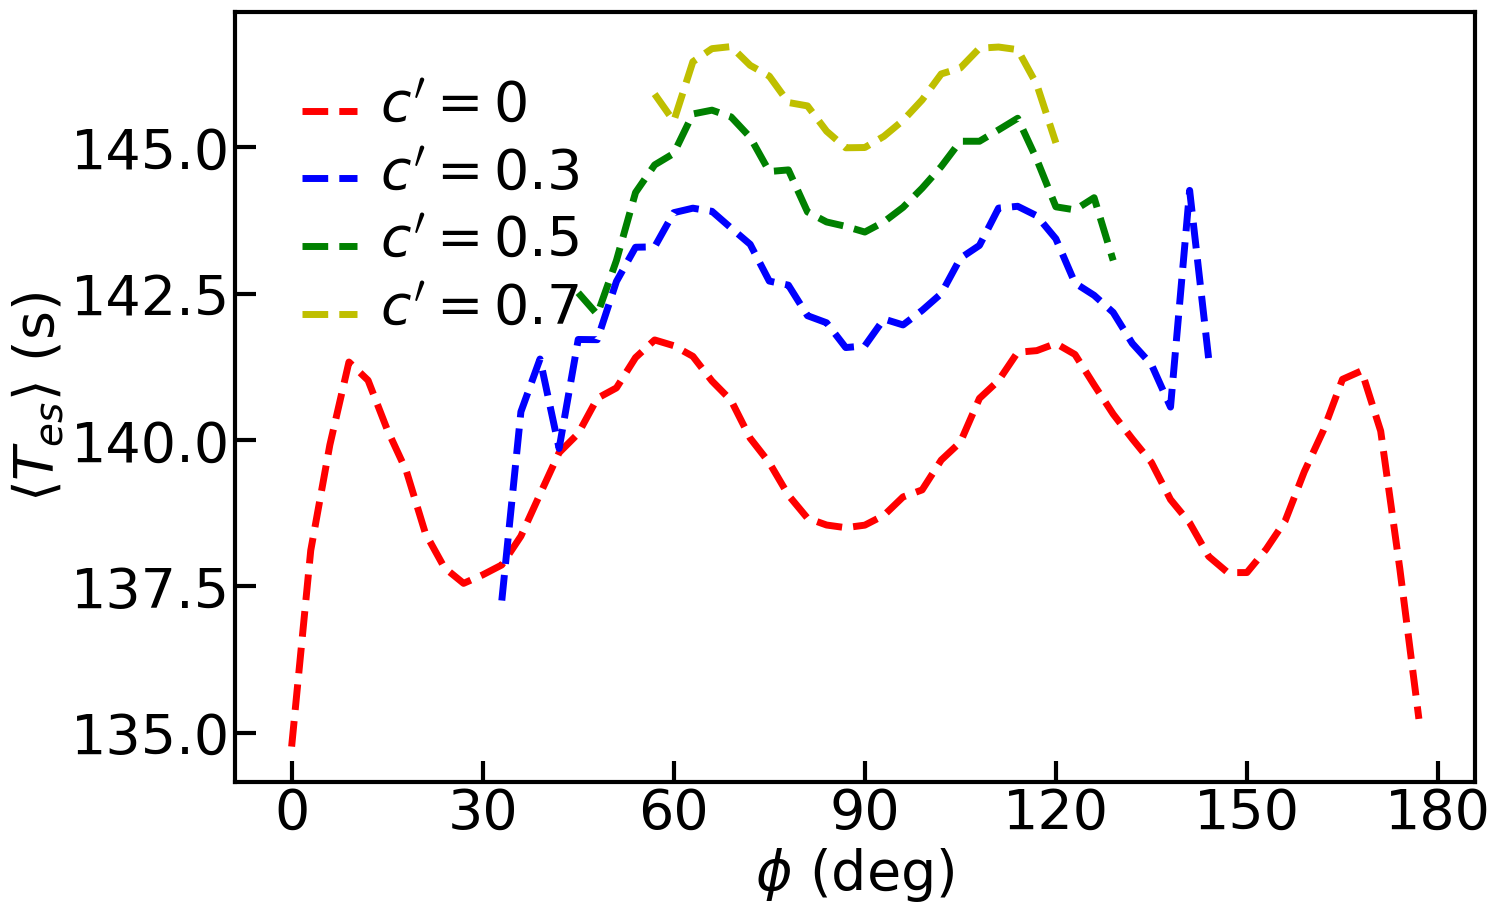
We proceed to discuss the scenario of collective escape if all the pedestrians know and adopt the strategy of running towards the central fast track. To address this issue, we add a tendency force on each pedestrian towards the line of the central fast track, and update the crowd configuration by
| (9) |
For simplicity, is designed to be the gradient of a quadratic potential , where is the vertical distance from the pedestrian to the central horizontal line.
The tendency force increases linearly with . is the controlling parameter for the strength of the
tendency force. By writing in the form of , the relative
strength of the tendency force is controlled by . The plot of
vs is presented in
Fig. 6. Increasing leads to the elevation of the curves. It indicates
that when all the pedestrians adopt the escape strategy, the average evacuation
time increases. Nevertheless, the relatively safe spots are still located along the central
line; the relative advantage of the central line is reduced.
Finally, we emphasize that the results presented in this work are derived from the theoretical SFM without considering relevant factors in reality, such as the situation of injury and the intelligent adaption of pedestrians to local environment. And we emphasize that the results derived in this work that is based on the SFM are subject to experimental examination. Here, we briefly discuss the social force model itself. This model has proven a powerful tool to simulate complicated crowd dynamics by incorporating the socio-psychological element into the force model. However, the socio-psychological forces in the model can be disputable. It is natural to inquire to what extent the subtle psychology and action of pedestrians upon various external stimuli can be characterised by these forces. Our simulations suggest that the emergent statistical law underlying the crowd dynamics is unaffected by the modest random variation of individual behaviour. This observation provides good evidence on the reliability of the statistical laws derived from the model. But under larger fluctuations of individual behaviours, such as non-local migration of pedestrians, one has to revise the forces. A direction of interest is to design smart rules of motion that endow the particles with more free will; the spirit of combining the physical and socio-psychological elements may be retained in the new model Martinez-Gil et al. (2011).
IV Conclusion
In summary, by conducting symmetric simulations with the social force model, we have revealed the ordering driven multiple fast tracks in collective escape of human crowds, and clarified the underlying mechanism by the exploiting the striking analogy of crowd dynamics and crystallisation. Notably, the emergent topological defects and their characteristic dynamics play a crucial role for shaping the global crystalline order and creating the fast tracks. It is important to emphasize that, it is not our intention to advocate any specific model of crowd dynamics. Although our analysis in this work is based on the simulation results of SFM, we conjecture, however, that the analysis methods proposed as well as the link between crowd dynamics and crystallisation are not dependent on SFM. To this end, it is of interest to explore such a link using other popular crowd dynamics models Fiorini and Shiller (1998); Ulicny and Thalmann (2002) and further validate our analysis. Moreover, we appreciate that the proposed mechanism interpretation needs to be further validated by experimental studies, and we believe that such mechanism may provide useful information towards more efficient crowd evacuation management.
V ACKNOWLEDGMENTS
This work was supported by NSFC Grants No. 16Z103010253.
References
- Helbing and Molnar (1995) D. Helbing and P. Molnar, Phys. Rev. E 51, 4282 (1995).
- Helbing et al. (2005) D. Helbing, L. Buzna, A. Johansson, and T. Werner, Transp. Sci. 39, 1 (2005).
- Helbing et al. (2007) D. Helbing, A. Johansson, and H. Z. Al-Abideen, Phys. Rev. E 75, 046109 (2007).
- Gravish et al. (2015) N. Gravish, G. Gold, A. Zangwill, M. A. Goodisman, and D. I. Goldman, Soft matter 11, 6552 (2015).
- Tao and Dong (2017) Y. Z. Tao and L. Y. Dong, Europhys. Lett. 119, 10003 (2017).
- Rogsch et al. (2010) C. Rogsch, M. Schreckenberg, E. Tribble, W. Klingsch, and T. Kretz, in Pedestrian and evacuation dynamics 2008 (Springer Berlin Heidelberg, 2010), pp. 743–755.
- Adrian et al. (2019) J. Adrian, M. Amos, M. Baratchi, M. Beermann, N. Bode, M. Boltes, A. Corbetta, G. Dezecache, J. Drury, Z. Fu, et al., Collective Dynamics 4, 1 (2019).
- Gibelli and Bellomo (2019) L. Gibelli and N. Bellomo, Crowd Dynamics, Volume 1: Theory, Models, and Safety Problems (Springer, 2019).
- Rahouti et al. (2018) A. Rahouti, R. Lovreglio, P. Jackson, and S. Datoussaid, in Proceedings of the 9th International Conference on Pedestrian and Evacuation Dynamics (PED2018) (2018).
- Feliciani and Nishinari (2018) C. Feliciani and K. Nishinari, in Proceedings of the 9th International Conference on Pedestrian and Evacuation Dynamics (PED2018) (2018).
- Smith and Dickie (1993) R. A. Smith and J. F. Dickie, Engineering for crowd safety: proceedings of the International Conference on Engineering for Crowd Safety (Elsevier Science Ltd, 1993).
- Helbing et al. (2000) D. Helbing, I. Farkas, and T. Vicsek, Nature 407, 487 (2000).
- Batty et al. (2003) M. Batty, J. DeSyllas, and E. Duxbury, Int. J. Geogr. Inf. Sci. 17, 673 (2003).
- Metivet et al. (2018) T. Metivet, L. Pastorello, and P. Peyla, Europhys. Lett. 121, 54003 (2018).
- Moussaïd et al. (2010) M. Moussaïd, N. Perozo, S. Garnier, D. Helbing, and G. Theraulaz, PloS one 5, e10047 (2010).
- James (1953) J. James, Am. Sociol. Rev. 18, 569 (1953).
- Sumpter (2006) D. J. Sumpter, Philos. Trans. R. Soc. B-Biol. Sci. 361, 5 (2006).
- Castellano et al. (2009) C. Castellano, S. Fortunato, and V. Loreto, Rev. Mod. Phys. 81, 591 (2009).
- Schadschneider et al. (2009) A. Schadschneider, W. Klingsch, H. Klüpfel, T. Kretz, C. Rogsch, and A. Seyfried, Evacuation Dynamics: Empirical Results, Modeling and Applications (Springer, New York, NY, 2009), pp. 3142–3176, 1st ed.
- Lakoba et al. (2005) T. I. Lakoba, D. J. Kaup, and N. M. Finkelstein, Simulation 81, 339 (2005).
- Zuriguel et al. (2020) I. Zuriguel, I. Echeverria, D. Maza, R. C. Hidalgo, C. Martín-Gómez, and A. Garcimartín, Saf. Sci. 121, 394 (2020).
- Chraibi et al. (2015) M. Chraibi, T. Ezaki, A. Tordeux, K. Nishinari, A. Schadschneider, and A. Seyfried, Phys. Rev. E 92, 042809 (2015).
- Boltes et al. (2018) M. Boltes, J. Zhang, A. Tordeux, A. Schadschneider, and A. Seyfried, Empirical Results of Pedestrian and Evacuation Dynamics (Springer, Berlin, Heidelberg, 2018), pp. 1–29, 2nd ed.
- Cordes et al. (2019) J. Cordes, A. Schadschneider, and A. Tordeux, arXiv preprint arXiv:1911.07547 (2019).
- Helbing and Johansson (2009) D. Helbing and A. Johansson, Pedestrian, Crowd and Evacuation Dynamics (Springer, New York, NY, 2009), pp. 6476–6495, 1st ed.
- Henderson (1971) L. Henderson, Nature 229, 381 (1971).
- Henderson (1974) L. F. Henderson, Transportation Research 8, 509 (1974).
- Helbing (1998) D. Helbing, Complex Systems 6, 391 (1998).
- Bauer et al. (2007) D. Bauer, S. Seer, and N. Brändle, in Proceedings of the 2007 summer computer simulation conference (Society for Computer Simulation International, San Diego, CA, USA, 2007), pp. 1035–1042.
- Helbing et al. (2003) D. Helbing, M. Isobe, T. Nagatani, and K. Takimoto, Phys. Rev. E 67, 067101 (2003).
- Czirók and Vicsek (2012) A. Czirók and T. Vicsek, Physica A 281, 17 (2012).
- Chraibi et al. (2018) M. Chraibi, A. Tordeux, A. Schadschneider, and A. Seyfried, Modelling of Pedestrian and Evacuation Dynamics (Springer, Berlin, Heidelberg, 2018), pp. 1–22, 2nd ed.
- Corbetta et al. (2018) A. Corbetta, J. A. Meeusen, C.-m. Lee, R. Benzi, and F. Toschi, Phys. Rev. E 98, 062310 (2018).
- Das et al. (2020) M. Das, C. F. Schmidt, and M. Murrell, Soft Matter 16, 7185 (2020).
- Helbing (1991) D. Helbing, Behavioral Sci. 36, 298 (1991).
- Colombi and Scianna (2017) A. Colombi and M. Scianna, R. Soc. Open Sci. 4, 160561 (2017).
- Nelson (2002) D. R. Nelson, Defects and geometry in condensed matter physics (Cambridge University Press, Cambridge, UK, 2002).
- Yao and Olvera de la Cruz (2014) Z. Yao and M. Olvera de la Cruz, Proc. Natl. Acad. Sci. USA 111, 5094 (2014).
- Yao (2016) Z. Yao, Soft Matter 12, 7020 (2016).
- Chaikin and Lubensky (2000) P. Chaikin and T. Lubensky, Principles of condensed matter physics (Cambridge University Press, Cambridge, UK, 2000).
- Matin et al. (2003) M. Matin, P. Daivis, and B. Todd, Comput. Phys. Commun. 151, 35 (2003).
- Dobson et al. (2016) M. Dobson, I. Fox, and A. Saracino, J. Comput. Phys. 315, 211 (2016).
- Garcimartín et al. (2017) A. Garcimartín, J. M. Pastor, C. Martín-Gómez, D. Parisi, and I. Zuriguel, Scientific Reports 7, 1 (2017).
- Schweitzer and Farmer (2007) F. Schweitzer and J. Farmer, Brownian Agents and Active Particles (Springer, 2007).
- Martinez-Gil et al. (2011) F. Martinez-Gil, M. Lozano, and F. Fernández, in International Workshop on Adaptive and Learning Agents (Springer, Berlin, Heidelberg, 2011), pp. 54–69.
- Fiorini and Shiller (1998) P. Fiorini and Z. Shiller, The International Journal of Robotics Research 17, 760 (1998).
- Ulicny and Thalmann (2002) B. Ulicny and D. Thalmann, in Computer Graphics Forum (Wiley Online Library, 2002), vol. 21, pp. 767–775.