Can phantom transition at restore the Cosmic concordance?
Abstract
The tension among inferences of Hubble constant () is found in a large array of datasets combinations. Modification to the late expansion history is the most direct solution to this discrepancy. In this work, we examine the viability of restoring the cosmological concordance with a novel version of transitional dark energy (TDE). The main anchors for the cosmic distance scale: cosmic microwave background (CMB) radiation, baryon acoustic oscillation (BAO), and Type Ia supernova (SNe Ia) calibrated by Cepheids form a “impossible trinity”, i.e., it’s plausible to reconcile with any two of the three but unlikely to accommodate them all. Particularly, the tension between BAO and the calibrated SNe Ia can not be reconciled within the scenarios of late dark energy. Nevertheless, our analysis suggests that the TDE model can reconcile with CMB and SNe Ia calibrated by its absolute magnitude (). when the equation of state (EoS) of DE transits around . Meanwhile, we see a positive sign that the EoS transits with the \colorblackinclusion of a local prior on , whereas the opposite is true without the prior.
keywords:
Dark energy – Cosmology1 Introduction
The precise determination of the Hubble constant , which requires both accurate astrophysical and cosmological modeling, is crucial for modern cosmology. Historically, is measured directly via the classical distance ladder (Sandage et al. (2006)) in the local universe, while in the early universe, is extracted indirectly from angular size of the sound horizon and the shapes of the acoustic peaks in the cosmic microwave background (CMB) radiation (Hinshaw et al. (2013); Ade et al. (2014)). These measurements disagree at significance, e.g., from SH0ES collaboration (Riess et al. (2021)) and from Planck 2018 data111The obtained by alternative methods varies between these measurements. One example is the recent measurement from tip of the red giant branch (TRGB) calibration (Freedman (2021). (Aghanim et al. (2018)). Several independent probes of the late-universe have reached competitive accuracy with the distance ladder, such as measurements of the strongly lensed quasar systems (Wong et al. (2020)), obtaining . Since the tension between late and early universe is found in a large array of differing datasets combinations (see Verde et al. (2019); Perivolaropoulos & Skara (2021a) for a recent review), it’s unnatural to attribute the disagreement solely to systematic errors222 Extensive works have focused on whether this discrepancy can be caused by yet unknown systematic effects. Recent work in Mortsell et al. (2021) suggest that, by choosing different Cepheid colorluminosity calibration method, the obtained could be much more compatible with the Planck value. To show the application of the late dark energy to the fit, we will focus on the SH0ES result that has the largest deviation from the Planck result.. Hence, this tension may be a sign of physics beyond the standard CDM cosmology.
There exist varied theoretical proposals to explain or ameliorate the discrepancy, ranging from new physics in early-time (, pre-recombination) to late-time () universe (see Di Valentino et al. (2021) for a review). Within the framework of General Relativity (GR), it is natural to consider the dynamical DE, i.e., replacing cosmological constant with a scalar field (Barboza & Alcaniz (2008); Armendariz-Picon et al. (2000); Linder (2003); Jassal et al. (2005); Armendariz-Picon et al. (2001); Caldwell (2002); Guo et al. (2005); D’Amico et al. (2021)) or a DE equation of state (EoS) parameterization (see Li et al. (2011) for a review). Whereas, it is proved the converse that Quintessence (a minimally coupled scalar) always makes Hubble tension worse than (Banerjee et al. (2021)). Other tentative solutions include interacting DE (Kumar & Nunes (2016); Yang et al. (2018); Pan et al. (2020); Di Valentino et al. (2020); Nunes & Di Valentino (2021)), modified gravity (Saridakis et al. (2021); Nunes (2018); Raveri (2020); Yan et al. (2020); Frusciante et al. (2020); D’Agostino & Nunes (2020); Ballardini et al. (2020)) as well as other possibilities (Hart & Chluba (2018); Chiang & Slosar (2018); Yang et al. (2019); Jedamzik & Pogosian (2020); Sekiguchi & Takahashi (2020); Vagnozzi (2020)). Recently, the binned analysis of is employed in (Wong et al. (2020); Dainotti et al. (2021)) to investigate a possible evolutionary trend for .
These proposals must also stand up to the scrutiny of current Large-Scale Structure (LSS) surveys (Abbott et al. (2018); Alam et al. (2017); Hildebrandt et al. (2020); Hikage et al. (2019)), which have delivered precise cosmological constraints. Interestingly, the inference of value in both CMB and LSS surveys depend on the precise determination of sound horizon , thus, a reduction of the sound horizon by increasing the expansion rate just prior to recombination (with additional energy density components, e.g., exotic early dark energy (EDE) (Poulin et al. (2019); Gogoi et al. (2020)), acoustic dark energy (ADE) (Lin et al. (2020)) seems to be the “least unlikely to be successful” (Knox & Millea (2020)) approach to solve the tension. However, the addition of EDE or another component would suppress the growth of perturbations prior to recombination, which changes the amplitudes and phases of the CMB acoustic peaks in complex ways and would bring in new tension with the density fluctuation amplitude, . Moreover, given a certain shift in , the shift in needed in the CMB to match observations will be different from the one needed to match the LSS observations, introducing a currently non-existing tension (Hill et al. (2020)).
In the late-DE scenarios, the sound horizon at last scattering is preserved from the modification of late expansion history. With the acoustic scale () fixed by CMB, an upward shift on is compensated by the increase of , which can be implemented by raising the “dilution rate” of DE density. This scenario can be realized by a wide class of “phantom-like” DE (Caldwell (2002); Caldwell et al. (2003); Guo et al. (2005); Alestas et al. (2020)). \colorblackAlthough the phantom transition of DE at late time is able to provide an apparent resolution of the tension, the underlying tension of the SnIa absolute magnitude () have not been taken into account. Recent works in Camarena & Marra (2021); Benevento et al. (2020); Alestas et al. (2021b) have studied phantom transition at very-low redshift accompanied by an transition or a rapid transition of the effective gravitational constant () at (Marra & Perivolaropoulos (2021)), in order to address both the tension and tension. Being backed up by several observational hints (Alestas et al. (2021a); Perivolaropoulos & Skara (2021b)), this double transition model proves to be successful in addressing the tension as well (Marra & Perivolaropoulos (2021)). In the recently proposed phenomenological emergent dark energy model (PEDE) (Li & Shafieloo (2019)) model and its generalized version (Li & Shafieloo (2020); Hernández-Almada et al. (2020)), the DE is negligible at early times but dominates at late-time, providing an alternative solution to the coincidence problem (Hernández-Almada et al. (2020). If only the local measurements and CMB data are taken into consideration, this scenario seems ideal to solve the tension because the imprints of late-universe modification on the CMB spectra can be counteracted by a shift in . However, the numerical analysis in (Rezaei et al. (2020); Benaoum et al. (2020)) suggests that, the PEDE model is not well compatible with SN Ia and LSS surveys, especially the data from RSD observations (Rezaei et al. (2020)). Such incompatibility is mainly caused by the sharp transition of EoS at present, hence one may consider altering the scale at which the EoS of DE transits to avoid the tension. Using Gaussian process regression, Keeley et al. (2019) suggests that when the EoS transits rapidly at , the growth of the perturbation is slower than fiducial CDM model for , while the study in Alestas & Perivolaropoulos (2021) suggest that deforming with CPL parameterization worsens the growth tension. As a result of these concerns, we proposed a novel version of transitional dark energy (TDE) model (based on the research in Keeley et al. (2019); Bassett et al. (2002)), which is captured by the transitional scale . In this scenario, the DE behaves like the cosmological constant at late-time and goes through a rapid transition in the EoS at .
The outline of this paper is as follows: in section 2 we take a brief review of the key observations associated with tension. In section 3, we briefly introduce the TDE model as well as its cosmological features. In section 4, we describe our numerical implementation of EDE model and the datasets used in our analysis. The numerical results of the Markov chain Monte Carlo (MCMC) analysis are presented in section 5. The discussion and conclusions are presented in section 6.
2 MATCHING THE CMB
Measurements of the CMB spectra precisely determine the angular acoustic scale (transverse direction) and the “shift parameter” R (line-of-sight direction), defined as (Chen et al. (2019))
| (1) |
where is the redshift at the photon decoupling epoch, is the angular diameter distance and is the comoving sound horizon, defined by
| (2) |
where is the sound speed of the coupled photon-baryon fluid. In matter-radiation dominated era, an approximation of Hubble rate reads
| (3) |
which have no dependence on when and are fixed at given values (hereinbelow). Thus, a shift of the local expansion rate as well as modifications to the expansion history after last scattering () preserves the sound horizon .
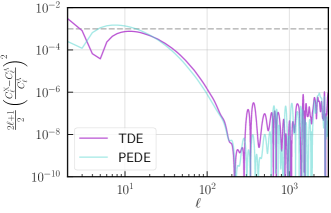
Within the scenarios of late-DE, the DE component has no effective presence in the past, and thus have no impact on . Unlike EDE changes the power spectrum in a complex way (Poulin et al. (2018)), the presence of late-DE changes only the traveling distance of the free streaming photons in the late universe, resulting in a linear shift in power spectrum. Such a shift can be perfectly offset by adjustment of value, thus, the best-fit can be conveniently obtained by “shooting”333By “shooting”, we mean that when a default value of is chosen, we adjust until a suitable value is found which gives the correct . This algorithm is frequently used in CLASS (Lesgourgues (2011). the Planck best-fit in CDM model444As is indicated in Eq. (1), the key features of the CMB spectrum ( and ) depend only on when and are preserved.. To verify the above argument, we calculate the disparity between the angular power spectrum calculated in CDM model and in late-DE scenarios (), e.g., TDE, PEDE (Li & Shafieloo (2019)) calibrated by the best-fit . The results shown in Fig. 1 indicates that the differences is much smaller than the cosmic variance, i.e.,
| (4) |
Consequently, the influence of late-DE on CMB is equivalent to a shift which preserves the overall shape of the power spectrum. On the other hand, for a given prior, the Planck-CDM best-fit spectrum can always be matched by adjusting late-DE parameters, thus, the tension between SH0ES and CMB is resolved within late-DE scenarios. It should be noted that, in this work DE is treated as an effective fluid with equations of evolution for density perturbation and velocity , respectively, given in (Ballesteros & Lesgourgues (2010)). Solving these equations requires the specification of the fluid EoS (see discussion in section 3), the effective sound speed of DE (evaluated in the fluid rest frame), and adiabatic sound speed . We fix so that the fluid can not be clustered, and with the conformal Hubble rate.
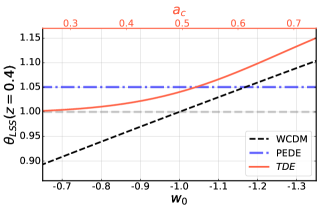
With Planck the best-fit value, we can calculate other key observables () to see whether the solution of tension is at the cost of bringing in new tensions with other observations. For example, in LSS surveys the angular acoustic scale could also be extracted from galaxy power spectrum at low-redshft (), denoting as:
| (5) |
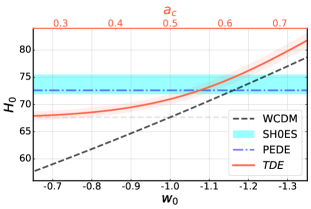
with approximation , where is redshift at drag epoch, and . We show in Fig. 2 the “shooting” results of the WCDM model (negative cosmological constant) (Visinelli et al. (2019)) and TDE model, the details of the TDE model will be discussed in the next section).
3 MODEL
According to the recent surveys, the universe on large scale is almost flat and can be well described by Friedmann-Lemaitre-Robertson-Walker (FLRW) metric. The Hubble parameter within this framework can be expressed as:
| (6) |
where are the present time matter and radiation density, respectively. The dark energy density can be described as:
| (7) |
where is ratio of DE density to the critical density (). The exponential part of Eq.7 indicates that, a smaller value of would translate into a faster dilution rate of DE. This effect suppresses the dilation of the late universe and is well compensated by an upward shift in , thus, the tension is relieved.
3.1 Transitional Dark Energy
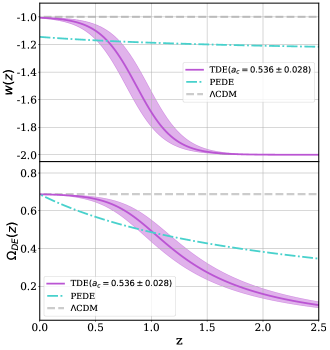
We formulate a novel version of transitional dark energy (TDE) model (see (Keeley et al. (2019); Bassett et al. (2002); Shafieloo et al. (2009)) for discussions of similar models), with the EoS of DE written as:
| (8) |
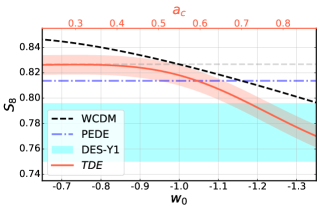
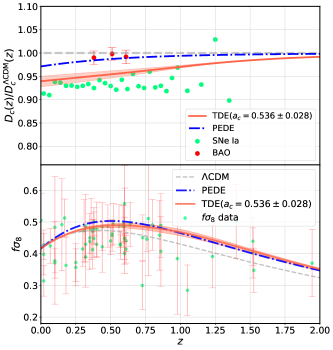
To recover CDM model when we fix (denote as TDE(1p)). In such case we have the EoS of DE evolving from at high redshift to at low redshift, which recovers the case in Covariant Galileon cosmology under the right initial conditions (De Felice & Tsujikawa (2010)). As is illustrated in Fig. 3 the EoS of DE remains constant at late-time then endures a rapid transition at the critical scale . With the increase of , the inferred value of increases, while the shifts on is the reverse. However, our analysis suggests that the transition of DE could not relieve the tension (see Fig. 4). Owing to the fact that, the growth function is boosted at , thus the solution of and tension (raising ) is at the cost of exacerbating tension.
Due to the resemblance to CDM model at late universe, TDE(1p) could largely avoid the mismatch with SNe datasets at the same time fit with the acoustic scale determined by CMB. \colorblackHowever, this scenario does not relieve the mismatch between the local distance ladder and BAO surveys, both of which can be directly related to the supernova absolute magnitude . With the calibration of the sound horizon (determined by CMB), the BAO experiments (Alam et al. (2017)) anchor the distance scales () at the late-universe. Using the parametric-free inverse distance ladder (Camarena & Marra (2020b)) these scales can be propagated to SnIa absolute magnitude:
| (9) |
which disagrees with the prior obtained from SH0ES (Riess et al. (2021)) by demarginalization method at (Camarena & Marra (2020a)). Note that is preserved within the scenario of late-DE. In this light, to address the above discussed tension, one may consider a rapid phantom transition of the EoS of DE at accompanied by a similar transition in the value of (Alestas et al. (2021b); Marra & Perivolaropoulos (2021)).
| Parameter | Prior |
|---|---|
| (TDE) |
4 STATISTICAL METHODOLOGY AND DATASETS
We implement TDE scenario as modifications to the publicly available Einstein-Boltzmann code CLASS (Lesgourgues (2011); Blas et al. (2011)) package. The non-linear matter power spectrum required by redshift-space distortion (RSD) likelihoods are computed using the “HMcode” (Mead et al. (2015); Mead (2017); Mead et al. (2020)) implemented in CLASS. The MCMC analyses are preformed using the publicly available code Cobaya (Torrado & Lewis (2020)) package with a Gelman-Rubin (Gelman & Rubin (1992)) convergence criterion . The plots have been obtained using the GetDist (Lewis (2019)) package.
The following datasets are considered in the MCMC analyses:
| Model | Dataset | ||||||||
| TDE | Planck | 0.0 | -8.73 | 0.69 | |||||
| Planck + | 0.1 | -23.5 | -11.54 | -9.10 | |||||
| PMS (Planck + +SNe) | 2.0 | -17.5 | -533.03 | -5.10 | |||||
| PMS + | 1.9 | -14.7 | -535.07 | -4.06 | |||||
| PMS + +BAO | 3.0 | -5.6 | -540.25 | -0.89 | |||||
| PMS + +BAO +FS | 3.2 | -3.5 | -543.41 | 0.15 | |||||
| LCDM | Planck | 4.9 | 2.9 | -8.04 | |||||
| Planck + | 4.5 | 28.1 | -20.64 | ||||||
| PMS | 4.3 | 1062.5 | -538.13 | ||||||
| PMS + | 4.0 | 1066.0 | -539.13 | ||||||
| PMS + +BAO | 4.0 | 1067.9 | -541.14 | ||||||
| PMS + +BAO +FS | 4.1 | 1071.7 | -543.26 |
4.1 CMB
We consider the CMB distance prior from final Planck 2018 release. Noted that, in late-DE scenarios, the shape of the power spectrum (with the same matter and radiation density) is identical to that of CDM cosmology at (for small the covariance is largely dominated by cosmic variance). In this case, the fit of the distance prior is equivalent to that of the angular power spectrum, while this is not true for EDE scenarios. \colorblackThe analysis with the Planck 2018 low- TT+EE and Planck 2018 high- TT+TE+EE temperature and polarization power spectrum (Aghanim et al. (2020)) are shown in Appendix C
4.2 Hubble Constant
The most recent SH0ES measurement indicates that (Riess et al. (2021)), which shows a tension at with the Planck (Aghanim et al. (2018)) value of assuming a minimal CDM model. \colorblackNote that the determination of by the SH0ES collaboration have fixed the deceleration parameter to the standard CDM model value of . To avoid inconsistency and double counting of the low-z SNe samples (Efstathiou (2021)), we adopt a prior on the SNe Ia absolute magnitude
| (10) |
which is derive using the demarginalization methodology of Camarena & Marra (2020a). With an uninformative flat prior for , the above prior gives . We denote as the effective number of that the Hubble measurement is away from this value. See Camarena & Marra (2021) for a detailed discussion of the local likelihoods.
4.3 Supernovae Type Ia
The 1048 Supernoave Type Ia data points distributed in redshift interval , known as the Pantheon sample (Scolnic et al. (2018)), which provide accurate relative luminosity distances. We utilize the likelihood as implemented in Cobaya.
4.4 LSS
The LSS dataset which probes the low-redshift universe are considered, which include:
-
•
BAO: measurements of the BAO signal with their full covariance matrix from BOSS DR12 (Alam et al. (2017)). Radial and transverse BAO measurements from Ly Forests SDSS DR12 (Bautista et al. (2017)). Angle averaged BAO measurement from 6DF Galaxy (Beutler et al. (2011)), from quasar sample from BOSS DR14 (Gil-Marín et al. (2018)).
-
•
RSD: SDSS BOSS DR12 (Alam et al. (2017)) measurements of , at , 0.51 and 0.61. We include the full covariance of the joint BOSS DR12 BAO and RSD data (denote as FS). Noting that the measured at different redshfts is not fully independent. Also, the data is correlated with the BAO signal, thus, it’s hard obtain the full covariance of the datasets compiled from different surveys. In view of this, the compilation of 63 RSD data points (Kazantzidis & Perivolaropoulos (2018)) are not included in the MCMC analysis, but only displayed as an illustration of the tension.
-
•
DES: shear-shear, galaxy-galaxy, and galaxy-shear two-point correlation functions (“3x2pt”), measured from 26 million source galaxies in four redshift bins and 650,000 luminous red lens galaxies in five redshift bins, for the shear and galaxy correlation functions, respectively. We utilize a Gaussian prior on derived by the DES-Y1 likelihood as is suggested in (Hill et al. (2020)).
It’s worth noting that TDE are extended from CDM model, and thus share with CDM model the six parameters. We fix three of the six parameter (,,) associated with the overall shape of the CMB spectrum to the best-fit value given by Planck 2018 (Aghanim et al. (2018)). Next, we consider as baseline a 4-dimensional parameter space described by the following parameters: the Hubble constant , the baryon energy density , cold dark matter energy density , and the transitional scale for TDE. We assume flat uniform priors on all these parameters, as are shown in Table 1.
| Dataset | Planck+ | |
|---|---|---|
| Model | TDE | CDM |
| Dataset | Without BOSS | Without SNe | ||
|---|---|---|---|---|
| Model | TDE | CDM | TDE | CDM |
| Dataset | Without | All combined | ||
|---|---|---|---|---|
| Model | TDE | CDM | TDE | CDM |
5 RESULTS AND DISCUSSION
For the cosmological analysis, we fit the TDE model to different combinations of the above discussed datasets. As a comparison, we also include the analysis of the CDM model. In order to compare among these models, we compute the Bayesian evidence , which is a crucial quantity for model selection and has been widely used in cosmology (Mehrabi & Basilakos (2018); Rezaei et al. (2020); Lonappan et al. (2018); Saini et al. (2004)). Further, given two models and one can use the Jeffreys’ scale (Jeffreys (1961)) to measure the significant difference between two models, i.e., . The model pair difference provides the following situations:
-
•
suggests weak evidence against model when compared with .
-
•
for there is a definite evidence against model .
-
•
for there is a strong evidence against model .
Correspondingly, the evidence is against model when . In addition to the evidence, we also include the computation of the Akaike Information (AIC) (Akaike (1974)), given by:
| (11) |
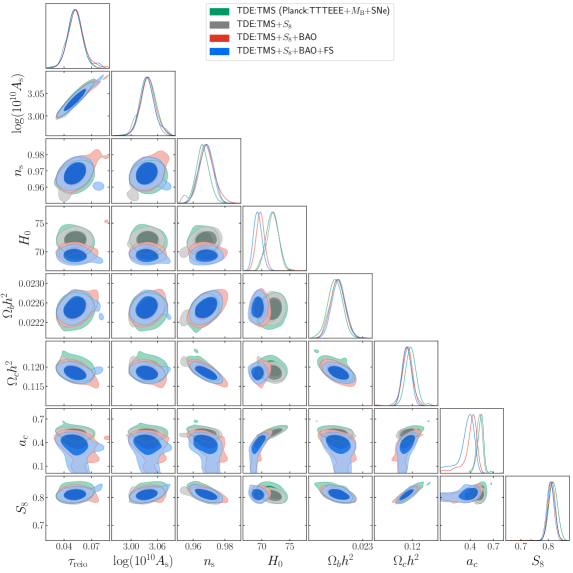
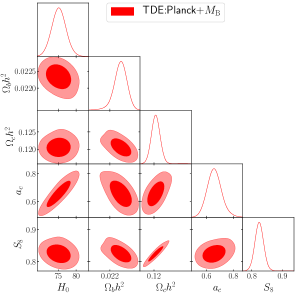
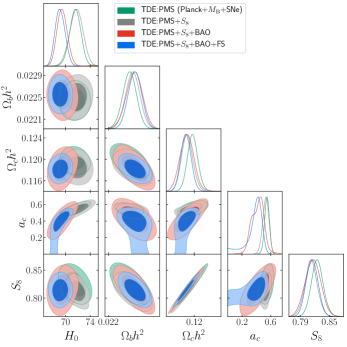
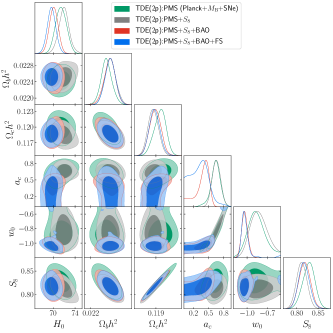
where k is the number of fitting parameters. For brevity, we denote the combination of likelihoods without LSS data as PMS (Planck+ +SNe). In Table 2 we report the constraints at 68% CL on the and some key derived quantities for several datasets combinations considered in this work. Detailed constrains on cosmological parameters and statistics can be found in Tables 35. The triangular plot with the 1D posterior distributions and the 2D contour plots for these parameters are shown in Fig. 57.
5.1 Constraints from CMB and SH0ES
As is discussed in section 2, there is a strong degeneracy between and the late-DE parameter () which quantify the deviation of these scenarios from CDM model (see Fig. 2). Consequently, the Planck data alone is insufficient to give a tight constrain to these parameters, so that a prior on should be included. To test the above argument, we first consider the fit to Planck 2018 distance prior alone. The results tabulated in Table 2 indicates a lower bound of at CL, while is loosely constrained. Next, we consider the fit to a combination of Planck distance prior and the prior derived from SH0ES. In Table 3, we find the Hubble constant to be . The tension in TDE scenario is largely removed when the prior is added. Noting that, the resolve of the tension between local distance ladder and CMB can be achieved by a wide class of “phantom-like” DE. The contours in Fig. 5 show a clear degeneracy between () and in TDE model. The statistic in 3 shows that, the goodness of the fit is significantly improved. Noted that, this improvement is mainly due to the reduction of the discordance with SH0ES data.
5.2 Constraints from Accumulative DataSets
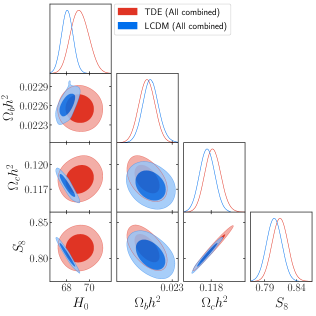
As is discussed in previous sections, the tension between SH0ES and Planck is resolved by calibration of the transitional scale . The problem is now transformed to, whether the expansion history (growth history) fixed by +Planck is in accord with other observations. If the model does restore the cosmic concordance, one would expect consistency between the fit of any dataset combinations. To verify this, we consider the constraints from accumulative datasets. We can see from Table 2, different combinations of datasets yield different values of best-fit parameters. A clear trend should be noticed that, with the inclusion of more datasets, the best-fit cosmological parameters as well as the value approach to that of CDM model. For example, with and Planck combination we find and , in tension with the fit of the same datasets in CDM scenario. This tension drops to less than with the inclusion of all considered likelihoods, while the differences in value reduce from to . With the inclusion of SNe dataset, the tension with SH0ES increased for TDE model. Noted that, the SNe dataset which constrains the expansion history of the late universe, i.e., , is well compatible with the CDM model, thus, modification of the EoS of DE at is disfavored. Consequently, the constrains on transitional scale decrease from to , which results in a decline of the best-fit value of . Interestingly, the tension with SH0ES reduces with the addition of a prior on ( for the Planck best-fit CDM). This is in accord with the shooting result shown in Fig. 2, i.e., applying such a prior on would result in a upward shift on the transitional scale , which in turn increases the inferred value of . The result of Bayesian evidence analysis shows strong evidence for TDE model when LSS datasets are not considered (see last panel of Table 2). While the Bayesian evidence does not show any significant difference between TDE and CDM model when all datasets are included ().
5.3 Constraints from Selected DataSets
In the context of TDE model, the tension with SH0ES increases significantly (from to ) with the inclusion of BAO data. As can be seen from Fig. 4, both BAO and SNe measurements (calibrated by the local distance ladder) anchor the distance scale at , yet not in good agreement with each other. Such tension is inherited in the dataset itself. Therefore, the conformity with one of the anchor almost certainly leads to discordance with the other. While within the scenarios of late-DE, the inferred is identical with fiducial CDM model (see section 2), so the discordance between BAO and SNe () datasets can’t be reconciled. However, the BAO measurements rely on the presumption of the fiducial cosmology, which means the measured distance scale should be calibrated by the factor . To account for the possibility that the tension is originated by some unknown systematics of a single dataset, we selected several subclasses of whole datasets as follows:
-
•
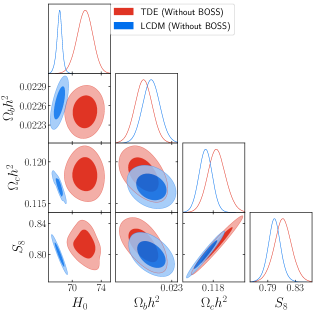
Without BOSS: Comparing the result tabulated in Table 4 and Table 5, we find that with the exclusion of BOSS dataset, the constrains on increase from to while the tension with SH0ES reduce from to (see Fig. 6 for a view) in TDE model. Which indicates that the tension between BOSS and prior derived from SH0ES can not be reconciled in this scenario.
-
•
Without SNe: See Table 4 and Table 5 for a contrast between the constraint results with and without SNe dataset. As can be seen, the best-fit transitional scale as well as other cosmological parameters (including ) are almost identical in both case, suggesting that the SNe dataset is well compatible with the TDE scenario.
-
•
Without : From Table 5 one can see that, the difference in constrains on for the two model is marginal, also are the statistics, i.e, . In this case, the extra late-DE parameter is redundant. The numerical results suggest that, the transitional scale is consistent with zero, i.e., . Meanwhile, the Bayesian evidence is against the TDE model when compared with the fiducial CDM model ().
For a brief summary, the TDE scenario is disfavored by the BAO dataset. This discordance could not be fully removed within the context of late-DE. With the exclusion of prior and the inclusion of LSS dataset, the CDM model is favored over TDE model.
6 DISCUSSION AND CONCLUSIONS
The CDM model calibrated by Planck data is well compatible with a large bunch of independent observational datasets (BAO, SN Ia, etc), but in severe tension with the local distance ladder (). Consequently, the ideal solution to the discordance lies in the scenarios which disagree with CDM solely on the inferences of , while recover the predictions of CDM in most cases. However, the shift in inevitably leads to the modification in late expansion history. A practical way to capture this modification is to add an extra parameter to the six standard CDM parameters named as “late-DE parameter”, which degenerates only with while is uncorrelated with the other five parameters.
In this work, we explore a representative parameterization within the scenarios of late dark energy: a novel version of Transitional dark energy (TDE). The main feature of the TDE model is the sharp transition of the EoS of DE at the critical scale . When approach to zero, the TDE model recovers CDM model. We analyze the TDE scenario accounting for Planck 2018 distance prior, BAO+FS (DF6, BOSS DR12 and DR14), prior derived from DES-Y1 3x2pt, as well as the prior derived from SH0ES and SNe dataset from the Pantheon compilation. The results are shown in Table 35 and Fig. 57. To give a clear view on the influences of different datasets, we conduct the MCMC analysis in an accumulative way. Due to the degeneracy between and the extra late-DE parameter, is loosely constrained by CMB alone, i.e., for TDE model. When added with the prior, the constraint results for TDE () closely match the SH0ES prior, which further confirms the degeneracy. With the growing number of included datasets, one can see clear trend that the TDE scenario degenerates into standard CDM model, meanwhile, the tension with SH0ES grows continuously (see Table 2). Thus, the tension on is not solved, also, the tension is neither relieved nor exacerbated in TDE scenario. Owing to the fact that the structure growth is more rapid in the case of “phantom-like” DE than that of cosmological constant, a lower inferred value of is largely compensated by the upward shift on , resulting in a minor influence on the constraints.
The three main anchors of the cosmic distance scale, e.g., CMB (), BAO(), and SNe Ia calibrated by the local measurements () form a “Impossible trinity”, i.e., it’s plausible to reconcile with any two of the three but hard to accommodate all of them. Within the scenarios of late-DE, it’s nearly impossible to reconcile the tension between BAO () and SNe Ia calibrated by (see Fig. 4). Even if we allow for a reduction of the sound horizon , it is not likely to simultaneously match the distance anchored by CMB and BAO (see D’Amico et al. (2020); Hill et al. (2020)), because given a certain shift in , the shift in needed to match the CMB observations will be different than the one needed to match the late LSS observations. However, the late universe measurements require the modeling of complex astrophysical systems which may bring about some systematic error either in the measurements or in the astrophysical modeling (D’Amico et al. (2020); Mortsell et al. (2021)). To account for the possibility of unknown systematics, we selected several subclasses of the datasets, the constraint results can be seen in Table 4, 5 and Fig. 6. In the analysis without BOSS measurement, TDE model have shown its potential to solve the tension, i.e., and (reconcile with SH0ES within ). This result can also be verified by “shooting”, which suggests that, at the Planck best-fit value is (see Fig. 2). With the combination of all considered datasets (including ), we see a positive sign that the EoS transits in TDE scenario, i.e., the transitional scale of DE is not consistent with zero ( at CL). With the exclusion of th prior, we have peaked toward zero. In this case, the result of Bayesian evidence analysis is against TDE model when compared with CDM model. However, the analysis without BOSS measurement indicates strong evidence for TDE model ().
In summary, owing to the irreconcilable tension between BAO and SNe Ia calibrated by , within the scenario of TDE the cosmological concordance can not be restored. However, with the presumption of unknown systematics, the TDE model could still be viewed as a viable candidate. What is the “true” origin of these discordances? We hope that more investigators will be motivated to explore this sector.
Acknowledgements
This work is supported in part by National Natural Science Foundation of China under Grant No.12075042, Grant No.11675032 (People’s Republic of China).
Data Availability
The data underlying this article will be shared on reasonable request to the corresponding author.
References
- Abbott et al. (2018) Abbott T., et al., 2018, Phys. Rev. D, 98, 043526
- Ade et al. (2014) Ade P., et al., 2014, Astron. Astrophys., 571, A16
- Aghanim et al. (2018) Aghanim N., et al., 2018
- Aghanim et al. (2020) Aghanim N., et al., 2020, Astron. Astrophys., 641, A5
- Akaike (1974) Akaike H., 1974, IEEE Transactions of Automatic Control, 19, 716
- Alam et al. (2017) Alam S., et al., 2017, Mon. Not. Roy. Astron. Soc., 470, 2617
- Alestas & Perivolaropoulos (2021) Alestas G., Perivolaropoulos L., 2021, Mon. Not. Roy. Astron. Soc., 504, 3956
- Alestas et al. (2020) Alestas G., Kazantzidis L., Perivolaropoulos L., 2020, Phys. Rev. D, 101, 123516
- Alestas et al. (2021a) Alestas G., Antoniou I., Perivolaropoulos L., 2021a, Universe, 7, 366
- Alestas et al. (2021b) Alestas G., Kazantzidis L., Perivolaropoulos L., 2021b, Phys. Rev. D, 103, 083517
- Armendariz-Picon et al. (2000) Armendariz-Picon C., Mukhanov V. F., Steinhardt P. J., 2000, Phys. Rev. Lett., 85, 4438
- Armendariz-Picon et al. (2001) Armendariz-Picon C., Mukhanov V. F., Steinhardt P. J., 2001, Phys. Rev., D63, 103510
- Ballardini et al. (2020) Ballardini M., Braglia M., Finelli F., Paoletti D., Starobinsky A. A., Umiltà C., 2020, JCAP, 10, 044
- Ballesteros & Lesgourgues (2010) Ballesteros G., Lesgourgues J., 2010, JCAP, 10, 014
- Banerjee et al. (2021) Banerjee A., Cai H., Heisenberg L., Colgáin E. O., Sheikh-Jabbari M. M., Yang T., 2021, Phys. Rev. D, 103, L081305
- Barboza & Alcaniz (2008) Barboza Jr. E. M., Alcaniz J. S., 2008, Phys. Lett., B666, 415
- Bassett et al. (2002) Bassett B. A., Kunz M., Silk J., Ungarelli C., 2002, Mon. Not. Roy. Astron. Soc., 336, 1217
- Bautista et al. (2017) Bautista J. E., et al., 2017, Astron. Astrophys., 603, A12
- Benaoum et al. (2020) Benaoum H. B., Yang W., Pan S., Di Valentino E., 2020
- Benevento et al. (2020) Benevento G., Hu W., Raveri M., 2020, Phys. Rev. D, 101, 103517
- Beutler et al. (2011) Beutler F., et al., 2011, Mon. Not. Roy. Astron. Soc., 416, 3017
- Blas et al. (2011) Blas D., Lesgourgues J., Tram T., 2011, JCAP, 07, 034
- Caldwell (2002) Caldwell R. R., 2002, Phys. Lett., B545, 23
- Caldwell et al. (2003) Caldwell R. R., Kamionkowski M., Weinberg N. N., 2003, Phys. Rev. Lett., 91, 071301
- Camarena & Marra (2020a) Camarena D., Marra V., 2020a, Phys. Rev. Res., 2, 013028
- Camarena & Marra (2020b) Camarena D., Marra V., 2020b, Mon. Not. Roy. Astron. Soc., 495, 2630
- Camarena & Marra (2021) Camarena D., Marra V., 2021, ] 10.1093/mnras/stab1200
- Chen et al. (2019) Chen L., Huang Q.-G., Wang K., 2019, JCAP, 02, 028
- Chiang & Slosar (2018) Chiang C.-T., Slosar A., 2018
- D’Agostino & Nunes (2020) D’Agostino R., Nunes R. C., 2020, Phys. Rev. D, 101, 103505
- D’Amico et al. (2020) D’Amico G., Senatore L., Zhang P., Zheng H., 2020
- D’Amico et al. (2021) D’Amico G., Senatore L., Zhang P., 2021, JCAP, 01, 006
- Dainotti et al. (2021) Dainotti M. G., De Simone B., Schiavone T., Montani G., Rinaldi E., Lambiase G., 2021, Astrophys. J., 912, 150
- De Felice & Tsujikawa (2010) De Felice A., Tsujikawa S., 2010, Phys. Rev. Lett., 105, 111301
- Di Valentino et al. (2020) Di Valentino E., Melchiorri A., Mena O., Vagnozzi S., 2020, Phys. Dark Univ., 30, 100666
- Di Valentino et al. (2021) Di Valentino E., et al., 2021
- Efstathiou (2021) Efstathiou G., 2021, Mon. Not. Roy. Astron. Soc., 505, 3866
- Freedman (2021) Freedman W. L., 2021
- Frusciante et al. (2020) Frusciante N., Peirone S., Atayde L., De Felice A., 2020, Phys. Rev. D, 101, 064001
- Gelman & Rubin (1992) Gelman A., Rubin D. B., 1992, Statistical Science, 7, 457
- Gil-Marín et al. (2018) Gil-Marín H., et al., 2018, Mon. Not. Roy. Astron. Soc., 477, 1604
- Gogoi et al. (2020) Gogoi A., Sharma R. K., Chanda P., Das S., 2020
- Guo et al. (2005) Guo Z.-K., Piao Y.-S., Zhang X.-M., Zhang Y.-Z., 2005, Phys. Lett., B608, 177
- Hart & Chluba (2018) Hart L., Chluba J., 2018, Mon. Not. Roy. Astron. Soc., 474, 1850
- Hernández-Almada et al. (2020) Hernández-Almada A., Leon G., Magaña J., García-Aspeitia M. A., Motta V., 2020, Mon. Not. Roy. Astron. Soc., 497, 1590
- Hikage et al. (2019) Hikage C., et al., 2019, Publ. Astron. Soc. Jap., 71, Publications of the Astronomical Society of Japan, Volume 71, Issue 2, April 2019, 43, https://doi.org/10.1093/pasj/psz010
- Hildebrandt et al. (2020) Hildebrandt H., et al., 2020, Astron. Astrophys., 633, A69
- Hill et al. (2020) Hill J. C., McDonough E., Toomey M. W., Alexander S., 2020, Phys. Rev. D, 102, 043507
- Hinshaw et al. (2013) Hinshaw G., et al., 2013, The Astrophysical Journal Supplement Series, 208, 19
- Jassal et al. (2005) Jassal H. K., Bagla J. S., Padmanabhan T., 2005, Mon. Not. Roy. Astron. Soc., 356, L11
- Jedamzik & Pogosian (2020) Jedamzik K., Pogosian L., 2020, Phys. Rev. Lett., 125, 181302
- Jeffreys (1961) Jeffreys H., 1961, Theory of Probability
- Kazantzidis & Perivolaropoulos (2018) Kazantzidis L., Perivolaropoulos L., 2018, Phys. Rev. D, 97, 103503
- Keeley et al. (2019) Keeley R. E., Joudaki S., Kaplinghat M., Kirkby D., 2019, JCAP, 12, 035
- Knox & Millea (2020) Knox L., Millea M., 2020, Phys. Rev. D, 101, 043533
- Kumar & Nunes (2016) Kumar S., Nunes R. C., 2016, Phys. Rev. D, 94, 123511
- Lesgourgues (2011) Lesgourgues J., 2011
- Lewis (2019) Lewis A., 2019
- Li & Shafieloo (2019) Li X., Shafieloo A., 2019, Astrophys. J. Lett., 883, L3
- Li & Shafieloo (2020) Li X., Shafieloo A., 2020, Astrophys. J., 902, 58
- Li et al. (2011) Li M., Li X.-D., Wang S., Wang Y., 2011, Communications in Theoretical Physics, 56, 525
- Li et al. (2021) Li E.-K., Du M., Zhou Z.-H., Zhang H., Xu L., 2021, Mon. Not. Roy. Astron. Soc., 501, 4452
- Lin et al. (2020) Lin M.-X., Hu W., Raveri M., 2020, Phys. Rev. D, 102, 123523
- Linder (2003) Linder E. V., 2003, Phys. Rev. Lett., 90, 091301
- Lonappan et al. (2018) Lonappan A. I., Kumar S., Ruchika Dinda B. R., Sen A. A., 2018, Phys. Rev. D, 97, 043524
- Marra & Perivolaropoulos (2021) Marra V., Perivolaropoulos L., 2021, Phys. Rev. D, 104, L021303
- Mead (2017) Mead A., 2017, Mon. Not. Roy. Astron. Soc., 464, 1282
- Mead et al. (2015) Mead A., Peacock J., Heymans C., Joudaki S., Heavens A., 2015, Mon. Not. Roy. Astron. Soc., 454, 1958
- Mead et al. (2020) Mead A., Brieden S., Tröster T., Heymans C., 2020, ] 10.1093/mnras/stab082
- Mehrabi & Basilakos (2018) Mehrabi A., Basilakos S., 2018, Eur. Phys. J., C78, 889
- Mortsell et al. (2021) Mortsell E., Goobar A., Johansson J., Dhawan S., 2021
- Nunes (2018) Nunes R. C., 2018, JCAP, 05, 052
- Nunes & Di Valentino (2021) Nunes R. C., Di Valentino E., 2021, Phys. Rev. D, 104, 063529
- Pan et al. (2020) Pan S., Sharov G. S., Yang W., 2020, Phys. Rev. D, 101, 103533
- Perivolaropoulos & Skara (2021a) Perivolaropoulos L., Skara F., 2021a
- Perivolaropoulos & Skara (2021b) Perivolaropoulos L., Skara F., 2021b
- Poulin et al. (2018) Poulin V., Smith T. L., Grin D., Karwal T., Kamionkowski M., 2018, Phys. Rev. D, 98, 083525
- Poulin et al. (2019) Poulin V., Smith T. L., Karwal T., Kamionkowski M., 2019, Phys. Rev. Lett., 122, 221301
- Raveri (2020) Raveri M., 2020, Phys. Rev. D, 101, 083524
- Rezaei et al. (2020) Rezaei M., Naderi T., Malekjani M., Mehrabi A., 2020, Eur. Phys. J. C, 80, 374
- Riess et al. (2021) Riess A. G., Casertano S., Yuan W., Bowers J. B., Macri L., Zinn J. C., Scolnic D., 2021, Astrophys. J. Lett., 908, L6
- Saini et al. (2004) Saini T. D., Weller J., Bridle S. L., 2004, Mon. Not. Roy. Astron. Soc., 348, 603
- Sandage et al. (2006) Sandage A., Tammann G., Saha A., Reindl B., Macchetto F., Panagia N., 2006, Astrophys. J., 653, 843
- Saridakis et al. (2021) Saridakis E. N., et al., 2021
- Scolnic et al. (2018) Scolnic D. M., et al., 2018, Astrophys. J., 859, 101
- Sekiguchi & Takahashi (2020) Sekiguchi T., Takahashi T., 2020
- Shafieloo et al. (2009) Shafieloo A., Sahni V., Starobinsky A. A., 2009, Phys. Rev. D, 80, 101301
- Torrado & Lewis (2020) Torrado J., Lewis A., 2020
- Vagnozzi (2020) Vagnozzi S., 2020, Phys. Rev. D, 102, 023518
- Verde et al. (2019) Verde L., Treu T., Riess A., 2019, Nature Astron., 3, 891
- Visinelli et al. (2019) Visinelli L., Vagnozzi S., Danielsson U., 2019, Symmetry, 11, 1035
- Wong et al. (2020) Wong K. C., et al., 2020, Mon. Not. Roy. Astron. Soc., 498, 1420
- Yan et al. (2020) Yan S.-F., Zhang P., Chen J.-W., Zhang X.-Z., Cai Y.-F., Saridakis E. N., 2020, Phys. Rev. D, 101, 121301
- Yang et al. (2018) Yang W., Pan S., Di Valentino E., Nunes R. C., Vagnozzi S., Mota D. F., 2018, JCAP, 09, 019
- Yang et al. (2019) Yang W., Pan S., Paliathanasis A., Ghosh S., Wu Y., 2019, Mon. Not. Roy. Astron. Soc., 490, 2071
Appendix A Prior Dependence
We have assumed uniform prior probability distributions for effective TDE parameter , which correspond to non-uniform priors on the transitional redshifts . The EoS in parameterized by (denote as TDE()) can be rewritten as:
| (12) |
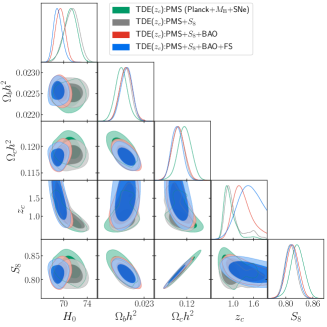
An obvious concern is the dependence of the posterior distributions on the choice of priors. To account for that, we recompute the TDE parameter constraints with a uniform prior imposed on , i.e., , which corresponds to . The posterior distributions are shown in Fig. 8 and the parameter constraints are tabulated in Table 6. It’s obvious to see that, the difference in priors have a negligible impact on the statistics, e.g., for the TDE fit to the all combined datasets and for that of TDE() fit of all combined datasets. It is notable that, there is a slight decline on the inferred value of in TDE(), which could be understood as the effect of a shift in prior probability distribution toward a smaller value of when a uniform prior on is assumed. The difference between the fit of TDE and TDE() becomes insignificant with the inclusion of a growing number of datasets (see Table 6).
| Model | Dataset | |||||||
|---|---|---|---|---|---|---|---|---|
| TDE | Planck + | -11.54 | ||||||
| PMS | -533.04 | |||||||
| PMS+ | -535.07 | 1051.3 | ||||||
| PMS++BAO | -540.25 | 1062.3 | ||||||
| PMS+ +BAO +FS | -543.41 | 1068.4 | ||||||
| TDE(2p) | Planck + | -7.52 | -4.02 | |||||
| PMS | -532.95 | -0.09 | ||||||
| PMS+ | -535.17 | 0.10 | ||||||
| PMS++BAO | -539.71 | -0.54 | ||||||
| PMS++BAO+FS | -543.67 | 0.26 | ||||||
| TDE() | Planck + | |||||||
| PMS | ||||||||
| PMS+ | ||||||||
| PMS++BAO | ||||||||
| PMS++BAO +FS | ||||||||
| TDE | Planck:TTTEEE + | |||||||
| TMS | ||||||||
| TMS+ | ||||||||
| TMS++BAO | ||||||||
| TMS++BAO +FS |
Appendix B Two Parameters TDE(2p)
In previous sections we have fixed to recover CDM when . While in this section, is considered as a free constant. In this case, the transitional DE is described by two parameters (, ). The parameter constrains and the posterior distributions are shown in Table 6 and Fig. 9. From the middle panel of Table 6 one can see that, the constrains in TDE(2p) model on and from each dateset combination closely match that of TDE(1p) model, while the constraint on is in agreement with -1 within . As can be noticed, there is a slight downward shift on the fit of from to with the inclusion of BAO datasets. As is discussed in section 3, the downward shift on would increase the dilution rate of DE, which lowers inferred value of while increases the growth function in the late universe. As to statistics, adding a free parameter () has negligible improvement on the goodness of the fit (see the third panel of Table 6). So effectively speaking, the TDE model is efficiently captured by a single parameter . As is shown in the last column of Table 6, we have compared the Bayesian evidence between TDE and TDE(2p) model. In the case of all datasets combination, we find indicating the weak evidence against TDE(2p).
Appendix C Planck TTTEEE Results
blackThe constraint results from the Planck 2018 low- TT+EE and Planck 2018 high- TT+TE+EE temperature and polarization power spectrum and several dataset combinations are tabulated in the last panel of Table 6, and the posterior distributions are shown in Fig. 10. Note that, the constraints on , and from Planck TT+TE+EE data closely matches the results obtained from the Planck distance prior.