Spin reorientation in tetragonally distorted spinel oxide NiCo2O4 epitaxial films
Abstract
We experimentally investigated the magnetic properties of NiCo2O4 epitaxial films known to be conductive oxides with perpendicular magnetic anisotropy (PMA) at room temperature. Both magneto-torque and magnetization measurements at various temperatures provide clear experimental evidence of the spin reorientation transition at which the MA changes from PMA to easy-cone magnetic anisotropy (ECMA) at a certain temperature (). ECMA was commonly observed in films grown by pulsed laser deposition and reactive radio frequency magnetron sputtering, although is dependent on the growth method as well as the conditions. The cone angles measured from the -axis increased successively at and approached a maximum of 45-50 degrees at the lowest measurement temperature of 5 K. Calculation with the cluster model suggests that the Ni3+ ions occupying the site could be the origin of the ECMA. Both the magnetic properties and the results of the calculation based on the cluster model indicate that the ECMA is attributable to the cation anti-site distribution of Ni3+, which is possibly formed during the growth process of the thin films.
I Introduction
NiCo2O4(NCO) is a conductive inverse spinel oxide () that exhibits ferrimagnetism with a Curie temperature as high as K Battle et al. (1979); Marco et al. (2000). Owing to the mixed valence of its cations, NCO can be expressed in terms of the following chemical formula: (), where the subscripts “tet” and “oct” represent the tetrahedral () and octahedral () sites, respectively. The sites are occupied by (; ) and (; ). On the other hand, the sites are occupied by (; ), (; ), and (; ). From the viewpoint of the number of -electrons at each site, the nominal saturation magnetization is 2 /f.u. irrespective of the value of , as long as the sites are only occupied by Co ions.
The mixed valence properties of NCO confer unique characteristics upon this transition metal oxide, such as relatively high electrical conductivity Silwal et al. (2013); Ndione et al. (2014); Bitla et al. (2015); Zhen et al. (2018), and electrochemical activity Wang et al. (2019). In particular, a large tunnel magnetoresistance effect has recently been reported in magnetic tunnel junctions fabricated using NCO electrodes, supporting the half-metallic natureNdione et al. (2014); Wang et al. (2019); Shen et al. (2020a). In addition, NCO(001) films grown on MgAl2O4 (MAO) substrates exhibited perpendicular magnetic anisotropy (PMA) Chen et al. (2019); Kan et al. (2020); Xue et al. (2020); Koizumi et al. (2021) of MJ/m3 at room temperature. The fact that both the half-metallicity and PMA are realized at once indicates that the NCO films possess good potential for application in spintronic devices. Mellinger et al. remarked that the PMA is due to the magneto-elastic effect, which is provided a semi-quantitative explanation for its attribution of the PMA to the compressive strain of to which Co at the sites is subjected as a result of epitaxial distortion Mellinger et al. (2020).
In this paper, we report that NCO films have spin reorientation (SR) transitions at low temperatures, that is, the magnetic anisotropy (MA) of the films changes from PMA to easy-cone magnetic anisotropy (ECMA). This suggests that the higher order term of the uniaxial MA must be considered at least in the low-temperature region. To elucidate the origin of the ECMA, we also performed tight-binding calculations for Co-O and Ni-O clusters of either the divalent or trivalent states at both the and sites. The results showed that the observed ECMA predominantly originated from the Ni3+ that occupy the sites, which is the anti-site disorder of cation distribution.
II Experiments
We prepared three epitaxial NCO films grown on single-crystal MAO(001) substrates by reactive radio frequency magnetron sputtering (ES-250MB, Eiko Engineering Co., Ltd.)Koizumi et al. (2019a, b) or pulsed laser deposition (Pascal Co., Ltd.). In the sputtering process, we used a 2-inch alloy target with a nominal composition of . The growth conditions of the NCO thin films by sputtering were as follows: the Ar and O2 flow rates were 10 and 2.5 sccm, respectively, and the input power was 100 W. The process temperature and working pressure were 300∘C and 1.3 Pa, respectively. The film thickness was determined to be 50 nm by X-ray reflectivity measurement. Hereafter, we refer to this NCO film as Sample . On the other hand, in the case of the PLD process, we used a NiCo2Ox ceramic target, which was ablated by a 6 Hz KrF excimer laser ( nm) with a laser spot density of 1.2 J/cm2, at a fixed substrate temperature of 315∘C, and under various oxygen partial pressures. Detailed process conditions can be found in Refs. Shen et al., 2020b, a; Suzuki et al., 2020. The NCO films prepared at an oxygen pressure of and 100 mTorr are denoted as Samples and , respectively. The film thicknesses of both Samples and were 30 nm.
Thin film structures were characterized by X-ray diffraction (XRD). Magnetic hysteresis (MH) loops and magnetic anisotropy constants were measured using a vibrating sample magnetometer (VSM) and magneto-torque meter, respectively. Both magnetic measurements were performed using a physical property measurement system (PPMS, Quantum Design).
III Results and discussion
III.1 Structural characterization
Figure 1 (a) shows the reciprocal space map (RSM) around the MAO Bragg reflections for each sample. All three films are tetragonally distorted by the MAO substrate. The in-plane lattice constant seems to be constrained by the MAO substrate as Å, whereas the out-of-plane () constant varies from sample to sample, namely Å (), 8.27 Å (), and 8.25 Å () for Samples , , and , respectively. The lattice parameter along the -axis varies from sample to sample, suggesting that the cation distribution varies according to the growth conditions of the films Shen et al. (2020b).
We also measured the temperature dependence of the lattice parameters for Sample , as shown in Fig. 1 (b). Both the in-plane and out-of-plane lattice constants and , determined from the NCO Bragg reflections, are less temperature dependent and are therefore similar to that of the ratio.

III.2 Magnetic properties
Figure 2 (a)-(c) shows the temperature dependence of loops in the presence of a magnetic field applied perpendicular to the film plane. All films exhibited square-shaped hysteresis loops at temperatures above 250 K, whereas the coercivity varies markedly among the samples. Moreover, with decreasing temperature, a stronger field is needed to saturate the magnetization at low temperatures in Samples and , meaning that the squareness of the hysteresis is reduced. The squareness ratio starts to decrease at a certain temperature, as shown in Fig. 2 (d). For example, the squareness ratio of Sample decreases from 200 K and almost constant below 70 K, and that of Sample starts decreasing at approximately 70 K. For Sample , however, the squareness ratio appears to be close to 1 at all measured temperatures. The squareness ratios at 30 K, the lowest temperature at which we performed measurements, are 0.99, 0.81, and 0.73 for , and , respectively (see the inset of Fig. 2 (d)). The squareness at lower temperatures is obviously smaller for Samples and , although the curves of none of the three films exhibited any anomalies.
Figure 2 (e) shows the temperature dependence of the saturation magnetization , with higher values being observed for samples with higher Curie temperature (). Because and are simply associated with the strength of the exchange interaction and the difference in the magnetic moments between the and sites, respectively, the clear positive correlation between and indicates that the distribution of both Co and Ni at both the and sites changes with the growth conditions. In fact, according to a recent structural analysis of NCO films, the amount of cation distribution defects or anti-site defects characteristic of NCO films is non-negligible Shen et al. (2020b).
Figure 2 (f) shows the loops of Sample with the magnetic field parallel to the film plane. These results reveal that the loops became rounded and the area corresponding to tended to be smaller as the temperature decreases. Considering the lowest order term of MA, these results indicate that the effective MA decreases at low temperatures. Note that this does not occur in conventional ferromagnetic or ferrimagnetic materials; therefore, a detailed evaluation of MA must be carried out, especially at low temperatures.

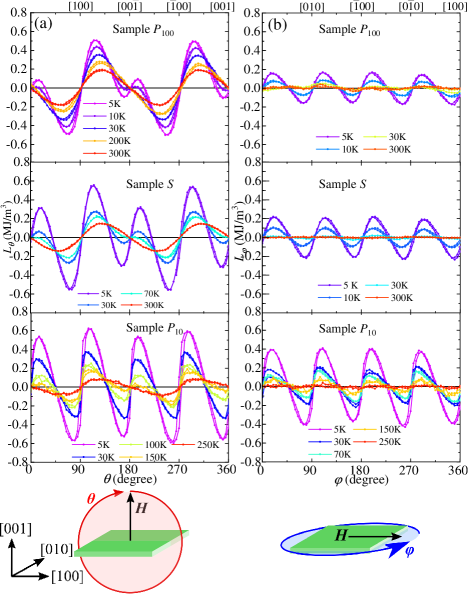
The magneto-torque curves of the -plane (around the -axis, ) and of the -plane (around the -axis; ) from room temperature to 5 K taken under T are shown in Fig. 3. As shown in Fig. 3 (a), the shape of at high temperatures exhibit two-fold component crossing zero with a negative slope at and degree, indicating the preferential magnetization directions of the films correspond to the direction normal to the film plane, which is consistent with previous reports Kan et al. (2020); Mellinger et al. (2020). However, four-fold components appear in the torque curves with decreasing temperature. The existence of four-fold components means that the higher-order terms in uniaxial MA are crucial for understanding the preferential magnetization directions Chikazumi and Graham (1997).
In the curves shown in Fig. 3 (b), on the other hand, the torque signals are observed only at low temperature and are weaker than those of , meaning that the out-of-plane uniaxial components are dominant in the NCO films.
In tetragonal crystal systems, the magnetic anisotropy energy () and magneto-torque for the -plane () and -plane () can be written as follows Chikazumi and Graham (1997); Coey (2010):
| (1) | |||||
| (2) | |||||
| (3) |
where and are the uniaxial magnetic anisotropy constants for the second- and fourth-order terms, respectively, and is the cubic anisotropy constant. Further, and represent the angles between the direction of the applied field and the - and -axes, respectively. The observed comprises both magnetic anisotropy contributions from magnetocrystalline anisotropy and shape anisotropy , i.e., . The MA constants enable us to determine the shape of the preferential directions of the net magnetization Chikazumi and Graham (1997), and these results are provided in Table 1.
![[Uncaptioned image]](/html/2105.04115/assets/PMA.png)
|
![[Uncaptioned image]](/html/2105.04115/assets/IMA.png)
|
![[Uncaptioned image]](/html/2105.04115/assets/ECMA.png)
|
|
|---|---|---|---|
| Perpendicular | In-plane | Easy-cone | |
| magnetic | magnetic | magnetic | |
| anisotropy | anisotropy | anisotropy | |
| (PMA) | (ECMA) | ||
Figure 4 (a) shows the MA constants determined by fitting the torque curve using Eq. (2), (3). The values of were positive at high temperatures and the sign changes to negative as the temperature decreases. In contrast, the values of were positive at all temperatures. Moreover, the absolute values of both and increased suddenly and drastically when the temperature reached a certain point and this depended on samples. On the other hand, is much weaker than the out-of-plane terms of both and . Because for all temperature ranges, if NCO exhibits PMA (see Table 1) Chikazumi and Graham (1997). In contrast, when changes its sign from positive to negative, spin reorientation occurs, and the NCO exhibits ECMA. Hereafter, we refer to the temperature at which becomes as the spin-reorientation transition temperature (). The values of for all samples are listed in Table 2. It should also be noted that the temperature at which the squareness ratio begins to decrease is close to the value of determined by the torque measurements, indicating that the change in the squareness ratio is attributed to the change in MA. In addition, the cone angle determined from the magneto-torque is in good agreement with that estimated from the squareness ratio, as shown in Fig. 2 (d).
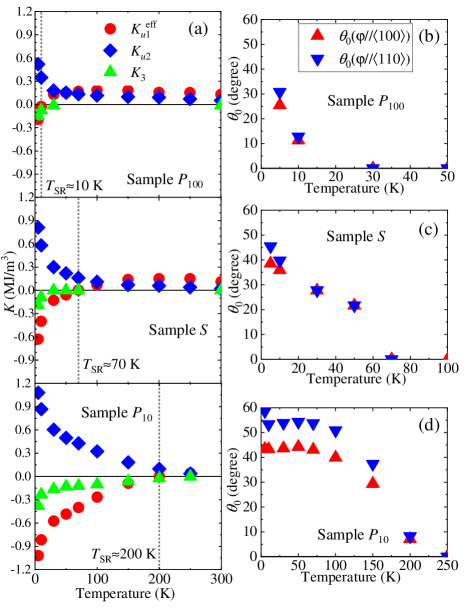
By considering , the cone angle measured from the -axis can be expressed as
| (4) |
Figure 4 (b)-(d) show the temperature dependence of , determined from Eq. (4), for the three samples. As the temperature decreases, continuously increases from to a finite value. We note that for the MA of Co2Y-hexaferrite was reported to exhibit similar behavior Smit and Wijn (1959).
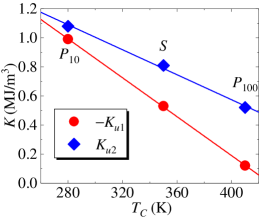
The saturation magnetization extrapolated to 0 K (), , , and the values of for each sample are summarized in Table 2. The films with higher exhibit larger values and lower . Moreover, the MA constants seem to be linearly correlated with , as shown in Fig. 5. On the other hand, at approximately room temperature, the sample with higher exhibits stronger PMA, as shown in Fig. 4. According to a previous study Shen et al. (2020b), is higher for NCO films with less anti-site disorder. In contrast, our experimental results suggest that samples with lower have stronger ECMA and higher . Therefore, ECMA seems to be associated with samples with off-stoichiometric compositions or anti-site distributions Shen et al. (2020b), which is consistent with the fact that no sign of a non-collinear spin structure was apparent even at 4.2 K in a stoichiometric powder sample of NCO by neutron diffraction Battle et al. (1979). Although varies from sample to sample, the ECMA emerges at low temperatures regardless of the sample preparation technique, indicating that ECMA generally emerges at low temperatures in tetragonally distorted NCO films.
| Sample | |||
|---|---|---|---|
| (/f.u.) | 2.2 | 2.0 | 1.6 |
| (MJ/m3) | |||
| (MJ/m3) | |||
| (K) | |||
| (K) |
III.3 Electron theory
To understand the origin of the relatively large component bearing ECMA, we performed a numerical calculation to evaluate the MA of each ion present in tetragonally distorted NCO within the framework of the cluster model Inoue et al. (2014a, b). Because of the presence of site-distribution disorders, we performed the calculations for eight different clusters using four ions, Co2+, Co3+, Ni2+, and Ni3+, which occupy either the or sites. Then, we estimated the total MA by considering plausible site distributions.
The electronic structure of the cluster was calculated using a tight-binding model for the 3- and 2-orbitals of the transition metal and oxygen ions, respectively, and by including the spin-orbit interaction (SOI). We assumed that the 3-states of the Co and Ni ions are fully spin-polarized, and that the ions have local moments. The parameters of the inter-site - hopping between the 3-orbitals of a transition metal ion and the 2-orbitals of the oxygen ions were obtained from Harrison’s textbook Harrison (1980); Inoue (2015). The ground state energy was calculated by diagonalizing the Hamiltonian as a function of the magnetization direction. The lattice constant and Wyckoff position of NCO were obtained from a previous report Battle et al. (1979). The electron configurations and SOIs for each ion are summarized in Table 3.
| Ion | Co2+ | Co3+ | Ni2+ | Ni3+ | O2- |
|---|---|---|---|---|---|
| Electron | |||||
| SOI (meV) | 20 | 30 | 30 | 30 | — |
In the calculation, we assumed that the Ni3+ ions occupying the site are in a low-spin state of Bitla et al. (2015). We excluded the calculation of Co3+ in the site because of the low spin state of . To satisfy the above conditions, the Coulomb potential was set to be 0.05 eV for Ni in the site, whereas the potential for the others was eV.
Figure 6 (a) and (b) show the angle-dependent energy of the magnetic moment () at the and sites, respectively. The preferential spin direction of Co3+ at the site is parallel to the -axis, which is consistent with previous tight-binding calculations Mellinger et al. (2020). On the other hand, those of Co2+ at the site and Ni2+ at the site are preferentially orientated in the -plane. of Ni3+ at the site has a large with a minimum of approximately 45 and 135 degree; therefore, it could be the origin of the ECMA.

Next, we attempted to deduce the total MA by considering the site distribution. Because the positive possibly originates from Ni3+ at the site, we need to introduce the anti-site disorders of Ni3+ at the sites in our calculation. In fact, according to recent experimental research Shen et al. (2020b), approximately 10-20% of the anti-site disorders are present at the site in the NCO films regardless of the growth conditions. To estimate the total , we assumed the cation distributions listed in Table 4. The distribution satisfies the assumption that the ratio of atoms is , and the total valence becomes zero.
| Site | ||||||
|---|---|---|---|---|---|---|
| Ion | Co2+ | Co3+ | Ni3+ | Co3+ | Ni2+ | Ni3+ |
| 3/2 | 2 | 3/2 | 0 | 1 | 1/2 | |
| Occupancy | 0.85 | 0.0 | 0.15 | 1.15 | 0.15 | 0.70 |
Figure 6 (c) shows the results of the calculation of the total MA that takes into account the cation distribution in Table 4. By fitting the total using Eq. (1), we obtain MJ/m3 ( meV/f.u.), and MJ/m3(0.59 meV/f.u.). Because and , the calculated result qualitatively reproduces the ECMA. Note that both and are in relatively good agreement with the experimentally obtained values, and especially closely approximate those for Sample , as in Table 2. According to the site/ion dependencies of shown in Fig. 6 (a) and (b), the small amount of Ni3+ that occupies the site is a key component responsible for the ECMA.
IV Conclusion
We investigated the lattice distortions and magnetic properties of epitaxial NCO films grown on MAO(001) substrates by magnetron sputtering and PLD. Although the NCO films exhibited PMA at room temperature, the magneto-torque experiments revealed that the NCO films exhibited ECMA below , regardless of the preparation technique. The observed spin reorientation seemed to occur continuously at , and the cone angle increased with decreasing temperature. and are strongly dependent on the conditions under which the film was grown, suggesting that these conditions affect the distribution of the different cations. The proposed electron theory based on the cluster model successfully explains the origin of the ECMA, which is attributed to the Ni3+ that occupy the site. The results of both the experimental and cluster model calculations suggest that the ECMA is the result of the cation anti-site distribution of Ni3+ associated with the growth conditions of the thin film. Although we succeeded in reproducing the ECMA within the framework of the cluster model calculation, the reason for the change in the sign of at remains to be solved. The mechanism of the spin reorientation transition could be related to the mixed-valence nature of NCO.
Acknowledgements.
This project is partly supported by the Japan Science and Technology Agency (JST) under collaborative research based on industrial demand “High Performance Magnets: Towards Innovative Development of Next Generation magnets” (JP-MJSK1415), KAKENHI(19KK0104, 19H05816, 21H01810) , the Ibaraki University-Tsukuba Joint Coordination Fund, and the Tanigawa Fund Promotion of Thermal Technology. This work was performed with the approval of the “Photon Factory Program Advisory Committee” (proposals No.2017G602 and No.2016S2-005). This work was also supported by the Japan Society for the Promotion of Science (JSPS) “Core-to-Core program (A)” Advanced Research Networks by a grant from the Integrated Research Consortium on Chemical Sciences and the International Collaborative Research Program of the Institute for Chemical Research at Kyoto University from the Ministry of Education, Culture, Sports, Science and Technology (MEXT)” of Japan. H. K. acknowledges support in the form of a Grant-in-Aid for JSPS Fellows (20J10749). H. K. thanks T. Oki for his cooperation.References
- Battle et al. (1979) P. Battle, A. Cheetham, and J. Goodenough, Materials Research Bulletin 14, 1013 (1979).
- Marco et al. (2000) J. Marco, J. Gancedo, M. Gracia, J. Gautier, E. Ríos, and F. Berry, Journal of Solid State Chemistry 153, 74 (2000).
- Silwal et al. (2013) P. Silwal, L. Miao, J. Hu, L. Spinu, D. Ho Kim, and D. Talbayev, Journal of Applied Physics 114, 103704 (2013).
- Ndione et al. (2014) P. F. Ndione, Y. Shi, V. Stevanovic, S. Lany, A. Zakutayev, P. A. Parilla, J. D. Perkins, J. J. Berry, D. S. Ginley, and M. F. Toney, Advanced Functional Materials 24, 610 (2014).
- Bitla et al. (2015) Y. Bitla, Y.-Y. Chin, J.-C. Lin, C. N. Van, R. Liu, Y. Zhu, H.-J. Liu, Q. Zhan, H.-J. Lin, C.-T. Chen, Y.-H. Chu, and Q. He, Scientific Reports 5, 15201 (2015).
- Zhen et al. (2018) C. Zhen, X. Zhang, W. Wei, W. Guo, A. Pant, X. Xu, J. Shen, L. Ma, and D. Hou, Journal of Physics D: Applied Physics 51, 145308 (2018).
- Wang et al. (2019) M. Wang, X. Sui, Y. Wang, Y.-H. Juan, Y. Lyu, H. Peng, T. Huang, S. Shen, C. Guo, J. Zhang, Z. Li, H.-B. Li, N. Lu, A. T. N’Diaye, E. Arenholz, S. Zhou, Q. He, Y.-H. Chu, W. Duan, and P. Yu, Advanced Materials 31, 1900458 (2019).
- Shen et al. (2020a) Y. Shen, D. Kan, I. Lin, M. Chu, I. Suzuki, and Y. Shimakawa, Applied Physics Letters 117, 042408 (2020a).
- Chen et al. (2019) X. Chen, X. Zhang, M.-G. Han, L. Zhang, Y. Zhu, X. Xu, and X. Hong, Advanced Materials 31, 1805260 (2019).
- Kan et al. (2020) D. Kan, M. Mizumaki, M. Kitamura, Y. Kotani, Y. Shen, I. Suzuki, K. Horiba, and Y. Shimakawa, Physical Review B 101, 224434 (2020).
- Xue et al. (2020) M. Xue, X. Chen, S. Ding, Z. Liang, Y. Peng, X. Li, L. Zha, W. Yang, J. Han, S. Liu, H. Du, C. Wang, and J. Yang, ACS Applied Electronic Materials 2, 3964 (2020).
- Koizumi et al. (2021) H. Koizumi, A. Hidaka, T. Komine, and H. Yanagihara, Journal of the Magnetics Society of Japan 45, 37 (2021).
- Mellinger et al. (2020) C. Mellinger, J. Waybright, X. Zhang, C. Schmidt, and X. Xu, Physical Review B 101, 014413 (2020).
- Koizumi et al. (2019a) H. Koizumi, S. Sharmin, K. Amemiya, M. Suzuki-Sakamaki, J. Inoue, and H. Yanagihara, Physical Review Materials 3, 024404 (2019a).
- Koizumi et al. (2019b) H. Koizumi, J. Inoue, and H. Yanagihara, Physical Review B 100, 224425 (2019b).
- Shen et al. (2020b) Y. Shen, D. Kan, Z. Tan, Y. Wakabayashi, and Y. Shimakawa, Physical Review B 101, 094412 (2020b).
- Suzuki et al. (2020) I. Suzuki, D. Kan, M. Kitamura, Y. Shen, K. Horiba, and Y. Shimakawa, Journal of Applied Physics 127, 203903 (2020).
- Chikazumi and Graham (1997) S. Chikazumi and C. D. Graham, Physics of ferromagnetism (Oxford ; New York : Oxford University Press, 1997).
- Coey (2010) J. M. D. Coey, Magnetism and Magnetic Materials (Cambridge University Press, 2010).
- Smit and Wijn (1959) J. Smit and H. P. J. Wijn, Ferrite (Philips technical library, 1959).
- Inoue et al. (2014a) J. Inoue, H. Yanagihara, and E. Kita, Materials Research Express 1, 046106 (2014a).
- Inoue et al. (2014b) J. Inoue, T. Niizeki, H. Yanagihara, H. Itoh, and E. Kita, AIP Advances 4, 027111 (2014b).
- Harrison (1980) W. A. Harrison, Electronic Structure and the Properties of Solids (Dover Publications, 1980).
- Inoue (2015) J. Inoue, Journal of Physics D: Applied Physics 48, 445005 (2015).