Analyzing Online Political Advertisements
Abstract
Online political advertising is a central aspect of modern election campaigning for influencing public opinion. Computational analysis of political ads is of utmost importance in political science to understand the characteristics of digital campaigning. It is also important in computational linguistics to study features of political discourse and communication on a large scale. In this work, we present the first computational study on online political ads with the aim to (1) infer the political ideology of an ad sponsor; and (2) identify whether the sponsor is an official political party or a third-party organization. We develop two new large datasets for the two tasks consisting of ads from the U.S.. Evaluation results show that our approach that combines textual and visual information from pre-trained neural models outperforms a state-of-the-art method for generic commercial ad classification. Finally, we provide an in-depth analysis of the limitations of our best-performing models and linguistic analysis to study the characteristics of political ads discourse.111Data is available here: https://archive.org/details/pol_ads
1 Introduction
Online advertising is an integral part of modern digital election campaigning Fulgoni et al. (2016); Fowler et al. (2020a). The increased spending on online political ads (e.g. the 2020 U.S. election campaign spending hit an all-time record222https://www.cnbc.com/2020/10/01/election-2020-campaign-spending-set-to-hit-record-11-billion.html) poses a significant challenge to the democratic oversight of digital campaigning,333https://www.electoral-reform.org.uk/latest-news-and-research/publications/democracy-in-the-dark-digital-campaigning-in-the-2019-general-election-and-beyond/ with serious implications about transparency and accountability, for example how voters are targeted and by whom (Kriess and Barrett, 2020).
Political advertising is defined as ‘any controlled message communicated through any channel designed to promote the political interests of individuals, parties, groups, government, or other organizations’ Kaid and Holtz-Bacha (2006). It is guided by ideology and morals Scammell and Langer (2006); Kumar and Pathak (2012), and often expresses more negativity Haselmayer (2019); Iyengar and Prior (1999); Lau et al. (1999) compared to the aesthetic nature of commercial advertising. Table 1 shows examples of online political ads across different political parties and sponsor types.
|
Ad Sponsor Type | Sample Ad | ||
|---|---|---|---|---|
| Liberal | Political Party |
![[Uncaptioned image]](/html/2105.04047/assets/images/15402592267325691000.png)
|
||
| Conservative | Political Party |
|
||
| N/A | Third-Party |
|
While the closely related online commercial advertising domain has recently been explored in natural language processing (NLP) for predicting the category (e.g. politics, cars, electronics) and sentiment of an ad Hussain et al. (2017); Kalra et al. (2020), online political advertising has yet to be explored. Large-scale studies of online political advertising have so far focused on understanding targeting strategies rather than developing predictive models for analyzing its content Edelson et al. (2019); Medina Serrano et al. (2020).
Automatically analyzing political ads is important in political science for researching the characteristics of online campaigns (e.g. voter targeting, sponsors, non-party campaigns, privacy, and misinformation) on a large scale Scammell and Langer (2006); Johansson and Holtz-Bacha (2019). Moreover, identifying ads sponsored by third-party organizations is critical to ensuring transparency and accountability in elections Liu et al. (2013); Speicher et al. (2018); Fowler et al. (2020b); Edelson et al. (2019). For example, third-party advertising had an increased presence in the U.S. House and Senate races in 2018 considerably more than in 2012 where almost half of the third-party sponsored ads were funded by dark-money sources (Fowler et al., 2020b). Finally, computational methods for political ads analysis can help linguists to study features of political discourse and communication Kenzhekanova (2015); Skorupa and Dubovičienė (2015).
In this paper, we present a systematic study of online political ads (consisting of text and images) in the U.S. to uncover linguistic and visual cues across political ideologies and sponsor types using computational methods for the first time. Our contributions are as follows:
-
1.
A new classification task for predicting the political ideology (conservative or liberal) of an ad (3). We collect 5,548 distinct political ads in English from 242 different advertisers in the U.S., and label them according to the dominant political ideology of the respective sponsor’s party affiliation (Liberal or Conservative);
-
2.
A new classification task to automatically classify ads that were sponsored by official political parties and third-party organizations, such as businesses and non-profit organizations (3). For this task, we extract 15,116 advertisements in English from 665 distinct advertisers in the U.S., and label them as Political Party (i.e. officially registered) and Third-Party (i.e. other organizations) following Fowler et al. (2020b);
- 3.
-
4.
Analysis of textual and visual features of online political ads (7) and error analysis to understand model limitations.
2 Related Work
2.1 Political Communication and Advertising
Previous work on analyzing political advertising has covered television and online ads Kaid and Postelnicu (2005); Reschke and Anand (2012); West (2017); Fowler et al. (2020b). Ridout et al. (2010) analyze a series of YouTube videos posted during the 2008 presidential campaign to understand its influence on election results as well as the actors and formats compared to traditional television ads. Anstead et al. (2018) study how online platforms such as Facebook are being used for political communication and identify challenges for understanding the role of these platforms in political elections, highlighting the lack of transparency (Caplan and Boyd, 2016). Fowler et al. (2020b) explore differences between television and online ads, and demonstrate that there is a greater number of candidates advertising online than on television.
2.2 Political Ideology Prediction
Inferring the political ideology of various types of text including news articles, political speeches and social media has been vastly studied in NLP Lin et al. (2008); Gerrish and Blei (2011); Sim et al. (2013); Iyyer et al. (2014); Preoţiuc-Pietro et al. (2017); Kulkarni et al. (2018); Stefanov et al. (2020). Bhatia and P (2018) exploit topic-specific sentiment analysis for ideology detection (i.e. conservative, liberal) in speeches from the U.S. Congress. Kulkarni et al. (2018) propose a multi-view model that incorporates textual and network information to predict the ideology of news articles. Johnson and Goldwasser (2018) investigate the relationship between political ideology and language to represent morality by analyzing political slogans in tweets posted by politicians. Maronikolakis et al. (2020) present a study of political parody on Twitter focusing on the linguistic differences between tweets shared by real and parody accounts. Baly et al. (2019) estimate the trustworthiness and political ideology (left/right bias) of news sources as a multi-task problem. Stefanov et al. (2020) develop methods to predict the overall political leaning (left, center or right) of online media and popular Twitter users.
Political ideology and communicative intents have also been studied in computer vision. Political images have been analyzed to infer the persuasive intents using various features such as facial display types, body poses, and scene context Joo et al. (2014); Huang and Kovashka (2016); Joo and Steinert-Threlkeld (2018); Bai et al. (2020); Chen et al. (2020). Joo et al. (2015) introduce a method that infers the perceived characteristics of politicians using face images and show that those characteristics can be used in elections forecasting. Xi et al. (2020) analyze the political ideology of Facebook photographs shared by members of the U.S. Congress. Chen et al. (2020) examine the role of gender stereotypical cues from photographs posted in social media by political candidates and their relationship to voter support.
2.3 Computational Analysis of Online Ads
Hussain et al. (2017) propose the task of ad understanding using vision and language. The aim is to predict the topical category, sentiment and rhetoric of an ad (i.e. what the message is about). The latter task has been approached as a visual question-answering task by ranking human generated statements that explain the intent of the ad in computer vision Ye and Kovashka (2018); Ahuja et al. (2018). More recently in NLP, Kalra et al. (2020) propose a BERT-based (Devlin et al., 2019) model for this task using the text and visual descriptions of the ad Johnson et al. (2016). Thomas and Kovashka (2018) study the persuasive cues of faces across ad categories (e.g. beauty, clothing). Zhang et al. (2018) explore the relationship between the text of an ad and the visual content to analyze the semantics across modalities. Ye et al. (2018) integrates audio and visual modalities to predict the climax of an advertisement (i.e. stress levels) using sentiment annotations.
| Sample Ad |
![[Uncaptioned image]](/html/2105.04047/assets/images/T1/CR287751744996245504.png)
|
|---|---|
| Image Text | FIGHTING FOR WORKING FAMILIES, FOR GOOD JOBS, AND FAIR PAY. PAID FOR BY DEFAZIO FOR CONGRESS |
| Densecap | the man is wearing glasses, a man holding a red tie, the background is blue |
3 Tasks & Data
We aim to analyze the political ideology of ads consisting of image and text, and the type of the ad sponsor for the first time. To this end, we present two new binary classification tasks motivated by related studies in political communication (Grigsby, 2008; Fowler et al., 2020b):
-
•
Task 1: Conservative/Liberal The aim is to label an ad according to the political party that sponsored the ad either as Conservative (i.e. assuming that the dominant ideology of the Republican Party is conservatism), or Liberal (i.e. assuming that the dominant ideology of the Democratic Party is social liberalism) (Grigsby, 2008);
-
•
Task 2: Political Party/Third-Party The goal is to classify an ad according to the type of the organization that sponsored the ad. We distinguish between ads sponsored by official political parties and non-political organizations, such as businesses and non-profit groups, following Fowler et al. (2020b).
To the best of our knowledge, no datasets are available for modeling these two tasks. Therefore, we develop two new publicly available datasets consisting of political ads and ideology/sponsor type labels from the U.S.. We opted to use data only from the U.S. because its Federal Election Commission444https://www.fec.gov/ (FEC) provides publicly available information of political ads sponsors such as official political parties (e.g. Democratic, Republican) via their FEC ID; and third-party organizations can be identified via their Employer Identification Number555https://www.irs.gov/businesses/small-businesses-self-employed/do-you-need-an-ein (EIN) suitable for our study.
3.1 Collecting Online Political Ads
We use the public Google transparency report platform666https://transparencyreport.google.com/political-ads/region/US to collect political ads. This platform contains information on verified political advertisers (i.e. sponsors) and provides links to actual political ads from Google Ad Services.
We collect all U.S. available data from the Google platform consisting of ads published from May 31, 2018 up to October 11, 2020 (note that there is no data prior to 2018). This corresponds to a total of 168,146 image ads. Each ad is associated with a URL that links to its summary metadata consisting of a URL to the original image file and sponsor information, i.e. name and FEC ID, state elections registration or EIN ID.777All ad sponsors must apply for eligibility verification in order to publish political ads on Google platforms - https://support.google.com/displayvideo/answer/9014141
We scrape all available image files resulting into a total of 158,599 ads which corresponds to 94.32% of all ads in the Google database. The rest of the ads were either not available due to violations to Google’s Advertising Policy, the summary metadata was missing, or the file URL was not included in the metadata.
3.2 Extracting Text and Visual Information
Before, we label the ads with ideology and sponsor type, we extract two types of information from the images: (1) the text contained in each ad (Image Text; IT) using the Google Vision API;888https://cloud.google.com/vision/docs/ocr and (2) the descriptive caption or denscap (D) of the image using the DenseCap API,999https://deepai.org/machine-learning-model/densecap following the method proposed by Kalra et al. (2020) for commercial ad classification. This way, we obtain both the actual text appearing on the ad and the textual descriptions of the ad such as entities in the images, their characteristics and relationships. Table 2 shows an example of an ad consisting of an image, text information and the densecap.
We use the textual and visual information to eliminate all duplicate images by comparing the URL of the image, its text and densecap. Finally, we filter out all ads that contain non-English text (i.e. IT).101010https://pypi.org/project/langdetect/ This results in 15,116 unique ads from 665 unique ad sponsors.
3.3 Labeling Ads with Political Ideology
Our aim is to label political ads as Conservative or Liberal (see Task 1 description). First, we retrieve all the ad sponsors and their corresponding ads that are available in the Google Ads database. Official political committees associated with the Democratic or Republican parties are identified by their FEC ID (included in the sponsor’s information in the Google database). However, the name of the political party associated with a sponsor is not available in the Google database. Thus, we query the FEC database to obtain the affiliation for all committees of the Democratic and Republican parties (e.g. Donald J. Trump for President, Inc.). Then, we compare this information with the Google database (FEC ID and exact name), to assign the corresponding affiliation to the sponsors. For example an ad sponsored by the ‘Donald J. Trump for President, Inc.’ official committee is labeled as Republican and subsequently as Conservative (in a similar way we label ads for the Liberal class).
In total, we collect 242 unique sponsors corresponding to 5,548 ads. Liberal ads represent the 39% of the total ads and the rest are Conservative (61%).
3.4 Labeling Ads with Sponsor Type
We first label all ads from sponsors that have an associated FEC ID in the Google database as Political Party. These sponsors correspond to official political committees affiliated with the Democratic or Republican parties (e.g. Biden for President).
Third-party sponsors of political ads consist of groups not officially associated to any political party such as not-for-profit organizations (e.g. NRDC Action Fund) and businesses Fowler et al. (2020b). This type of sponsors are identified with their EIN ID (included in the Google database). Thus, we label all ads linked to an EIN ID as Third-Party. We collected a total of 15,116 ads where 37% corresponds to Political Party and 63% corresponds to Third-Party.
3.5 Data Splits
We split both datasets chronologically into train (80%), development (10%), and test (10%) sets. Table 3 shows the dataset statistics and splits for each task.
3.6 Data Preprocessing
Text
We normalize the text from the image (IT) and the densecap (D) by lower-casing, and replacing all URLs and person names with a placeholder token. To identify the person names we use the Stanford NER Tagger Finkel et al. (2005). Also, we replace tokens that appear in less than five ads with an ‘unknown’ token. We tokenize the text using the NLTK tokenizer (Bird et al., 2009). Table 4 shows the average number of tokens in IT and D for each data split.
Image
Each image is resized to () pixels represented by red, green and blue color values. Each color channel is an integer in the range [0, 255]. The pixel values of all images are dived by 255 to normalize them in the range [0, 1].
| T1: Liberal/Conservative | ||||
|---|---|---|---|---|
| Train | Dev | Test | Total | |
| C | 2,576 (58%) | 369 (69%) | 453 (75%) | 3,398 (61%) |
| L | 1,835 (42%) | 165 (31%) | 150 (25%) | 2,150 (39%) |
| All | 4,411 (79.5%) | 534 (9.6%) | 603 (10.9%) | 5,548 (100%) |
| Start | 05-31-18 | 02-01-20 | 07-04-20 | - |
| End | 01-30-20 | 06-30-20 | 10-10-20 | - |
| T2: Political Party/Third-Party | ||||
| Train | Dev | Test | Total | |
| PP | 4,663 (39%) | 324 (21%) | 561 (37%) | 5,548 (37%) |
| TP | 7,427 (61%) | 1,188 (79%) | 953 (63%) | 9,568 (63%) |
| All | 12,090 (80%) | 1,512 (10%) | 1,514 (10%) | 15,116 (100%) |
| Start | 05-31-18 | 04-14-20 | 07-20-20 | - |
| End | 04-13-18 | 07-19-20 | 10-11-20 | - |
| Avg. Tokens (Train/Dev/Test) | |||||
|---|---|---|---|---|---|
| Task |
|
D |
|
||
| T1 | 17.1/16.5/17.1 | 38.3/39.9/36.9 | 55.4/56.4/54.0 | ||
| T2 | 16.2/17.6/19.2 | 36.7/38.9/37.2 | 52.9/56.5/56.4 | ||
4 Predictive Models
We experiment with textual, visual and multimodal models for political ad classification.
4.1 Linear Baselines
As baseline models, we use logistic regression with bag of n-grams and L2 regularization using (1) the image text (LRIT); (2) densecap (LRD); and (3) their concatenation (LRIT+D) for representing each ad.
4.2 BERT
We also test three models proposed by Kalra et al. (2020) for generic ad classification demonstrating state-of-the-art performance. The models are based on Bidirectional Encoder Representations from Transformers (BERT) Devlin et al. (2019) using a combination of the image text and the densecap. We follow a similar approach and fine-tune BERT for predicting the corresponding class in each task by adding an output dense layer for binary classification that receives the ‘classification’ [CLS] token as input. We use three types of inputs for each ad: (1) image text (BERTIT); (2) densecap (BERT; and (3) their concatenation (BERTIT+D).
4.3 EfficientNet
EfficientNet Tan and Le (2019) is a family of Convolutional Neural Network (CNN) LeCun et al. (1995) models which has achieved state-of-the-art accuracy on ImageNet Deng et al. (2009). In particular, we use EfficientNet-B3 and fine-tune it on political ad classification by adding an output dense layer for each binary classification task.
4.4 BERT+EffN
We finally test two multimodal models by combining: (1) BERTIT and EfficientNet (BERTIT+EffN); and (2) BERTIT+D and EfficientNet (BERTIT+D+EffN). We concatenate the text representation obtained by BERT and the visual information from EfficientNet into a dimensional vector from BERT and EfficientNet respectively. This vector is then passed to an output layer for binary classification. We fine-tune the entire architecture for each task.
| T1: Conservative/Liberal | |||
| Model | P | R | F1 |
| Majority | 50.00 (0.00) | 37.56 (0.00) | 42.90 (0.00) |
| LRD | 55.76 (0.85) | 54.91 (0.89) | 54.85 (1.12) |
| LRIT | 78.38 (0.70) | 71.99 (0.56) | 72.65 (0.73) |
| LRIT+D | 72.57 ( 1.03) | 71.52 (0.62) | 71.99 (0.79) |
| Kalra et al. (2020) | |||
| BERTD | 59.40 (0.78) | 57.77 (0.98) | 57.64 (1.52) |
| BERTIT | 72.88 (0.24) | 73.46 (0.16) | 73.16 (0.20) |
| BERTIT+D | 78.62 (3.14) | 74.08 (2.81) | 75.49 (3.01) |
| EfficientNet | 69.02 (3.48) | 67.87 (1.23) | 68.15 (1.89) |
| Ours | |||
| BERTIT+EffN | 74.99 (1.23) | 72.01 (2.27) | 73.02 (2.07) |
| BERTIT+D+EffN | 80.24 (0.06) | 74.59 (1.70) | 75.76 (2.19) |
5 Experimental Setup
We select the hyperparameters for all neural models using early stopping by monitoring the validation binary cross-entropy loss, and we estimate the class weights using the ’balanced’ heuristic King and Zeng (2001) for each task, as both datasets are imbalanced. BERT and EfficientNet models use ADAM optimizer Kingma and Ba (2014), and experiments use 1 GPU (Nvidia V100).
LR
For LR we use bag of n-grams with , {(1,1),(1,2),(1,3)} weighted by TF.IDF and L2 regularization. The average training time is 30 seconds.
BERT
We fine-tune BERT for 20 epochs and choose the epoch with the lowest validation loss. We use the pre-trained base-uncased model for BERT Vaswani et al. (2017); Devlin et al. (2019) from HuggingFace implementation (12-layer 768-dimensional) trained on English Wikipedia Wolf et al. (2019). The maximal sequence length is 512 tokens. We fine-tune BERT for 2 epochs and learning rate for ideology prediction; and for advertiser type prediction with . The average training time is 8.1 minutes.
EfficientNet
We use EfficientNet-B3 with Noisy-Student weights Xie et al. (2020). For ideology prediction, we first freeze the layers of the EfficientNet Tan and Le (2019) model and train it for 11 epochs with learning rate to learn the parameters of the output layer. We then unfreeze and train the whole network for another 30 epochs with , as it has been shown that unfreezing the CNN during the latter stages of training improves the performance of the network Faghri et al. (2017). For predicting the type of sponsor, we train for 45 epochs and keeping the EfficientNet layers frozen. Unfreezing the base model did not result into lower validation loss. We use dropout rate of 0.2 before passing the output of EfficientNet to the classification layer. The average training time is 37.8 minutes.
BERT+EffN
For ideology prediction, we freeze all the layers of the pre-trained models (BERT and EfficientNet) apart from the classification layer and train for 27 epochs with . We then fine-tune BERT for 30 epochs with . For sponsor type prediction, we freeze all EfficientNet layers and fine-tune BERT for 30 epochs with . We train in stages to ensure that the parameters of each part of the model (textual and visual) are properly updated Kiela et al. (2019). The average training time is 56.65 minutes.
| T2: Political Party/Third-Party | |||
| Model | P | R | F1 |
| Majority | 50.00 (0.00) | 31.47 (0.00) | 38.62 (0.00) |
| LRD | 53.60 (0.72) | 53.40 (0.65) | 53.11 (0.58) |
| LRIT | 84.02 (0.14) | 85.04 (0.31) | 84.47 (0.18) |
| LRIT+D | 86.46 (0.13) | 86.63 (0.09) | 86.54 (0.05) |
| Kalra et al. (2020) | |||
| BERTD | 56.50 (0.89) | 56.31 (0.78) | 53.45 (1.26) |
| BERTIT | 85.57 (0.86) | 86.42 (2.01) | 85.86 (1.23) |
| BERTIT+D | 87.00 (0.89) | 86.81 (0.83) | 86.90 (0.86) |
| EfficientNet | 53.27 (2.86) | 53.93 (2.40) | 51.53 (5.46) |
| Ours | |||
| BERTIT+EffN | 87.02 (2.74) | 85.81 (0.20) | 86.29 (1.11) |
| BERTIT+D+EffN | 86.78 (0.03) | 88.18 (1.10) | 87.36 (0.39) |
6 Results
This section presents the experimental results for the two predictive tasks, political ideology and sponsor type prediction (3) using the methods described in 4. We evaluate our models using macro precision, recall and F1 score since the data in both tasks is imbalanced. Note that for all models we report the average and standard deviation over three runs using different random seeds. We also report the majority class baseline for each task.
6.1 Predictive Performance
Task 1: Conservative/Liberal
Table 5 shows the results for the political ideology prediction. We first observe that BERTIT (73.16%) which uses as input information the image text outperforms BERTD (57.64%) and EfficientNet (68.15%) in macro F1. This suggests that the text shown on a political ad is the dominant medium for conveying its main message, corroborating findings in related research on commercial ads Dey et al. (2019); Kalra et al. (2020).
Moreover, combining image text and densecap (BERTIT+D), leads to higher performance, than using only image text (BERTIT), i.e. 75.49% and 73.16% F1 respectively. This indicates that the combination of textual with visual information (in the form of image descriptions) improves the model performance.
Finally, using all visual information sources, i.e. densecaps and image representation from EfficientNet (BERTIT+D+EffN), further improves performance achieving the highest macro F1 (75.76%) across models, followed by BERTIT+D (75.49%).
Task 2: Political-Party/Third-Party
Table 6 shows the results for the sponsor type prediction. The best overall performance is obtained by BERTIT+D+EffN (87.36%) which combines both image and textual information. BERTIT+D (86.90%) and LRIT+D (86.54%) follow very closely. By inspecting our data, we identified the presence of noise in image text, particularly sentences are interrupted by logos and other aesthetic elements. This negatively affects the performance of BERT because such models are usually pre-trained on ‘cleaner’ generic corpora Kumar et al. (2020). On the other hand, LR models trained from scratch can adapt to the noisy text (see 6.2 for error analysis).
Overall, our results in both tasks suggest that text is a stronger modality for inferring the political ideology and sponsor type of political ads compared to visual information extracted from the images. However, integrating visual information in the form of text descriptions (densecaps) or representations obtained by pre-trained image classification models, enhances model performance.
6.2 Error Analysis
We further perform an error analysis to examine the behavior of our best performing models (BERTIT+D+EffN and BERTIT+D) and identify potential limitations.
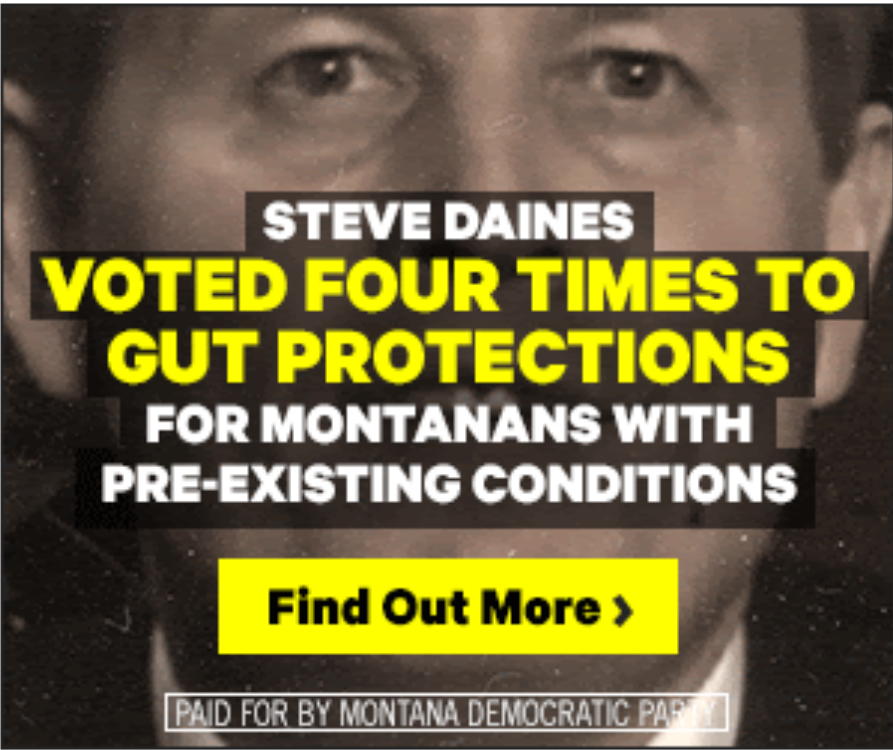
The ad shown in Fig. 1 (a) was misclassified as Conservative by BERTIT+D and BERTIT+D+EffN. This particular ad requires common knowledge of social issues (e.g. inadequate health support) that are often discussed in political campaigns to inform voters about a party’s views on the issue Scammell and Langer (2006). This makes the classification task difficult for the models since it requires contextual knowledge. Incorporating external relevant knowledge to the models (e.g. political speeches, interviews or public meetings) might improve performance Lin et al. (2018).
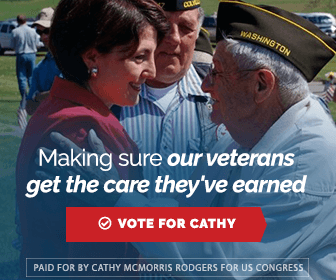
The ad depicted in Fig. 1 (b) was misclassified by BERTIT+D and BERTIT+D+EffN as Conservative. After analyzing the densecap descriptions, we found that this information tends to be noisy. For this particular example, it contains descriptions such as ‘a man is holding a horse’, ‘the sign is blue’, ‘a blue and white stripe shirt’, and ‘a man wearing a hat’. In fact, BERTIT, which only takes the image text into account, classified this ad correctly as Conservative. Improving the quality of the image descriptions (e.g. pre-training on advertising or political images, capturing specific attributes such as ‘military hat’) might be beneficial for these models.
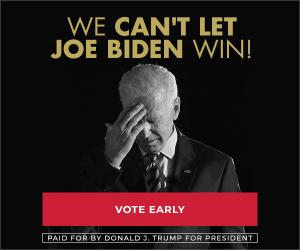
Fig. 1 (c) shows an example of a Political Party ad misclassified by BERTIT+D+EffN as Third-Party. The ad contains the following text:
WE CAN’T LET person WIN!
VOTE EARLY
The message has a confrontational and divisive tone that is common in Third Party ads Edelson et al. (2019), but is typically used as a political tactic for negative campaigning Skaperdas and Grofman (1995); Gandhi et al. (2016); Haselmayer (2019).
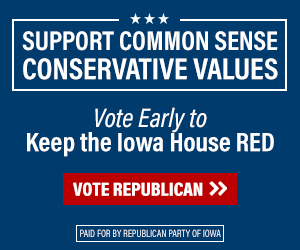
Finally, Fig. 1 (d) shows an example of a Third-Party ad misclassified as Political Party by BERTIT+D+EffN. The text content promotes voter participation (e.g. Vote), a characteristic of Political Party advertising (see Table 8). However, one of the aims of the Third-Party advertising is precisely to encourage voting and activism Dommett and Temple (2018).
There is a considerable difference between the models using visual information only (LRD, BERTD, EfficientNet), and those that also use the ad text as input (IT, IT+D). Our intuition is that models get confused by the appearance of shapes, colors and other aesthetic features that are domain specific and appear frequently in political advertisements Sartwell (2011). For instance, several ads that belong to the Third-Party category, include buttons linking to websites (see Fig, 1 (c), (d)). However, Political Party ads, also make use of these type of buttons to link users to donation or informative websites Edelson et al. (2019).
| Liberal | Conservative | |||
|---|---|---|---|---|
|
r | Feature | r | |
| necessary | 0.197 | senate | 0.271 | |
| end | 0.196 | republican | 0.196 | |
| prohibited | 0.190 | ! | 0.176 | |
| approx | 0.186 | conservative | 0.127 | |
| contrib | 0.181 | national | 0.116 | |
| void | 0.177 | committee | 0.112 | |
| values | 0.173 | petition | 0.109 | |
| prz | 0.161 | border | 0.102 | |
| subj | 0.156 | taxes | 0.099 | |
| make | 0.156 | radical | 0.098 | |
| win | 0.144 | sign | 0.096 | |
| place | 0.140 | stop | 0.094 | |
| beer | 0.139 | states | 0.093 | |
7 Linguistic Analysis
We perform an analysis based on our new data set to study the linguistic characteristics of political ads. We first analyze the specific features of each class for both tasks. For this purpose, we use a method introduced by Schwartz et al. (2013) to analyze uni-gram features from image text (see 4) using univariate Pearson correlation. Features are normalized to sum up to unit for each ad. For each feature, we compute correlations independently between its distribution across ads and its label (Conservative/Liberal), or Political Party/Third Party).
7.1 Conservative vs. Liberal
Table 7 presents the top unigrams correlated with Liberal and Conservative ads. We first notice that the top words in the Conservative category are closely related to its ideology such as ‘conservative’ and ‘republican’. Other prominent terms in these categories are words related to current political issues, such as immigration (e.g. ‘border’) and taxation (e.g. ‘taxes’). In fact, these are examples of emotionally evocative terms (e.g. anger about taxes) that are frequently used in political campaigns to influence voters Brader (2005).
Top terms of Liberal ads include ‘necessary’, ‘end’,‘values’, and ‘win’. For example, the following ads belong to the Liberal class:
I’m supporting person because he has the same values that I do and he’s an honest person.
person FOR CONGRESS
To End Gun Violence
These are examples of ads containing a combination of moral and controversial topics (e.g. gun regulation) which are typical characteristics of political advertising Kumar and Pathak (2012).
|
|
||||
|---|---|---|---|---|---|
|
r | Feature | r | ||
| congress | 0.365 | state | 0.193 | ||
| vote | 0.308 | learn | 0.181 | ||
| senate | 0.292 | champion | 0.175 | ||
| ! | 0.269 | senator | 0.166 | ||
| president | 0.248 | thank | 0.153 | ||
| committee | 0.236 | action | 0.147 | ||
| candidate | 0.223 | congressman | 0.130 | ||
| republican | 0.208 | urge | 0.129 | ||
| authorized | 0.208 | protect | 0.128 | ||
| donate | 0.202 | access | 0.119 | ||
| join | 0.199 | award | 0.117 | ||
| <url> | 0.187 | american | 0.116 | ||
| $ | 0.180 | ? | 0.113 | ||
7.2 Political Party vs. Third-Party
Table 8 shows the top unigram features correlated with the sponsor type of an ad (Political Party/Third-Party). We observe that some top terms in the Political Party class also belong to the top terms of the political ideology task (see Table 7) such as ‘committee’, ‘republican’ and ‘senate’. Messages calling for vote and donation support (‘vote’, ‘donate’, ‘$’) are also prevalent in Political Party ads Fulgoni et al. (2016), as in the next example (See Fig. 1 (b)):
Making sure our veterans
get the care they’ve earned
VOTE FOR person
On the other hand, top features from the Third-Party category (e.g. ‘action’, ‘protect’) share common characteristics with the rhetoric used by media outlets focused on promoting specific political messaging Edelson et al. (2019); Dommett and Temple (2018). Many of these ads direct people to websites to read about a particular topic. For example:
Is person HIDING ANTI-GUN VIEWS? Learn More
This ad belongs to the Third-Party class and points the viewer to an external website for reading further details.
8 Conclusion
We have presented the first study in NLP for analyzing the language of political ads motivated by prior studies in political communication. We have introduced two new publicly available datasets containing political ads from the U.S. in English labeled by (1) the ideology of the sponsor (Conservative/Liberal); and (2) the sponsor type (Political Party/Third Party). We have defined both tasks as advertisement-level binary classification and evaluated a variety of approaches, including textual, visual and multimodal models reaching up to 75.76 and 87.36 macro F1 in each task respectively.
In the future, we aim to incorporate other modalities such as speech, and video, and explore other methods of acquiring and integrating multimodal information. In addition, we aim to extend our work for analyzing political advertising discourse across different regions, languages and platforms.
Acknowledgments
We would like to thank Kate Dommett, Alexandra Boutopoulou, Mali Jin, Katerina Margatina, George Chrysostomou, Peter Vickers, Emily Lau, and all reviewers for their valuable feedback. DSV is supported by the Centre for Doctoral Training in Speech and Language Technologies (SLT) and their Applications funded by the UK Research and Innovation grant EP/S023062/1. NA is supported by a Leverhulme Trust Research Project Grant.
Ethics Statement
Our work complies with the Terms of Service of the Google Political Ads Dataset.111111https://console.cloud.google.com/marketplace/product/transparency-report/google-political-ads?pli=1 We provide, for reproducibility purposes, the list of ad IDs and corresponding labels used for each task, as well as the data splits (train, development, test). All data used in this paper is in English. The ads information can be retrieved from Google according to their policy.
References
- Ahuja et al. (2018) Karuna Ahuja, Karan Sikka, Anirban Roy, and Ajay Divakaran. 2018. Understanding visual ads by aligning symbols and objects using co-attention. arXiv preprint arXiv:1807.01448.
- Anstead et al. (2018) Nick Anstead, João Carlos Magalhães, Richard Stupart, and Damian Tambini. 2018. Political advertising on facebook: The case of the 2017 united kingdom general election. In American Political Science Association, Annual Meeting, Boston.
- Bai et al. (2020) Chongyang Bai, Haipeng Chen, Srijan Kumar, Jure Leskovec, and VS Subrahmanian. 2020. M2p2: Multimodal persuasion prediction using adaptive fusion. arXiv preprint arXiv:2006.11405.
- Baly et al. (2019) Ramy Baly, Georgi Karadzhov, Abdelrhman Saleh, James Glass, and Preslav Nakov. 2019. Multi-task ordinal regression for jointly predicting the trustworthiness and the leading political ideology of news media. In Proceedings of the 2019 Conference of the North American Chapter of the Association for Computational Linguistics: Human Language Technologies, Volume 1 (Long and Short Papers), pages 2109–2116, Minneapolis, Minnesota. Association for Computational Linguistics.
- Bhatia and P (2018) Sumit Bhatia and Deepak P. 2018. Topic-specific sentiment analysis can help identify political ideology. In Proceedings of the 9th Workshop on Computational Approaches to Subjectivity, Sentiment and Social Media Analysis, pages 79–84, Brussels, Belgium. Association for Computational Linguistics.
- Bird et al. (2009) Steven Bird, Ewan Klein, and Edward Loper. 2009. Natural language processing with Python: analyzing text with the natural language toolkit. ” O’Reilly Media, Inc.”.
- Brader (2005) Ted Brader. 2005. Striking a responsive chord: How political ads motivate and persuade voters by appealing to emotions. American Journal of Political Science, 49(2):388–405.
- Caplan and Boyd (2016) Robyn Caplan and Danah Boyd. 2016. Who controls the public sphere in an era of algorithms. Mediation, Automation, Power, pages 1–19.
- Chen et al. (2020) Danni Chen, Kunwoo Park, and Jungseock Joo. 2020. Understanding gender stereotypes and electoral success from visual self-presentations of politicians in social media. In Joint Workshop on Aesthetic and Technical Quality Assessment of Multimedia and Media Analytics for Societal Trends, pages 21–25.
- Deng et al. (2009) J. Deng, W. Dong, R. Socher, L. Li, Kai Li, and Li Fei-Fei. 2009. Imagenet: A large-scale hierarchical image database. In 2009 IEEE Conference on Computer Vision and Pattern Recognition, pages 248–255.
- Devlin et al. (2019) Jacob Devlin, Ming-Wei Chang, Kenton Lee, and Kristina Toutanova. 2019. BERT: Pre-training of deep bidirectional transformers for language understanding. In Proceedings of the 2019 Conference of the North American Chapter of the Association for Computational Linguistics: Human Language Technologies, Volume 1 (Long and Short Papers), pages 4171–4186, Minneapolis, Minnesota. Association for Computational Linguistics.
- Dey et al. (2019) Arka Ujjal Dey, Suman Kumar Ghosh, Ernest Valveny, and Gaurav Harit. 2019. Beyond visual semantics: Exploring the role of scene text in image understanding. arXiv preprint arXiv:1905.10622.
- Dommett and Temple (2018) Katharine Dommett and Luke Temple. 2018. Digital campaigning: The rise of facebook and satellite campaigns. Parliamentary Affairs, 71(suppl_1):189–202.
- Edelson et al. (2019) Laura Edelson, Shikhar Sakhuja, Ratan Dey, and Damon McCoy. 2019. An analysis of united states online political advertising transparency. arXiv preprint arXiv:1902.04385.
- Faghri et al. (2017) Fartash Faghri, David J Fleet, Jamie Ryan Kiros, and Sanja Fidler. 2017. Vse++: Improving visual-semantic embeddings with hard negatives. arXiv preprint arXiv:1707.05612.
- Finkel et al. (2005) Jenny Rose Finkel, Trond Grenager, and Christopher Manning. 2005. Incorporating non-local information into information extraction systems by Gibbs sampling. In Proceedings of the 43rd Annual Meeting of the Association for Computational Linguistics (ACL’05), pages 363–370, Ann Arbor, Michigan. Association for Computational Linguistics.
- Fowler et al. (2020a) Erika Franklin Fowler, Michael M Franz, Gregory J Martin, Zachary Peskowitz, and Travis N Ridout. 2020a. Political advertising online and offline. American Political Science Review, pages 1–20.
- Fowler et al. (2020b) Erika Franklin Fowler, Michael M Franz, and Travis N Ridout. 2020b. The blue wave: Assessing political advertising trends and democratic advantages in 2018. PS: Political Science & Politics, 53(1):57–63.
- Fulgoni et al. (2016) Gian M Fulgoni, Andrew Lipsman, and Carol Davidsen. 2016. The power of political advertising: Lessons for practitioners: How data analytics, social media, and creative strategies shape us presidential election campaigns. Journal of Advertising Research, 56(3):239–244.
- Gandhi et al. (2016) Amit Gandhi, Daniela Iorio, and Carly Urban. 2016. Negative advertising and political competition. The Journal of Law, Economics, and Organization, 32(3):433–477.
- Gerrish and Blei (2011) Sean M Gerrish and David M Blei. 2011. Predicting legislative roll calls from text. In Proceedings of the 28th International Conference on Machine Learning, ICML 2011.
- Grigsby (2008) Ellen Grigsby. 2008. Analyzing Politics: An Introduction to Political Science. Cengage Learning.
- Haselmayer (2019) Martin Haselmayer. 2019. Negative campaigning and its consequences: a review and a look ahead. French Politics, pages 1–18.
- Huang and Kovashka (2016) X. Huang and A. Kovashka. 2016. Inferring visual persuasion via body language, setting, and deep features. In 2016 IEEE Conference on Computer Vision and Pattern Recognition Workshops (CVPRW), pages 778–784.
- Hussain et al. (2017) Z. Hussain, M. Zhang, X. Zhang, K. Ye, C. Thomas, Z. Agha, N. Ong, and A. Kovashka. 2017. Automatic understanding of image and video advertisements. In 2017 IEEE Conference on Computer Vision and Pattern Recognition (CVPR), pages 1100–1110.
- Iyengar and Prior (1999) Shanto Iyengar and Markus Prior. 1999. Political advertising: what effect on commercial advertisers? Retrieved form http://web. stanford. edu/~ siyengar/research/papers/advertising. html.
- Iyyer et al. (2014) Mohit Iyyer, Peter Enns, Jordan Boyd-Graber, and Philip Resnik. 2014. Political ideology detection using recursive neural networks. In Proceedings of the 52nd Annual Meeting of the Association for Computational Linguistics (Volume 1: Long Papers), pages 1113–1122, Baltimore, Maryland. Association for Computational Linguistics.
- Johansson and Holtz-Bacha (2019) Bengt Johansson and Christina Holtz-Bacha. 2019. From analogue to digital negativity: Attacks and counterattacks, satire, and absurdism on election posters offline and online. In Visual Political Communication, pages 99–118. Springer.
- Johnson et al. (2016) J. Johnson, A. Karpathy, and L. Fei-Fei. 2016. Densecap: Fully convolutional localization networks for dense captioning. In 2016 IEEE Conference on Computer Vision and Pattern Recognition (CVPR), pages 4565–4574.
- Johnson and Goldwasser (2018) Kristen Johnson and Dan Goldwasser. 2018. Classification of moral foundations in microblog political discourse. In Proceedings of the 56th Annual Meeting of the Association for Computational Linguistics (Volume 1: Long Papers), pages 720–730, Melbourne, Australia. Association for Computational Linguistics.
- Joo et al. (2014) J. Joo, W. Li, F. F. Steen, and S. Zhu. 2014. Visual persuasion: Inferring communicative intents of images. In 2014 IEEE Conference on Computer Vision and Pattern Recognition, pages 216–223.
- Joo et al. (2015) J. Joo, F. F. Steen, and S. Zhu. 2015. Automated facial trait judgment and election outcome prediction: Social dimensions of face. In 2015 IEEE International Conference on Computer Vision (ICCV), pages 3712–3720.
- Joo and Steinert-Threlkeld (2018) Jungseock Joo and Zachary C Steinert-Threlkeld. 2018. Image as data: Automated visual content analysis for political science. arXiv preprint arXiv:1810.01544.
- Kaid and Holtz-Bacha (2006) Lynda L Kaid and Christina Holtz-Bacha. 2006. Television advertising and democratic systems around the world. The Sage handbook of political advertising, pages 445–457.
- Kaid and Postelnicu (2005) Lynda Lee Kaid and Monica Postelnicu. 2005. Political advertising in the 2004 election: Comparison of traditional television and internet messages. American Behavioral Scientist, 49(2):265–278.
- Kalra et al. (2020) Kanika Kalra, Bhargav Kurma, Silpa Vadakkeeveetil Sreelatha, Manasi Patwardhan, and Shirish Karande. 2020. Understanding advertisements with BERT. In Proceedings of the 58th Annual Meeting of the Association for Computational Linguistics, pages 7542–7547, Online. Association for Computational Linguistics.
- Kenzhekanova (2015) Kuralay Kenzhekankyzy Kenzhekanova. 2015. Linguistic features of political discourse. Mediterranean Journal of Social Sciences, 6(6 S2):192.
- Kiela et al. (2019) Douwe Kiela, Suvrat Bhooshan, Hamed Firooz, and Davide Testuggine. 2019. Supervised multimodal bitransformers for classifying images and text. arXiv preprint arXiv:1909.02950.
- King and Zeng (2001) Gary King and Langche Zeng. 2001. Logistic regression in rare events data. Political analysis, 9(2):137–163.
- Kingma and Ba (2014) Diederik P Kingma and Jimmy Ba. 2014. Adam: A method for stochastic optimization. arXiv preprint arXiv:1412.6980.
- Kriess and Barrett (2020) Daniel Kriess and Bridget Barrett. 2020. Democratic tradeoffs: Platforms and political advertising. Ohio State Technology Law Journal, 16(2):494–518.
- Kulkarni et al. (2018) Vivek Kulkarni, Junting Ye, Steve Skiena, and William Yang Wang. 2018. Multi-view models for political ideology detection of news articles. In Proceedings of the 2018 Conference on Empirical Methods in Natural Language Processing, pages 3518–3527, Brussels, Belgium. Association for Computational Linguistics.
- Kumar and Pathak (2012) Alok Kumar and Pramod Pathak. 2012. Political advertising in india: a perspective. Management Insight, 8(1):15–29.
- Kumar et al. (2020) Ankit Kumar, Piyush Makhija, and Anuj Gupta. 2020. Noisy text data: Achilles’ heel of BERT. In Proceedings of the Sixth Workshop on Noisy User-generated Text (W-NUT 2020), pages 16–21, Online. Association for Computational Linguistics.
- Lau et al. (1999) Richard R Lau, Lee Sigelman, Caroline Heldman, and Paul Babbitt. 1999. The effects of negative political advertisements: A meta-analytic assessment. American Political Science Review, pages 851–875.
- LeCun et al. (1995) Yann LeCun, Yoshua Bengio, et al. 1995. Convolutional networks for images, speech, and time series. The handbook of brain theory and neural networks, 3361(10):1995.
- Lin et al. (2008) Wei-Hao Lin, Eric Xing, and Alexander Hauptmann. 2008. A joint topic and perspective model for ideological discourse. In Joint European Conference on Machine Learning and Knowledge Discovery in Databases, pages 17–32. Springer.
- Lin et al. (2018) Y. Lin, J. Hoover, G. Portillo-Wightman, C. Park, M. Dehghani, and H. Ji. 2018. Acquiring background knowledge to improve moral value prediction. In 2018 IEEE/ACM International Conference on Advances in Social Networks Analysis and Mining (ASONAM), pages 552–559.
- Liu et al. (2013) Bin Liu, Anmol Sheth, Udi Weinsberg, Jaideep Chandrashekar, and Ramesh Govindan. 2013. Adreveal: improving transparency into online targeted advertising. In Proceedings of the Twelfth ACM Workshop on Hot Topics in Networks, pages 1–7.
- Maronikolakis et al. (2020) Antonios Maronikolakis, Danae Sánchez Villegas, Daniel Preotiuc-Pietro, and Nikolaos Aletras. 2020. Analyzing political parody in social media. In Proceedings of the 58th Annual Meeting of the Association for Computational Linguistics, pages 4373–4384, Online. Association for Computational Linguistics.
- Medina Serrano et al. (2020) Juan Carlos Medina Serrano, Orestis Papakyriakopoulos, and Simon Hegelich. 2020. Exploring political ad libraries for online advertising transparency: Lessons from germany and the 2019 european elections. In International Conference on Social Media and Society, pages 111–121.
- Preoţiuc-Pietro et al. (2017) Daniel Preoţiuc-Pietro, Ye Liu, Daniel Hopkins, and Lyle Ungar. 2017. Beyond binary labels: Political ideology prediction of Twitter users. In Proceedings of the 55th Annual Meeting of the Association for Computational Linguistics (Volume 1: Long Papers), pages 729–740, Vancouver, Canada. Association for Computational Linguistics.
- Reschke and Anand (2012) Kevin Reschke and Pranav Anand. 2012. POLITICAL-ADS: An annotated corpus for modeling event-level evaluativity. In Proceedings of the 3rd Workshop in Computational Approaches to Subjectivity and Sentiment Analysis, pages 84–88, Jeju, Korea. Association for Computational Linguistics.
- Ridout et al. (2010) Travis N Ridout, Erika Franklin Fowler, and John Branstetter. 2010. Political advertising in the 21st century: The rise of the youtube ad. In APSA 2010 Annual Meeting Paper.
- Sartwell (2011) Crispin Sartwell. 2011. Political aesthetics. Cornell University Press.
- Scammell and Langer (2006) Margaret Scammell and Ana I Langer. 2006. Political advertising: why is it so boring? Media, culture & society, 28(5):763–784.
- Schwartz et al. (2013) H Andrew Schwartz, Johannes C Eichstaedt, Margaret L Kern, Lukasz Dziurzynski, Stephanie M Ramones, Megha Agrawal, Achal Shah, Michal Kosinski, David Stillwell, Martin EP Seligman, et al. 2013. Personality, gender, and age in the language of social media: The open-vocabulary approach. PloS one, 8(9):e73791.
- Sim et al. (2013) Yanchuan Sim, Brice D. L. Acree, Justin H. Gross, and Noah A. Smith. 2013. Measuring ideological proportions in political speeches. In Proceedings of the 2013 Conference on Empirical Methods in Natural Language Processing, pages 91–101, Seattle, Washington, USA. Association for Computational Linguistics.
- Skaperdas and Grofman (1995) Stergios Skaperdas and Bernard Grofman. 1995. Modeling negative campaigning. American Political Science Review, 89(1):49–61.
- Skorupa and Dubovičienė (2015) Pavel Skorupa and Tatjana Dubovičienė. 2015. Linguistic characteristics of commercial and social advertising slogans. Coactivity: Philology, Educology/Santalka: Filologija, Edukologija, 23(2):108–118.
- Speicher et al. (2018) Till Speicher, Muhammad Ali, Giridhari Venkatadri, Filipe Ribeiro, George Arvanitakis, Fabrício Benevenuto, Krishna Gummadi, Patrick Loiseau, and Alan Mislove. 2018. Potential for discrimination in online targeted advertising. In FAT 2018-Conference on Fairness, Accountability, and Transparency, volume 81, pages 1–15.
- Stefanov et al. (2020) Peter Stefanov, Kareem Darwish, Atanas Atanasov, and Preslav Nakov. 2020. Predicting the topical stance and political leaning of media using tweets. In Proceedings of the 58th Annual Meeting of the Association for Computational Linguistics, pages 527–537, Online. Association for Computational Linguistics.
- Tan and Le (2019) Mingxing Tan and Quoc Le. 2019. EfficientNet: Rethinking model scaling for convolutional neural networks. In Proceedings of the 36th International Conference on Machine Learning, volume 97 of Proceedings of Machine Learning Research, pages 6105–6114. PMLR.
- Thomas and Kovashka (2018) Christopher Thomas and Adriana Kovashka. 2018. Persuasive faces: Generating faces in advertisements. arXiv preprint arXiv:1807.09882.
- Vaswani et al. (2017) Ashish Vaswani, Noam Shazeer, Niki Parmar, Jakob Uszkoreit, Llion Jones, Aidan N Gomez, Łukasz Kaiser, and Illia Polosukhin. 2017. Attention is all you need. In Advances in Neural Information Processing Systems, pages 5998–6008.
- West (2017) Darrell M West. 2017. Air wars: television advertising and social media in election campaigns, 1952-2016. CQ Press.
- Wolf et al. (2019) Thomas Wolf, Lysandre Debut, Victor Sanh, Julien Chaumond, Clement Delangue, Anthony Moi, Pierric Cistac, Tim Rault, Rémi Louf, Morgan Funtowicz, and Jamie Brew. 2019. Huggingface’s transformers: State-of-the-art natural language processing. CoRR, abs/1910.03771.
- Xi et al. (2020) Nan Xi, Di Ma, Marcus Liou, Zachary C Steinert-Threlkeld, Jason Anastasopoulos, and Jungseock Joo. 2020. Understanding the political ideology of legislators from social media images. In Proceedings of the International AAAI Conference on Web and Social Media, volume 14, pages 726–737.
- Xie et al. (2020) Q. Xie, M. T. Luong, E. Hovy, and Q. V. Le. 2020. Self-training with noisy student improves imagenet classification. In 2020 IEEE/CVF Conference on Computer Vision and Pattern Recognition (CVPR), pages 10684–10695.
- Ye et al. (2018) Keren Ye, Kyle Buettner, and Adriana Kovashka. 2018. Story understanding in video advertisements. arXiv preprint arXiv:1807.11122.
- Ye and Kovashka (2018) Keren Ye and Adriana Kovashka. 2018. Advise: Symbolism and external knowledge for decoding advertisements. In Proceedings of the European Conference on Computer Vision (ECCV), pages 837–855.
- Zhang et al. (2018) Mingda Zhang, Rebecca Hwa, and Adriana Kovashka. 2018. Equal but not the same: Understanding the implicit relationship between persuasive images and text. arXiv preprint arXiv:1807.08205.