Search for gamma rays from SNe with a variable-size sliding-time-window analysis of the Fermi-LAT data
Abstract
We present a systematic search for -ray emission from supernovae (SNe) in the Fermi Large Area Telescope (LAT) Pass 8 data. The sample of targets consists of 55,880 candidates from the Open Supernova Catalog. We searched for rays from SNe by means of a variable-size sliding-time-window analysis. Our results confirm the presence of transient -ray emission from the sources of non-AGN classes, including transitional pulsars, solar flares, -ray bursts, novae, and the Crab Nebula, which are projected near some of these SN’s positions, and also strengthen support to the variable signal in the direction of SN iPTF14hls. The analysis is successful in finding both short (e.g. solar flares) and long (e.g. transitional pulsars) high flux states. Our search reveals two new -ray transient signals occurred in 2019 in the directions of optical transients that are SN candidates, AT2019bvr and AT2018iwp, with their flux increases within 6 months after the dates of SN’s discoveries. These signals are bright and their variability is at a higher statistical level than that of iPTF14hls. An exploration of archival multi-wavelength observations towards their positions is necessary to establish their association with SNe or other classes of sources. Our analysis, in addition, shows a bright transient -ray signal at low Galactic latitudes in the direction of PSR J0205+6449. In addition, we report the results of an all-sky search for -ray transient sources. This provided two additional candidates to -ray transient sources.
keywords:
transients: supernovae – methods: data analysis – gamma-rays: general1 Introduction
Supernovae (SNe) are luminous explosions of stars occuring during their last evolutionary stages (for a review, see Bethe, 1990; Hillebrandt & Niemeyer, 2000). The original star, called the progenitor, is either destroyed or collapses to a neutron star or black hole. The most recent Galactic SN observed by the unaided eye was Kepler’s SN in 1604 which was brighter than stars and planets at its peak (for a review, see Vink, 2017). The most recent extra-galactic unaided eye SN was SN 1987A in the Large Magellanic Cloud (for a review, see Arnett et al., 1989). Two mechanisms producing SNe are re-ignition of nuclear fusion in a white dwarf star in a binary system (a Type Ia SN) or gravitational collapse of a massive star’s core (a Type II SN). The length of time of unaided-eye visibility of Kepler’s SN and SN 1987A were several months. Given that only a tiny fraction of the stars in a typical galaxy have the capacity to become a supernova, it is generally accepted that supernovae occur in the Milky Way on average about a few times every century (Diehl et al., 2006). The light from the SN corresponding to the youngest known remnant SNR G1.9+0.3 in our Galaxy would have reached Earth some time between 1890 and 1908.
Since the rate of SNe is relatively low, observations of other galaxies with telescopes are useful to enlarge a sample of detected SNe. Optical surveys are a powerful tool to search for SNe (e.g., Law et al., 2009). A subset of SNe which show evidence of interaction with a dense circumstellar medium formed by a pre-SN stellar wind are also detected in radio waves (so-called radio SNe; Weiler et al., 2002) and X-rays (see Table 1 from Dwarkadas & Gruszko, 2012). There are theoretical models supporting that some types of SNe, such as Type IIn and superluminous SNe surrounded by a high-density circumstellar medium, can emit rays and be detectable with modern -ray telescopes if these SNe are located at distances less than 30 Mpc (Murase et al., 2011; Dwarkadas, 2013; Abdalla et al., 2019). Nearby SNe are acknowledged to be more promising targets for searches of -ray emission from SNe owing to the inverse distance-squared law of flux. While the remnants of SNe are well established -ray-emitting sources including the young, 340- and 448-year old SN remnants, Cassiopeia A and Tycho, only one candidate to -ray-emitting SNe, iPTF14hls, has been proposed since the start of the nominal science operation of the Fermi Gamma-ray Space Telescope (FGST) in 2008 August.
The Large Area Telescope (LAT; Atwood et al., 2009) on-board the FGST provides unprecedented sensitivity for all-sky monitoring of -ray activity. Analysis techniques applied to searches for transient sources require different levels of detail and coverage. For example:
-
Searches for variable -ray emission from the large region of the sky, e.g., the Galactic plane (Neronov et al., 2012) or the entire sky (the Fermi all-sky variability analysis by Ackermann et al., 2013a; Abdollahi et al., 2017), on the time scale of months or weeks use a measure of variability computed as, e.g., the maximum deviation of the flux from the average value. The reduced of the fit of the light curve with the constant flux is another technique which is adopted in the Fermi-LAT catalog (Abdollahi et al., 2020) for testing about 5,000 -ray sources. Both of these statistics allow tests of a large number of positions or sources and are not computationally expensive for a single analysis. However, these techniques have a predetermined time interval.
-
Other searches set various lengths of time intervals after a predetermined start time (which can be the date of SN discovery) in order to search for a -ray signal during one of these time intervals. Ackermann et al. (2015b) applied such a technique to search for -ray emission from 147 Type IIn SNe using three different time windows; 1 year, 6 months, and 3 months. A smaller number of sources and three time windows allowed them to perform a dedicated likelihood analysis for each of these sources. However, this technique is not flexible with respect to the selection of a start time. In the paper by Franckowiak et al. (2018), the authors applied a sliding time window technique for a search for -ray emission from 75 optically detected Galactic novae in a 15 day time window in two-day steps ranging from 20 days before to 20 days after the optical peak, but fixing the duration of emission.
The discovery of a transient source iPTF14hls by the Intermediate Palomar Transient Factory occurred in September 2014. iPTF14hls is very similar spectroscopically to a Type II-P SN, but evolved slowly, remaining luminous for over 600 days with at least five distinct peaks in its light curve (Arcavi et al., 2017). The total energy emitted in light during the first 600 days was about erg, making iPTF14hls a luminous SN. iPTF14hls is located at a distance of 150 Mpc which exceeds the distances to those Type II SNe from which no -ray emission was found. Yuan et al. (2018) reported the detection of a variable -ray source positionally and temporally compatible with iPTF14hls. They found that the source starts to emit rays about 300 days after the explosion time and the emission lasts for about 850 days. The detection of transient -ray emission in the direction of iPTF14hls gives rise to a question whether -ray emission comes only from unusual SNe (for a review of the models for iPTF14hls, see Woosley, 2018). These -ray observational properties require a search for similar sources accounting for both a start and duration of emission which serve as two variables. Previous temporal analyses of Fermi-LAT data often have one time variable, e.g. the index of a time interval (Neronov et al., 2012; Ackermann et al., 2013a; Prokhorov & Moraghan, 2016), the duration of a time interval (Ackermann et al., 2015b; Renault-Tinacci et al., 2018), the oscillation period (Ackermann et al., 2015a; Prokhorov & Moraghan, 2017), the Sun’s position on the ecliptic (Barbiellini et al., 2014), or the McIlwain L parameter (Prokhorov & Moraghan, 2019).
The search for -ray-emitting SNe similar to iPTF14hls is the ultimate goal of the paper. We have developed a variable-size sliding-time-window technique as the first step and apply it to a search for -ray emission from 55,880 SNe and related candidates from the Open Supernova Catalog. We stress here that this catalog contains SN candidates, as the supernova nature of these transients is not always entirely established. For each of these sources we assume the existence of a time interval during which the given source is brighter than it is before and after this time interval. By means of a likelihood analysis, we check if the existence of such a time interval is statistically significant and select the most significant interval among the possible intervals for each source. If the existence of a high flux time interval is statistically significant, then we check if the corresponding date of SN discovery is within the time interval of 300 days before the -ray transient. By using a variable-size sliding-time-window analysis, we found two new candidates with flux increases within 300 days after the SN candidate discoveries, one new variable unidentified source at a low Galactic latitude in the direction of PSR J0205+6449, and confirmed a number of known -ray transient sources, including -ray bursts, solar flares, novae, and especially transitional pulsars, revealing high flux time intervals.
2 Observations and methods
Fermi-LAT on the FGST spacecraft is a pair-conversion telescope which provides tracking of electrons and positrons produced by the process of pair production occurring for rays in a converter material (Atwood et al., 2009). It has a large field of view ( of the sky) and has been scanning the sky continuously since August 2008. These two capabilities of Fermi-LAT allow efficient monitoring of the -ray sky. The telescope provides an angular resolution per single event of at 0.8 GeV, narrowing to at 2 GeV, and further narrowing to above 10 GeV111http://www.slac.stanford.edu/exp/glast/groups/canda/lat_Performance.htm. At energies below 10 GeV, the accuracy of the directional reconstruction of photon events detected by Fermi-LAT is limited by multiple scattering in the tungsten converter foils and determined by the dependence of multiple scattering, whereas above 10 GeV, multiple scattering is insignificant and the accuracy is limited by the ratio of silicon strip pitch to silicon-layer spacing. Given the angular resolution dependence with energy, we selected the optimal lower energy limit of 0.8 GeV to tighten the point spread function (PSF) for this analysis. We selected the upper energy limit of 500 GeV, because of the small amount of detected events with higher energies.
We downloaded the Fermi-LAT Pass 8 (P8R3) data from the Fermi Science Support Center and used 600 weeks of the SOURCE class data (evtype=128), collected between 2008-08-04 and 2020-01-30. The SOURCE event class is tuned to balance statistics with background flux for long-duration (e.g., on the time scale of weeks) point source analysis. We performed the data analysis using the FERMITOOLS v1.2.23 package. We rejected events with zenith angles larger than to reduce contamination by albedo rays from the Earth. We applied the recommended cuts on the data quality (DATA_QUAL && LAT_CONFIG). We binned the data into time intervals of one week and in three energy bands, namely, 0.8-2.0 GeV, 2.0-5.0 GeV, and 5.0-500.0 GeV. The choice of three energy bands instead of a single band facilitates a study of the -ray sources with soft or hard photon indices, since the signal-to-noise ratio is expected to be higher in the 1st band for soft sources and higher in the 3rd band for hard sources. We further binned the Fermi-LAT events using the HEALPIX package into a map of resolution = 512 in Galactic coordinates with ‘RING’ pixel ordering. With these settings, the total number of pixels is equal to 3,145,728 and the area of each pixel is deg2. The chosen resolution of the map is fine enough to allow the selection of rays from circular regions around SNe. To compute the exposure, we used the standard tools gtltcube and gtexpcube2. To correct the livetime for the zenith angle cut, we used the ‘zmax’ option on the command line.
We used the Open Supernova Catalog, an online collection of observations and metadata for 50,000+ SNe and related candidates (Guillochon et al., 2017). This catalog is freely available on the web222https://sne.space. The objects included in this catalog are intended to be entirely SNe and the authors of the catalog remove objects that have been definitively identified as other transient types. One difference between the Open Supernova Catalog approach and some other catalogs is that the authors augment the known SNe with known supernova remnants for completeness, which are thought to be SNe but (currently) possess no known associated transient. We extracted the positions of sources in the sky from this catalog and computed both the total number of events within a 035 radius circle centered on the position of each SN and the corresponding exposure for every week of observations. The circular region with a 035 radius is sufficient to accumulate a significant number of events from the potential source, but also relatively small to strongly suppress the contamination of signals by rays coming from numerous active galactic nuclei (AGN) including blazars and radio galaxies, such as NGC 1275. To further suppress the contamination, we selected SNe located at distances larger than 1∘ from AGN included in the Fermi-LAT catalog (Abdollahi et al., 2020). Apart from the positions of SNe, we also extracted discovery dates and SN types from the Open Supernova Catalog. We checked that the Open Supernova Catalog is rather uniform and the total covered surface by our circular regions is a significant portion of the sky.
We developed a python code which performs a likelihood analysis for finding the most statistically significant time interval of a high flux for every selected source, and it is publicly accessible at https://zenodo.org/record/4739389. To search for such a time interval, we compared two models with and without the presence of a bright state. The “null” model assumes a source with a steady flux in time. The alternative model assumes the presence of a time interval during which a source has a flux different from that which is before and after the bright state. Taking the exposure for each week into account, we estimated the number of expected counts from the source during each week and computed a Poisson probability using the observed number of counts. The product of Poisson probabilities for all weeks gives us a likelihood for the given model. We employed the Test Statistic (TS) to evaluate the significance of evidence for a bright state. The TS value is defined as , where is the maximum likelihood value for the null model and is the maximum likelihood for the alternative model. We considered each energy band independently from the other two bands allowing an analysis independent on the photon index. Since the null model represents a special case of the alternative model, the probability distribution of the TS is approximately a chi-square distribution with three degrees of freedom - the difference between the numbers of free parameters of the null and alternative models (one degree is for each energy band) accordingly to Wilks’ theorem.
 |
|
We searched for bright state emission in a variable-size sliding-time window in one week steps ranging from the first week of Fermi-LAT observations to the last one of 600 weeks. Thus, the shortest time window is one week and the longest is 599 weeks. The time interval of a high flux state can be written as , while the time interval of a normal flux state can be written as , where , are week numbers in the ranges of and , respectively. The variable-size sliding-time-window analysis of 55,800 SNe took 12 days to run on the servers using 56 scripts in parallel that analyzed 1000 sources each. We tested the algorithm on a flaring blazar and found the algorithm correctly reveals a time interval corresponding to a given flare. We also tested the algorithm on simulated data including a high flux state at a given duration and found that the algorithm successfully identifies a bright state in the simulated data. Given that the number of weeks is 600 and thus a large number of trials, we expected to find the time interval of a high flux for every source at a statistical level above . The performed analysis confirmed that the average value of a statistical level for selected sources is indeed . We adapt a global significance level where we indicate the significance level after taking the “look elsewhere effect” into account which is quantified in terms of a trial factor that is the ratio of the probability of observing the excess in the obtained time interval to the probability of observing it with the same local significance level anywhere in the allowed range for a given SN position. Below we focus on two samples of sources with the presence of a high flux time interval:
(A) at a local significance level higher than 6.0 standard deviations, which translates to a global significance of about 5.0 and
(B) at a local significance exceeding 5.0 standard deviations and which starts within 300 days after the date of SN discovery (however, if a SN occurred before the Fermi mission, then to be included in this set a -ray signal should start during the first weeks of the Fermi mission333It is worth to mention that it is conceivable that the -ray signal from a SN occurred before the Fermi mission can start during the mission, see Berezhko et al. (2015)).
The criterion for classifying transient sources for the sample, A, satisfies the convention of a global significance level. The expected number of false detections in the sample, A, is , where is the number of SNe candidates and is the trial factor related to the choice of time intervals. The criterion used for the sample, B, is for checking the completeness of our sample of transients which can be associated with SNe. The expected number of false detections in the sample, B, is , where is the total number of observation weeks and is the number of weeks corresponding to days444If the constraint on the start time of emission was not set, then the number of spurious detections in the sample, B, would be 33..
The choice of a 300 day interval for the start date of -ray emission is based on the fact that GeV-TeV rays almost simultaneous with the optical/infrared light curves are expected and to be emitted in 1-10 months (Murase et al., 2011) which motivates searches for 0.1-1 yr transients via multi-year Fermi-LAT observations. In the optically thin scenario, the -ray radiation time duration corresponds to the SN-shock-crossing time through the circumstellar medium modelled as a shell of matter. The absorption on the non-thermal synchrotron photons can lead to a delay of the onset of GeV emission by 1 month (Kantzas et al., 2016). Given that the -ray source appeared about 300 days after the explosion of iPTF14hls, which was proposed to be the first detected -ray emitting SN and is furthermore a prototype of transients for our search, we generalized the condition that emission is within 1 year to the condition that emission starts within 300 days by covering the empirically-based iPTF14hls case. Our search includes a search for transients within the 3-month, 6-month, and 1-year intervals (e.g., Ackermann et al., 2015b) as subsamples. A longer delay in the onset of gamma-ray emission is also conceivable (e.g., Berezhko et al., 2015), however the perspective of association between a transient event and a SN is less certain in this case and requires multi-wavelength observing campaigns, such as those which have taken place for SN 1987A for the last three decades. Given the lack of established GeV -ray sources identified with SNe - with the possible exception of iPTF14hls, we followed a conservative approach assuming that the onset of GeV emission from SNe can be at any time within the 300 day window and that the time duration of GeV emission can be arbitrary.
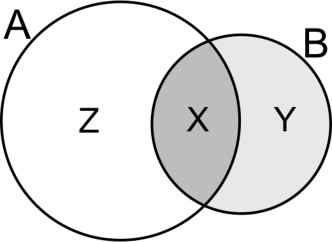
We consider three sets, (i.e. contains only those elements which belong to both and ), (i.e. contains only elements of which are not in ), and (i.e. contains only elements of which are not in ). The Venn diagram shown in Figure 1 illustrates the relationship between these sets. Signals from set, , should be associated with SNe with a higher probability. The probability of detecting one signal in the set, X, by mere chance is . Signals from the set, , can also be associated with SNe, but their variability is at a lower statistical level. Signals from the set, , are likely associated with other transients which are not related to SNe. Given the search for a high (not low) flux time interval, we considered the cases in which the data in at least one of the three independent energy bands show the time interval with a positive flux variation.
While performing the analysis, we found that some high flux time intervals with a global significance above are associated with strong -ray flares of known AGN from the Fermi-LAT catalog and located at distances (a little) larger than 1∘ from Open Supernova Catalog sources. The list of these AGN include 4C 01.02, PKS 0346-27, SBS 0846+513, Ton 599, 4C +21.35, 3C 279, PKS B1424-418, PKS 1502+106, PKS 1510-089, CTA 102, PKS 2227-08, PKS 2247-131, and 3C 454.3. We checked that the high flux time intervals obtained from our variable-size sliding-time-window analysis correspond to the flares of these AGN giving us confidence in the reliability of the method. Below we do not consider these sources since the flaring activity of these AGN have already been reported in Fermi Astronomer’s Telegrams555https://heasarc.gsfc.nasa.gov/docs/heasarc/biblio/pubs/fermi_atel.html including ATel # 2328, 2584, 3452, 8319, 10931, 11251, 11542, and 11141, and these AGN are included in the catalog (Abdollahi et al., 2017) with the exception of PKS 2247-131 whose flare was in 2018 after that publication.
3 Results
| # | Set | R.A. | Dec. | Name | Disc. Date | -ray bright | Length | Local. | Id./Assn. (/) |
| (hh:mm:ss) | (hh:mm:ss) | yr/m/d | state from | (week) | signif. | ||||
| (yr/m/d) | |||||||||
| N01 | 01:39:24 | +29:24:06 | AT2018iwp | 2018/11/07 | 2019/04/22 | 15 | 6.0 | new | |
| N02 | 10:55:33 | +65:09:55 | AT2019bvr | 2019/02/20 | 2019/05/13 | 5 | 7.8 | new | |
| N03 | 10:22:23 | +01:12:06 | LSQ13afs | 2013/04/29 | 2013/07/01 | 334 | 6.7 | PSR J1023+0038 (2) | |
| N04 | 11:32:32 | +27:41:56 | SN2013cq | 2013/04/27 | 2013/04/22 | 1 | GRB 130427A (4) | ||
| N05 | 01:05:02 | -21:56:12 | SN2018gxi | 2018/09/28 | 2019/01/28 | 52 | 5.4 | new | |
| N06 | 04:26:19 | -10:27:45 | SN2017htp | 2017/11/01 | 2017/10/09 | 1 | 5.5 | GRB 171010A | |
| N07 | 09:20:34 | +50:41:47 | CSS141118 | 2014/11/18 | 2015/06/01 | 109 | 5.3 | iPTF14hls | |
| N08 | 02:10:33 | +64:07:48 | GRB 080727C | 2008/07/27 | 2017/03/13 | 4 | 6.9 | new | |
| N09 | 08:38:10 | +24:53:26 | SN2018ggc | 2018/09/08 | 2018/01/08 | 1 | 7.0 | new | |
| N10 | 00:42:44 | -01:29:40 | PS19iho | 2019/12/24 | 2013/12/30 | 1 | 7.6 | GRB 131231A (1) | |
| N11 | 05:34:31 | +22:01:00 | SN1054A | 1054/07/04 | 2011/04/11 | 1 | Crab Nebula flare | ||
| N12 | 05:42:47 | +82:27:26 | AT2013kg | 2013/10/23 | 2019/06/24 | 2 | 6.7 | FSRQ S5 0532+82 | |
| N13 | 08:58:53 | +17:08:37 | PS19ivt | 2019/12/27 | 2009/07/27 | 1 | 6.0 | quiescent Sun | |
| N14 | 10:35:40 | -59:42:00 | G286.5-01.2 | – | 2018/04/02 | 4 | Nova ASASSN-18fv | ||
| N15 | 10:44:21 | +08:20:11 | MLS110526 | 2011/05/26 | 2014/08/25 | 1 | 7.0 | solar flare | |
| N16 | 11:12:29 | +05:03:04 | AT2019blr | 2019/01/20 | 2017/09/04 | 1 | solar flare (7) | ||
| N17 | 12:26:48 | -48:46:04 | Gaia16cdq | 2016/12/02 | 2009/02/02 | 199 | 6.3 | PSR J1227-4853 | |
| N18 | 13:19:46 | -08:25:37 | AT2018aee | 2018/03/06 | 2019/10/14 | 1 | 6.5 | quiescent Sun | |
| N19 | 18:26:05 | -13:03:20 | G18.45-0.42 | – | 2012/06/04 | 51 | 6.2 | PSR J1826-1256 | |
| N20 | 20:20:50 | +40:26:00 | DR4 | – | 2009/07/20 | 117 | PSR J2021+4026 | ||
| N21 | 20:33:46 | +07:00:44 | AT2019isx | 2019/05/29 | 2016/06/20 | 1 | GRB 160625945 | ||
| N22 | 21:02:03 | +42:13:55 | Gaia19eym | 2019/11/05 | 2016/06/20 | 1 | 6.0 | GRB 160623209 | |
| N23 | 22:14:01 | -26:55:44 | SN2010bv | 2010/04/19 | 2009/05/04 | 1 | GRB 090510A (3) | ||
| N24 | 23:14:03 | -04:44:20 | PS1-14afk | 2014/12/18 | 2012/03/05 | 1 | solar flare (2) | ||
| N25 | 23:35:19 | -66:11:05 | OGLE16cpa | 2016/07/12 | 2009/09/21 | 1 | GRB 090926A (2) |
We present the results in Table 1 which contains the list of sources from the three sets, , , and . We detected two new sources belonging to the set, , which can potentially be associated with SNe given that the variability of sources from this set is at a high statistical level and that these -ray signals started within a 300-day time interval after the date of a SN discovery. We detected one new transient source in the set, , but located at an offset from the SN’s position. We also detected two new transient sources in the set, , including one source at a low Galactic latitude and the other source likely associated with a blazar.
3.1 Sources of the set
The set, , contains four sources including two newly detected ones, N01 and N02, which are possibly associated with AT2018iwp and AT2019bvr. Given that the probability of detecting two new sources in the set, , by mere chance is , this constitutes evidence for -ray emission from transient sources occurring in the directions of SN candidates. The other two sources, N03 and N04, are associated with the already known transient -ray sources, PSR J1023+0038 (N03) and GRB 130427A (N04).
The signals, N01 and N02, have not yet been associated with any known -ray sources. Our analysis reveals that both these transient signals occurred in 2019 and lasted for several weeks. The signal, N01, started about 5 months after AT2018iwp, while the signal, N02, started about 3 months after AT2019bvr. Apart from the signals, N04 (GRB 130427A) and N06 (GRB 171010A; see Sect. 3.2), 5 of all the 23 signals in Table 1 occurred within 300 days after the SN events from the Open Supernova Catalog. Given that iPTF14hls is one of these 5 signals (see Sect. 3.2) and that 16 of the remaining 18 signals are firmly identified, we examined the newly detected signals, N01 and N02, in more detail.
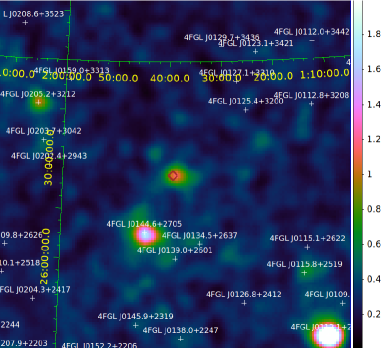
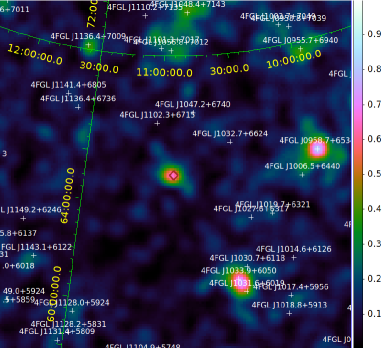
We performed binned likelihood analyses of the sources located at the positions of AT2018iwp and AT2019bvr using the standard FERMITOOLS package. We selected events with energies in the range from 300 MeV to 500 GeV and with reconstructed directions within a region of interest around each of these two sources. We chose the photon events recorded during the time intervals shown in Table 1. Figure 2 shows Gaussian () kernel smoothed count maps centered on the positions of AT2018iwp and AT2019bvr and illustrates the presence of -ray excesses during the corresponding time intervals. We binned the data in 25 equal logarithmically spaced energy intervals and used a pixel size. To model the Galactic and isotropic background diffuse emission, we used the templates, gll_iem_v07 and iso_P8R3_SOURCE_V2_v1.txt. The other cuts applied to the Fermi-LAT data are identical to those used in Sect. 2. We built a complete spatial and spectral source model using point sources from the LAT 10-year Source Catalog (4FGL-DR2; Ballet et al., 2020). Using the gtlike routine, we found that the -ray source at the position of AT2018iwp is at an statistical level and that the -ray source at the position of AT2019bvr is at a statistical level. (We clarify that these significances correspond to the detection of a -ray source at the given position during the high flux time interval, while the significances shown in Table 1 are for the existence of a high flux time interval.) It demonstrates that these signals are at a high statistical level and also a potential for revealing new -ray-emitting sources using a variable-size sliding-time-window, see also the signals, N09 and N12, in Sects. 3.2 and 3.3.
 |
|
 |
 |
 |
To give us confidence in the reliability of computed time windows, we examined the temporal behavior of the signals, N03 and N04, and found that the week during which the change in flux occurred for the signal, N03, and its duration are compatible with those which are reported by Stappers et al. (2014) and Xing et al. (2018) and that the week during which the signal, N04, occurred is the same as that which is reported by Ackermann et al. (2014). The signal, N03, is associated with a transitional millisecond pulsar binary, PSR J1023+0038, which changed its state from the disk-free state to the active state of having an accretion disk in June 2013 (Stappers et al., 2014). The position of PSR J1023+0038 is at a distance of from LSQ13afs from the Open Supernova Catalog and some of its rays are therefore inside the aperture of radius around the position of LSQ13afs. Given both the multi-wavelength confirmation and the physical phenomenon, the detection of a signal, N03, through our variable-size sliding-time-window analysis is not surprising, but the signal is associated with PSR J1023+0038. The -ray burst, GRB 130427A, identified with the signal, N04, had the high fluence, highest-energy photon (95 GeV), long -ray duration (20 hours), see Ackermann et al. (2014). GRB 130427A is listed as a SN in the the Open Supernova Catalog and is indeed associated with a Type Ic SN, SN 2013cq (Xu et al., 2013; Melandri et al., 2014).
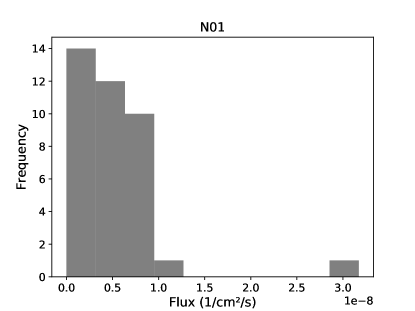
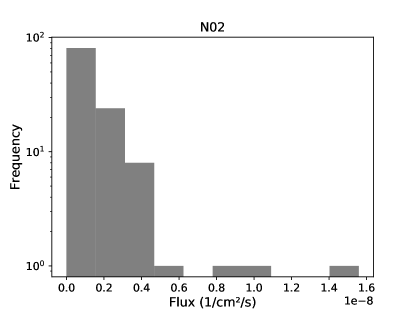
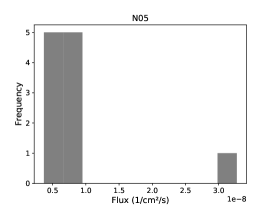
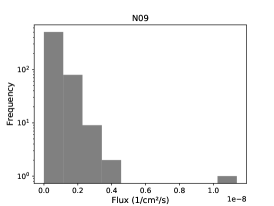
Since the performed analysis establishes the most significant bright state in the flux evolution with time, the presence of a number of bright-flux states for a given position in the sky is not excluded. To check if the new -ray transient signals shown in Table 1 come from the sources producing multiple flares, we constructed a histogram for each of these five positions. For this purpose, we binned both the counts and exposures in the time intervals with length taken from Table 1 in such a way that one of these bins contains the bright state, and used the sum of fluxes over the three energy bands. Figure 3 shows the computed histograms. We found that the bright state for each of the five positions corresponds to the highest flux in the histogram. Only the histogram for N02 indicates a possible extended “tail” to high fluxes containing a few bright events, while the other four signals show a single bright signal. The two events with high fluxes of and ph cm-2s-1 for N02 occurred 15 weeks after and 3.7 years before, respectively, the brightest event which lasted for 5 weeks. To study the possible existence of a secondary bright state in N02, we removed the most significant bright state from the data and after that re-ran a sliding-time-window analysis. This additional analysis did not result in any identification of a new bright state at a local significance level above 5 standard deviations.
3.2 Source of the set
The set, , contains three transient signals including the signals identified with GRB 171010A and iPTF14hls. GRB 171010A is in the catalog of GRBs detected by Fermi-LAT (Ajello et al., 2019) and SN 2017htp, a Type Ib/c core-collapse SN, is associated with the long GRB 171010A (Melandri et al., 2019). The connection between long-duration GRBs, such GRBs 130427A and 171010A, with Type Ic core-collapse SNe is well established (Woosley & Bloom, 2006) and the presence of these two SNe in Table 1 is physically motivated. Given that two signals from the sets, and , are associated with long-duration GRBs, 130427A and 171010A, and that the transient signal from PSR J1023+0038 is not associated with (and is even at a significant spatial offset from) a corresponding SN, only 5 transient -ray signals in Table 1 remain to be explained.
The signal, N05, has not yet been associated with any known -ray sources. We performed binned likelihood analysis of the source located at the position of a corresponding SN, SN2018gxi. The details of this likelihood analysis are similar to those described in Sect. 3.1. The analysis shows the presence of a -ray source at a statistical significance of during the selected time interval. However, we also found that the best-fit position of this -ray source is at (RA, Dec)=(16.14∘, -22.22∘) which is at an offset of and the significance of a source at this position is . The difference in log-likelihood values is 20 and is thus significantly exceeds the value of 11.6/2 corresponding to 0.3% (that is at 2 degrees of freedom divided by 2). Given this evidence for the presence of a spatial offset from the position of SN 2018gxi and the fact that the variability of signals from the set, , is less significant than that of signals from the set, , we consider the probability that the signals, N01 and/or N02, are associated with transient events from the Open Supernova Catalog is higher. However, while the transient event, SN 2018gxi, is associated with a Type II SN in the Open Supernova Catalog, the transient events, AT2018iwp and AT2019bvr, are indicated as candidates to SNe666AT2018iwp is classified as a transient associated with AGN activity in https://lasair.roe.ac.uk/object/ZTF18acakour/. By testing 55,880 positions, we found only three sources, AT2018iwp, AT2019bvr, and SN 2018gxi, in addition to iPTF14hls which brightened within 300 days after their discovery date.
3.3 Sources of the set
The set, , is the largest of the three sets and contains 18 -ray signals. Two of these signals are newly detected, while the remaining signals are firmly identified.
The newly detected -ray signals, N08 and N09, are in the directions of GRB 080727C and SN2018ggc and started in March 2017 and January 2018, respectively. Given that the large time gap between the discovery date and the start time of -ray signals, their associations with SNe are very unlikely. We therefore searched for blazars located at nearby positions in the sky among the sources in the Candidate Gamma-Ray Blazar Survey (CGRaBS) source catalog (Healey et al., 2008). We found that CGRaBS J0837+2454 is in the proximity of SN 2018ggc (N09) in the sky. We performed a binned likelihood analysis (with a similar setup to those described in Sect. 3.1) to search for a -ray source and found that a new -ray source at the position of SN 2018ggc is at a significance level (or if the position of CGRaBS J0837+2454 is adopted). The difference in log-likelihood values for the analyses which adopt different positions of a new source is 1.8 and the position of CGRaBS J0837+2454 is within a contour from the best-fit position, (that is ). We therefore associate the signal, N09, with CGRaBS J0837+2454.
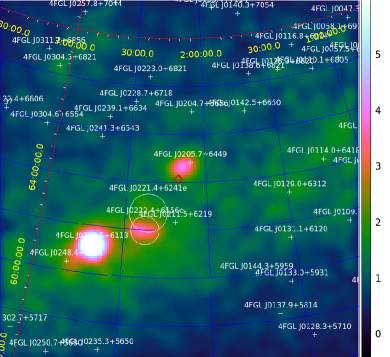
To study a signal, N08, in detail, we also performed a binned likelihood analysis. In contrast with N01 and N02, N08 is located at a low Galactic latitude of . Figure 4 shows a Gaussian () kernel smoothed count map corresponding to N08 and illustrates the presence of a -ray excess during the high flux time interval. The position of a -ray excess is shifted from the center of the count map towards the position of 4FGL J0205.7+6449 which is identified with PSR J0205+6449. Located at the center of supernova remnant/pulsar wind nebula 3C 58 at a distance of about 3.2 kpc, PSR J0205+6449 is a 65-millisecond young rotation-powered pulsar. We found that the -ray source at a position of 4FGL J0205.7+6449 is detected at a statistical level during the high -ray flux interval, with a -ray flux corresponding to times the flux level from the 4FGL-DR2 catalog. Given that the number of sources belonging to the Galactic plane, , in Table 1 is only 5 which include the Crab Nebula, Nova ASASSN-18fv, PSR J1826-1256, PSR J2021+4026, and the -ray source responsible for a high flux state, N08, the transient -ray signal, N08, is therefore a particularly interesting source for further investigation and identification.
The set of -ray signals, , also includes well established -ray transient phenomena including
(i) the solar flares that occurred on 2012 March 7, 2014 September 1, and 2017 September 10 (see, Ajello et al., 2014; Ackermann et al., 2017; Omodei et al., 2018, for more details);
(ii) -ray bursts including GRB 090510A, GRB 090926A, GRB 131231A, GRB 160625945, and GRB 160623209 (see, Ajello et al., 2019);
(iii) the Crab Nebula -ray ‘superflare’ that occurred on April 12, 2011 (Buehler et al., 2012);
(iv) Nova ASASSN-18fv (ATel #11546 on 2018 April 18)777Apart from this nova, we also identified Nova Mon 2012 (Atel #4310) in the aperture around AT2020qg among the bright state signals revealed above a global 4 sigma significance level;
(v) the quiescent Sun that passes through the corresponding regions in 2009 and 2019 during solar minima when the quiescent -ray emission of the solar disk is strong (see, e.g., Abdo et al., 2011; Barbiellini et al., 2014);
(vi) the transitional redback PSR J1227-4853 with a transition time of 2012 November 30 (Johnson et al., 2015), the variable PSR J2021+4026, which decreases in flux on 2011 October 16 (Allafort et al., 2013), and also PSR J1826-1256 which has already been discussed by Neronov et al. (2012) and Abdollahi et al. (2017).
(vii) FSRQ S5 0532+82 which is a -ray-emitting blazar announced in ATel #12902 in July 2019.
Given that the cases (i-vii) correspond to known physical phenomena, this fact confirms that our variable-size sliding-time-window analysis with two temporal variables leads to sensible results and allows a search for new transient -ray signals. It gives us confidence in newly detected transient signals, particularly N01, N02, and N08.
In Table1, there are only 3 highly significant transients which have not yet been identified, including N01, N02, and N08 (if N09 which is likely associated with a blazar CGRaBS J0837+2454 is excluded). Given that there are 14 300-day intervals in this data set, we find that the the chance to observe the onset of a transient event within 300 days after the corresponding SN explosion for two cases and not to observe it for the third case is (under the assumption that transients are rather short which is valid for sources, N01, N02, and N08). It means the association of these transients with SNe in time is significant only at a level and thus requires further investigation by means of an analysis of archival multi-wavelength data for the purpose of providing us with, or questioning, their association with SNe.
To verify the applicability of the trial factor derived in Sect. 2 to the transient signals, N01, N02, N05, N08, and N09, we simulated 1000 -ray light curves for each under the assumption of a steady mean flux and using the given distribution of exposures over 600 weeks and also the numpy.random.poisson routine to draw counts from the Poisson distribution. We found that the average values of local statistical levels from the performed simulations are 3.4, 3.4, 3.2, 3.6, and 3.3 for N01, N02, N05, N08, and N09, respectively, while the corresponding standard deviations are 0.4. These average values are compatible with those which we derived in Sect. 2 by means of another method. We checked and found that our classification of these transient signals into the sets, X, Y, and Z, done in Sect. 3 is valid. By applying the sliding-time-window analysis we found that none of these 5000 simulated steady-state light curves results in a transient signal with a global significance level above 5 which is in line with the expectations.
4 All-sky search for transients
To apply our method for an all-sky search for transients, we generated 111760 random positions uniformly distributed over the sky. The number of random positions is selected to cover a significant fraction of the sky, square degrees. The surface of the entire sky is square degrees. Moreover, given that , we can divide the set of sources at random positions in two equal subsets, RS1 and RS2. For both these subsets we used the same criterion as that used for the sample, A. The sources which satisfy this selection criterion are listed in Table 2.
| # | Set | R.A. | Dec. | -ray bright | Length | Local. | Id./Assn. (/) |
| (hh:mm:ss) | (hh:mm:ss) | state from | (week) | signif. | |||
| (yr/m/d) | |||||||
| R01 | RS2 | 01:04:53 | -22:22:19 | 2019/01/21 | 53 | 6.9 | new, N05 (Table 1) |
| R02 | RS1 | 02:43:51 | +61:04:31 | 2014/02/17 | 176 | 7.4 | LS I +61∘303 |
| R03 | RS1 | 04:42:09 | +47:15:01 | 2018/04/30 | 1 | 8.0 | Nova V392 Per |
| R04 | RS1 | 06:38:47 | +06:03:23 | 2012/06/18 | 2 | 6.2 | Nova V959 Mon 2012 |
| R05 | RS2 | 07:59:46 | -56:39:30 | 2008/09/15 | 1 | GRB 080916C | |
| R06 | RS1 | 20:22:47 | +20:38:10 | 2013/08/12 | 2 | Nova V339 Del 2013 | |
| R07 | RS1 | 13:54:18 | -59:07:33 | 2013/11/18 | 10 | 6.0 | Nova V1369 Cen 2013 |
| R08 | RS2 | 17:54:12 | +24:59:53 | 2014/02/03 | 21 | 6.9 | 4FGL J1753.9+2443 |
| R09 | RS1 | 18:20:50 | -28:01:38 | 2016/11/07 | 2 | Nova V5856 Sgr | |
| R10 | RS1 | 19:35:44 | -55:01:35 | 2016/10/10 | 18 | 6.9 | new |
| R11 | RS2 | 21:00:27 | -08:55:08 | 2014/02/03 | 1 | 6.1 | GRB 140206B |
| R12 | RS2 | 21:03:09 | +45:53:26 | 2010/03/08 | 3 | Nova V407 Cyg 2010 | |
| R13 | RS1 | 21:12:09 | +37:32:07 | 2013/07/29 | 7 | 7.3 | 2FAV J2111+37.6 |
| R14 | RS2 | 21:29:44 | -14:55:29 | 2013/02/04 | 1 | 6.3 | solar event, 2013 Feb 08 |
The all-sky search allows us to confirm a number of already reported non-AGN transient sources in addition to those reported in Table 1. These sources include six novae, including V392 Per 2018 (ATel #11590 in May 2018), V959 Mon 2012, V339 Del 2013, V1369 Cen 2013, V5856 Sgr 2016 (Li et al., 2017), and V407 Cyg 2010 (see also Franckowiak et al., 2018). These sources also include two -ray bursts, GRB 080916C and GRB 140206B (see Ajello et al., 2019), and a -ray binary, LS I +61∘303888The all-sky search revealed two signals at lower local significances of 5.95 and 5.97. The former signal is from GRB 090902B (Abdo et al., 2009). The latter signal is at (RA, Dec)=(238.695 deg, -2.761 deg) near the position of a SN candidate, Gaia17adr, and started in July 2017 within 300 days after the SN event.. This -ray binary is known for its long-term -ray variability associated with a superorbital period and the start of a high--ray-flux state on the date indicated in Table 2 corresponds to the maximum after 1667 days (i.e., the superorbital period) since the previous maximum reported by Ackermann et al. (2013b). The signal, R14, is due to solar emission, since it coincides both in time and position with the Sun. The quiescent -ray emission from the Sun is maximal during the solar minimum (Abdo et al., 2011, when the heliospheric flux of Galactic cosmic-rays is maximal) and it is consistent with the two (solar track) signals in 2009 and 2019 listed in Table 1. The -ray signal, R14, occurred in 2013, i.e. during the solar maximum, however the authors are unaware of any solar flare on 2013 February 8999https://www.spaceweatherlive.com/en/archive/2013/02/08/xray.html.
Apart from these known -ray transients, the search also suggests that the Geminga pulsar shows a long-term variability at a local significance level of . Given that Geminga is very bright in rays, systematic errors, which are not taken into account in our analysis, might exceed statistical ones and this source thus requires a dedicated analysis and is not included in Table 2 (see also Pshirkov & Rubtsov, 2013).
The subset, RS1, contains four unidentified signals, R10, R13, N02, and N08, while the subset, RS2, contains three unidentified signals, R01, R08, and N08. So the entire set contains six unidentified signals. The probability of detecting (1) four unidentified sources in the subset, RS1, by mere chance is and (2) three unidentified sources in the subset, RS2, by mere chance is . The probability of detecting six unidentified sources in the entire set is , where the factor of 0.75 is introduced in order to take the sources overlapping in the two subsets into account. This constitutes evidence for the -ray emission from unidentified transient sources in the entire set. Two of these six sources, R08 and R13, are present as unidentified sources, 4FGL J1753.9+2443 and 2FAV J2111+37.6, in the Fermi-LAT 4FGL and 2FAV catalogs, respectively. The performed all-sky search revealed the signal, R01, associated with the signal, N05, from the set, Y, but at a higher statistical level. It is owing to the fact that the position of R01 is closer than that of N05 ( vs ) to the best-fit position of this candidate -ray source.
The sample, A, contains four unidentified signals and this number is compatible with those for the sub-sets, RS1 and RS2. It constitutes evidence for the -ray emission from unidentified transient sources in the sample, A. To establish the origin of these signals and to check whether some of them, N01 and N02, are indeed due to SN events (see Sect. 3.1), simultaneous and follow-up multiwavelength observations of all these unidentified candidate sources are required in addition to the existing optical surveys.
5 Summary
We developed a variable-size sliding-time-window analysis and applied it to search for transient -ray signals from 55,880 SNe listed in the Open Supernova Catalog using 11.5 years of the Fermi-LAT data. In this paper, we reported four new -ray transient signals revealed by means of a variable-size sliding-time-window technique with global confidence above each. We labeled these four transient -ray signals as N01, N02, N08, and N09 in Table 1. The -ray signals, N01 and N02, occurred in 2019 in the directions of SN candidates, AT2018iwp and AT2019bvr, with their flux increases within 6 months after the reported dates of the SN candidates’ discoveries. Given the probability of detecting two new sources in the set, , by mere chance (see Sect. 3.1), this constitutes evidence for -ray emission from transient sources occurring in the directions of SN candidates. We obtained a strong detection of -ray sources at these two positions during the high flux time intervals at and statistical levels. The -ray signal, N08, occurred in 2017 and detected at during the high flux time interval corresponds to a -ray source at a low Galactic latitude in the direction of PSR J0205+6449. The fourth new transient signal occurred in 2018 and is likely due to -ray activity of a blazar, CGRaBS J0837+2454. The transient -ray signal tentatively associated with SN iPTF14hls by Yuan et al. (2018) is present in Table1, but its significance provided by a variable-size sliding-time-window analysis is lower than those of -ray signals, N01 and N02.
Among the 22 signals provided by our variable-size sliding-time-window analysis with global confidence above (see the sets, and ), we found that 17 of them are owing to the well known astrophysical phenomena observed in rays101010Given the comment by Abdollahi et al. (2017), the source, PSR J1826-1256, requires a dedicated analysis of its identification., such as GRBs, solar flares, transitional pulsars, novae, flares from the Crab nebula, and the moving quiescent Sun. The developed analysis proved to be reliable in finding both short (e.g. solar flares) and long (e.g. transitional pulsars) bright states. This fact indicates that the three new transient -ray signals, N01, N02, and N08, are most likely due to astrophysical phenomena and therefore require further investigation for their identification. We also performed an all-sky search for -ray transient sources. It resulted in two new signals, R01 and R10. The total numbers of transient -ray signals from both these analyses is 37, and 8 of them require identification. This deserves an exploration of existing archival multi-wavelength observations.
6 Data availability
Fermi-LAT data analyzed in this paper are publicly distributed by the LAT team and can be downloaded from the LAT Data Server. The python code developed in this paper and used to produce the results of the paper is publicly accessible at https://zenodo.org/record/4739389.
7 Acknowledgements
We are grateful to the referee for the constructive suggestions that helped us to improve the manuscript. Computations were performed on the computational facilities belonging to the ALMA Regional Center Taiwan, Academia Sinica, Taiwan.
References
- Abdalla et al. (2019) Abdalla H. et al., 2019, A&A, 626, A57
- Abdo et al. (2009) Abdo A. A., Ackermann M., Ajello M., Asano K., Atwood W. B., Axelsson M., Baldini L., et al., 2009, ApJ, 706, L138
- Abdo et al. (2011) Abdo A. A. et al., 2011, ApJ, 734, 116
- Abdollahi et al. (2020) Abdollahi S. et al., 2020, ApJS, 247, 33
- Abdollahi et al. (2017) Abdollahi S. et al., 2017, ApJ, 846, 34
- Ackermann et al. (2013a) Ackermann M. et al., 2013a, ApJ, 771, 57
- Ackermann et al. (2015a) Ackermann M., Ajello M., Albert A., Atwood W. B., Baldini L., Ballet J., Barbiellini G., et al., 2015a, ApJ, 813, L41
- Ackermann et al. (2014) Ackermann M. et al., 2014, Science, 343, 42
- Ackermann et al. (2013b) Ackermann M., Ajello M., Ballet J., Barbiellini G., Bastieri D., Bellazzini R., Bonamente, et al., 2013b, ApJ, 773, L35
- Ackermann et al. (2017) Ackermann M., Allafort A., Baldini L., Barbiellini G., Bastieri D., Bellazzini R., Bissaldi E., et al., 2017, ApJ, 835, 219
- Ackermann et al. (2015b) Ackermann M. et al., 2015b, ApJ, 807, 169
- Ajello et al. (2014) Ajello M. et al., 2014, ApJ, 789, 20
- Ajello et al. (2019) Ajello M., Arimoto M., Axelsson M., Baldini L., Barbiellini G., Bastieri D., Bellazzini R., et al., 2019, ApJ, 878, 52
- Allafort et al. (2013) Allafort A., Baldini L., Ballet J., Barbiellini G., Baring M. G., Bastieri D., Bellazzini R., et al., 2013, ApJ, 777, L2
- Arcavi et al. (2017) Arcavi I. et al., 2017, Nature, 551, 210
- Arnett et al. (1989) Arnett W. D., Bahcall J. N., Kirshner R. P., Woosley S. E., 1989, ARA&A, 27, 629
- Atwood et al. (2009) Atwood W. B. et al., 2009, ApJ, 697, 1071
- Ballet et al. (2020) Ballet J., Burnett T. H., Digel S. W., Lott B., 2020, astro-ph/2005.11208, arXiv:2005.11208
- Barbiellini et al. (2014) Barbiellini G. et al., 2014, ApJ, 784, 118
- Berezhko et al. (2015) Berezhko E. G., Ksenofontov L. T., Völk H. J., 2015, ApJ, 810, 63
- Bethe (1990) Bethe H. A., 1990, Reviews of Modern Physics, 62, 801
- Buehler et al. (2012) Buehler R. et al., 2012, ApJ, 749, 26
- Diehl et al. (2006) Diehl R. et al., 2006, Nature, 439, 45
- Dwarkadas (2013) Dwarkadas V. V., 2013, MNRAS, 434, 3368
- Dwarkadas & Gruszko (2012) Dwarkadas V. V., Gruszko J., 2012, MNRAS, 419, 1515
- Franckowiak et al. (2018) Franckowiak A., Jean P., Wood M., Cheung C. C., Buson S., 2018, A&A, 609, A120
- Guillochon et al. (2017) Guillochon J., Parrent J., Kelley L. Z., Margutti R., 2017, ApJ, 835, 64
- Healey et al. (2008) Healey S. E. et al., 2008, ApJS, 175, 97
- Hillebrandt & Niemeyer (2000) Hillebrandt W., Niemeyer J. C., 2000, ARA&A, 38, 191
- Johnson et al. (2015) Johnson T. J. et al., 2015, ApJ, 806, 91
- Kantzas et al. (2016) Kantzas D., Petropoulou M., Mastichiadis A., 2016, in Supernova Remnants: An Odyssey in Space after Stellar Death, p. 139
- Law et al. (2009) Law N. M. et al., 2009, PASP, 121, 1395
- Li et al. (2017) Li K.-L. et al., 2017, Nature Astronomy, 1, 697
- Melandri et al. (2019) Melandri A. et al., 2019, MNRAS, 490, 5366
- Melandri et al. (2014) Melandri A. et al., 2014, A&A, 567, A29
- Murase et al. (2011) Murase K., Thompson T. A., Lacki B. C., Beacom J. F., 2011, Phys. Rev. D., 84, 043003
- Neronov et al. (2012) Neronov A., Malyshev D., Chernyakova M., Lutovinov A., 2012, A&A, 543, L9
- Omodei et al. (2018) Omodei N., Pesce-Rollins M., Longo F., Allafort A., Krucker S., 2018, ApJ, 865, L7
- Prokhorov & Moraghan (2016) Prokhorov D. A., Moraghan A., 2016, MNRAS, 457, 2433
- Prokhorov & Moraghan (2017) Prokhorov D. A., Moraghan A., 2017, MNRAS, 471, 3036
- Prokhorov & Moraghan (2019) Prokhorov D. A., Moraghan A., 2019, MNRAS, 490, 5440
- Pshirkov & Rubtsov (2013) Pshirkov M. S., Rubtsov G. I., 2013, Journal of Experimental and Theoretical Physics, 116, 59
- Renault-Tinacci et al. (2018) Renault-Tinacci N., Kotera K., Neronov A., Ando S., 2018, A&A, 611, A45
- Stappers et al. (2014) Stappers B. W. et al., 2014, ApJ, 790, 39
- Vink (2017) Vink J., 2017, Supernova 1604, Kepler’s Supernova, and its Remnant, Alsabti A. W., Murdin P., eds., p. 139
- Weiler et al. (2002) Weiler K. W., Panagia N., Montes M. J., Sramek R. A., 2002, ARA&A, 40, 387
- Woosley (2018) Woosley S. E., 2018, ApJ, 863, 105
- Woosley & Bloom (2006) Woosley S. E., Bloom J. S., 2006, ARA&A, 44, 507
- Xing et al. (2018) Xing Y., Wang Z.-X., Takata J., 2018, Research in Astronomy and Astrophysics, 18, 127
- Xu et al. (2013) Xu D. et al., 2013, ApJ, 776, 98
- Yuan et al. (2018) Yuan Q., Liao N.-H., Xin Y.-L., Li Y., Fan Y.-Z., Zhang B., Hu H.-B., Bi X.-J., 2018, ApJ, 854, L18