Seasonal Variation of Multiple-Muon Cosmic Ray Air Showers Observed in the NOvA Detector on the Surface
M. A. Acero
Universidad del Atlantico,
Carrera 30 No. 8-49, Puerto Colombia, Atlantico, Colombia
P. Adamson
Fermi National Accelerator Laboratory, Batavia,
Illinois 60510, USA
L. Aliaga
Fermi National Accelerator Laboratory, Batavia,
Illinois 60510, USA
N. Anfimov
Joint Institute for Nuclear Research,
Dubna, Moscow region 141980, Russia
A. Antoshkin
Joint Institute for Nuclear Research,
Dubna, Moscow region 141980, Russia
E. Arrieta-Diaz
Universidad del Magdalena, Carrera 32 No 22-08 Santa Marta, Colombia
L. Asquith
Department of Physics and Astronomy, University of
Sussex, Falmer, Brighton BN1 9QH, United Kingdom
A. Aurisano
Department of Physics, University of Cincinnati,
Cincinnati, Ohio 45221, USA
A. Back
Department of Physics and Astronomy, Iowa State
University, Ames, Iowa 50011, USA
C. Backhouse
Physics and Astronomy Department, University College
London,
Gower Street, London WC1E 6BT, United Kingdom
M. Baird
Indiana University, Bloomington, Indiana 47405,
USA
Department of Physics and Astronomy, University of
Sussex, Falmer, Brighton BN1 9QH, United Kingdom
Department of Physics, University of Virginia,
Charlottesville, Virginia 22904, USA
N. Balashov
Joint Institute for Nuclear Research,
Dubna, Moscow region 141980, Russia
P. Baldi
Department of Physics and Astronomy,
University of California at Irvine, Irvine, California 92697, USA
B. A. Bambah
School of Physics, University of Hyderabad,
Hyderabad, 500 046, India
S. Bashar
Department of Physics and Astronomy, Tufts University, Medford,
Massachusetts 02155, USA
K. Bays
California Institute of
Technology, Pasadena, California 91125, USA
Illinois Institute of Technology,
Chicago IL 60616, USA
R. Bernstein
Fermi National Accelerator Laboratory, Batavia,
Illinois 60510, USA
V. Bhatnagar
Department of Physics, Panjab University,
Chandigarh, 160 014, India
B. Bhuyan
Department of Physics, IIT Guwahati, Guwahati, 781
039, India
J. Bian
Department of Physics and Astronomy,
University of California at Irvine, Irvine, California 92697, USA
School of Physics and Astronomy, University of
Minnesota Twin Cities, Minneapolis, Minnesota 55455, USA
J. Blair
Department of Physics,
University of Houston, Houston, Texas 77204, USA
A. C. Booth
Department of Physics and Astronomy, University of
Sussex, Falmer, Brighton BN1 9QH, United Kingdom
R. Bowles
Indiana University, Bloomington, Indiana 47405,
USA
C. Bromberg
Department of Physics and Astronomy, Michigan State
University, East Lansing, Michigan 48824, USA
N. Buchanan
Department of Physics, Colorado
State University, Fort Collins, CO 80523-1875, USA
A. Butkevich
Institute for Nuclear Research of Russia, Academy of
Sciences 7a, 60th October Anniversary prospect, Moscow 117312, Russia
S. Calvez
Department of Physics, Colorado
State University, Fort Collins, CO 80523-1875, USA
T. J. Carroll
Department of Physics, University of Texas at Austin,
Austin, Texas 78712, USA
Department of Physics, University of
Wisconsin-Madison, Madison, Wisconsin 53706, USA
E. Catano-Mur
Department of Physics, William & Mary,
Williamsburg, Virginia 23187, USA
B. C. Choudhary
Department of Physics and Astrophysics, University of
Delhi, Delhi 110007, India
A. Christensen
Department of Physics, Colorado
State University, Fort Collins, CO 80523-1875, USA
T. E. Coan
Department of Physics, Southern Methodist University,
Dallas, Texas 75275, USA
M. Colo
Department of Physics, William & Mary,
Williamsburg, Virginia 23187, USA
L. Cremonesi
School of Physics and Astronomy,
Queen Mary University of London,
London E1 4NS, United Kingdom
Physics and Astronomy Department, University College
London,
Gower Street, London WC1E 6BT, United Kingdom
G. S. Davies
University of Mississippi, University, Mississippi 38677, USA
Indiana University, Bloomington, Indiana 47405,
USA
P. F. Derwent
Fermi National Accelerator Laboratory, Batavia,
Illinois 60510, USA
P. Ding
Fermi National Accelerator Laboratory, Batavia,
Illinois 60510, USA
Z. Djurcic
Argonne National Laboratory, Argonne, Illinois 60439,
USA
M. Dolce
Department of Physics and Astronomy, Tufts University, Medford,
Massachusetts 02155, USA
D. Doyle
Department of Physics, Colorado
State University, Fort Collins, CO 80523-1875, USA
D. Dueñas Tonguino
Department of Physics, University of Cincinnati,
Cincinnati, Ohio 45221, USA
E. C. Dukes
Department of Physics, University of Virginia,
Charlottesville, Virginia 22904, USA
H. Duyang
Department of Physics and Astronomy, University of
South Carolina, Columbia, South Carolina 29208, USA
S. Edayath
Department of Physics, Cochin University
of Science and Technology, Kochi 682 022, India
R. Ehrlich
Department of Physics, University of Virginia,
Charlottesville, Virginia 22904, USA
M. Elkins
Department of Physics and Astronomy, Iowa State
University, Ames, Iowa 50011, USA
E. Ewart
Indiana University, Bloomington, Indiana 47405,
USA
G. J. Feldman
Department of Physics, Harvard University,
Cambridge, Massachusetts 02138, USA
P. Filip
Institute of Physics, The Czech
Academy of Sciences,
182 21 Prague, Czech Republic
J. Franc
Czech Technical University in Prague,
Brehova 7, 115 19 Prague 1, Czech Republic
M. J. Frank
Department of Physics, University of
South Alabama, Mobile, Alabama 36688, USA
H. R. Gallagher
Department of Physics and Astronomy, Tufts University, Medford,
Massachusetts 02155, USA
R. Gandrajula
Department of Physics and Astronomy, Michigan State
University, East Lansing, Michigan 48824, USA
Department of Physics, University of Virginia,
Charlottesville, Virginia 22904, USA
F. Gao
Department of Physics,
University of Pittsburgh, Pittsburgh, Pennsylvania 15260, USA
A. Giri
Department of Physics, IIT Hyderabad, Hyderabad,
502 205, India
R. A. Gomes
Instituto de Física, Universidade Federal de
Goiás, Goiânia, Goiás, 74690-900, Brazil
M. C. Goodman
Argonne National Laboratory, Argonne, Illinois 60439,
USA
V. Grichine
Nuclear Physics and Astrophysics Division, Lebedev
Physical
Institute, Leninsky Prospect 53, 119991 Moscow, Russia
M. Groh
Department of Physics, Colorado
State University, Fort Collins, CO 80523-1875, USA
Indiana University, Bloomington, Indiana 47405,
USA
R. Group
Department of Physics, University of Virginia,
Charlottesville, Virginia 22904, USA
B. Guo
Department of Physics and Astronomy, University of
South Carolina, Columbia, South Carolina 29208, USA
A. Habig
Department of Physics and Astronomy,
University of Minnesota Duluth, Duluth, Minnesota 55812, USA
F. Hakl
Institute of Computer Science, The Czech
Academy of Sciences,
182 07 Prague, Czech Republic
A. Hall
Department of Physics, University of Virginia,
Charlottesville, Virginia 22904, USA
J. Hartnell
Department of Physics and Astronomy, University of
Sussex, Falmer, Brighton BN1 9QH, United Kingdom
R. Hatcher
Fermi National Accelerator Laboratory, Batavia,
Illinois 60510, USA
H. Hausner
Department of Physics, University of
Wisconsin-Madison, Madison, Wisconsin 53706, USA
K. Heller
School of Physics and Astronomy, University of
Minnesota Twin Cities, Minneapolis, Minnesota 55455, USA
J. Hewes
Department of Physics, University of Cincinnati,
Cincinnati, Ohio 45221, USA
A. Himmel
Fermi National Accelerator Laboratory, Batavia,
Illinois 60510, USA
A. Holin
Physics and Astronomy Department, University College
London,
Gower Street, London WC1E 6BT, United Kingdom
B. Jargowsky
Department of Physics and Astronomy,
University of California at Irvine, Irvine, California 92697, USA
J. Jarosz
Department of Physics, Colorado
State University, Fort Collins, CO 80523-1875, USA
F. Jediny
Czech Technical University in Prague,
Brehova 7, 115 19 Prague 1, Czech Republic
C. Johnson
Department of Physics, Colorado
State University, Fort Collins, CO 80523-1875, USA
M. Judah
Department of Physics, Colorado
State University, Fort Collins, CO 80523-1875, USA
Department of Physics,
University of Pittsburgh, Pittsburgh, Pennsylvania 15260, USA
I. Kakorin
Joint Institute for Nuclear Research,
Dubna, Moscow region 141980, Russia
D. Kalra
Department of Physics, Panjab University,
Chandigarh, 160 014, India
D. M. Kaplan
Illinois Institute of Technology,
Chicago IL 60616, USA
A. Kalitkina
Joint Institute for Nuclear Research,
Dubna, Moscow region 141980, Russia
R. Keloth
Department of Physics, Cochin University
of Science and Technology, Kochi 682 022, India
O. Klimov
Joint Institute for Nuclear Research,
Dubna, Moscow region 141980, Russia
L. W. Koerner
Department of Physics,
University of Houston, Houston, Texas 77204, USA
L. Kolupaeva
Joint Institute for Nuclear Research,
Dubna, Moscow region 141980, Russia
S. Kotelnikov
Nuclear Physics and Astrophysics Division, Lebedev
Physical
Institute, Leninsky Prospect 53, 119991 Moscow, Russia
R. Kralik
Department of Physics and Astronomy, University of
Sussex, Falmer, Brighton BN1 9QH, United Kingdom
Ch. Kullenberg
Joint Institute for Nuclear Research,
Dubna, Moscow region 141980, Russia
M. Kubu
Czech Technical University in Prague,
Brehova 7, 115 19 Prague 1, Czech Republic
A. Kumar
Department of Physics, Panjab University,
Chandigarh, 160 014, India
C. D. Kuruppu
Department of Physics and Astronomy, University of
South Carolina, Columbia, South Carolina 29208, USA
V. Kus
Czech Technical University in Prague,
Brehova 7, 115 19 Prague 1, Czech Republic
T. Lackey
Indiana University, Bloomington, Indiana 47405,
USA
K. Lang
Department of Physics, University of Texas at Austin,
Austin, Texas 78712, USA
P. Lasorak
Department of Physics and Astronomy, University of
Sussex, Falmer, Brighton BN1 9QH, United Kingdom
J. Lesmeister
Department of Physics,
University of Houston, Houston, Texas 77204, USA
S. Lin
Department of Physics, Colorado
State University, Fort Collins, CO 80523-1875, USA
A. Lister
Department of Physics, University of
Wisconsin-Madison, Madison, Wisconsin 53706, USA
J. Liu
Department of Physics and Astronomy,
University of California at Irvine, Irvine, California 92697, USA
M. Lokajicek
Institute of Physics, The Czech
Academy of Sciences,
182 21 Prague, Czech Republic
S. Magill
Argonne National Laboratory, Argonne, Illinois 60439,
USA
M. Manrique Plata
Indiana University, Bloomington, Indiana 47405,
USA
W. A. Mann
Department of Physics and Astronomy, Tufts University, Medford,
Massachusetts 02155, USA
M. L. Marshak
School of Physics and Astronomy, University of
Minnesota Twin Cities, Minneapolis, Minnesota 55455, USA
M. Martinez-Casales
Department of Physics and Astronomy, Iowa State
University, Ames, Iowa 50011, USA
V. Matveev
Institute for Nuclear Research of Russia, Academy of
Sciences 7a, 60th October Anniversary prospect, Moscow 117312, Russia
B. Mayes
Department of Physics and Astronomy, University of
Sussex, Falmer, Brighton BN1 9QH, United Kingdom
M. D. Messier
Indiana University, Bloomington, Indiana 47405,
USA
H. Meyer
Department of Mathematics, Statistics, and Physics,
Wichita State University,
Wichita, Kansas 67206, USA
T. Miao
Fermi National Accelerator Laboratory, Batavia,
Illinois 60510, USA
W. H. Miller
School of Physics and Astronomy, University of
Minnesota Twin Cities, Minneapolis, Minnesota 55455, USA
S. R. Mishra
Department of Physics and Astronomy, University of
South Carolina, Columbia, South Carolina 29208, USA
A. Mislivec
School of Physics and Astronomy, University of
Minnesota Twin Cities, Minneapolis, Minnesota 55455, USA
R. Mohanta
School of Physics, University of Hyderabad,
Hyderabad, 500 046, India
A. Moren
Department of Physics and Astronomy,
University of Minnesota Duluth, Duluth, Minnesota 55812, USA
A. Morozova
Joint Institute for Nuclear Research,
Dubna, Moscow region 141980, Russia
W. Mu
Fermi National Accelerator Laboratory, Batavia,
Illinois 60510, USA
L. Mualem
California Institute of
Technology, Pasadena, California 91125, USA
M. Muether
Department of Mathematics, Statistics, and Physics,
Wichita State University,
Wichita, Kansas 67206, USA
K. Mulder
Physics and Astronomy Department, University College
London,
Gower Street, London WC1E 6BT, United Kingdom
D. Naples
Department of Physics,
University of Pittsburgh, Pittsburgh, Pennsylvania 15260, USA
N. Nayak
Department of Physics and Astronomy,
University of California at Irvine, Irvine, California 92697, USA
J. K. Nelson
Department of Physics, William & Mary,
Williamsburg, Virginia 23187, USA
R. Nichol
Physics and Astronomy Department, University College
London,
Gower Street, London WC1E 6BT, United Kingdom
E. Niner
Fermi National Accelerator Laboratory, Batavia,
Illinois 60510, USA
A. Norman
Fermi National Accelerator Laboratory, Batavia,
Illinois 60510, USA
A. Norrick
Fermi National Accelerator Laboratory, Batavia,
Illinois 60510, USA
T. Nosek
Charles University, Faculty of Mathematics and Physics,
Institute of Particle and Nuclear Physics, Prague, Czech Republic
H. Oh
Department of Physics, University of Cincinnati,
Cincinnati, Ohio 45221, USA
A. Olshevskiy
Joint Institute for Nuclear Research,
Dubna, Moscow region 141980, Russia
T. Olson
Department of Physics and Astronomy, Tufts University, Medford,
Massachusetts 02155, USA
J. Ott
Department of Physics and Astronomy,
University of California at Irvine, Irvine, California 92697, USA
J. Paley
Fermi National Accelerator Laboratory, Batavia,
Illinois 60510, USA
R. B. Patterson
California Institute of
Technology, Pasadena, California 91125, USA
G. Pawloski
School of Physics and Astronomy, University of
Minnesota Twin Cities, Minneapolis, Minnesota 55455, USA
O. Petrova
Joint Institute for Nuclear Research,
Dubna, Moscow region 141980, Russia
R. Petti
Department of Physics and Astronomy, University of
South Carolina, Columbia, South Carolina 29208, USA
D. D. Phan
Department of Physics, University of Texas at Austin,
Austin, Texas 78712, USA
Physics and Astronomy Department, University College
London,
Gower Street, London WC1E 6BT, United Kingdom
R. K. Plunkett
Fermi National Accelerator Laboratory, Batavia,
Illinois 60510, USA
J. C. C. Porter
Department of Physics and Astronomy, University of
Sussex, Falmer, Brighton BN1 9QH, United Kingdom
A. Rafique
Argonne National Laboratory, Argonne, Illinois 60439,
USA
V. Raj
California Institute of
Technology, Pasadena, California 91125, USA
M. Rajaoalisoa
Department of Physics, University of Cincinnati,
Cincinnati, Ohio 45221, USA
B. Ramson
Fermi National Accelerator Laboratory, Batavia,
Illinois 60510, USA
B. Rebel
Fermi National Accelerator Laboratory, Batavia,
Illinois 60510, USA
Department of Physics, University of
Wisconsin-Madison, Madison, Wisconsin 53706, USA
P. Rojas
Department of Physics, Colorado
State University, Fort Collins, CO 80523-1875, USA
V. Ryabov
Nuclear Physics and Astrophysics Division, Lebedev
Physical
Institute, Leninsky Prospect 53, 119991 Moscow, Russia
O. Samoylov
Joint Institute for Nuclear Research,
Dubna, Moscow region 141980, Russia
M. C. Sanchez
Department of Physics and Astronomy, Iowa State
University, Ames, Iowa 50011, USA
S. Sánchez Falero
Department of Physics and Astronomy, Iowa State
University, Ames, Iowa 50011, USA
P. Shanahan
Fermi National Accelerator Laboratory, Batavia,
Illinois 60510, USA
A. Sheshukov
Joint Institute for Nuclear Research,
Dubna, Moscow region 141980, Russia
P. Singh
Department of Physics and Astrophysics, University of
Delhi, Delhi 110007, India
V. Singh
Department of Physics, Institute of Science, Banaras
Hindu University, Varanasi, 221 005, India
E. Smith
Indiana University, Bloomington, Indiana 47405,
USA
J. Smolik
Czech Technical University in Prague,
Brehova 7, 115 19 Prague 1, Czech Republic
P. Snopok
Illinois Institute of Technology,
Chicago IL 60616, USA
N. Solomey
Department of Mathematics, Statistics, and Physics,
Wichita State University,
Wichita, Kansas 67206, USA
A. Sousa
Department of Physics, University of Cincinnati,
Cincinnati, Ohio 45221, USA
K. Soustruznik
Charles University, Faculty of Mathematics and Physics,
Institute of Particle and Nuclear Physics, Prague, Czech Republic
M. Strait
School of Physics and Astronomy, University of
Minnesota Twin Cities, Minneapolis, Minnesota 55455, USA
L. Suter
Fermi National Accelerator Laboratory, Batavia,
Illinois 60510, USA
A. Sutton
Department of Physics, University of Virginia,
Charlottesville, Virginia 22904, USA
S. Swain
National Institute of Science Education and Research,
Khurda, 752050, Odisha, India
C. Sweeney
Physics and Astronomy Department, University College
London,
Gower Street, London WC1E 6BT, United Kingdom
B. Tapia Oregui
Department of Physics, University of Texas at Austin,
Austin, Texas 78712, USA
P. Tas
Charles University, Faculty of Mathematics and Physics,
Institute of Particle and Nuclear Physics, Prague, Czech Republic
T. Thakore
Department of Physics, University of Cincinnati,
Cincinnati, Ohio 45221, USA
R. B. Thayyullathil
Department of Physics, Cochin University
of Science and Technology, Kochi 682 022, India
J. Thomas
Physics and Astronomy Department, University College
London,
Gower Street, London WC1E 6BT, United Kingdom
Department of Physics, University of
Wisconsin-Madison, Madison, Wisconsin 53706, USA
E. Tiras
Department of Physics, Erciyes University, Kayseri 38030, Turkey
Department of Physics and Astronomy, Iowa State
University, Ames, Iowa 50011, USA
S. C. Tognini
Instituto de Física, Universidade Federal de
Goiás, Goiânia, Goiás, 74690-900, Brazil
J. Tripathi
Department of Physics, Panjab University,
Chandigarh, 160 014, India
J. Trokan-Tenorio
Department of Physics, William & Mary,
Williamsburg, Virginia 23187, USA
Y. Torun
Illinois Institute of Technology,
Chicago IL 60616, USA
J. Urheim
Indiana University, Bloomington, Indiana 47405,
USA
P. Vahle
Department of Physics, William & Mary,
Williamsburg, Virginia 23187, USA
Z. Vallari
California Institute of
Technology, Pasadena, California 91125, USA
J. Vasel
Indiana University, Bloomington, Indiana 47405,
USA
P. Vokac
Czech Technical University in Prague,
Brehova 7, 115 19 Prague 1, Czech Republic
T. Vrba
Czech Technical University in Prague,
Brehova 7, 115 19 Prague 1, Czech Republic
M. Wallbank
Department of Physics, University of Cincinnati,
Cincinnati, Ohio 45221, USA
T. K. Warburton
Department of Physics and Astronomy, Iowa State
University, Ames, Iowa 50011, USA
M. Wetstein
Department of Physics and Astronomy, Iowa State
University, Ames, Iowa 50011, USA
D. Whittington
Department of Physics, Syracuse University,
Syracuse NY 13210, USA
Indiana University, Bloomington, Indiana 47405,
USA
D. A. Wickremasinghe
Fermi National Accelerator Laboratory, Batavia,
Illinois 60510, USA
S. G. Wojcicki
Department of Physics, Stanford University,
Stanford, California 94305, USA
J. Wolcott
Department of Physics and Astronomy, Tufts University, Medford,
Massachusetts 02155, USA
W. Wu
Department of Physics and Astronomy,
University of California at Irvine, Irvine, California 92697, USA
Y. Xiao
Department of Physics and Astronomy,
University of California at Irvine, Irvine, California 92697, USA
A. Yallappa Dombara
Department of Physics, Syracuse University,
Syracuse NY 13210, USA
K. Yonehara
Fermi National Accelerator Laboratory, Batavia,
Illinois 60510, USA
S. Yu
Argonne National Laboratory, Argonne, Illinois 60439,
USA
Illinois Institute of Technology,
Chicago IL 60616, USA
Y. Yu
Illinois Institute of Technology,
Chicago IL 60616, USA
S. Zadorozhnyy
Institute for Nuclear Research of Russia, Academy of
Sciences 7a, 60th October Anniversary prospect, Moscow 117312, Russia
J. Zalesak
Institute of Physics, The Czech
Academy of Sciences,
182 21 Prague, Czech Republic
Y. Zhang
Department of Physics and Astronomy, University of
Sussex, Falmer, Brighton BN1 9QH, United Kingdom
R. Zwaska
Fermi National Accelerator Laboratory, Batavia,
Illinois 60510, USA
Abstract
We report the rate of cosmic ray air showers
with multiplicities exceeding 15 muon tracks recorded in the NOvA Far Detector between May 2016 and May 2018.
The detector is located on the surface under an overburden
of water equivalent.
We observe a seasonal dependence in the rate of multiple-muon showers,
which varies in magnitude with multiplicity and zenith angle.
During this period, the effective atmospheric temperature and surface pressure
ranged between and , respectively;
the shower rates are anti-correlated with the variation in the effective
temperature.
The variations are about
30% larger for the highest multiplicities
than the lowest multiplicities and 20%
larger for showers near the horizon than vertical showers.
††preprint: FERMILAB-PUB-21-224-ND
I Introduction
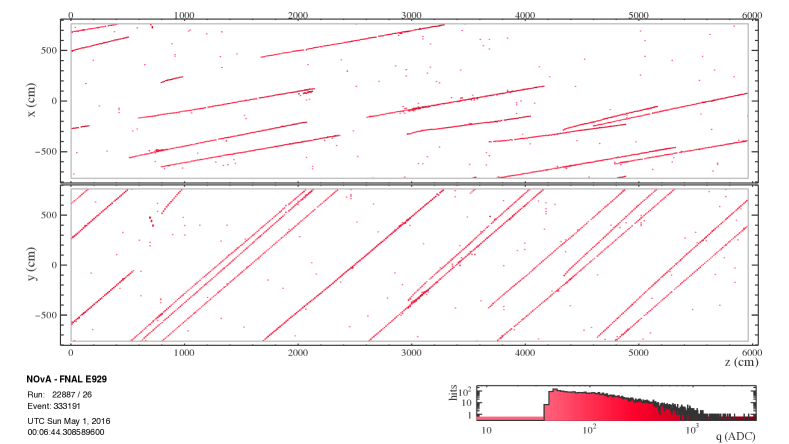
Figure 1: A multiple-muon air shower recorded in the NOvA detector.
The top is a view of the event from above the detector and the bottom is a view from the side.
Each linear set of hits is one muon traversing the detector.
The color corresponds to how much energy was deposited in each detector cell in units of ADC counts shown in the bottom right histogram.
Several experiments have observed seasonality in the rate of muons
from cosmic ray air showers which depends on the density
profile of the earth’s atmosphere.
As the density changes, the relative numbers
of pions and kaons which interact or decay in the
air showers change, altering the observed rate of muons.
During the summer months, when temperature is high and the density is lowest,
meson decays are more probable, which leads to an
expected peak in the muon rates.
This summer peak has been confirmed by many experiments in
single-muon air
showers [1, 2, 3, 4]
and is explained by existing models [5].
However, existing models fail to fully explain
the observations of multiple-muon air showers.
The DECOR [6] and GRAPES [7] experiments have
reported peak rates of multiple-muon showers in the winter in
detectors close to the surface, opposite to expectations
and observations for single-muons.
DECOR attributed its observation to geometric effects arising from altitude
differences in meson production.
The MINOS experiment [8] observed a winter peak in two underground detectors, with minimum muon energies of and ,
and showed that at a depth of at
least water equivalent the
effect from altitude differences suggested by
DECOR was too small to fully explain the observation.
NOvA also previously reported a peak rate in winter of
multiple-muon cosmic ray air showers using its Near Detector [9]
located at the same depth as one of the MINOS detectors with a threshold energy of .
The NOvA Far Detector is located near the surface where no seasonal variation is expected for low energy, single-muon air showers [10].
However, the Far Detector has a top surface area
which is 15 times larger than the Near Detector
making it sensitive to much higher multiplicity showers.
In this paper, we report the observation of a winter maximum
of multiple-muon air showers using NOvA’s Far Detector.
Since no quantitative models for multiple-muon air showers reproduce the effects we observe, the seasonal effect will be quantified using two different methods.
First, the rate of multiple-muon air showers is compared to the temperature and surface pressure of the atmosphere above the detector site and, second, by fitting the observed muon rate to a cosine function.
We also show how the strength of this observation varies
with observed muon multiplicity and arrival direction
in a surface detector for the first time.
II The NOvA Far Detector
The NOvA Far Detector is a
sampling calorimeter, in size, segmented into channels.
The channels are arranged into alternating horizontal and vertical planes.
The detector was designed to detect neutrino
interactions in the NuMI beam from Fermi National
Accelerator Laboratory [11].
It is located on the surface in Minnesota
near the U.S.-Canada Border at
.
The detector has been operating with more than 97% up-time efficiency since 2014.
This analysis samples 15% of the total cosmic ray data set collected between
May 2016 and May 2018. The detector design and detection
mechanism are described in [12].
The detector sits just below the surface level beneath an overburden to shield the detector from cosmic ray photons and electrons.
It consists of of
concrete and of barite rock
giving a total of water equivalent.
Three sides of the building are surrounded by a sloped berm of granite rock at to the surface.
This shielding is not present north of the detector where the detector assembly hall is located.
Above the horizon, this overburden adds an additional muon energy threshold of
, where is the zenith angle, to reach the detector.
On average, 10 billion cosmic ray muons traverse the detector each day.
Data from multiple-muon showers are recorded for analysis [13]
whenever the detector records total visible energy
in excess
of approximately of energy deposited
in a readout
distributed among at least 120
of the detector’s total of .
A typical muon with traversing the center of the detector will deposit around of visible energy.
III Atmospheric and Muon Data
The signal of muon air shower events in the
detector is a large number of coincident, parallel tracks.
Fig. 1 shows the signal topology of a multiple-muon shower recorded in the detector.
Reconstruction of these showers
begins by isolating the time range containing the activity
of interest from other detector activity and
suppressing isolated detector hits which do not contribute to tracks.
A Hough transform determines the overall shower
angle in each view of the detector.
These angles seed the construction of individual muon tracks.
These algorithms produce a
zenith angle, azimuthal angle, and
multiplicity assignment for each air shower.
The multiplicity reported here is the observed multiplicity within the detector.
Because air showers can be much larger than the surface area of the NOvA detector, no attempt was made to estimate the true multiplicity.
The reconstruction was optimized and validated using
air-shower simulations based on
COsmic Ray SImulations for KAscade (CORSIKA) [14]
with a range of primary cosmic ray energies in order to explore
performance on showers with a variety of multiplicities.
The reconstructed multiplicity is within of the true
multiplicity in the detector for 70% of showers and within for 95% of showers.
The most common reconstruction failure is due to muon tracks that are nearly overlapping in space in one view and are treated as a single track.
We apply a number of data selection
requirements to ensure uniform detector acceptance for air showers.
While it is possible for the NOvA detectors to operate with only a subset of
components active, we only analyze data-taking
periods when the detector was completely active
to ensure continuity of the muon tracks.
Air showers travelling nearly parallel to the
detector planes (up-down, east-west) are removed as the reconstruction
cannot produce complete tracks for these orientations.
Candidate events with very large energy
deposits per hit likely contain large hadron showers from the overburden.
These events are either not associated with air
showers or hinder our ability to reconstruct the
air shower direction or multiplicity and are
removed from the sample.
Showers with a
reconstructed multiplicity less than 15 are removed to
avoid trigger inefficiencies at
low multiplicities and to ensure a uniform
efficiency over the analysis sample.
From a CORSIKA simulation, the typical primary energy to make 15 muons in the detector is .
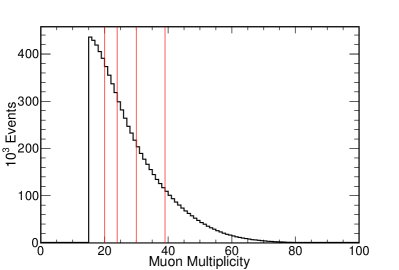
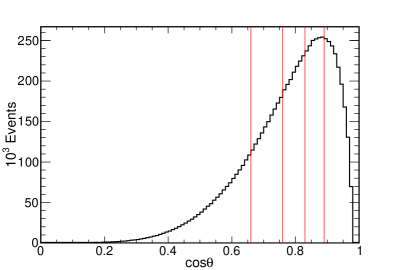
The reconstructed multiplicity and zenith angle of all selected
showers can be seen in Fig. 2.
Figure 2: Reconstructed quantities for all showers used in the analysis.
Top: The muon multiplicity of air showers recorded in the NOvA detector.
Only multiplicities of 15 or more are considered.
Bottom: The cosine of the zenith angles of air showers.
Showers with vertical zenith angle or horizontal showers from the east/west are removed from the analysis due to reconstruction challenges which suppresses the showers at high .
In both panels, the vertical lines denote the bin boundaries used in section V.
The livetime used to compute the shower rates
is recorded by data acquisition
processes, which monitor the trigger data streams.
Fig. 3 shows the rate of
cosmic ray air showers for the full analysis period.
The rates reach their maximum values during the winter months.
In total, multiple-muon
showers with an average multiplicity of 28 are analyzed.
The showers have an average rate of .
The measured rate of multiple-muon showers will be compared to atmospheric conditions.
We use atmospheric data provided by the European Centre for
Medium-Range Weather Forecasts (ECMWF) [15].
These global data are provided four times per day with a
resolution of in latitude and longitude.
In this analysis, we average the temperature at the four points nearest to the
detector location that are closest in time to the air shower.
The effective temperature of the atmosphere above the detector
is a weighted average of the temperature recorded at pressure levels
ranging from
over the depth of the atmosphere with higher weight given to altitudes with muon production [5].
This model is only valid for muons from leading pions and kaons produced in the primary interaction and is applicable for single-muon events.
However, this computation approximates what the effective temperature would be for multiple-muon events.
The average effective temperature for this analysis
is .
The surface pressure data is also reported with an
average value of .
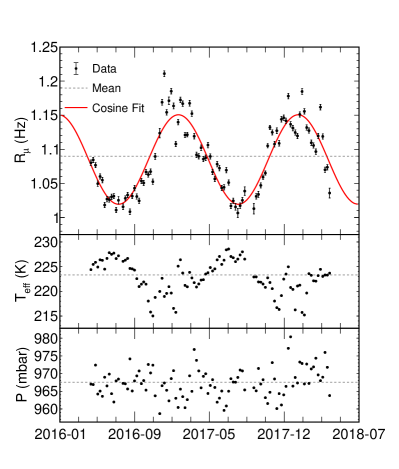
Fig. 3 shows the variations in these quantities
over the analysis period.
Figure 3: Data recorded at the detector site over time.
Each point represents the average over a week of data.
Top: The rate of multiple-muon air showers with an average rate of .
The red curve shows a sinusoidal fit to the data.
Middle: The effective temperature with an average of .
The errors are too small to display.
Bottom: The surface pressure with an average value of .
The errors are too small to display.
No clear seasonal trend is observed in the pressure.
IV Seasonal Effects
Fig. 3 shows a clear seasonal variation in the
rate of multiple-muon air showers with peak rates in both winters.
We employ two methods to quantify the significance of these peaks.
The first method correlates the atmospheric
temperature and the muon rates.
We compute a temperature correlation coefficient, [5]:
(1)
where is the difference from the mean rate of multiple-muon showers and similarly for the effective temperature, .
This effective temperature model
has been shown to be closely correlated
with the rate of single-muon showers.
The value of is dependent
on the threshold energy of
detected muons and thus on the depth of the detector.
Surface detectors are expected to exhibit no
temperature dependence with for
single-muon showers.
However, the model does not
accurately explain the development of
multiple-muon showers [10]
where many competing effects
contribute to the observed rate.
Despite this limitation, the magnitude of
still demonstrates a correlation
between temperature and observed multiple-muon rate.
Applying a linear fit to the multiple-muon rates as a function of the
effective temperatures from Fig. 3, results in a temperature correlation coefficient
of .
The atmospheric pressure at the surface can affect the survival probability of low-energy muons as
they approach the detector and alter the observed rate [16].
The barometric coefficient, , is measured by:
(2)
where is difference in
pressure from the mean.
The barometric coefficient has been
shown to accurately relate rates of
single-muon showers to the pressure [2].
A fit between the multiple-muon rates and the surface pressures from
Fig. 3, yields a barometric correlation coefficient of .
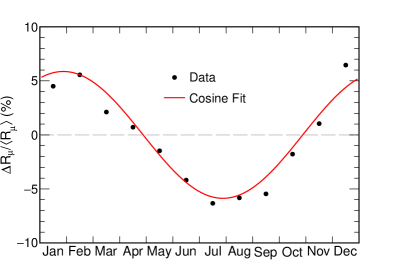
Figure 4: The percent change in the multiple-muon rate.
The two years of data is averaged to give the rate as a function of month of year. The errors are too small to display.
The value of is
statistically different from zero and negative,
as expected for an anti-correlation
between temperature and multiple-muon shower rates.
is also negative, which is as
expected for the single-muon case for a
surface detector [2].
However, the relationship between the
pressure and shower rate is found to be non-linear, suggesting additional
corrections are needed for multiple-muon showers.
The measurement of
was repeated after correcting the
observed shower rates for the changes in
pressure, but the difference in the new value was negligible.
The second method used to quantify the significance of the
seasonal effect is the amplitude of a cosine fit to the data.
The temperature of the atmosphere is not
expected to strictly track a cosine and, thus, neither does
the observed rate of events.
However, the modulations are expected to be periodic,
with a period close to, but not exactly, one year, with higher
temperatures in the summer and colder in the winter.
The amplitude of the fit demonstrates the
strength of the effect independently from the used model.
Fig. 4 shows the average percent change in the multiple-muon rate as a function of month of the year, which is found to be more sinusoidal than the more finely binned version.
The function used for the fit in Fig. 4 is
(3)
where is the function average, is the relative change,
is the period of modulation fixed at one year, and the
phase is the time of maximum.
The best fit values are
%,
%, and
months.
The phase implies a peak rate around January 27.
The value of gives a qualitative
measurement for how much the multiple-muon
showers rate varies throughout any given year.
The models used to measure the above
quantities provide imperfect descriptions of the relationship between atmospheric conditions and the rate of
multiple-muon air showers.
However, we can still consider how systematically
changing the detector observables affects the measured
quantities to determine if a systematic effect
could give rise to the observed variations.
Here, we discuss the largest such effects.
The temperature and pressure measurements
made by the ECMWF have an associated systematic
uncertainty of and ,
respectively [3].
These uncertainties are the largest known systematic uncertainties in the measurement and are
already included in the measurement of
and in the fits above.
The detector data acquisition system writes data files in periods of up to ,
depending on the data triggers operating at the time.
The detector events are written to the files in the order the trigger issues verdicts, so the data may appear out of order, and the files are closed when they reach a fixed file size [13].
Occasionally, data at the end of one file and the start of the next will be misordered.
The livetime in such cases may be overestimated by as much as .
Systematically increasing all livetimes by has less than 0.5% effect on the
values of and and 1.5% on the value of .
The detector is a rectangular prism with length about
four times its width and height.
Showers directed at the two smaller faces of the
detector will have a smaller visible cross section of
detector and will, thus, have lower multiplicities.
To account for this geometric effect, such showers
have both their multiplicities and rate systematically increased by a factor of four.
The values of and decrease by less than 0.2% and the value of beta increases by only 1%.
Since the effect is small, this is not used to correct angular effects in the data.
The detector electronics are sensitive to the
temperature and humidity of the atmosphere.
As a result, the electronics are noisier when the
operating temperature is warmer, and up to 5% more noise hits are observed in the
summer months.
However, noise hits have much lower ADC counts than those made by the signal muon tracks and were not found to have any impact
on the reconstruction of multiple-muon events.
None of the considered effects are large
enough to have artificially created the observed
winter maximum in the multiple-muon rate.
Additionally in the following section, these
effects cancel when considering the relative
measurements between the bins of multiplicity
and the bins of zenith angle.
V Multiple-Muon Observables
The two methods in the previous section
demonstrate a clear seasonal variation with a peak during the winter.
As in the Near Detector analysis [9], we
observe that the strength of this effect changes under
different shower observables that act as a
proxy for the primary cosmic ray energy.
Here we examine the changes in the strength of the seasonal
effect with the multiplicity and
zenith angle of the shower.
The multiple-muon showers are divided into
five sets depending on their multiplicities
and zenith angles, respectively.
These divisions, shown in Fig. 2,
contain nearly equal numbers of showers.
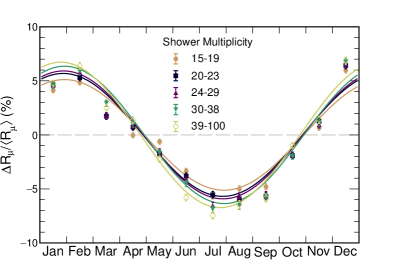
Fig. 5 shows the multiple-muon data and sinusoidal fit for each multiplicity bin as a function of month of year.
The sinusoidal fit amplitude, temperature coefficient,
and barometric coefficient are measured
within each multiplicity bin and reported in Table 1.
Both the cosine fit amplitude and temperature coefficient demonstrate a stronger
seasonal dependence at higher multiplicities.
Figure 5: Percent variation in the multiple-muon data and a cosine fit for each of the five multiplicity bins.
In each fit, the period is fixed at one year; all other parameters are unchanged.
Table 1: The measured value of , , and for each of the 5 bins of measured muon multiplicity. The mean zenith angle for a given multiplicity is also shown.
Mult.
Mean
V (%)
(%/mbar)
15–19
0.73
20–23
0.76
24–29
0.78
30–38
0.79
39–100
0.82
15–100
0.78
We perform a similar analysis for each zenith angle bin.
The results are reported in Table 2.
The bins of zenith angle nearest the
horizon exhibit the strongest seasonal effect.
The table also shows the average
multiplicity of showers within each bin.
The showers coming from nearest the
horizon also have the lowest average multiplicities,
which would be
expected to exhibit the weakest seasonal
variation from Table 1.
We observe that the most vertical showers
with the highest multiplicities exhibit
the weakest seasonal change;
this is opposite what one would expect
based solely on the multiplicities.
Table 2: The measured value of , , and for each of the 5 bins of zenith angle. The bins are sorted from vertical to horizontal.
The mean measured multiplicity of all showers in each bin is also shown.
Mean Mult.
V (%)
(%/mbar)
0.89–0.99
32.3
0.83–0.89
29.0
0.76–0.83
27.6
0.66–0.76
26.4
0.00–0.66
25.0
0.00–0.99
27.7
VI Summary
We observed that the rate of multiple-muon cosmic ray air showers in a detector near the surface presents a seasonal variation with a peak rate in the winter.
Additionally, we showed that this effect is dependent on the primary cosmic ray energy by looking at two detector observables, the multiplicity and zenith angle.
A stronger seasonal effect is seen for air showers with higher multiplicities or zenith angles near the horizon.
The amplitude of the seasonal modulation grows by 30% from the lowest multiplicities to the highest multiplicities and by 20% from the most vertical to the most horizontal showers considered.
For surface detectors where the threshold energy for detection is low,
the production altitude of muons in cosmic ray air showers is of the same
magnitude as the muon decay length.
For example, a typical muon reaching the surface begins with of energy at production and will traverse on average before decaying.
Muon production occurs around , with higher altitudes in the summer months when the atmosphere is expanded.
Thus, the longer muon path length in summer months would give the produced muons a higher chance to decay before reaching the surface and reduce the number of observed muons.
The effects of particle decay on the seasonal rate of muons could be confirmed using Monte Carlo simulation such as CORSIKA [14].
However, this effect is negligible in underground detectors where the muon energies are at least ten times larger and cannot explain all observations of seasonal variations for multiple-muon showers.
An interesting continuation of this study will be the inclusion of low multiplicity air showers from another detector trigger.
The two datasets could be combined to see if there is a threshold where the seasonal behavior for multiple-muons inverts as in underground detectors or flattens as expected for single-muons.
Additionally, comparisons to Monte Carlo simulation could be used to trace detector observables back to the primary cosmic ray energy.
This document was prepared by the NOvA collaboration using the resources of the Fermi National Accelerator Laboratory (Fermilab), a U.S. Department of Energy, Office of Science, HEP User Facility. Fermilab is
managed by Fermi Research Alliance, LLC (FRA), acting under Contract No. DE-AC02-07CH11359. This work
was supported by the U.S. Department of Energy; the
U.S. National Science Foundation; the Department of
Science and Technology, India; the European Research
Council; the MSMT CR, GA UK, Czech Republic; the
RAS, RFBR, RMES, RSF, and BASIS Foundation, Russia; CNPq and FAPEG, Brazil; STFC, UKRI, and the Royal Society, United Kingdom; and the state and University of
Minnesota. We are grateful for the contributions of the
staffs of the University of Minnesota at the Ash River
Laboratory and of Fermilab.
Tognini [2018]S. C. Tognini, Observation of multiple-muon seasonal
variations in the NOvA Near Detector, Ph.D. thesis, Federal University of Goias (2018).