Exploring Exciton and Polaron Dominated Photo-physical Phenomena in Ruddlesden-Popper Phases of BaZrS (n=[1-3]) from Many Body Perturbation Theory
Abstract
Ruddlesden-Popper (RP) phases of BaZrS (n=[1-3]) are evolved as new promising class of chalcogenide perovskites in the field of optoelectronics, especially in solar cells. However, detailed studies regarding its optical, excitonic, polaronic and transport properties are hitherto unknown. Here, we have explored the excitonic and polaronic effect in RP phases of BaZrS (n=[1-3]) using several first-principles based state-of-the-art methodologies under the framework of Many Body Perturbation Theory. Unlike it’s bulk counterpart, the optical and excitonic anisotropy are observed in BaZrS (n=[1-3]) RP phases. From Wannier-Mott approach, we show that in the RP phases of this class of chalcogenide perovskites, capturing the ionic contribution to the dielectric constant is important. We report significant ionic contribution and relatively smaller electron-phonon coupling constant for BaZrS in comparison to the bulk BaZrS3. The exciton binding energy is found to be dependent on the presence of large electron-phonon coupling. The charge carrier mobility is maximum in Ba2ZrS4, computed employing deformation potential of the same. As per our analysis, the optical phonon modes are observed to dominate the acoustic phonon modes, leading to decrease in polaron mobility on increasing n in BaZrS (n=[1-3]).
{tocentry}
![[Uncaptioned image]](/html/2105.03757/assets/TOC-2.jpg)
keywords:
Ruddlesden-Popper phases, hybrid, DFT, GW-BSE, exciton binding energy, polaron+91-11-2659 1359 Indian Institute of Technology Delhi] Department of Physics, Indian Institute of Technology Delhi, New Delhi, India
Perovskites with general chemical formula ABX3 have found great attention in dielectric, optoelectronics, and solar cell applications due to their superb ferroelectric, piezoelectric, superconductive and photovoltaic properties 1, 2, 3. During the last decade, in the field of solar cell applications, hybrid lead-halide perovskites namely, CH3NH3PbX3 and CH(NH2)2PbX3 (X = Cl, Br and I) have achieved great success owing to their small band gap, long carrier mobility, low manufacturing cost and high power conversion efficiency 4, 5, 6, 7, 8, 9, 10. However, due to the presence of organic molecules, the stability of perovskites is affected towards heat, light and moisture, thereby degrading their efficiency with time in the practical world 11. Moreover, presence of toxic lead in these materials makes them hazardous for the environment 12. These shortcomings have hindered their practical applications.
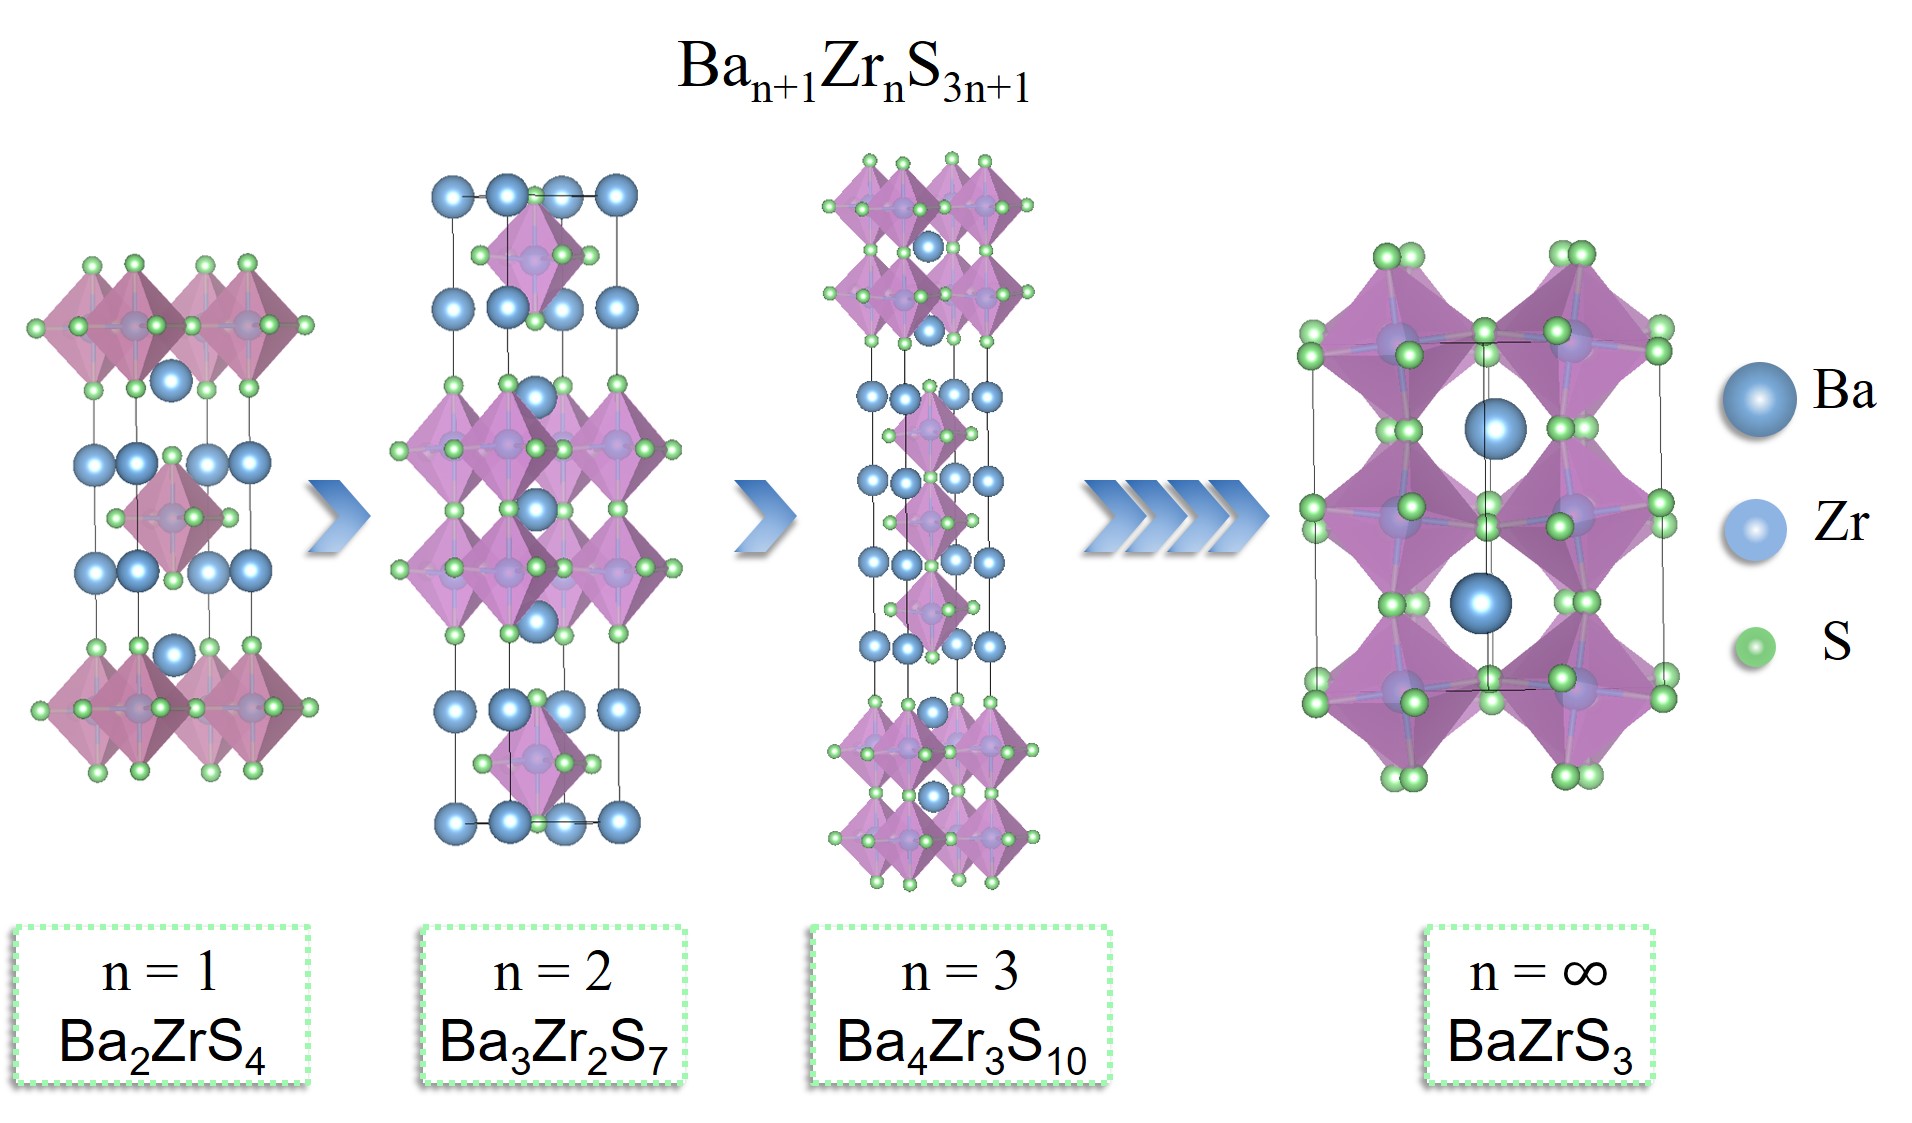
In search of alternative perovskites that can alleviate the limitations of lead-halide perovskites, chalcogenide perovskites with S or Se-anion have been proposed for photovoltaic applications 13. Several prototypical chalcogenide perovskites (viz. SrHfS3 14, AZrS3 (A = Sr, Ca, Ba) 15, 16, 17, along with their related phases) have been synthesized successfully. Amongst them, BaZrS3 consists of earth-abundant elements and is having moderate band gap (1.82 eV 18) ideal for photovoltaics. Moreover, it also exhibits ambipolar doping 19 and is stable against different environmental conditions 20. In order to optimize the solar cell absorption, doping at Ba/Zr-sites have been attempted in this material 21, 17, 22. However, such doped/alloyed configurations seem to lack stability 23. Thin films of BaZrS3 are also reported, which has directed the research towards its new phases named as Ruddlesden-Popper (RP) phases 24. Tremendous efforts have been invested to tune the electrical and optical properties 18. The RP phases as an imitative of the perovskite structure are evolving as a semiconductor for optoelectronic applications 25, 26. Their general formula is ABX, where perovskite structure blocks of unit cell thickness “n” are separated by rock salt layer AX along [001] direction. Alternate perovskite blocks are displaced in in-plane direction by half of the unit cell. The RP phases are included in the broad category of “2D perovskites” owing to their layered structural arrangement (see Fig. 5).
Note that several studies assigning to the layered perovskites as “2D perovskites” exist in the literature, where periodic stacking of perovskite layers result in a bulk structure. Their material properties can be tuned either by substitution or dimensional reduction 27, 28, 29. Due to quantum confinement effects 30, considerable change in bulk physical properties (such as bulk modulus, elastic modulus, charge carrier properties and optical properties) can be seen on reducing the dimension of material 31, 32. Research in this field is highly evolving 26, 33, 34, 35.
In optoelectronic materials exciton formation greatly influence the charge separation properties and hence, excitonic parameter such as exciton binding energy (E) acts as an important descriptor for optoelectronic applications. Solar cell performance depends upon the fraction of thermally dissociated excitons into electrons and holes, giving rise to the free-charge carriers. In addition, the concept of polarons has been used to explain multiple photo-physical phenomena in these materials 36. Polaronic effects have been suggested to play an important role in the excitation dynamics and carrier transport. The separation of free charge is also influenced by the carrier mobility. Hence understanding the effect of electron-phonon coupling in terms of polaron mobility is important. A systematic study on the excitonic and polaronic effect in the RP phases of BaZrS3 is hitherto unknown. The present Letter, therefore, explores the excitonic properties along with polaronic effect in RP phases of BaZrS (n=[1-3]) under the framework of Many Body Perturbation Theory. The electron-phonon coupling is also taken care of using Frohlich model to compute the polaron mobility.
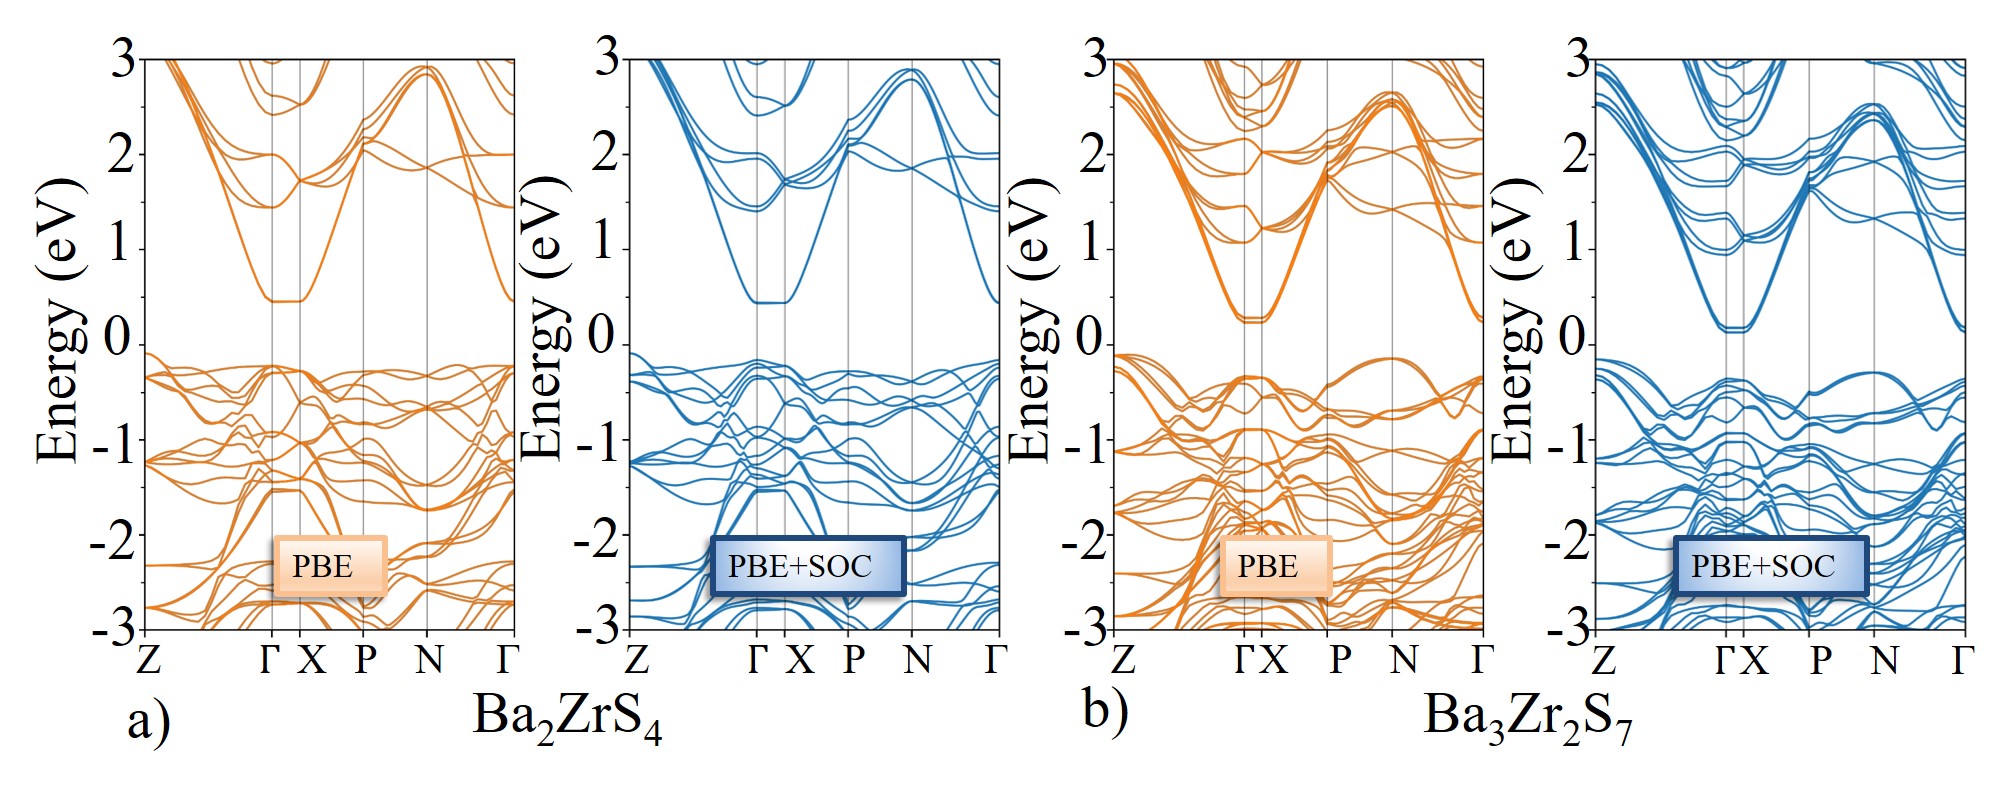
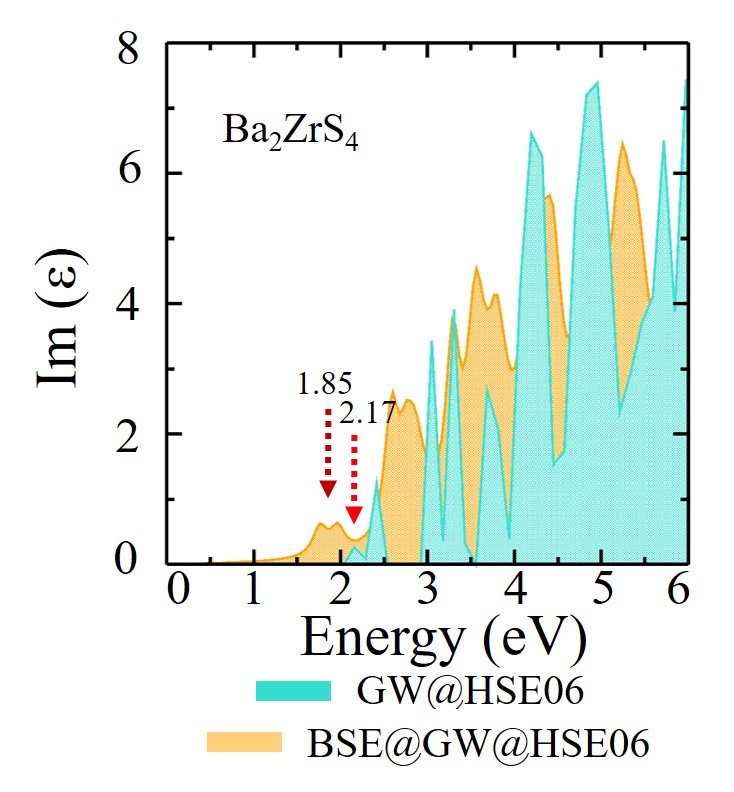
The exciton binding energy is defined as the energy required to decouple the exciton into individual electron and hole pair. Theoretically, the exciton binding energy (E) is calculated by taking the difference of the energy of bounded electron-hole (e-h) pair (i.e., BSE gap) and unbounded e-h pair (i.e., GW gap). In order to determine the optical response of BaZrS (n=[1-3]) RP phases, we have calculated the imaginary part of dielectric function (Im ()). Initially, we have benchmarked the exchange-correlation () functional for our system. As it is already known that single shot GW (G0W0) calculation strongly depends on the starting point, we need to validate the suitable starting point for G0W0 calculation. Note that spin-orbit coupling (SOC) effect is negligible in these systems (see Fig. S3). Hence, we have excluded SOC in our calculations (see Fig. S5 in SI). The band gap of Ba2ZrS4, Ba3Zr2S7 and Ba4Zr3S10 are quite underestimated using PBE and the values are 0.61 eV, 0.42 eV and 0.34 eV, respectively. On the other hand, the same with default parameters (viz. exact exchange = 25 and screening parameter 0.2 Å-1) of HSE06 are 1.39 eV, 1.18 eV and 1.08 eV, respectively. The HSE06 numbers are in good agreement with the experimental findings 18. Further, the peak position, which is underestimated by PBE is improved by G0W0@PBE. Notably, the quasiparticle gaps computed using G0W0@PBE are overestimated in comparison to experimental band gap, since it does not take into account the exciton binding energy. However, the gaps are improved by employing BSE on top of G0W0@PBE. We find, the optical peak position of Ba2ZrS4, by performing G0W0@PBE and G0W0@HSE06 is 2.11 eV (see Fig. 6(a)) and 2.17 eV (see Fig. S4 in SI), respectively. Since, the results obtained from the consideration of HSE06 as the starting point of G0W0 deviate more from the experimental results, we have performed all the calculations using G0W0@PBE. Although G0W0@PBE gives better result than G0W0@HSE06, it is still far from the experimental optical band gap i.e., 1.33 eV.
However, it gets improved when we solve the BSE to obtain optical band gap due to the fact that BSE takes into account the excitonic effect. The latter is ignored in G0W0 calculation to obtain accurate optical spectra. Therefore, we have performed BSE@G0W0@PBE to incorporate e-h interactions. Similarly, we have performed G0W0@PBE and BSE@G0W0@PBE calculations to capture the optical and excitonic effect for Ba3Zr2S7 and Ba4Zr3S10, respectively. We find the BSE peak position for Ba2ZrS4, Ba3Zr2S7 and Ba4Zr3S10 are 1.71 eV, 1.49 eV and 1.43 eV, respectively, whereas G0W0@PBE finds the peak at 2.11 eV, 1.82 eV and 1.69 eV, respectively (see Fig. 6(a-c)).
It should be noted here that these numbers are highly dependent on the k-mesh and it’s very challenging (even with the fastest supercomputers) to converge the BSE calculation to obtain the excitonic peak for computing E with absolute accuracy. In Fig. 6, occurrence of red-shifted peak in BSE@G0W0@PBE than G0W0@PBE signifies the excitonic effect in the considered RP phases. The computed E of first bright exciton of Ba2ZrS4, Ba3Zr2S7 and Ba4Zr3S10 RP phases are found to be 0.40 eV, 0.33 eV and 0.26 eV, respectively. The obtained E values are somewhat on the larger side. In solar cell, for easy dissociation of exciton into free charge carriers (viz. e and h) at room temperature, a low E is desirable (T = 26 meV, T = 300 K). Thus the discrepancy in the BSE peak position from the experimental value 18 may lead to incorrect E values. Unfortunately, we have already ensured the highest possible k-mesh to compute the BSE@G0W0@PBE calculations. Involving a denser k-mesh is not feasible for the superstructures of RP phases for computing G0W0@PBE and BSE@G0W0@PBE – solely due to computational limitation. Therefore, this limits us to estimate the accurate E for the given systems. This is why to compute E, we have employed a combined state-of-the-art method comprising of Wannier-Mott and Density Functional Perturbation Theory (DFPT) approach as explained later. However, one can estimate the error bar in BSE peak position via a parameterized model for dielectric screening i.e., model-BSE approach (mBSE). This mBSE approach is computationally cheaper as compared to BSE but with similar accuracy to estimate the first peak position (see Fig. S6 in SI). Thus this enables us to sample Brillouin zone with higher number of k-mesh. As per the mBSE calculation, it is seen that a denser k-mesh sampling indeed red-shifts the BSE peak by 0.3 eV (see mBSE calculations details as in section V in SI).
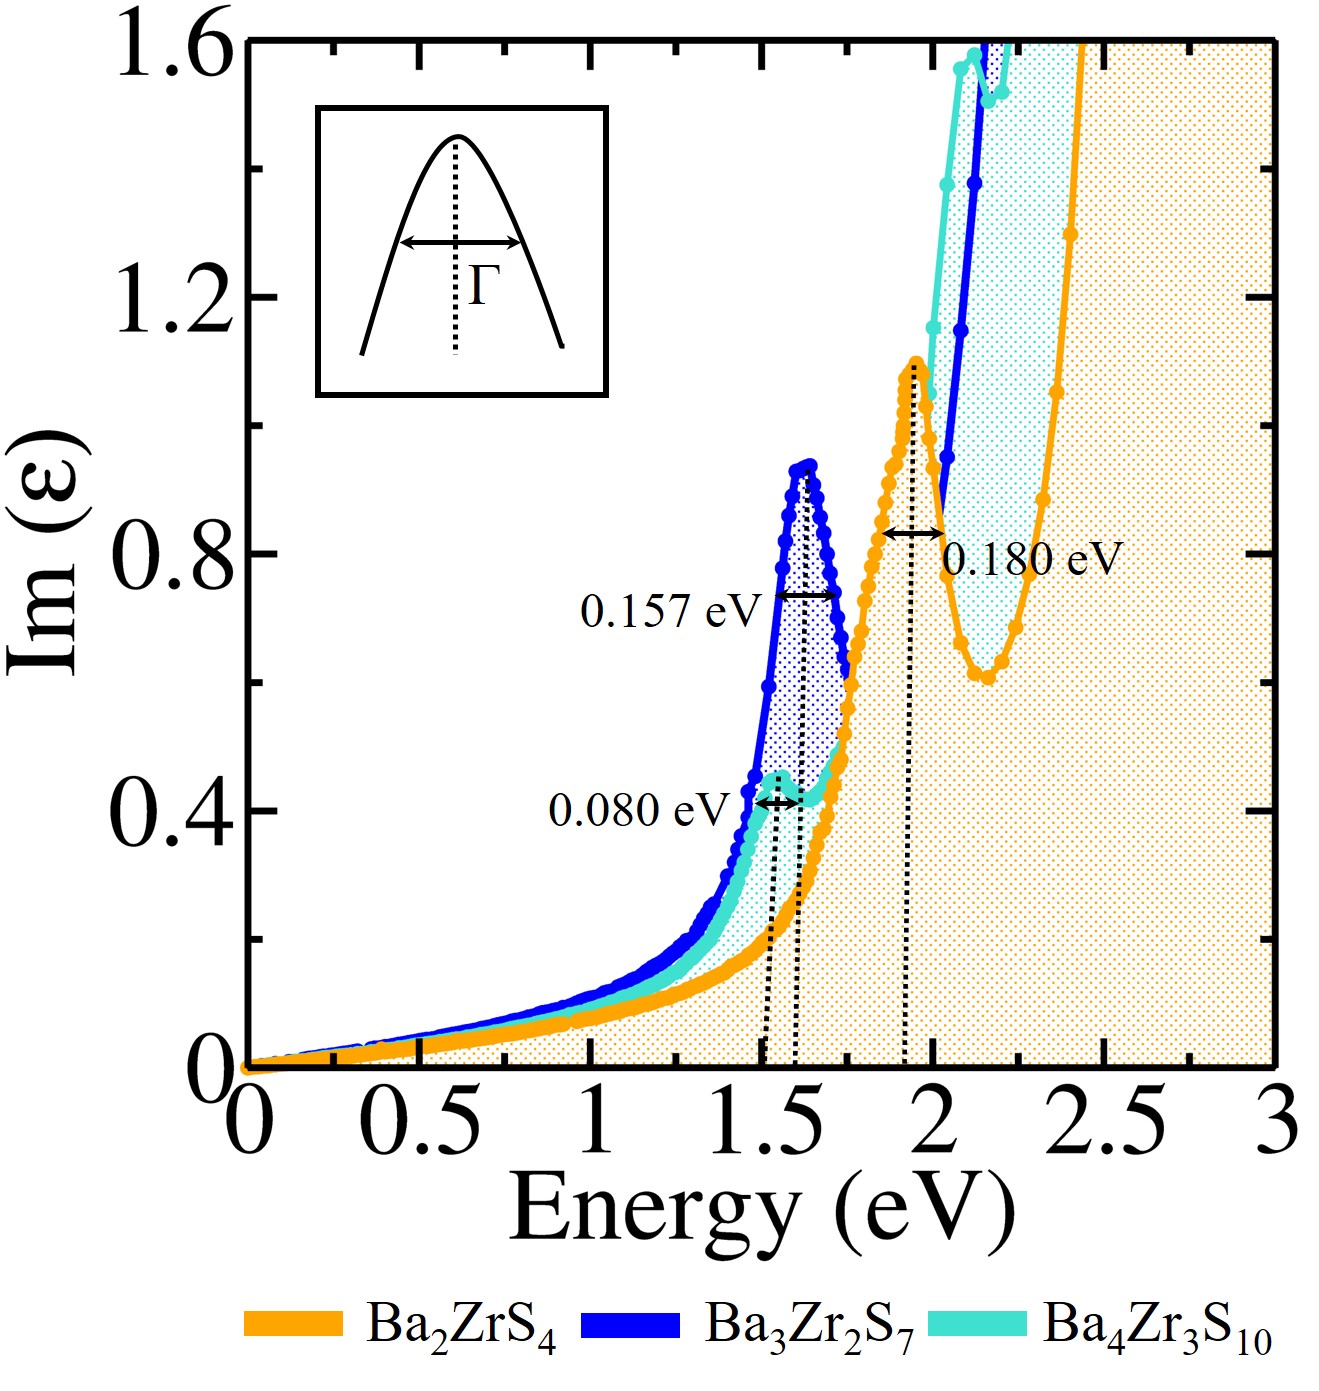
Now, from the above analysis, despite having little discrepancy with the exact BSE peak position and corresponding E values, it’s certain that the first two excitons are bright excitons in the considered RP phases and several dark excitons also exist below the second bright exciton of these systems. From the above studies, it’s also expected to have the correct trend i.e., the order of E for BaZrS is n=1 n=2 n=3. From Fig. 6(a), we have observed the double peak character for excitonic peak of Ba2ZrS4 that may occur due to two nearby transitions. Moreover, only Ba2ZrS4 exhibits direct band gap, whereas for other two higher RP phases in the series band gap becomes indirect in nature. In Fig. 8, we have shown the broadening of excitonic peak. It is well known that lifetime () of exciton is inversely proportional to the same and therefore, the qualitative trend of exciton lifetime for BaZrS (n=[1-3]) is . Note that, here broadening is computed from mBSE approach showing contribution due to the electron-hole interaction and it does not include the electron-phonon coupling effect.
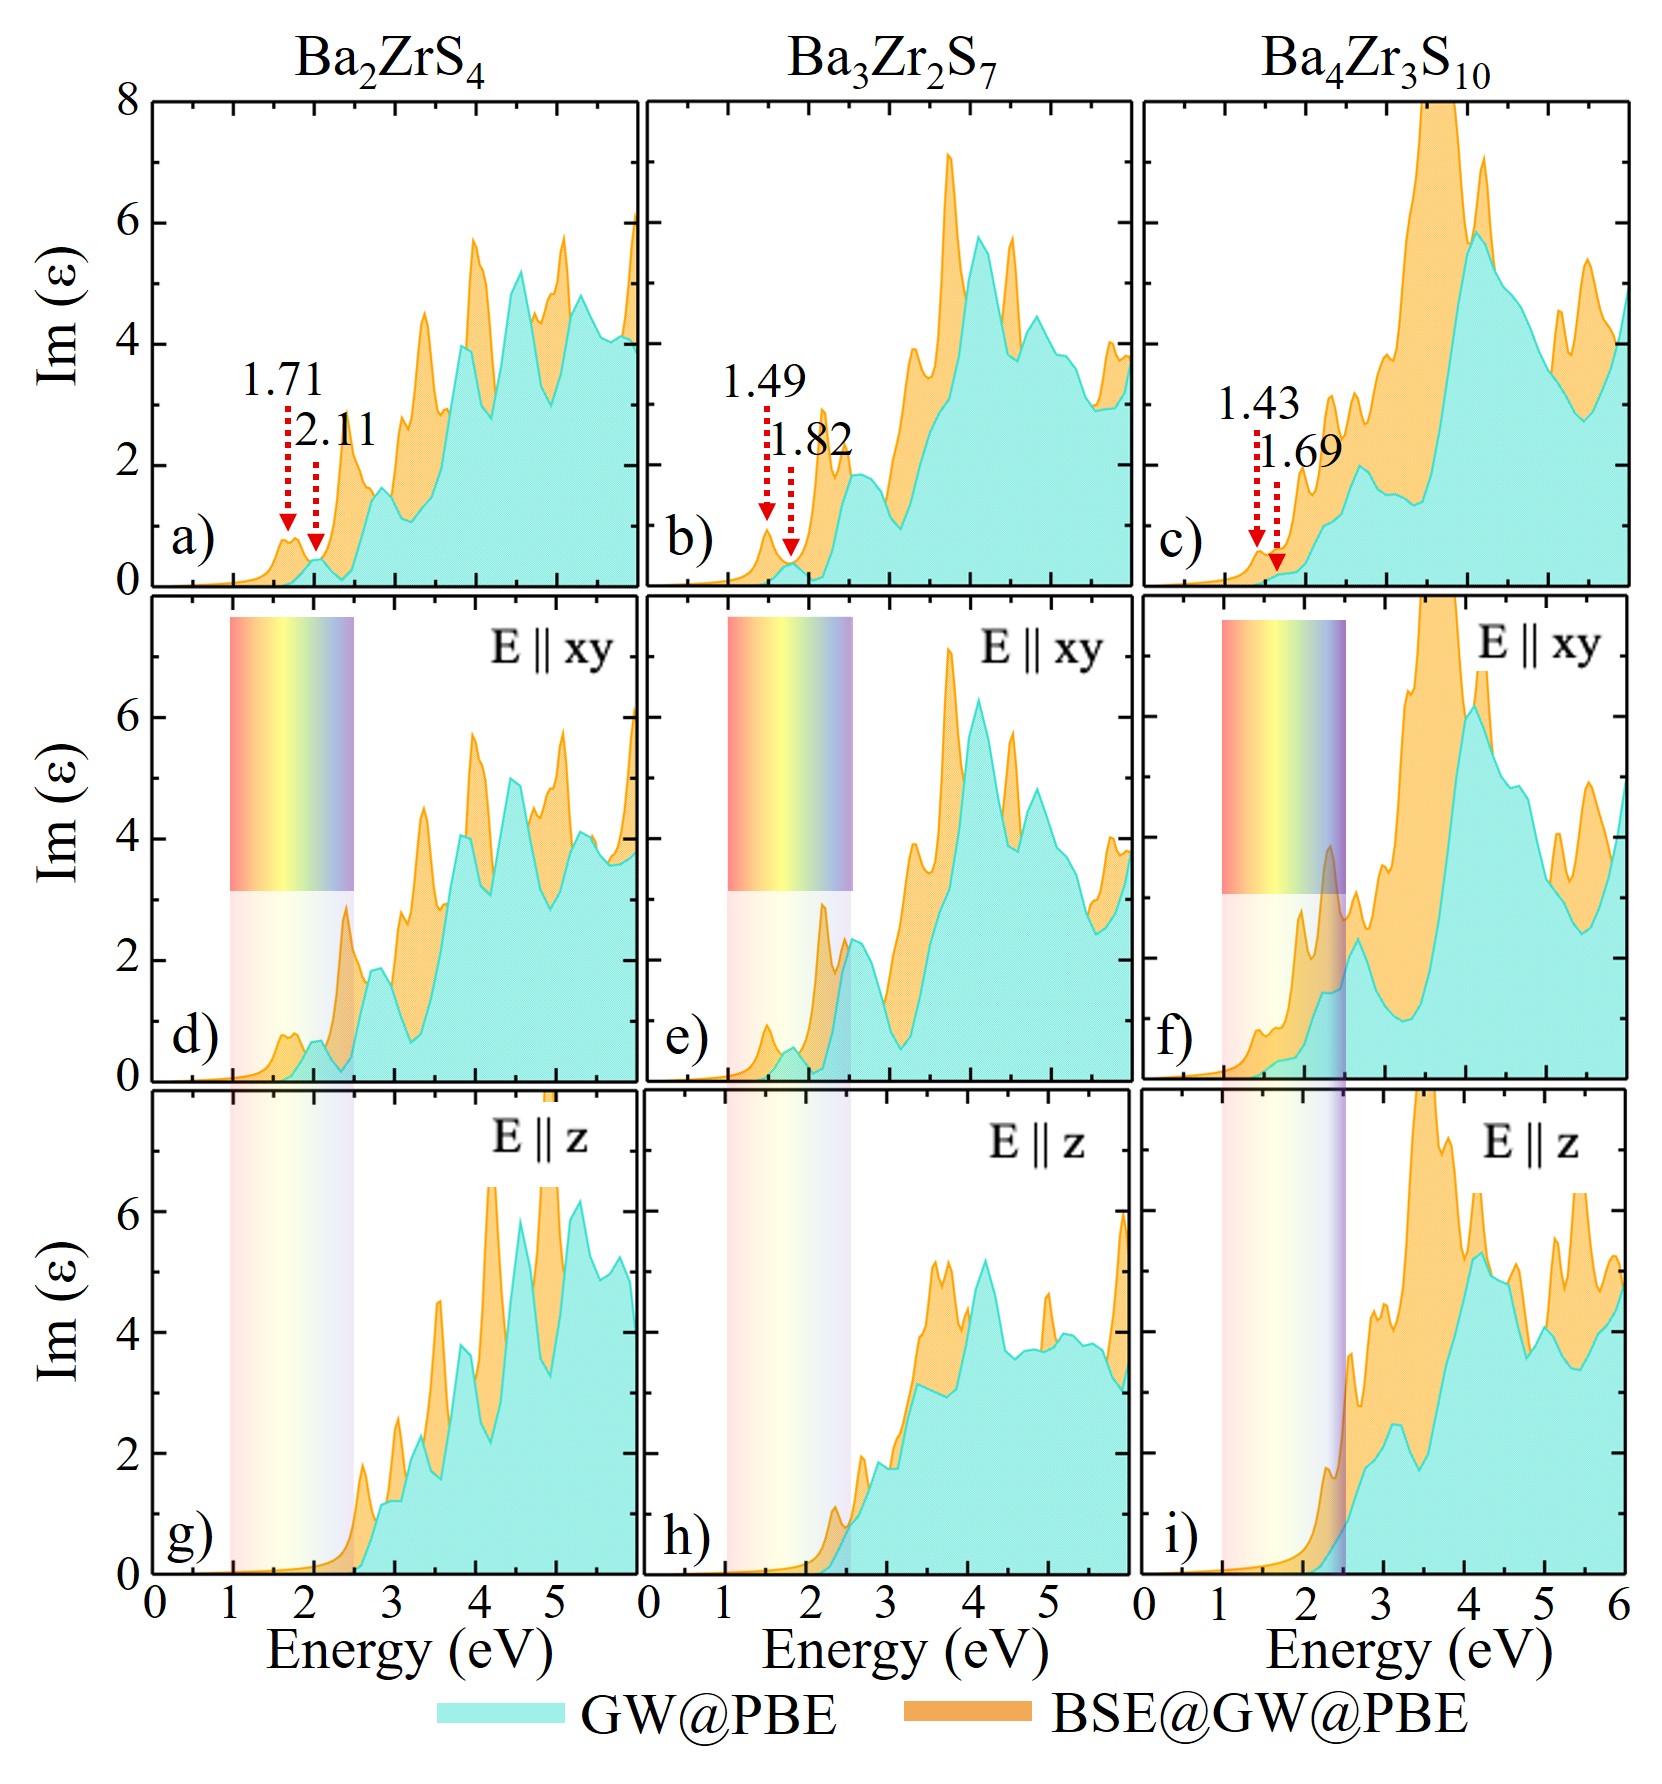
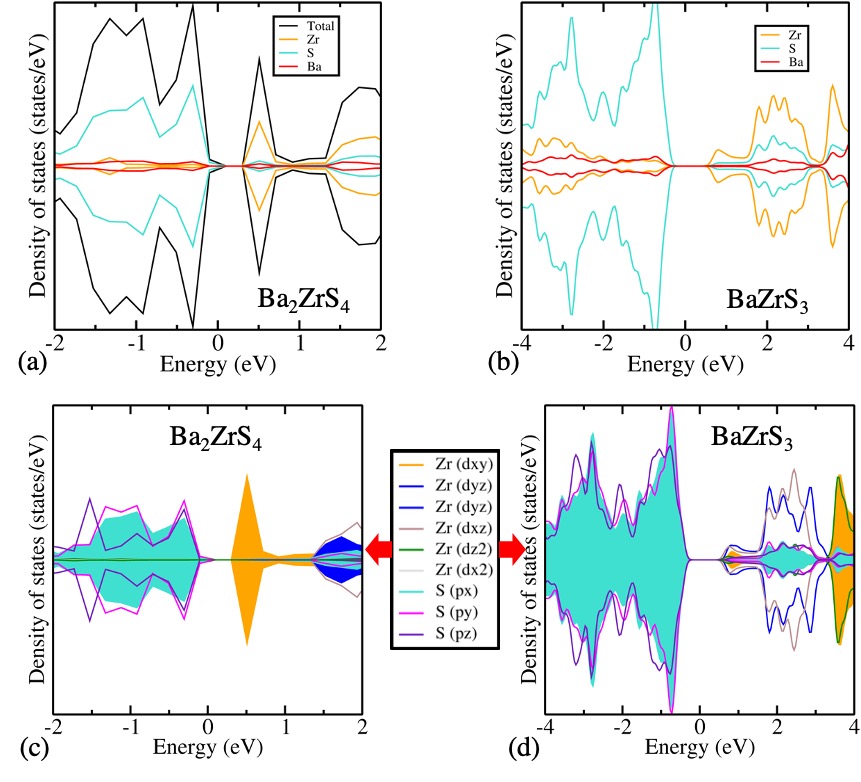
BaZrS (n=[1-3]) RP phases have tetragonal structure and exhibit optical anisotropy. Hence, it is required to study their optical and excitonic properties along Exy (i.e., in-plane along x- or y-direction) and Ez (i.e., out-of-plane along z-direction) direction. We have observed anisotropy in Ba2ZrS4, Ba3Zr2S7 and Ba4Zr3S10 which can greatly affect their performance in practical application. Therefore, it is of paramount importance to understand the anisotropic effect in the optical and excitonic properties of BaZrS (n=[1-3]) RP phases. In Fig. 6 (d-i), we have shown optical and excitonic contribution of BaZrS (n=[1-3]) RP phases along different directions viz. x, y and z. Employing Shockley-Queisser (SQ) criterion 37 for the solar cell and other optoelectronic devices, we can remark that BaZrS (n=[1-3]) RP phases are optically active in in-plane (i.e., along x- and y-direction) and optically inactive in out-of-plane (i.e., z-direction). These systems possess similar optical as well as excitonic properties along x- and y-direction (see Fig. 6(d-f)). However, along z-direction, their optical and excitonic spectra are not only blue-shifted but also the feature of G0W0 and BSE peaks are quite different than that in case of in-plane direction (see Fig. 6(g-i)). It is well known that exciton lifetime is inversely proportional to the width of the exciton peak. Hence, change in the feature of exciton peak greatly influences the excitonic parameters as well in different directions. The d-orbital contribution in valence band maximum (VBM) and conduction band minimum (CBm) could be responsible for the optical anisotropy in these systems. Here, Zr 4dxy orbital is contributing maximum in the CBm (see Fig. S7 in SI), whereas in bulk BaZrS3 the CBm is contributed by dyz and dxz. This is why in the latter, no significant anisotropy is observed 38.
We have used Wannier-Mott model 39 for a simple screened Coulomb potential. According to this model, the E for screened interacting electron-hole (e-h) pair is given by:
| (1) |
where, is the reduced mass in term of rest mass of electron, is the effective dielectric constant (which includes electronic as well as ionic contribution to dielectric constant) and R∞ is the Rydberg constant. The reduced mass of Ba2ZrS4, Ba3Z2S7 and Ba4Zr3S10 in term of electron rest mass are 0.32, 0.26 and 0.34, respectively (for more information regarding calculation of reduced mass and effective mass of electron and hole see section VII in SI). However, in the above expression, is still unknown for these systems. It is already reported that lattice relaxation can influence the exciton binding energy 40. For example, if corresponds to longitudinal optical phonon frequency and E , one needs to consider the effect of lattice relaxation to compute . However, if E , the effect of lattice relaxation can be ignored as in such cases , where is the static value of dielectric constant at high frequency that mainly consists of electronic contribution.
Therefore, for , a value intermediate between the static electronic dielectric constant at high-frequency i.e., and the static ionic dielectric constant at low frequency i.e., should be considered.
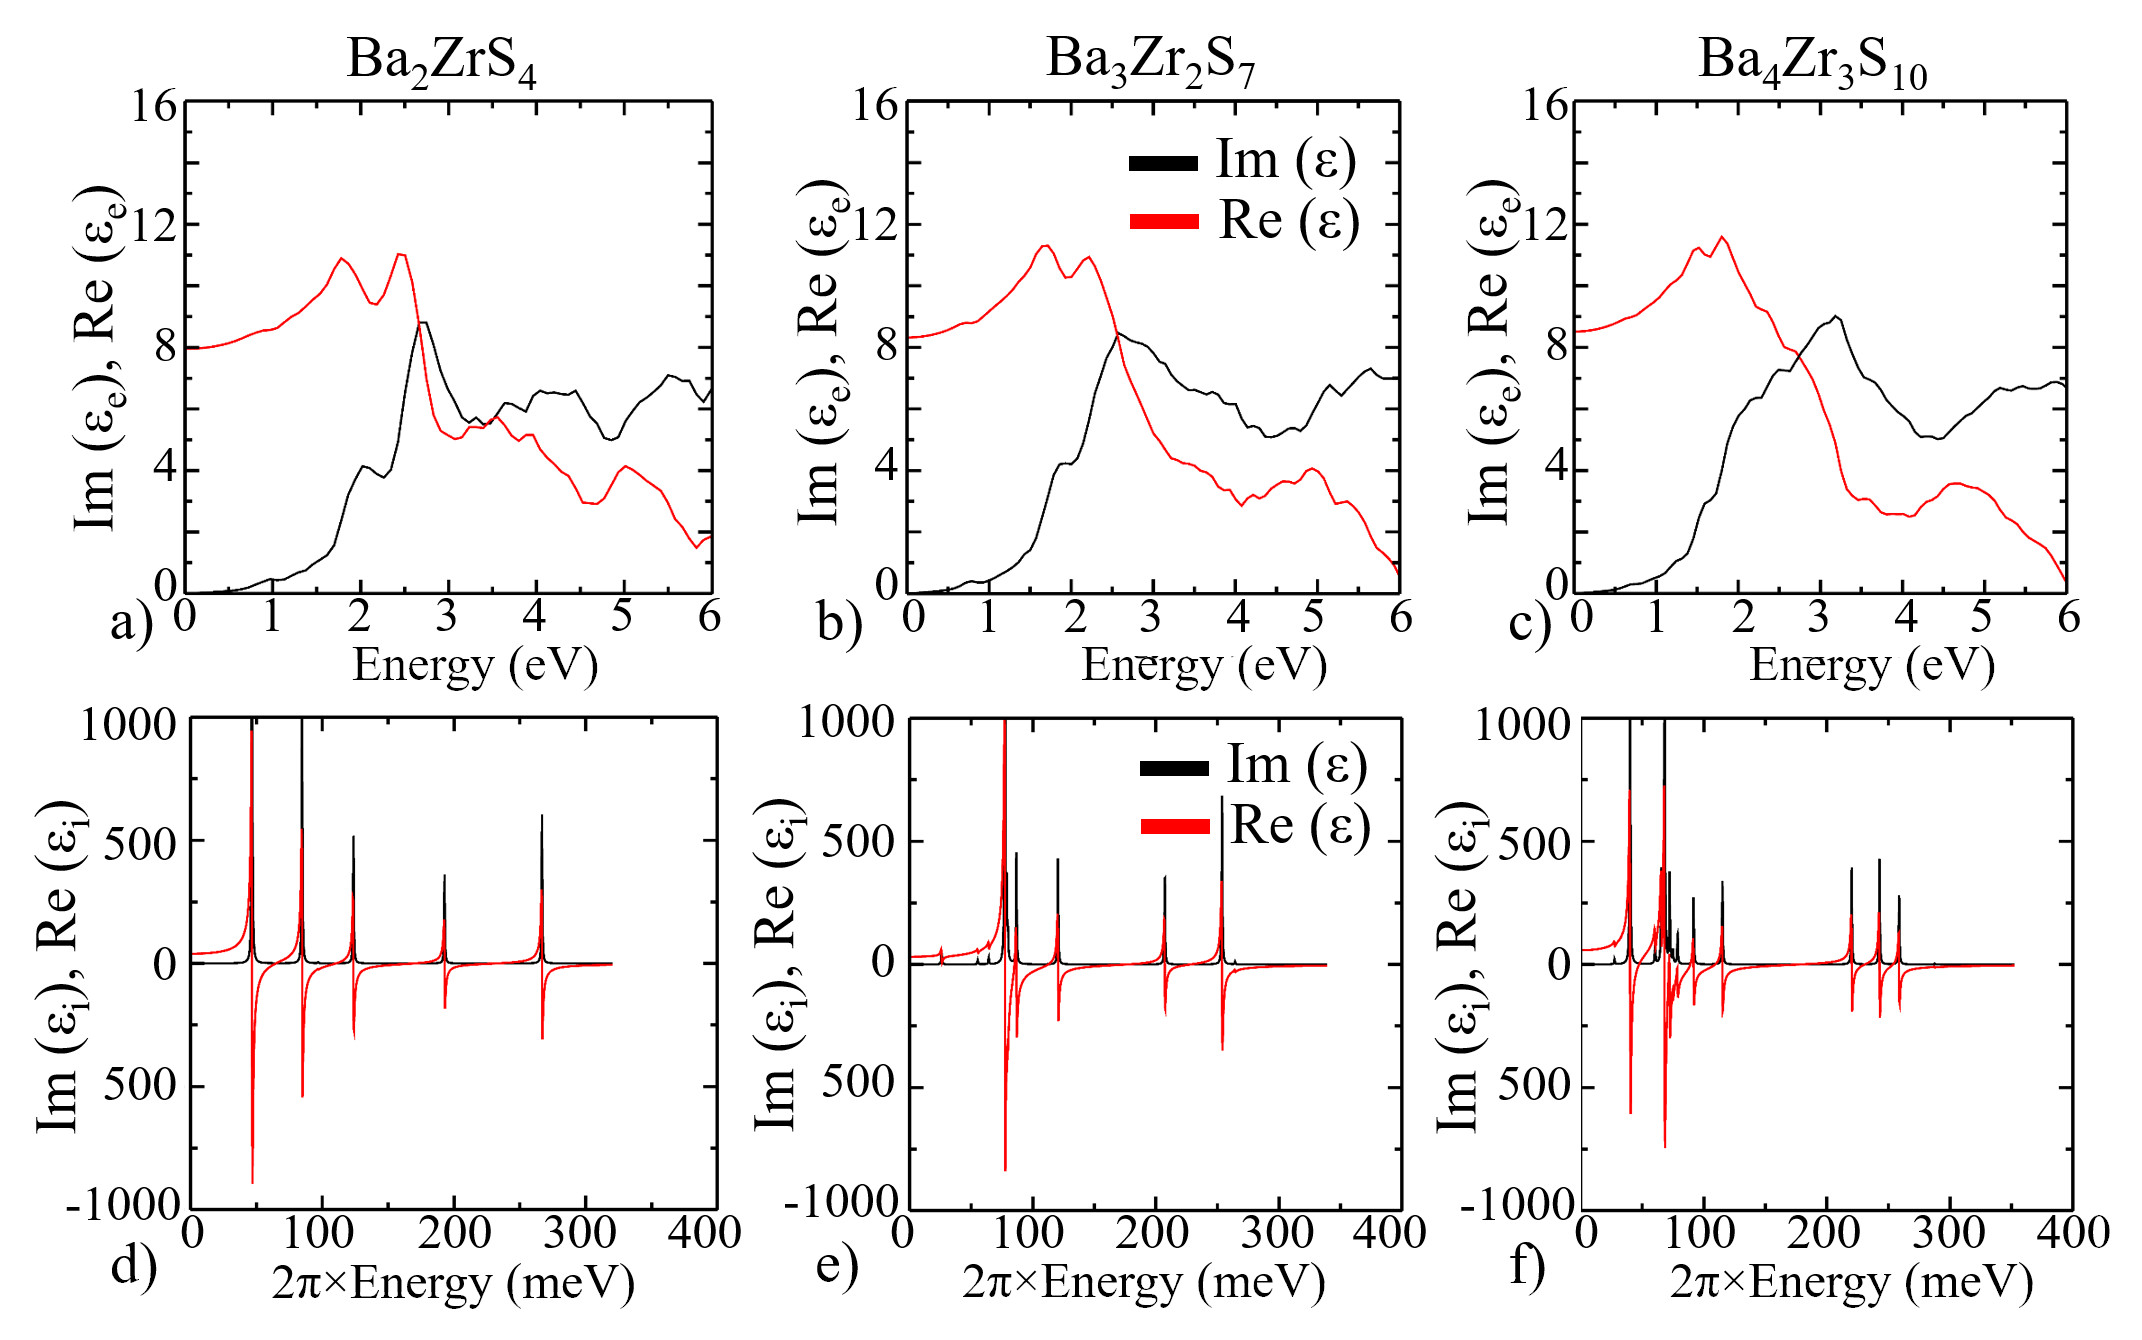
In Fig. 7(a-c) and Fig. 7(d-f), we have shown the electronic and ionic contribution to the dielectric function respectively, computed using DFPT approach. The static real part of ionic dielectric constant for Ba2ZrS4, Ba3Z2S7 and Ba4Zr3S10 are 39.35, 31.19 and 57.59, respectively. As per Fig. 7, a considerable increase in the static low frequency of ionic dielectric constant is attributed to the occurrence of optically active phonon modes below 10 meV. This shows the ionic nature of the RP phases. Using electronic and ionic contribution of the dielectric constant and equation 11, we have calculated the upper and lower bound for the E (see Table4). The effective value of the dielectric constant and hence, the binding energy lies in between these upper and lower bounds listed in Table4. We have observed that upper bound and lower bound values of E for the considered RP phases are comparable with that of APbX3 (A = MA, FA; X= I, Br) perovskites 41, 42. It should be noted that in bulk BaZrS3 ionic contribution to dielectric constant has been observed to be negligible 38, whereas in RP phases significant role of ionic contribution to dielectric has been observed.
| BaZrS | E (meV) | E (meV) | ||
|---|---|---|---|---|
| Ba2ZrS4 | 8.94 | 56.00 | 39.25 | 2.9 |
| Ba3Zr2S7 | 8.32 | 50.14 | 31.19 | 3.49 |
| Ba4Zr3S10 | 8.51 | 63.45 | 57.59 | 1.39 |
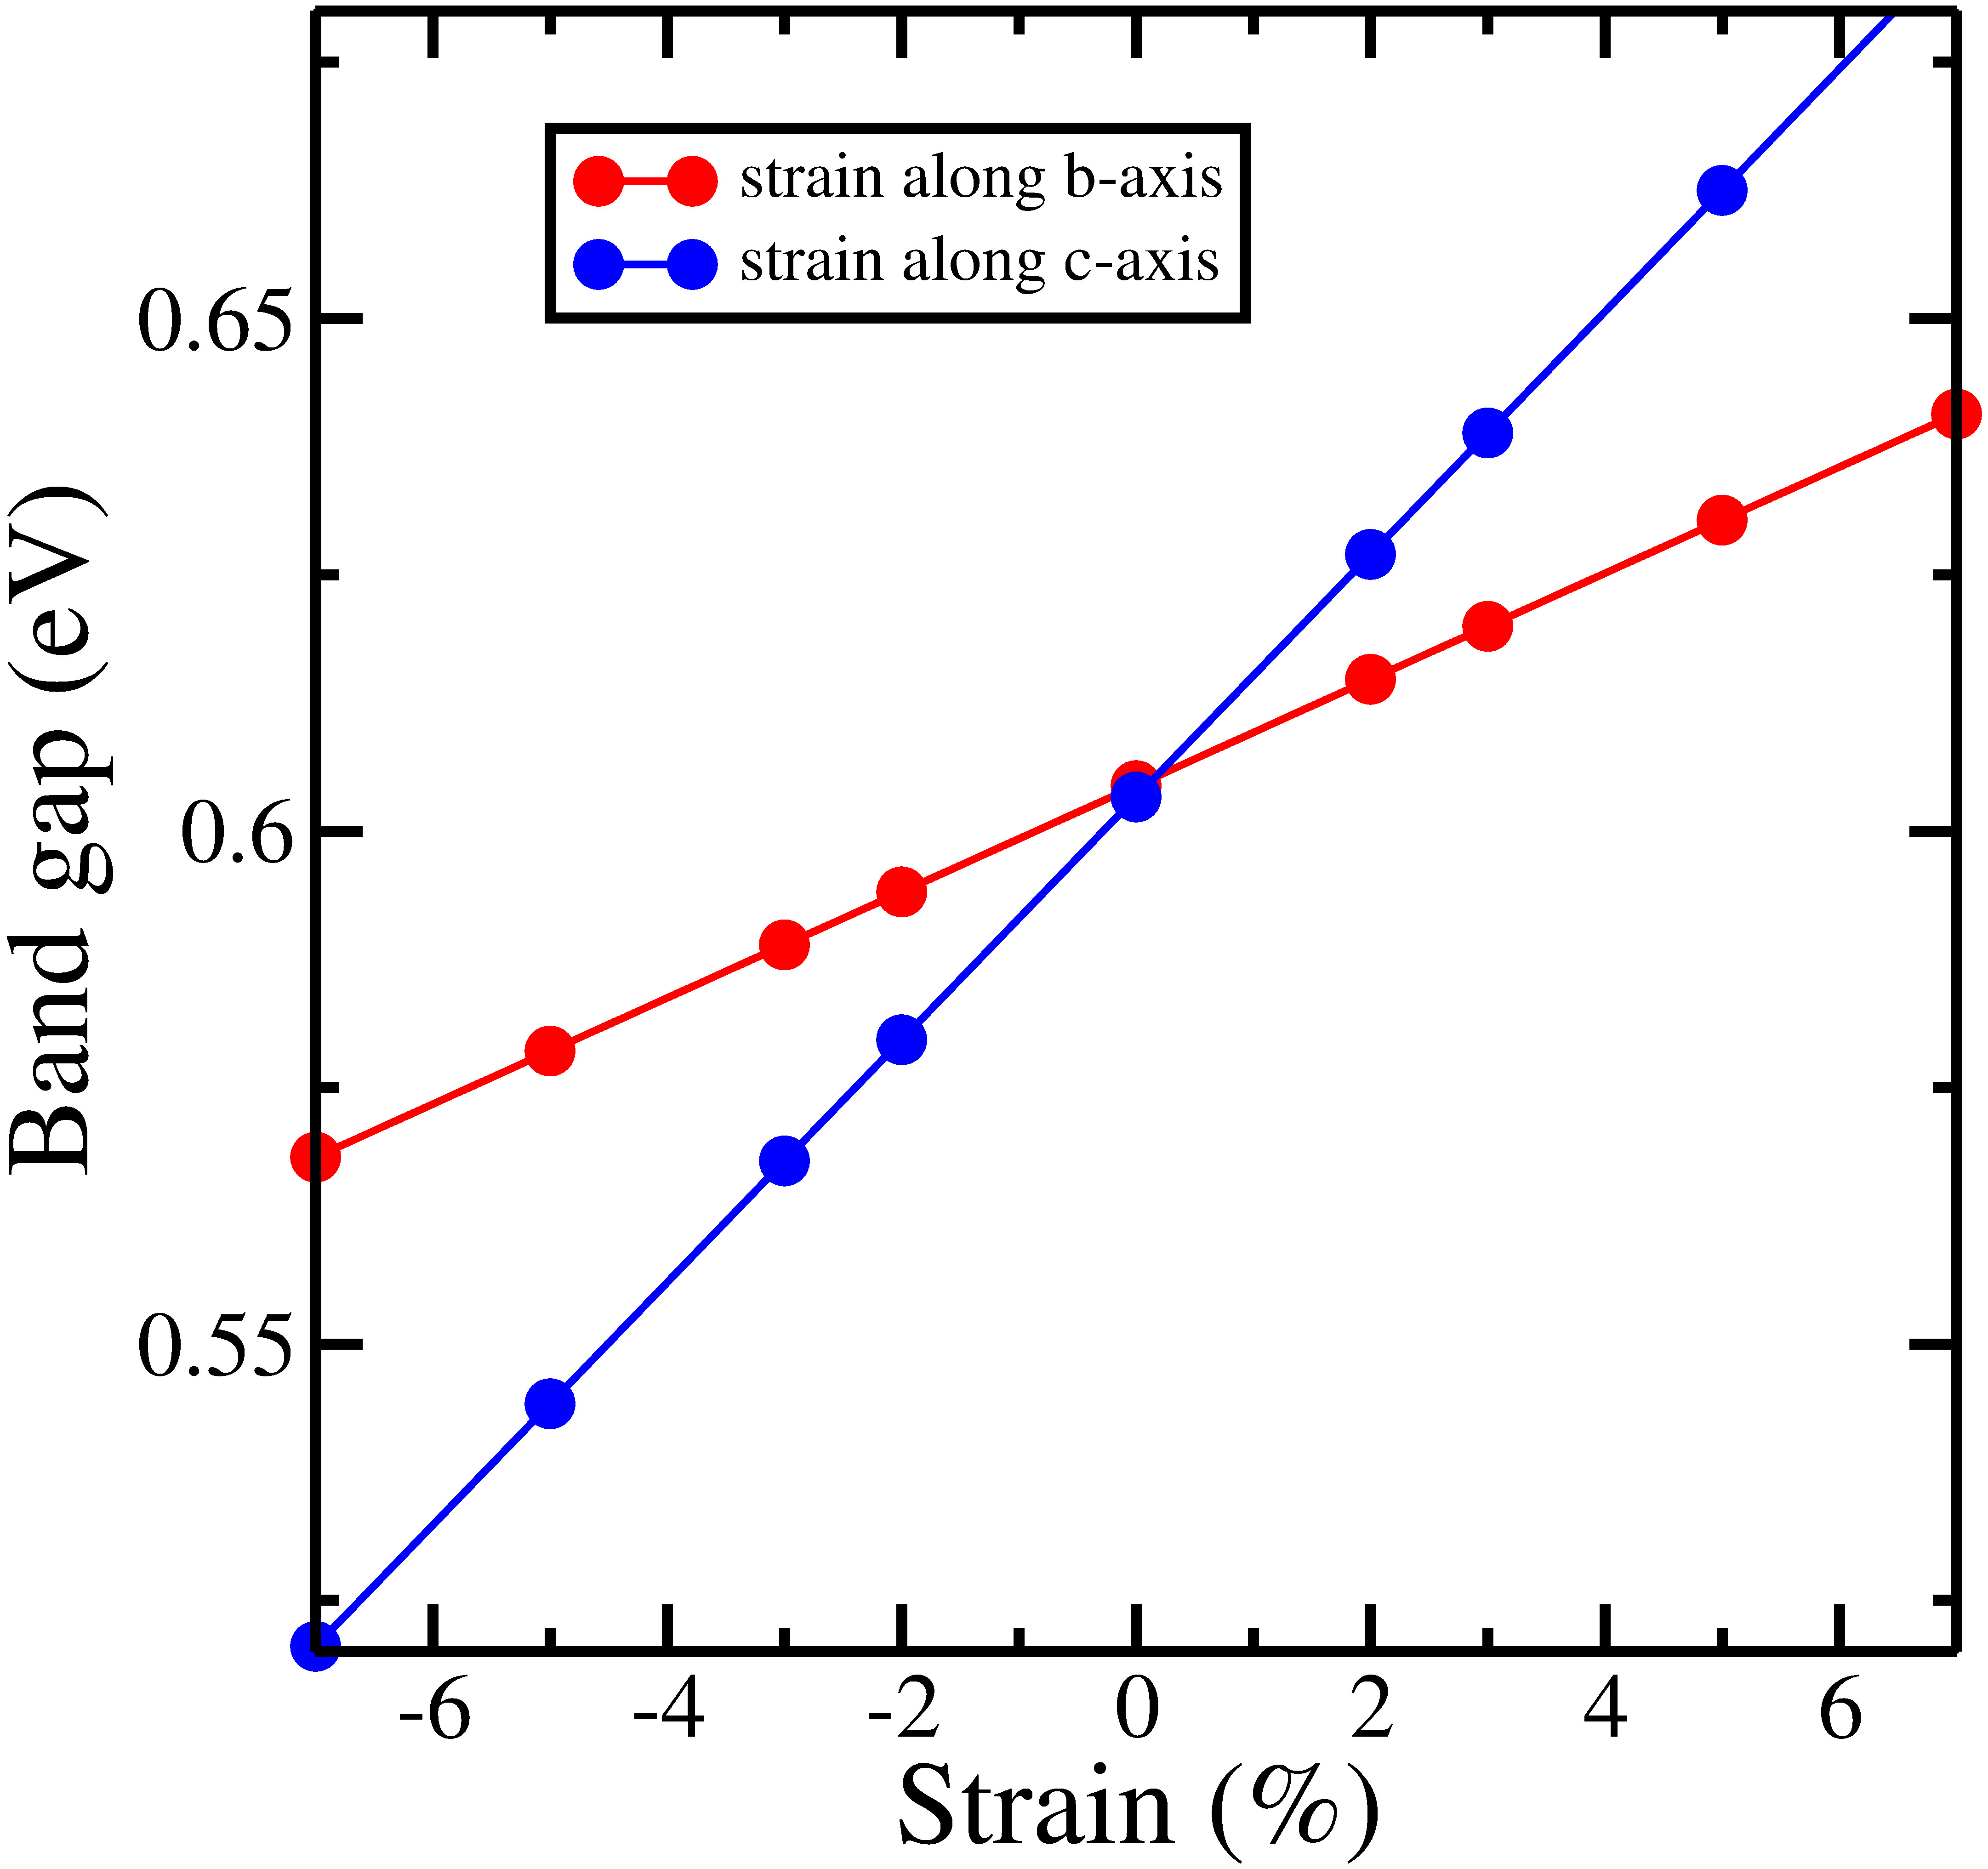
Recently, Ming et al. have reported the effect of strain on the band gap and octahedron rotation for Ba2ZrS4. 43. According to their report, a significant change in the band gap and octahedron rotation is observed with the application of strain. However, in our case of Ba2ZrS4 RP phase, monotonic change in the band gap (but not as large as in case of Ming et al.) has been observed on applying upto strain along b-axis and c-axis (see Fig. S9 in SI). The effect on the band gap along b- and a-direction are symmetric. Further, the effect of strain on the band gap in out-of-plane direction is more significant than in in-plane direction. We have also noticed slight octahedral tilt under the application of strain along b-axis. In case of strain along c-axis, a small rotation of octahedron about c-axis has been observed. Here, we have calculated the elastic modulus of the RP phases that is given by
| (2) |
where V, s and E correspond to the volume of a unit cell, strain and total energy, respectively. We have observed that elastic modulus of the RP phases is larger than 2D RP phases 43. In order to compute carrier mobility, we have used deformation potential model 44, 45, 46, 47. According to this model, the mobility of charge carrier is defined as:
| (3) |
where T is the temperature, m∗ is the effective mass of charge carrier and e is the elementary charge of electron. El = ) is the deformation potential (for more details regarding calculation of C and El see section VIII in SI). In Table 5, we have listed the values of C, El and for electron and hole of BaZrS (n=[1-3]) RP phases. As elastic modulus decreases down the column (see Table 5), we can say that softness of the RP phases increases on increasing the value of n in BaZrS (n=[1-3]). Mobility of electron also decreases on increasing n in BaZrS (n=[1-3]).
| BaZrS | C (eV Å-3) | El (eV) | (cm2 V-1 s-1) |
|---|---|---|---|
| Ba2ZrS4 (e) | 1.23 | 6.36 | 2.16104 |
| Ba2ZrS4 (h) | 1.23 | 6.61 | 2.32103 |
| Ba3Z2S7 (e) | 0.92 | 6.41 | 8.63103 |
| Ba3Zr2S7 (h) | 0.92 | 6.39 | 4.72101 |
| Ba4Zr3S10 (e) | 0.67 | 6.72 | 4.22103 |
| Ba4Zr3S10 (h) | 0.67 | 6.73 | 8.27101 |
BaZrS 1/ / l (Å) (cm2V-1s-1) Ba2ZrS4 0.09 1.84 1.39 354.30 164.75 Ba3Z2S7 0.08 2.36 1.53 307.12 117.20 Ba4Zr3S10 0.10 1.77 1.37 292.49 76.39
After analyzing the specific free volume (for details see section IX in SI), we find that study of electron-phonon coupling is important in these materials. Also, the presence of polarization in the RP phases lays emphasis on the polaron study. We have examined the electron-phonon interaction in our system by the mesoscopic model, viz. Frohlich’s model 48, 49, 50 for the polarons. The dressed “quasiparticles”, formed due to screened interaction of electron and hole by the lattice, are known as polarons. Frohlich introduced a parameter to describe theoretically the momentum of electron in the field of polar lattice vibration. This parameter is known as dimensionless Frohlich coupling constant 51, 48, 49.
| (4) |
where coupling constant quantifies the electron-phonon coupling, m∗ is the effective mass of electron, m is the rest mass of the electron, h is Planck’s constant, c is the speed of light, (in [cm-1] units) is the optical phonon frequency, is the ionic screening parameter ( = - were, and are static and high frequency dielectric constant) and is the Rydberg energy. We have observed that electron-phonon coupling constant of considered RP phases (Table6), are smaller than that of their bulk BaZrS3 38. Further, using the extended form of Frohlich’s polaron theory, given by Feynman, the effective mass of polaron (m) 49 is defined as:
| (5) |
where m∗ is the effective mass calculated from the band structure calculations (see section VII in SI). The polaron radii 52 can be calculated as follows:
| (6) |
Polaron mobility according to the Hellwarth polaron model is defined as follows:
| (7) |
where, = hc/T, e is the electronic charge, m∗ is the effective mass of charge carrier, w and v correspond to temperature dependent variational parameters. K is a function of v, w, and 50 i.e., defined as follows:
| (8) |
Here, a2 and b are calculated as:
| (9) |
| (10) |
We have used lowest frequency of LO phonon i.e, 1.34, 1.46 and 1.36 THz for Ba2ZrS4, Ba3Zr2S7 and Ba4Zr3S10, respectively for our calculation. gives the upper limit of the charge carrier mobility, under the assumption that charge carrier (electron) interact only with the optical phonon. A significant change in the mobility of charge carrier can be seen on comparing the mobility of electron without including its interaction with the optical phonon (see Table 5) and with including interaction with the optical phonon (see Table 6). Here in Table 6, ionic screening is indicative of the ionicity for a system. On comparing our results with the hybrid inorganic-organic halide perovskites (ionic screening of MAPbI3, MAPbBr3 and MAPbCl3 are 0.17, 0.18 and 0.22, respectively 52), we can say that Ba2ZrS4, Ba3Zr2S7 and Ba4Zr3S10 are less ionic than MAPbX3 (X = Cl, Br, I). Also, the obtained coupling constant is comparable or larger than MAPbX3 (see Table 6). The lowering of mobility of charge carriers on the inclusion of LO phonon modes indicate that optical phonon modes are dominating over the acoustical phonon modes in these materials. Note that, in the absence of experimental data, these results may help as guideline for further research. Moreover, for qualitative analysis, our results are very informative to understand the charge transport properties of these RP phases. From Table6, we can clearly see that on increasing n in BaZrS (n=[1-3]) i.e., down the column the polaron mobility decreases and for bulk BaZrS3 16 phase it is very small. In view of this, the considered RP phases are expected to be better optical material than their bulk phase.
In conclusion, we have reported the electronic and excitonic properties of the RP phases of BaZrS (n=[1-3]) using Many Body Perturbation Theory. The exciton binding energy decreases on increasing the thickness of the perovskite layer. Double peak character is observed in the first excitonic peak calculated in in-plane direction of Ba2ZrS4. Only Ba2ZrS4 possesses direct band gap and with increasing n in BaZrS (n=[1-3]) the band gap becomes more indirect. Using Wannier-Mott approach, we have obtained the upper and lower bound of E, from the electronic and ionic contribution of the dielectric constant, respectively. We have observed that ionic contribution is more significant in BaZrS than in bulk BaZrS3. The charge carrier mobility is maximum in Ba2ZrS4, as computed by employing deformation potential of the same. Further, amongst BaZrS and bulk BaZrS3, the electron-phonon coupling constant is relatively smaller for former RP phases. From our polaron study, we conclude that the optical phonon modes are dominating as compared to the acoustical phonon modes for these systems. A large discrepancy is noticed in the mobility of charge carriers (which includes the effect of acoustical phonon modes only in electron-phonon coupling) and polaron mobility (which includes the effect of optical phonon modes in addition to the acoustic modes in electron-phonon coupling). It shows the dominating character of optical phonon modes in the electron-phonon coupling and must be studied to understand charge transport properties of RP phases.
1 Computational Methods
We have executed a systematic study to explore the optical, electronic and excitonic properties using Density Functional Theory (DFT) 32, 35 and beyond approaches under the framework of Many Body Perturbation Theory 53, 54, 55. All calculations are performed with Projected Augmented Wave (PAW) potentials as implemented in Vienna Ab initio Simulation Package (VASP) 56, 57. The PAW potential of elements viz., Ba, Zr and S contain ten, twelve and six valence electrons, respectively. BaZrS (n=[1-3]) RP phases are tetragonal structure having space group I4/mmm [139]. All the structures are optimized using Generalized Gradient Approximation (GGA) as implemented in PBE 58 exchange-correlation () functional until the forces are smaller than 0.001 eV/Å. The -centered 222 k-mesh sampling is employed for optimization calculations (optimized structures are shown in Fig. 5). The electronic self-consistency loop convergence is set to 0.01 meV, and the kinetic energy cutoff is set to 600 eV for plane wave basis set expansion. To explore the optical properties and excitonic effects, Bethe-Salpeter Equation (BSE) is solved. Initially, we have used light 441 k-mesh for energy calculation (see Fig. S1). The convergence criteria for the number of occupied and unoccupied bands in BSE calculations is given in SI (see Fig. S2). In order to have improved spectral features with denser k-mesh, we have employed the model-BSE (mBSE) 59 approach. Following this, we have performed Density Functional Perturbation Theory (DFPT) 60 with k-mesh 12121, to discern the role of ionic contribution to dielectric function along with electronic contribution. Note that for GW and BSE calculations, we have used converged NBANDS i.e., 800. Lastly, by employing Frohlich model approach 61, we have studied polaron effect in our systems {acknowledgement} DG acknowledges UGC, India, for the senior research fellowship [grant no. [1268/(CSIR-UGC NET JUNE 2018)]]. AS acknowledges IIT Delhi for the financial support. MJ acknowledges CSIR, India, for the senior research fellowship [grant no. [09/086(1344)/2018-EMR-I]]. SB acknowledges the financial support from SERB under core research grant (grant no. CRG/2019/000647). We acknowledge the High Performance Computing (HPC) facility at IIT Delhi for computational resources. {suppinfo} K-mesh convergence for PBE functional; Number of occupied (NO) and unoccupied (NV) bands convergence in BSE calculation; Band structure plot with PBE and PBE+SOC; BSE@G0W0@HSE06 for Ba2ZrS4; model-BSE (mBSE) approach; Projected density of states (PDOS); Effective mass of electron (e) and hole (h); Calculation of deformation potential energy and elastic modulus; Strength of electron-phonon coupling.
Supplemental Material
-
I.
k-mesh convergence for PBE functional
-
II.
Number of occupied (NO) and unoccupied (NV) bands convergence in BSE calculation
-
III.
Band structure plot with PBE and PBE+SOC
-
IV.
BSE@G0W0@HSE06 for Ba2ZrS4
-
V.
model-BSE (mBSE) approach
-
VI.
Projected density of states (PDOS)
-
VII.
Effective mass of electron (e) and hole (h)
-
VIII.
Calculation of deformation potential energy and elastic modulus
-
IX.
Strength of electron-phonon coupling
2 k-mesh convergence for PBE functional
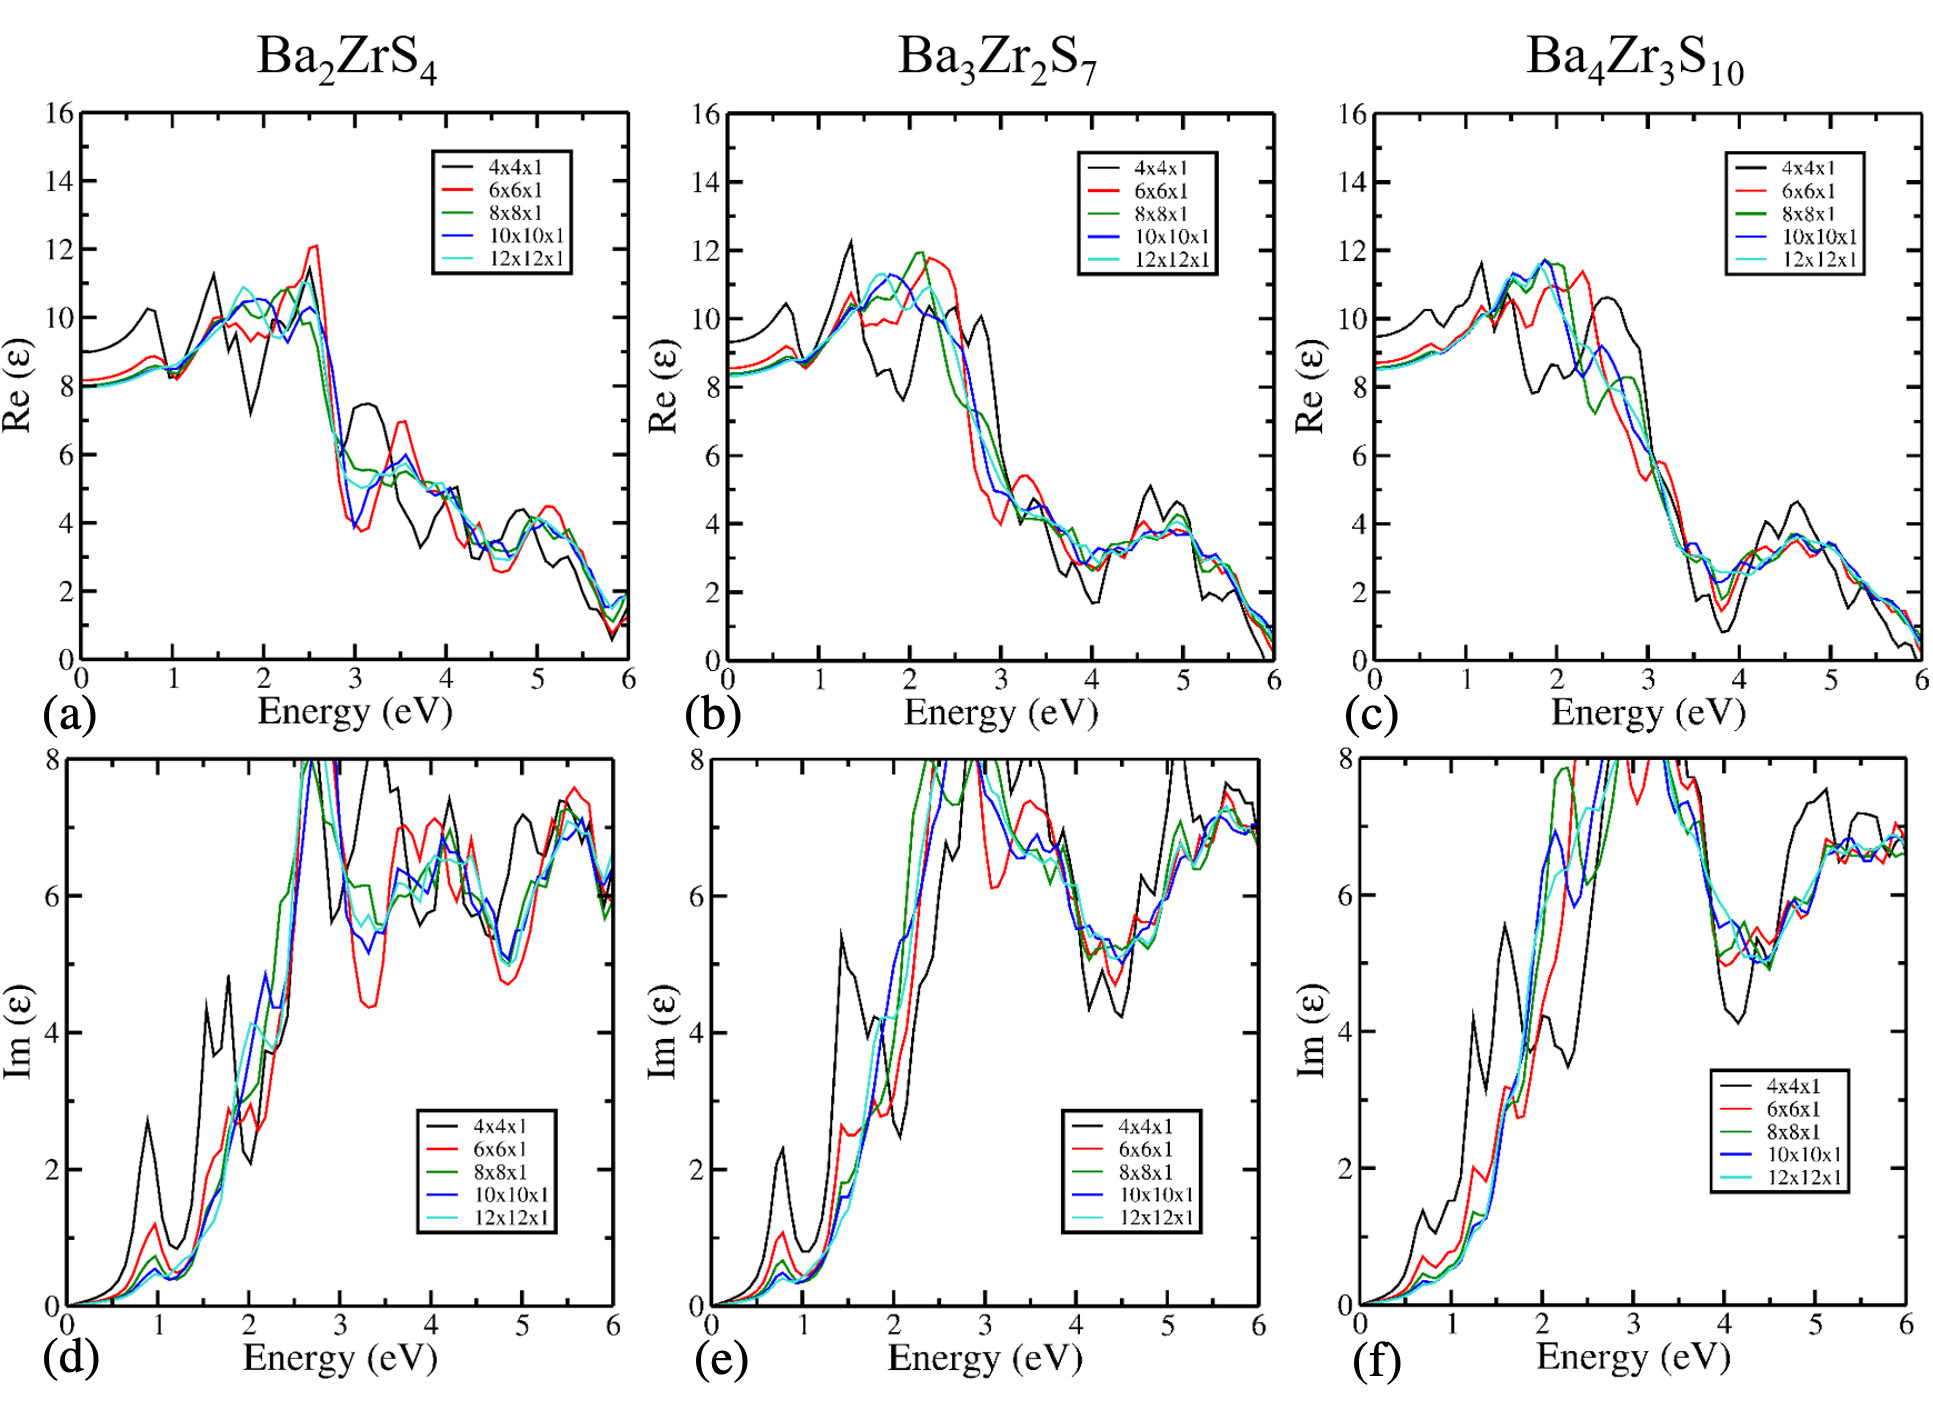
Figure 5(a-c) shows the variation of real part (Re()) and Figure 5(d-f) shows the imaginary part (Im()) (see Figure 5(d-e)) of dielectric function for BaZrS (n=[1-3]) RP phases. On increasing k-mesh a significant change in Re() can be seen. However, no shift in first peak position of Im() part of dielectric function is observed on increasing k-mesh. Hence, 4x4x1 light k-mesh is sufficient to compute quasi particle band gap.
3 Number of occupied (NO) and unoccupied (NV) bands convergence in BSE calculation
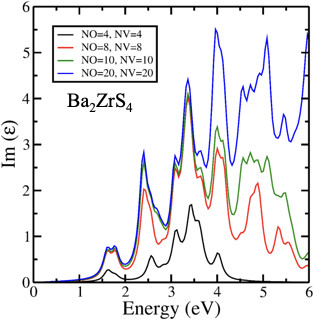
4 Band structure plot with PBE and PBE+SOC
5 BSE@G0W0@HSE06 for Ba2ZrS4
6 model-BSE (mBSE) approach
To compute exciton energy and E precisely, one needs to accurately calculate the optical spectra or optical gap using conventional BSE@G0W0 approach. However, there is inconsistency observed in BSE exciton peak, due to insufficient high k-mesh (approx 881). We can not use high k-mesh because it is computationally very expensive. This results in the incorrect E value. Therefore, to overcome this issue, a less expensive but robust mBSE approach was proposed. In this model, the convergence of the optical spectra as a function of the number of k-mesh is performed. This method is generally based on two approximations:
(i) Using Eq. 11 the RPA static screening W is replaced by a simple analytical model. Here, the dielectric function is replaced by the local model function:
| (11) |
where, is the static ion-clamped dielectric function in the high frequency limit. is calculated either from DFPT or G0W0. q and G are the wave vector and lattice vector of the reciprocal cell, respectively. is the screening length parameter, calculated by fitting at small wave vectors with respect to (see Figure 10 (a-c)). The parameters obtained for the BaZrS (n=[1-3]) RP phases are collected in Table 4.
| BaZrS | (PBE) | (PBE) |
|---|---|---|
| Ba2ZrS4 | 0.14 | 1.17 |
| Ba3Zr2S7 | 0.15 | 1.19 |
| Ba4Zr3S10 | 0.15 | 1.17 |
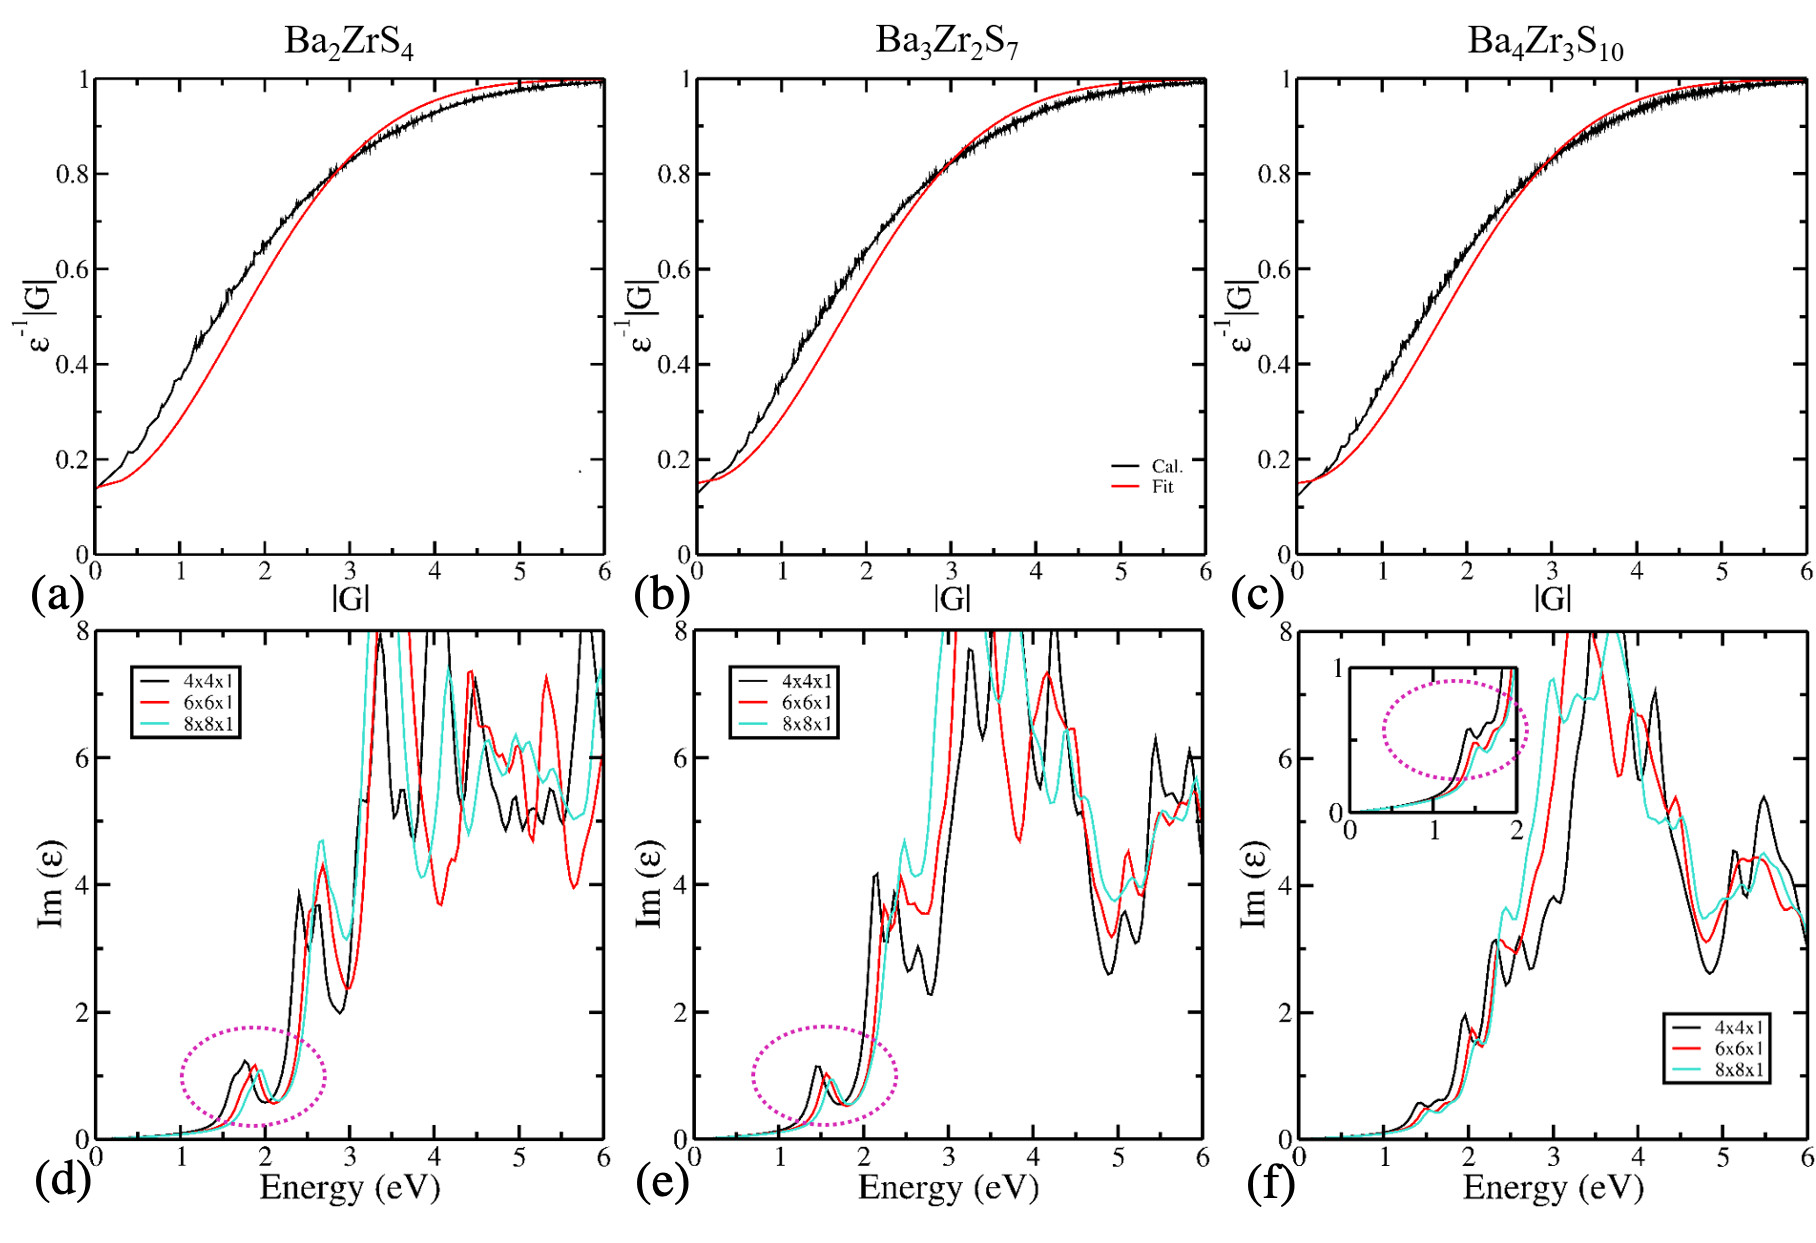
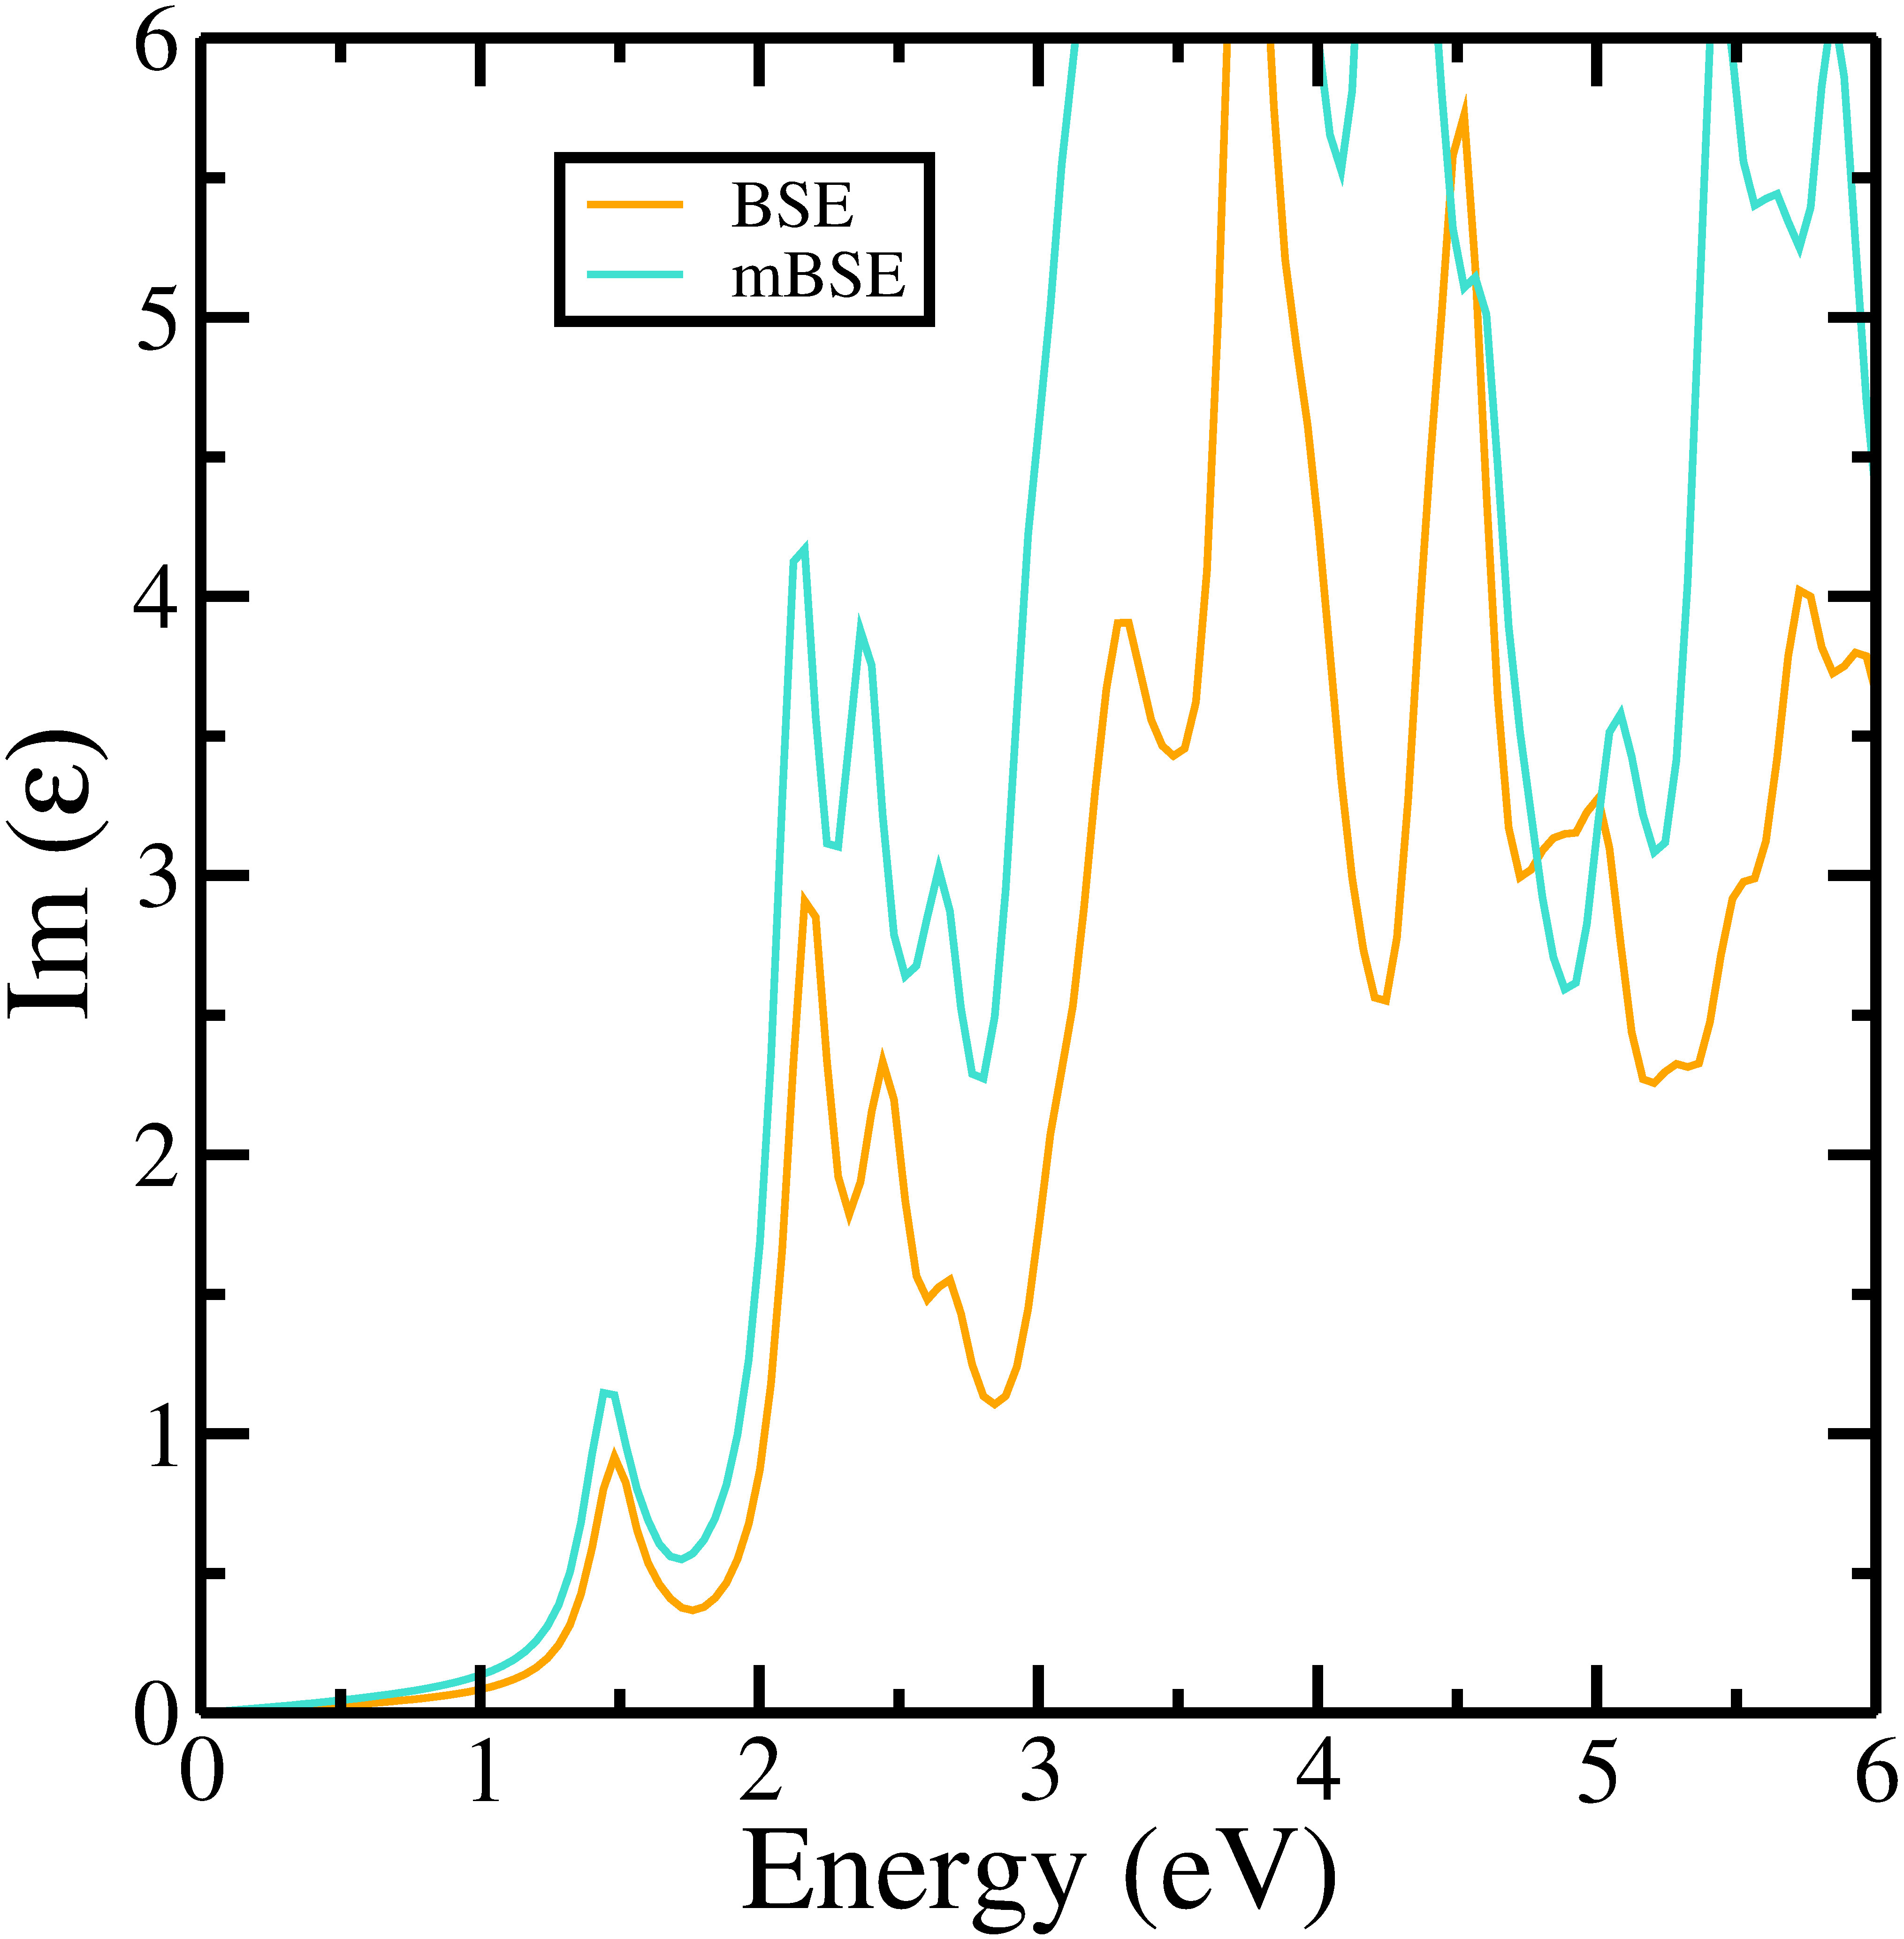
Here, in Figure 10, we have shown that the imaginary part of the dielectric function calculated with BSE@GW@PBE, matches with the one, which is calculated with the model BSE (mBSE) method, where we have chosen PBE as the starting point. Therefore, we can say that the excitonic features (i.e first peak) information are always retained by mBSE approach. Notably, both the calculations are performed using 441 k-mesh with the same starting point.
7 Projected density of states (PDOS)
8 Effective mass of electron (e) and hole (h)
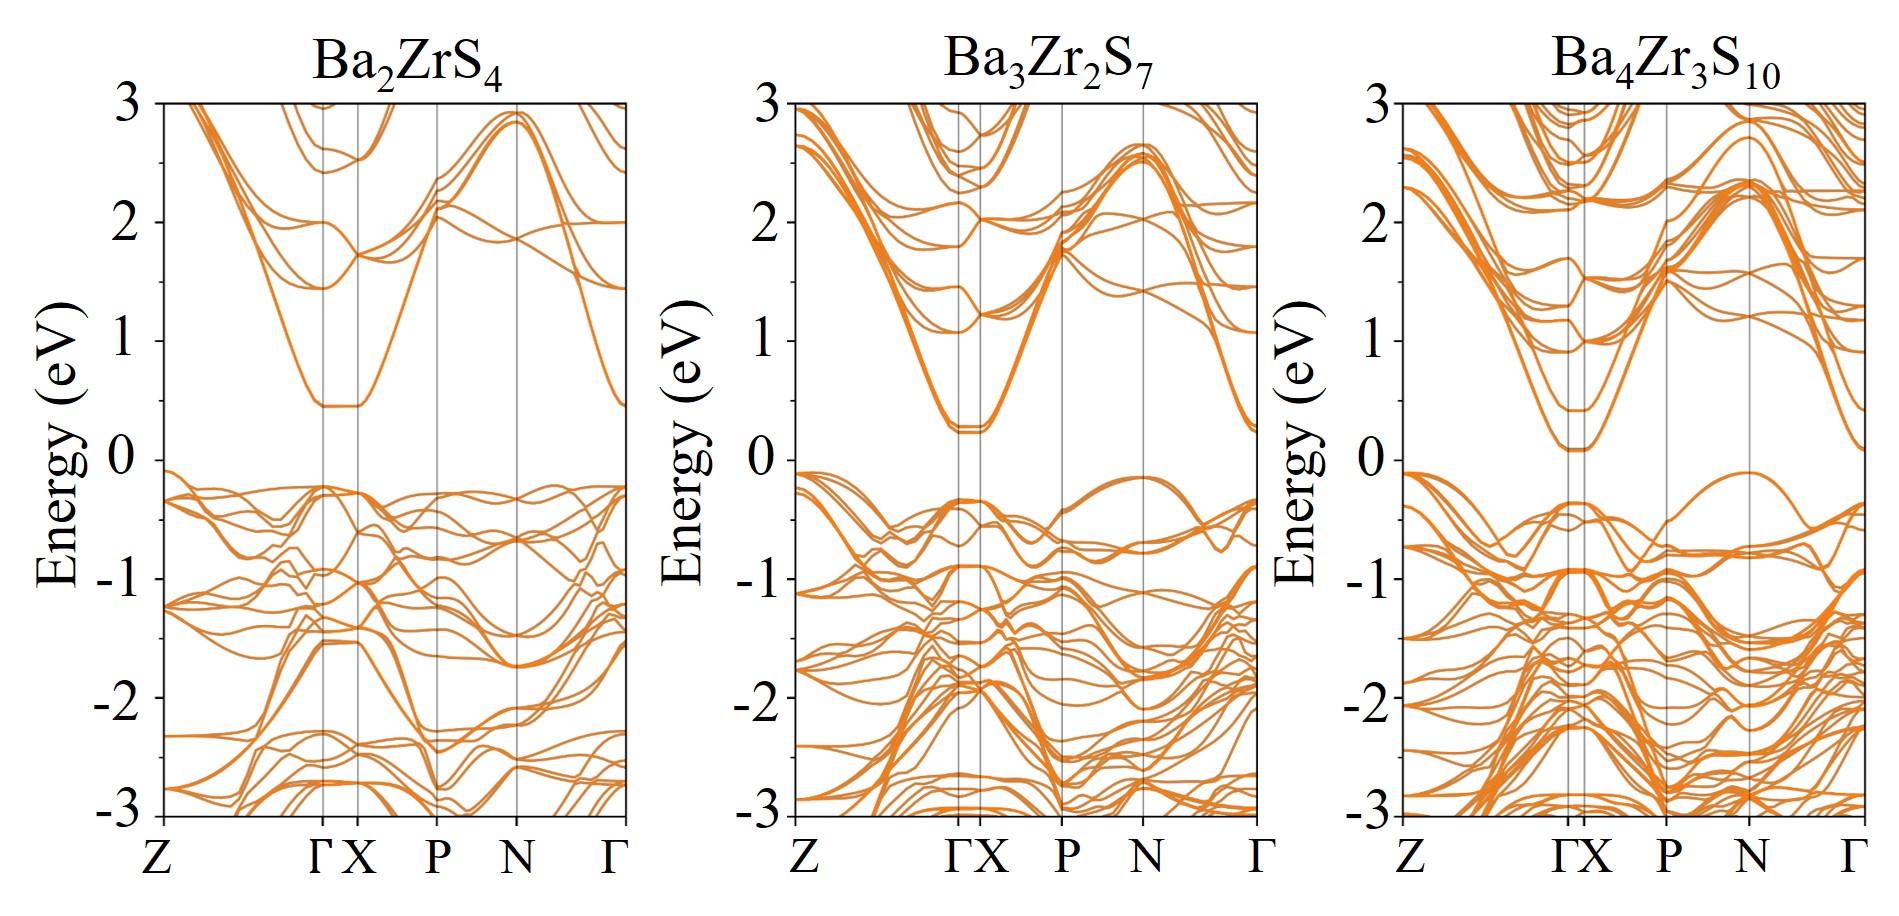
To compute effective mass, we have obtained the bandstructure using PBE functional (see Figure 14). Here, we have calculated the effective masses of electron (e) and hole (h) along the symmetric path Z for Ba2ZrS4. In case of Ba3Z2S7 and Ba4Zr3S10, the effective masses of e and h are calculated along Z and Z , respectively. All the effective and reduced masses are tabulated in Table 5. Note that, in Figure 14, the observed flatbands along high-symmetric path X are along z-direction. While calculating the effective masses, we have excluded the high-symmetric path along z-direction.
| BaZrS | m | m | |
|---|---|---|---|
| Ba2ZrS4 | 0.18 | 0.43 | 0.32 |
| Ba3Zr2S7 | 0.23 | 1.85 | 0.26 |
| Ba4Zr3S10 | 0.26 | 1.25 | 0.34 |
9 Calculation of deformation potential energy and elastic modulus
According to deformation potential model the carrier mobility is defined as:
| (12) |
where , T, and m∗ correspond to the Boltzmann constant, temperature (i.e., 300 K), and effective mass, respectively. In the above equation, E1 corresponds to the deformation potential constant along y-direction for electron and hole, respectively. It is given by:
| (13) |
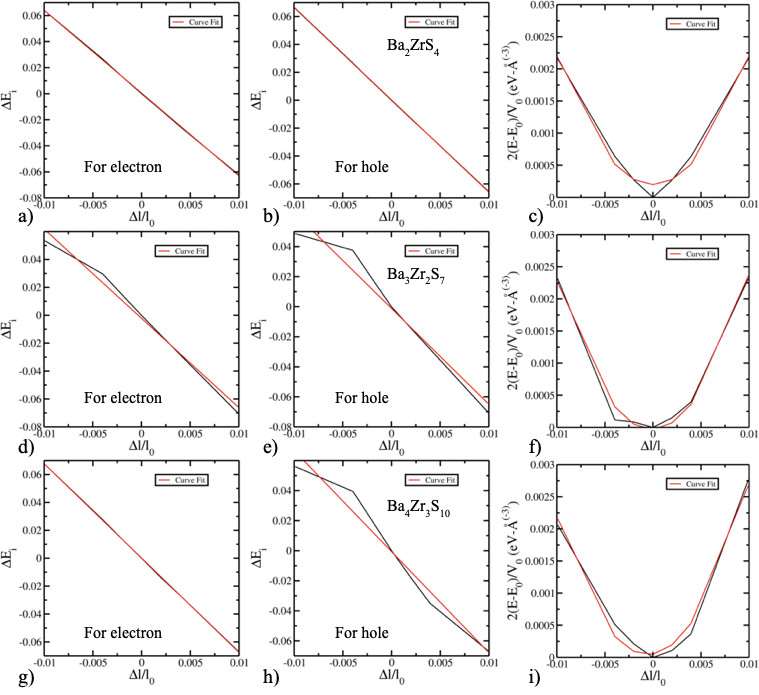
where, denotes the change in the energy or shift in the position of VBM or CBm under uniaxial strain along the y-direction. l0 is the lattice constant along the transport direction. denotes the change or deformation in the lattice constant l0 on application of uniaxial starin. The elastic modulus C is computed using (E - E0)/V0 = C(, where E0 and E are the total energy of undeformed system and deformed system. V0 represents the equilibrium volume of the system. Note, herein, we have chosen strain range from -1.0% to +1.0% to obtain the fitted values of C and E1 (see Figure 14).
10 Strength of electron-phonon coupling
For the qualitative idea of electron-phonon coupling strength, we have calculated the specific free volume. It is already reported in the literature that electron-phonon coupling depends on free volume (unoccupied space) 62. Lattice free volume is defined as the difference between the unitcell volume and the constituent ions’ volume. Following this, the ratio between the unoccupied volume and the total volume is defined as the specific free volume (see Table 6). From Table 6, we can clearly see that specific free volume is quite large and hence the electron-phonon coupling could be prompt in these systems. Hence, electron-phonon coupling is important in these systems.
| BaZrS | Specific free volume (%) |
|---|---|
| Ba2ZrS4 | 94.33 |
| Ba3Zr2S7 | 94.17 |
| Ba4Zr3S10 | 94.10 |
References
- Jaffe et al. 1971 Jaffe, B.; Cook, W.; Jaffe, H. JCPDS 71-2171; 1971
- Tombe et al. 2017 Tombe, S.; Adam, G.; Heilbrunner, H.; Apaydin, D. H.; Ulbricht, C.; Sariciftci, N. S.; Arendse, C. J.; Iwuoha, E.; Scharber, M. C. Optical and electronic properties of mixed halide (X = I, Cl, Br) methylammonium lead perovskite solar cells. J. Mater. Chem. C 2017, 5, 1714–1723
- Zhang et al. 2015 Zhang, S.; Li, F.; Jiang, X.; Kim, J.; Luo, J.; Geng, X. Advantages and challenges of relaxor-PbTiO3 ferroelectric crystals for electroacoustic transducers–A review. Progress in materials science 2015, 68, 1–66
- Deschler et al. 2014 Deschler, F.; Price, M.; Pathak, S.; Klintberg, L. E.; Jarausch, D.-D.; Higler, R.; Hüttner, S.; Leijtens, T.; Stranks, S. D.; Snaith, H. J. et al. High photoluminescence efficiency and optically pumped lasing in solution-processed mixed halide perovskite semiconductors. The journal of physical chemistry letters 2014, 5, 1421–1426
- Shi et al. 2015 Shi, D.; Adinolfi, V.; Comin, R.; Yuan, M.; Alarousu, E.; Buin, A.; Chen, Y.; Hoogland, S.; Rothenberger, A.; Katsiev, K. et al. Low trap-state density and long carrier diffusion in organolead trihalide perovskite single crystals. Science 2015, 347, 519–522
- Stamplecoskie et al. 2015 Stamplecoskie, K. G.; Manser, J. S.; Kamat, P. V. Dual nature of the excited state in organic–inorganic lead halide perovskites. Energy Environ. Sci. 2015, 8, 208–215
- Bi et al. 2016 Bi, Y.; Hutter, E. M.; Fang, Y.; Dong, Q.; Huang, J.; Savenije, T. J. Charge carrier lifetimes exceeding 15 s in methylammonium lead iodide single crystals. The journal of physical chemistry letters 2016, 7, 923–928
- Ramasamy et al. 2016 Ramasamy, P.; Lim, D.-H.; Kim, B.; Lee, S.-H.; Lee, M.-S.; Lee, J.-S. All-inorganic cesium lead halide perovskite nanocrystals for photodetector applications. Chem. Commun. 2016, 52, 2067–2070
- Leijtens et al. 2017 Leijtens, T.; Bush, K.; Cheacharoen, R.; Beal, R.; Bowring, A.; McGehee, M. D. Towards enabling stable lead halide perovskite solar cells; interplay between structural, environmental, and thermal stability. J. Mater. Chem. A 2017, 5, 11483–11500
- K. and Nag 2018 K., N. N.; Nag, A. Synthesis and luminescence of Mn-doped Cs2AgInCl6 double perovskites. Chem. Commun. 2018, 54, 5205–5208
- Park and Seok 2019 Park, B.-w.; Seok, S. I. Intrinsic instability of inorganic–organic hybrid halide perovskite materials. Advanced Materials 2019, 31, 1805337
- Babayigit et al. 2016 Babayigit, A.; Ethirajan, A.; Muller, M.; Conings, B. Toxicity of organometal halide perovskite solar cells. Nature materials 2016, 15, 247–251
- Sun et al. 2015 Sun, Y.-Y.; Agiorgousis, M. L.; Zhang, P.; Zhang, S. Chalcogenide perovskites for photovoltaics. Nano letters 2015, 15, 581–585
- Hanzawa et al. 2019 Hanzawa, K.; Iimura, S.; Hiramatsu, H.; Hosono, H. Material design of green-light-emitting semiconductors: Perovskite-type sulfide SrHfS3. Journal of the American Chemical Society 2019, 141, 5343–5349
- Lee et al. 2005 Lee, C.-S.; Kleinke, K. M.; Kleinke, H. Synthesis, structure, and electronic and physical properties of the two SrZrS3 modifications. Solid state sciences 2005, 7, 1049–1054
- Majumdar et al. 2020 Majumdar, A.; Adeleke, A. A.; Chakraborty, S.; Ahuja, R. Emerging piezochromism in lead free alkaline earth chalcogenide perovskite AZrS 3 (A= Mg, Ca, Sr and Ba) under pressure. Journal of Materials Chemistry C 2020, 8, 16392–16403
- Perera et al. 2016 Perera, S.; Hui, H.; Zhao, C.; Xue, H.; Sun, F.; Deng, C.; Gross, N.; Milleville, C.; Xu, X.; Watson, D. F. et al. Chalcogenide perovskites–an emerging class of ionic semiconductors. Nano Energy 2016, 22, 129–135
- Li et al. 2019 Li, W.; Niu, S.; Zhao, B.; Haiges, R.; Zhang, Z.; Ravichandran, J.; Janotti, A. Band gap evolution in Ruddlesden-Popper phases. Physical Review Materials 2019, 3, 101601
- Meng et al. 2016 Meng, W.; Saparov, B.; Hong, F.; Wang, J.; Mitzi, D. B.; Yan, Y. Alloying and defect control within chalcogenide perovskites for optimized photovoltaic application. Chemistry of Materials 2016, 28, 821–829
- Ravi et al. 2021 Ravi, V. K.; Yu, S. H.; Rajput, P. K.; Nayak, C.; Bhattacharyya, D.; Chung, D. S.; Nag, A. Colloidal BaZrS 3 chalcogenide perovskite nanocrystals for thin film device fabrication. Nanoscale 2021,
- Wei et al. 2020 Wei, X.; Hui, H.; Perera, S.; Sheng, A.; Watson, D. F.; Sun, Y.-Y.; Jia, Q.; Zhang, S.; Zeng, H. Ti-alloying of BaZrS3 chalcogenide perovskite for photovoltaics. ACS omega 2020, 5, 18579–18583
- Kuhar et al. 2017 Kuhar, K.; Crovetto, A.; Pandey, M.; Thygesen, K. S.; Seger, B.; Vesborg, P. C.; Hansen, O.; Chorkendorff, I.; Jacobsen, K. W. Sulfide perovskites for solar energy conversion applications: computational screening and synthesis of the selected compound LaYS 3. Energy & Environmental Science 2017, 10, 2579–2593
- Sun et al. 2018 Sun, Q.; Chen, H.; Yin, W.-J. Do chalcogenide double perovskites work as solar cell absorbers: a first-principles study. Chemistry of Materials 2018, 31, 244–250
- Comparotto et al. 2020 Comparotto, C.; Davydova, A.; Ericson, T.; Riekehr, L.; Moro, M. V.; Kubart, T.; Scragg, J. Chalcogenide Perovskite BaZrS3: Thin Film Growth by Sputtering and Rapid Thermal Processing. ACS Applied Energy Materials 2020, 3, 2762–2770
- Song et al. 2020 Song, J.; Ning, D.; Boukamp, B.; Bassat, J.-M.; Bouwmeester, H. J. Structure, electrical conductivity and oxygen transport properties of Ruddlesden–Popper phases Ln n+ 1 Ni n O 3n+ 1 (Ln= La, Pr and Nd; n= 1, 2 and 3). Journal of Materials Chemistry A 2020, 8, 22206–22221
- Ghosh et al. 2020 Ghosh, D.; Acharya, D.; Pedesseau, L.; Katan, C.; Even, J.; Tretiak, S.; Neukirch, A. J. Charge carrier dynamics in two-dimensional hybrid perovskites: Dion–Jacobson vs. Ruddlesden–Popper phases. Journal of Materials Chemistry A 2020, 8, 22009–22022
- Gill et al. 2020 Gill, D.; Kumar, M.; Basera, P.; Bhattacharya, S. Understanding the Ionic Diffusivity in the (Meta) Stable (Un) doped Solid-State Electrolyte from First-Principles: A Case Study of LISICON. The Journal of Physical Chemistry C 2020, 124, 17485–17493
- Gill et al. 2021 Gill, D.; Bhumla, P.; Kumar, M.; Bhattacharya, S. High-throughput screening to modulate electronic and optical properties of alloyed Cs2AgBiCl6 for enhanced solar cell efficiency. Journal of Physics: Materials 2021,
- Qiu et al. 2019 Qiu, J.; Xia, Y.; Zheng, Y.; Hui, W.; Gu, H.; Yuan, W.; Yu, H.; Chao, L.; Niu, T.; Yang, Y. et al. 2D intermediate suppression for efficient Ruddlesden–Popper (RP) phase lead-free perovskite solar cells. ACS Energy Letters 2019, 4, 1513–1520
- Stanford et al. 2018 Stanford, M. G.; Rack, P. D.; Jariwala, D. Emerging nanofabrication and quantum confinement techniques for 2D materials beyond graphene. npj 2D Materials and Applications 2018, 2, 1–15
- Lee et al. 2012 Lee, J.-W.; Im, J.-H.; Park, N.-G. Quantum confinement effect of CdSe induced by nanoscale solvothermal reaction. Nanoscale 2012, 4, 6642–6648
- Kohn and Sham 1965 Kohn, W.; Sham, L. J. Self-consistent equations including exchange and correlation effects. Physical review 1965, 140, A1133
- Tian et al. 2020 Tian, X.; Zhang, Y.; Zheng, R.; Wei, D.; Liu, J. Two-dimensional organic–inorganic hybrid Ruddlesden–Popper perovskite materials: preparation, enhanced stability, and applications in photodetection. Sustainable Energy & Fuels 2020, 4, 2087–2113
- Yu et al. 2019 Yu, Y.; Wang, Z.; Shao, G. Theoretical tuning of Ruddlesden–Popper type anti-perovskite phases as superb ion conductors and cathodes for solid sodium ion batteries. Journal of Materials Chemistry A 2019, 7, 10483–10493
- Hohenberg and Kohn 1964 Hohenberg, P.; Kohn, W. Inhomogeneous electron gas. Physical review 1964, 136, B864
- Park et al. 2018 Park, M.; Neukirch, A. J.; Reyes-Lillo, S. E.; Lai, M.; Ellis, S. R.; Dietze, D.; Neaton, J. B.; Yang, P.; Tretiak, S.; Mathies, R. A. Excited-state vibrational dynamics toward the polaron in methylammonium lead iodide perovskite. Nature communications 2018, 9, 1–9
- Shockley and Queisser 1961 Shockley, W.; Queisser, H. J. Detailed balance limit of efficiency of p-n junction solar cells. Journal of applied physics 1961, 32, 510–519
- Kumar et al. 2021 Kumar, M.; Singh, A.; Gill, D.; Bhattacharya, S. Optoelectronic Properties of Chalcogenide Perovskites by Many-Body Perturbation Theory. arXiv preprint arXiv:2103.17264 2021,
- Waters et al. 2020 Waters, M. J.; Hashemi, D.; Kieffer, J. Semiclassical model for calculating exciton and polaron pair energetics at interfaces. Materials Science and Engineering: B 2020, 261, 114657
- Freysoldt et al. 2014 Freysoldt, C.; Grabowski, B.; Hickel, T.; Neugebauer, J.; Kresse, G.; Janotti, A.; Van de Walle, C. G. First-principles calculations for point defects in solids. Reviews of modern physics 2014, 86, 253
- Basera et al. 2020 Basera, P.; Singh, A.; Gill, D.; Bhattacharya, S. Capturing Excitonic Effects in Lead Iodide Perovskites from Many-Body Perturbation Theory. arXiv preprint arXiv:2008.03381 2020,
- Jain et al. 2021, accepted Jain, M.; Gill, D.; Bhumla, P.; Bhattacharya, S. Theoretical insights to excitonic effect in lead bromide perovskites. Applied Physics Letters 2021, accepted,
- Ming et al. 2020 Ming, C.; Yang, K.; Zeng, H.; Zhang, S.; Sun, Y.-Y. Octahedron rotation evolution in 2D perovskites and its impact on optoelectronic properties: the case of Ba–Zr–S chalcogenides. Materials Horizons 2020, 7, 2985–2993
- Szmulowicz and Madarasz 1983 Szmulowicz, F.; Madarasz, F. L. Deformation-potential-theory calculation of the acoustic-phonon-limited conductivity and Hall mobilities for p-type silicon. Physical Review B 1983, 27, 2605
- Takagi et al. 1994 Takagi, S.-i.; Toriumi, A.; Iwase, M.; Tango, H. On the universality of inversion layer mobility in Si MOSFET’s: Part I-effects of substrate impurity concentration. IEEE Transactions on Electron Devices 1994, 41, 2357–2362
- Bruzzone and Fiori 2011 Bruzzone, S.; Fiori, G. Ab-initio simulations of deformation potentials and electron mobility in chemically modified graphene and two-dimensional hexagonal boron-nitride. Applied Physics Letters 2011, 99, 222108
- Qiao et al. 2014 Qiao, J.; Kong, X.; Hu, Z.-X.; Yang, F.; Ji, W. High-mobility transport anisotropy and linear dichroism in few-layer black phosphorus. Nature communications 2014, 5, 1–7
- Fröhlich 1954 Fröhlich, H. Electrons in lattice fields. Advances in Physics 1954, 3, 325–361
- Feynman 1955 Feynman, R. P. Slow electrons in a polar crystal. Physical Review 1955, 97, 660
- Hellwarth and Biaggio 1999 Hellwarth, R. W.; Biaggio, I. Mobility of an electron in a multimode polar lattice. Physical Review B 1999, 60, 299
- Biaggio et al. 1997 Biaggio, I.; Hellwarth, R. W.; Partanen, J. P. Band mobility of photoexcited electrons in Bi 12 SiO 20. Physical review letters 1997, 78, 891
- Sendner et al. 2016 Sendner, M.; Nayak, P. K.; Egger, D. A.; Beck, S.; Müller, C.; Epding, B.; Kowalsky, W.; Kronik, L.; Snaith, H. J.; Pucci, A. et al. Optical phonons in methylammonium lead halide perovskites and implications for charge transport. Materials Horizons 2016, 3, 613–620
- Jiang et al. 2012 Jiang, H.; Rinke, P.; Scheffler, M. Electronic properties of lanthanide oxides from the G W perspective. Physical Review B 2012, 86, 125115
- Fuchs et al. 2008 Fuchs, F.; Rödl, C.; Schleife, A.; Bechstedt, F. Efficient O (N 2) approach to solve the Bethe-Salpeter equation for excitonic bound states. Physical Review B 2008, 78, 085103
- Basera et al. 2019 Basera, P.; Saini, S.; Bhattacharya, S. Self energy and excitonic effect in (un) doped TiO 2 anatase: a comparative study of hybrid DFT, GW and BSE to explore optical properties. Journal of Materials Chemistry C 2019, 7, 14284–14293
- Kresse and Furthmüller 1996 Kresse, G.; Furthmüller, J. Efficiency of ab-initio total energy calculations for metals and semiconductors using a plane-wave basis set. Computational materials science 1996, 6, 15–50
- Kresse and Joubert 1999 Kresse, G.; Joubert, D. From ultrasoft pseudopotentials to the projector augmented-wave method. Physical review b 1999, 59, 1758
- Perdew et al. 1996 Perdew, J. P.; Burke, K.; Ernzerhof, M. Generalized gradient approximation made simple. Physical review letters 1996, 77, 3865
- Bokdam et al. 2016 Bokdam, M.; Sander, T.; Stroppa, A.; Picozzi, S.; Sarma, D.; Franchini, C.; Kresse, G. Role of polar phonons in the photo excited state of metal halide perovskites. Scientific reports 2016, 6, 1–8
- Gajdoš et al. 2006 Gajdoš, M.; Hummer, K.; Kresse, G.; Furthmüller, J.; Bechstedt, F. Linear optical properties in the projector-augmented wave methodology. Physical Review B 2006, 73, 045112
- Frost 2017 Frost, J. M. Calculating polaron mobility in halide perovskites. Physical Review B 2017, 96, 195202
- He et al. 2018 He, J.; Fang, W.-H.; Long, R. Unravelling the Effects of A-Site Cations on Nonradiative Electron–Hole Recombination in Lead Bromide Perovskites: Time-Domain ab Initio Analysis. The journal of physical chemistry letters 2018, 9, 4834–4840