Drop Interface and Airflow Unsteadiness in
Wind-Forced Drop Depinning
Abstract
Liquid drops that are pinned to solid surfaces by contact-angle hysteresis can be dislodged by wind forcing. When this occurs at high Reynolds numbers, substantial drop-interface oscillations precede depinning. It has been hypothesized that coupling between drop interface oscillations and unsteady airflow vortices are important to the depinning process. This possibility is investigated using simultaneous high-speed side-view drop images and airflow fluctuation measurements. The results show no evidence of coupling across a range of drop volumes and wind speeds for water drops in air. When properly scaled by drop volume, drop interface fluctuation frequencies are not affected by wind speed. Airflow vortex shedding occurs as if the drop were a solid surface protuberance. For the air/water system in these experiments, vortex shedding frequencies are substantially higher than drop interface frequencies and the disparate frequencies may make the hypothesized coupling impossible.
1 Introduction
Liquid drops that rest on solid surfaces are pinned in place by contact-angle hysteresis unless external forcing exceeds the maximum available pinning force. Beyond the maximum force, drops depin and run back along the surface. Early experimental work on depinning by gravity on inclined surfaces was performed by Macdougall and Ockrent [1], Bikerman [2], and Furmidge [3]. These studies established the maximum force a drop can resist scales as where is surface tension, is the drop width, and and are the receding and advancing contact angles, respectively. This result is straightforward to establish because gravity forcing is simply the drop weight times the sine of the surface inclination. Moreover, the gravity-forced drop shape is steady and and can be observed using side-view cameras.
It is of interest to understand drop depinning by wind forcing, a much-more complex phenomenon. When the airflow velocity is low or the drops are very small relative to the airflow boundary layer, drops may depin due to viscous shear. An analytical study in this regime based on lubrication theory was developed by Dussan V. [4]. When drops are larger, flow over the drop separates and forcing is mainly due to the pressure difference between the windward and leeward side of a drop [5, 6]. Lee-side separation occurs when the Reynolds number based on the drop height, , is large. This Reynolds number is defined where and are air density and viscosity, respectively. In this situation, depinning occurs when a critical Weber number, , is exceeded [5, 7, 8]. In the definitions of and , is taken to be the wind velocity at the maximum drop height, , in the undisturbed air flow.
Studies on wind-forced drop depinning are extensively reviewed by Milne and Amirfazli [7]. Wind-forced drops are difficult to model because the drag force applied by wind depends on the shape of the drop, drop size relative to the airflow boundary layer, and the laminar or turbulent state of the flow. There can also be substantial unsteadiness of both the airflow and drop interface shape. Milne et al. [9] reviewed a variety of studies on drop interface oscillations and performed wind-forced drop-oscillation studies to evaluate the success of drop oscillation models. A two-dimensional simulation by Lin and Peng [10] suggests a coupling between drop shape oscillations and airflow vortex shedding by the drop is the cause of drop shape unsteadiness.
Wind-forced drop experiments by Milne et al. [9] and Esposito et al. [11], both observed that drop oscillation frequencies do not depend on wind velocity but decrease with increasing drop volume as . Milne et al. also showed that mode shapes and natural frequencies of wind-forced drops are similar to those excited by other forcing modalities and specifically studied oscillations corresponding to an analysis by Chiba et al. [12]. Those authors analyzed hemispherical drops at zero Bond number with pinned contact lines and predicted nondimensional natural frequencies of for mode (1,1), 1.02 for mode (0,1), 1.12 for mode (2,1), and 1.72 for mode (1,2). (Chiba et al. give different numerical values than these because their nondimensional scheme is based on circular frequency and drop radius cubed.) The lowest-frequency mode (1,1) is a longitudinal downwind/upwind oscillation. Mode (0,1) is an axisymmetric vertical oscillation and mode is (2,1) a shape that alternates between elongation in the longitudinal and lateral directions. In the mode nomenclature, is the meridional mode number ( is axisymmetric) and is the azimuthal mode number. Milne et al. [9] explain that modes (0,1) and (2,1) would be difficult to distinguish using side-view images because their profile shape oscillations would appear similar and their frequencies are similar.
No studies have yet considered how drop unsteadiness may change near critical depinning conditions or drive the depinning event. Substantial drop-interface oscillations have been observed to precede critical conditions [8, 13, 14] but the character of the oscillations was not the object of those studies. The work by White and Schmucker [8] in a laminar boundary layer found that depinning always occured at values known to produce unsteady airflow vortex shedding [15]. Combined with the simulation results by Lin and Peng [10], this suggests a coupling between unsteady drop interface motion and vortex shedding may be a key feature of the depinning process.
Vortex shedding by solid surface protuberances has been extensively studied in the aerodynamics literature. A seminal experimental study of hemispheres and teardrop shapes in boundary layers is by Acarlar and Smith [15]. Teardrop shapes resemble wind-forced drops except have a different shape for the “receding” part of their perimeter than do wind-forced drops. (Compare Figure 7a of Ref. [8] to Figure 2b of Ref. [15].) Acarlar and Smith found teardrop-shaped protuberances with shed periodic airflow vortices. The shedding frequency, , is described by a Strouhal number that increases from about 0.15 to 0.3 across that range of . Shedding is less regular at higher values.
Whether vortex shedding frequencies may be altered when the protuberance is a liquid drop rather than a solid is not known. It could be that a coupling between drop oscillations and vortex shedding leads to combined aerodynamic and inertial forces that overcome the maximum surface-tension pinning force. What’s more, because those forces are highly unsteady, this may result in drop “shuffling” motion observed by Saal et al. [16] and others. With this in mind, the particular goal of this study is to make simultaneous measurements of drop interface motion and airflow unsteadiness at wind speeds approaching drop depinning conditions. Side-view drop images are recorded using a high-speed video camera. Airflow unsteadiness is measured using a hotwire anemometer located in the drop wake. The resulting data is intended to reveal whether a coupling phenomenon occurs between the wind vortices and drop oscillations that may trigger depinning.
2 Approach
Measurements were made of water drops on a roughened aluminum substrate in a small wind tunnel designed for studies of wind-driven drop depinning [8, 17]. The wind-tunnel test section is 250 mm long by 25 mm tall by 50 mm wide. The sides and top wall are transparent acrylic. Interchangeable aluminum surface samples are located flush with the test section floor. The design allows the flow to cross onto the substrate smoothly and allows top- and side-view cameras to image the surface without obstruction.
Laminar airflow in the test section is provided by several flow-quality treatments. The flow enters the tunnel through a 200-mm-wide inlet fairing; passes through a honeycomb flow straightener, two stainless-steel turbulence screens, and a 250-mm-long, 4:1 contraction before entering the test section. Downstream of the test section, a half-angle diffuser leads to a 80-mm-diameter fan. The small angle prevents diffuser separation that could lead to low-frequency unsteadiness. Wind-speed is automatically controlled using a feedback-controlled motor that maintains the desired test velocity.
The boundary-layer displacement thickness where drops are located varies as where Test speeds varied from 5.9 to 9.9 m/s so values varied from about 0.5 to 0.7 mm. Initial drop heights without wind forcing ranged from 2.6 to 3.2 mm. Thus, drops can be considered to exist in nearly uniform flow. Velocity fluctuations are approximately 0.5% of the test-section centerline velocity.
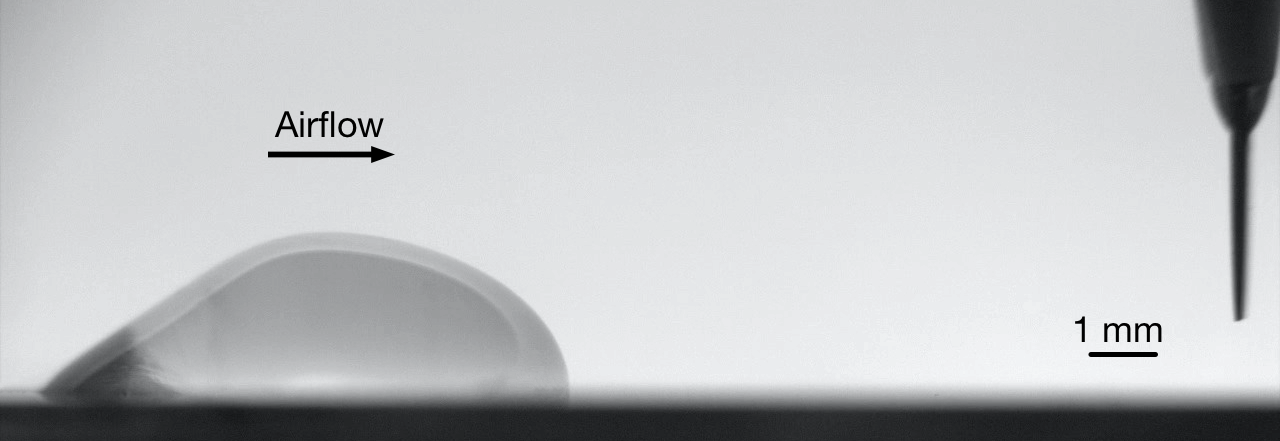
Side-view drop images are recorded using a Chronos 1.4 high-speed camera that recorded 2 seconds of video per test point at 500 frames/sec. The camera was mounted with its optical axis aligned with the level of the aluminum substrate. Figure 1 shows an example image obtained using this system. The hotwire anemometer used to measure airflow unsteadiness in the drop wake is visible downwind of the drop.
Milne et al. [9] developed a sophisticated approach for analyzing drop interface motions on a mode-by-mode basis. A simplified alternative method is used here. Of particular interest are the relative amplitudes of the three lowest-frequency modes (0,1), (1,1), and (2,1). The work by Chiba et al. [12] suggests that mode (1,1) is the lowest frequency and, from a side view, would manifest as a left/right motion of the drop interface. Modes (0,1) and (2,1) would occur at about twice the frequency of mode (1,1) and would appear as an up/down motion of the interface from a side view. Two separate regions of interest are evaluated in order to distinguish these motions. These are indicated by the red and blue shaded regions in Figure 2. Each region is defined as a rectangle that begins at the drop apex and extends to one half the vertical and horizontal distance to the advancing (red) or receding (blue) contact point in the side-view image. As the experiment proceeds, a new apex point is selected for each wind speed as the drop deforms under increasing forcing.
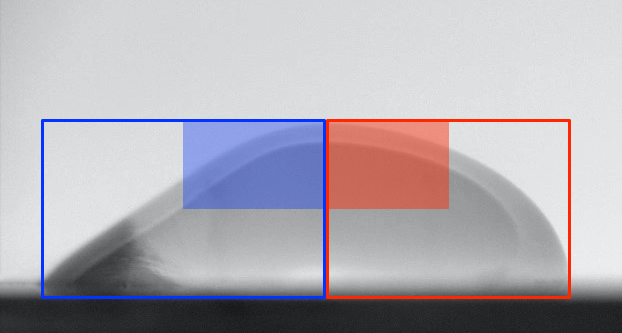
The mean grayscale pixel intensity in both regions of interest are calculated for each video frame. Because the drop appears darker than the background, both regions’ mean value would decrease (more dark) with upward vertical motion; the advancing region would decrease as the interface moves right; and the receding region would decrease as the interface moves left. With this arrangement, the sum of the red- and blue-region time signals would tend to indicate vertical motion while the difference would tend to indicate lateral motion. The signal amplitudes are simply proxies for interface motion and do not correspond to a physical mode amplitude. Nevertheless, the frequencies and relative signal amplitudes are intended to reveal how interface motion changes as wind speed increases.
Instantaneous wind velocities are measured simultaneously with video recordings using a constant-temperature hotwire anemometer sampled at 3000 Hz. The hotwire sensor is 1 mm long, is 5 m in diameter, and is oriented perpendicular to the plane of Figure 1. It is supported at the bottom of the thin, vertically oriented stainless-steel prongs visible in the figure.
The aluminum test surface was cleaned with acetone before each drop was applied. After it dried, a drop was carefully applied using a graduated syringe with 1 L resolution. At the start of the experiments the drops had near-circular contact lines. The experiments proceeded automatically with the control program slowly increasing wind speed until pre-determined velocities were achieved in the test section. Once a steady, on-condition wind speed was reached, hotwire and video recording was automatically triggered. Each drop experiment included multiple velocity set points depending on the anticipated depinning wind speed.
3 Results
Drop volumes from 100 to 250 were studied at wind speeds of 5.9, 7.9, and 9.9 m/s. Larger drops depinned at less than the maximum test wind speed: 125 and higher at less than 9.9 m/s and 200 and higher at less than 7.9 m/s. Without wind forcing these drops had maximum heights ranging from to 3.2 mm, corresponding to Bond numbers of to 1.4. The Bond number varies less than because when exceeds about 1.0, adding additional volume tends to increase the contact line diameter rather than drop height. (See Ref. [8] for additional details for this particular system.) values vary from 1020 to 1710 for mm across the three speeds and from 1020 to 1240 for 5.9 m/s wind across the volume range.
Example time signals of mean pixel intensities of a drop forced by 5.9 m/s wind are shown in Figure 3. The top plot corresponds to signals in the advancing and receding regions (see Figure 2) and the bottom plot includes the corresponding sum and difference signals. Numerical values are not given on the vertical axis because these are arbitrary pixel intensities that do not correspond to a physically meaningful value. Power-spectral densities (PSDs) of the same signals are shown in Figure 4.
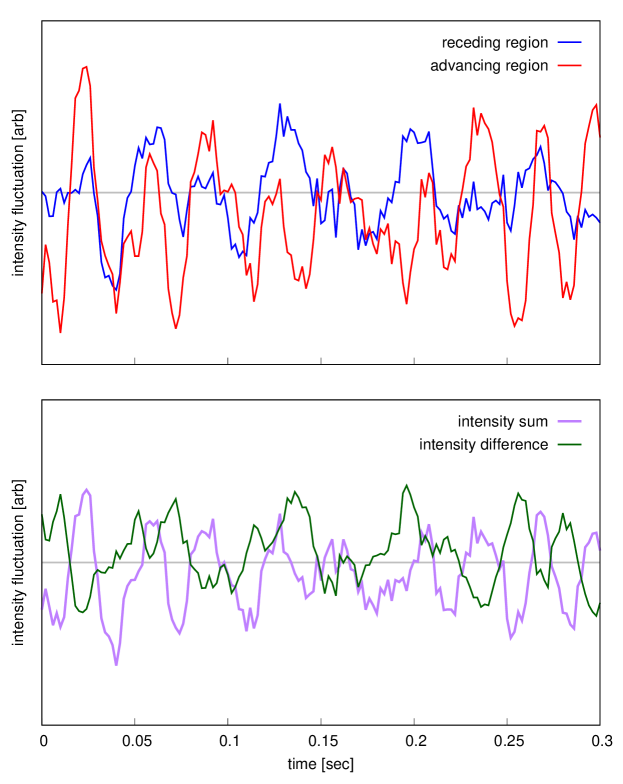
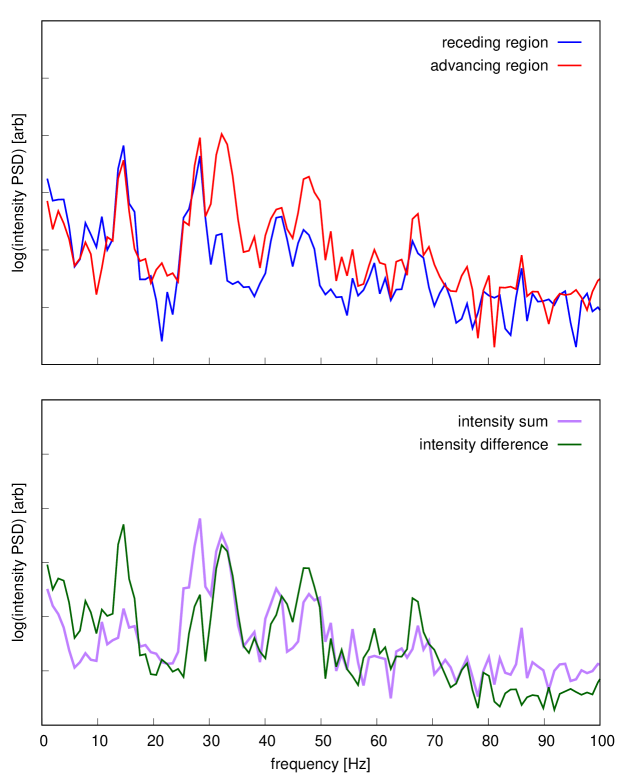
Figure 4 shows prominent peaks at 14.7, 28.3, 32.2, 42.0, 47.9, and 66.4 Hz that correspond to , 1.18, 1.34, 1.74, 1.99, and 2.76. The lowest of these frequencies correspond reasonably closely to the lowest values predicted by Chiba et al. [12] for hemispherical drops. Notably, the lowest frequency is significantly more pronounced in the subtracted signal as compared to the summed signal. This suggests the red and blue regions are fluctuating out of phase, exactly what would be expected for the lateral oscillations of mode (1,1) and this is the lowest-frequency mode predicted by Chiba et al. The next two higher frequency peaks appear as a double peak that is somewhat more pronounced in the summed signal. These appear to correspond to the closely spaced mode-(0,1) and mode-(2,1) fluctuations predicted by Chiba et al.
As wind speed increases the prominent frequencies of a particular drop do not change. Figure 5 shows the sum and difference PSDs for a drop at 5.9, 7.9, and 9.9 m/s wind speeds. Each peak occurs at a slightly higher frequency than the corresponding peaks in Figure 4 because the drop volume is less. The key peaks in the difference signal are at 15.6, 35.2, 47.9, and 52.7 Hz. An additional peak is observed in the sum signal at 31.7 Hz, especially at the lowest wind speed. The corresponding values are consistent with the drop values: , 1.18, 1.31, 1.78, and 1.96. The fluctuation amplitudes increase substantially as wind speed is increased. This is consistent with previous observations of increasing interface unsteadiness as wind-forcing increases [8, 13, 14]. Oscillations at 35.2 Hz increase somewhat more than other frequencies as critical conditions are approached. However, the relative amplitudes of the different spectrum peaks remain mostly unchanged with increasing wind speed. So, at least within the limitations of the current analysis technique, it does not appear as if a specific mode emerges to drive depinning.
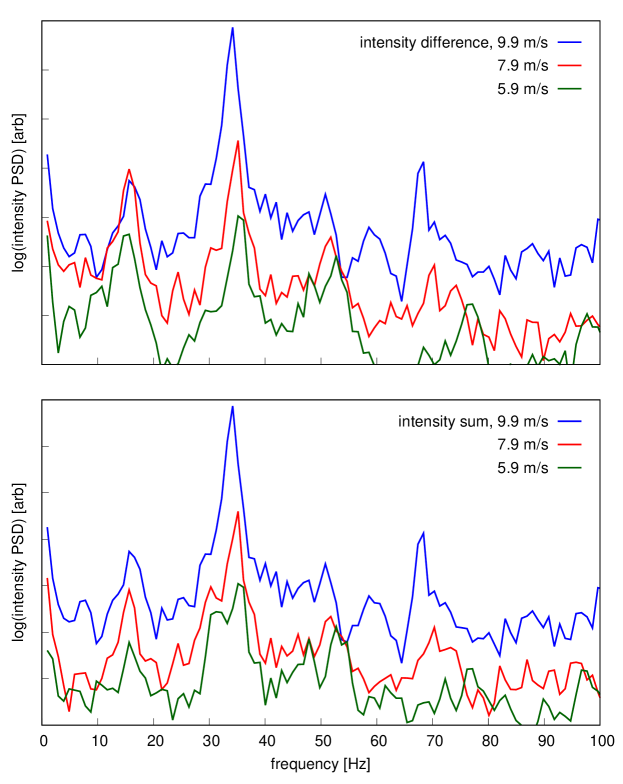
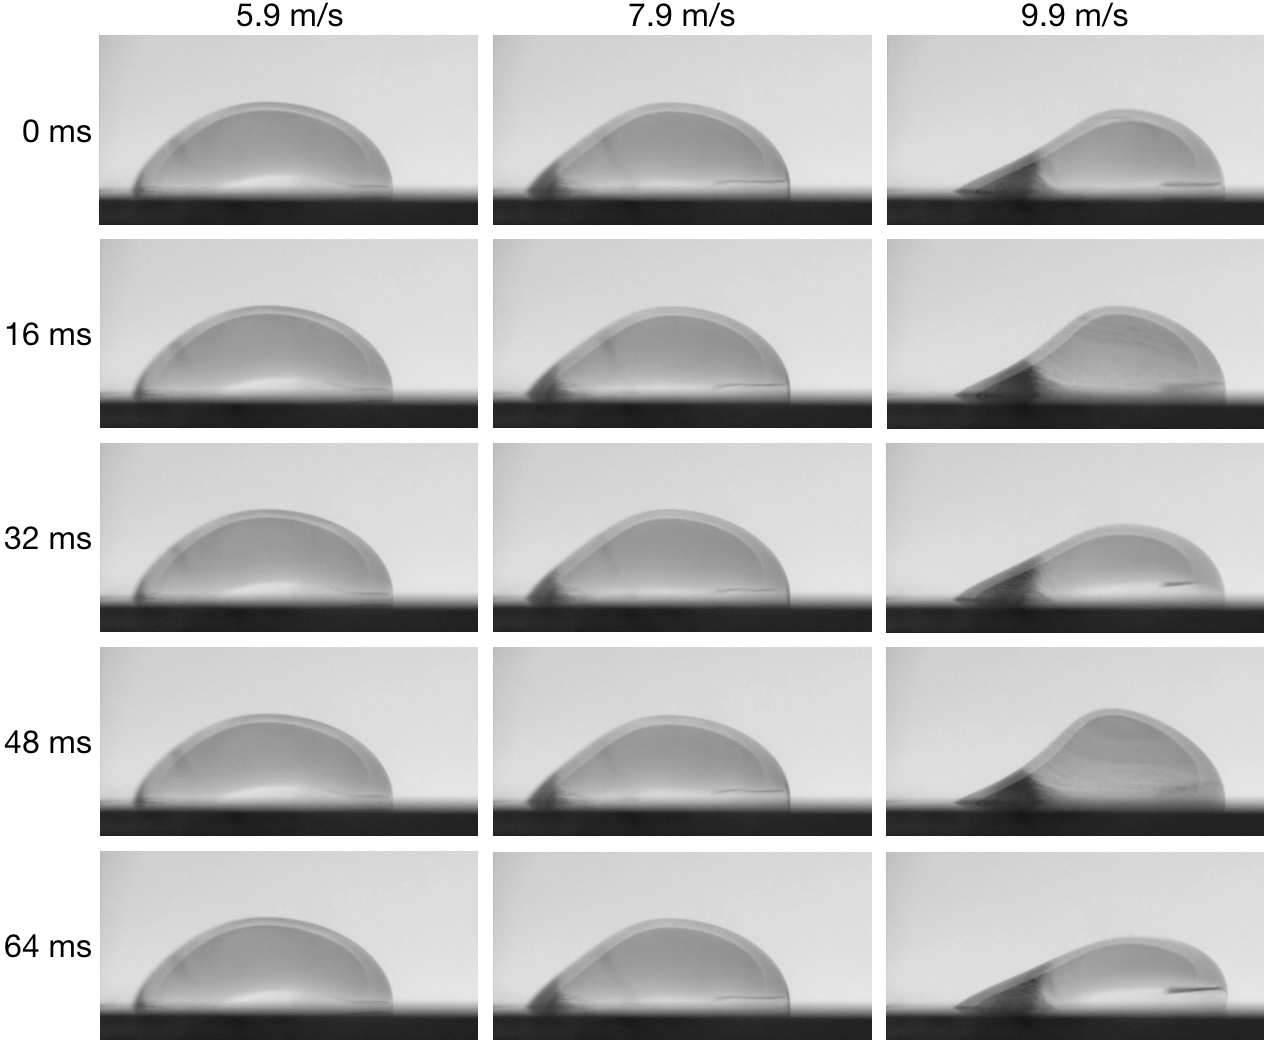
Side-view images of the 100 drop that produced the data in Figure 5 are given in Figure 6. Progressing from 5.9 to 9.9 m/s shows the increasing difference between advancing and receding contact angles as wind forcing increases. Almost no interface motion can be observed at lower speeds but oscillations are obvious at 9.9 m/s. The lowest-frequency oscillation is 15.6 Hz so undergoes one period in 64 ms. The next two frequencies are 31.7 Hz and 35.2 Hz that correspond to 32 ms and 28 ms periods, respectively. That is, the figure captures one period of the lowest frequency and approximately two periods of the next two frequencies. The vertical interface motion associated with the large-amplitude 35.2 Hz oscillation is depicted very clearly at 9.9 m/s in which the large upward displacement occurs at and 32 ms and lower heights occur at the opposite phase, , 32, and 64 ms. The left/right motion associated with the 15.6 Hz oscillation is not as clear but at 9.9 m/s can be observed by comparing the 32 and 64 ms images. The 64 ms image shows a shift to the right relative to the 32 ms image at essentially the same phase in the higher-frequency vertical motion.
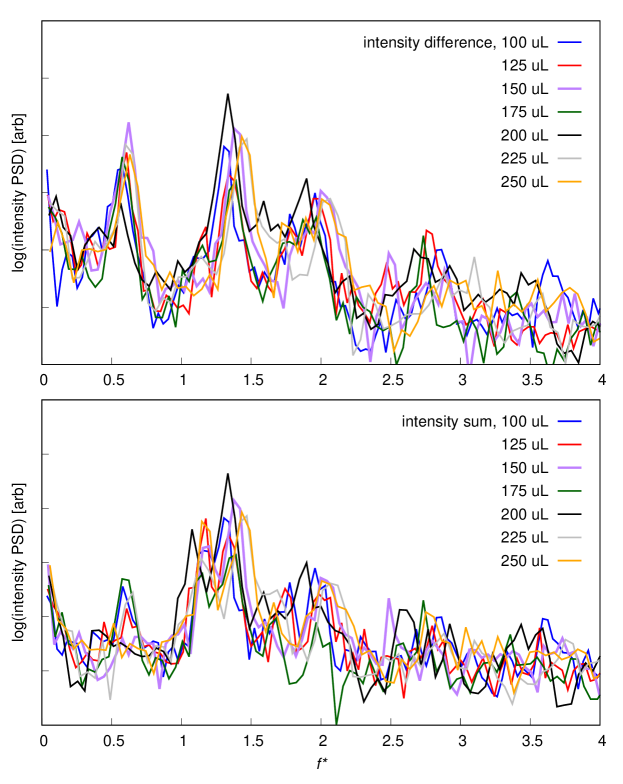
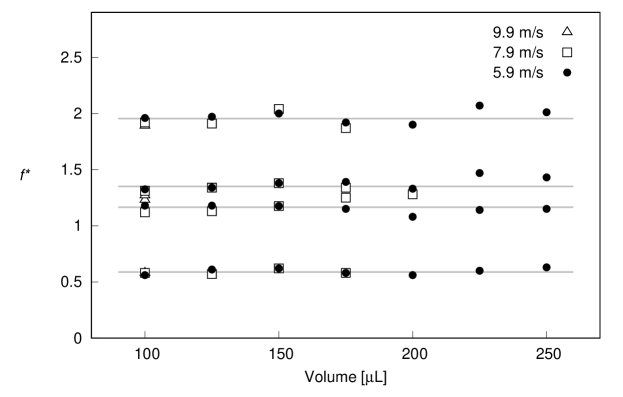
The success of the scaling in collapsing the drop oscillation response is evident in Figure 7 that shows the responses of drops from to at a wind speed of 5.9 m/s. The sum and difference intensity spectra are remarkably similar across these tests. Frequencies of the various peaks are plotted as a function of drop volume and wind speed in Figure 8. The lines in that figure indicate the mean values of each of the spectral peaks, , 1.17, 1.35, and 1.95. Not all peaks are clearly visible at all speeds and volumes and only peaks that could be clearly identified are shown. Across the different volumes and speeds, the values are quite consistent. Considering the difference in shape between the 100 and 250 drops and the difference in shape as the critical depinning wind speed is approached, this is a rather surprising result. The values measured here are somewhat higher than corresponding values predicted by Chiba et al. [12]: 0.51, 1.02, 1.12, and 1.72. The difference is likely because of the different initial drop shape in this experiment as compared to the hemispherical shape and zero Bond number analyzed by Chiba et al.
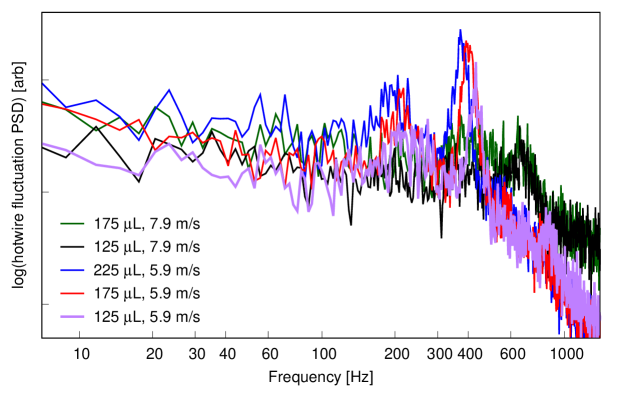
The key question of this work is whether coupling between airflow velocity fluctuations and drop interface fluctuations may drive drop depinning. Hotwire measurements of airflow fluctuations downstream of the drop show no evidence of such a mechanism. Figure 9 shows the power spectral density of wind velocity fluctuations measured by the hotwire about 15 mm downstream of the drop center and 1.2 mm above the surface. None of the frequencies associated with drop interface oscillations are observed to have elevated signal power that would indicate the airflow is affected by drop motion. Instead, the key features of Figure 9 are the large-amplitude peaks at 370, 400, and 430 Hz for the 225, 175, and 125 drops, respectively, for the 5.9 m/s wind speed. These correspond to vortex shedding, consistent with results by Acarlar and Smith [15] for solid protruberances with equivalent as the drops, 1100 to 1240. At 7.9 m/s the peaks are broader and range from about 600 to 800 Hz for both the 175 and 125 drops. These correspond to values from 0.23 to 0.29. The broader peaks at a higher Strouhal number are expected at the higher Reynolds numbers of these drops, 1470 and 1540. Varying the hotwire position would not change the measured frequencies but could influence signal magnitudes. However, because the fluctuation amplitudes are arbitrary, measurements at other downstream positions would not yield meaningfully different results.
4 Conclusions
This study seeks to determine whether coupling between unsteady aerodynamic forcing and unsteady drop interface shapes may contribute to drop depinning. Previous studies [8, 13, 14] have observed large-amplitude interface unsteadiness prior to depinning and depinning occurs at Reynolds numbers at which unsteady vortex shedding occurs [8, 15]. Thus, a coupling between airflow vortex shedding from the drop and drop-interface oscillations might occur and be a central aspect of drop depinning. A coupling of this type was reported by Lin and Peng [10] based on a two-dimensional simulation and that finding partly motivates the current study.
To investigate whether a coupling exists, side-view video images of wind-forced drops were made simultaneously with hotwire anemometer measurements of airflow fluctuations in drop wakes. The video images were analyzed using a simple spatial average of pixel intensities in regions on the advancing and receding sides of the drop. The two regions were selected to provide a qualitative assessment of in-phase and out-of-phase interface motion on the two sides of the drop.
The results show strong responses at frequencies close to those predicted for modes (1,1), (0,1), (2,1), and (1,2) by Chiba et al. [12] for hemispherical drops at zero Bond number. The nondimensional frequency at which these oscillations appear was unaffected by drop volume and wind speed across the range of values considered in the present experiment. Milne et al. [9] and Esposito et al. [11] observed the same behavior.
Similar to previous observations, drop interface motion was observed to increase dramatically as critical wind speed was approached. The general shape of power spectra representing interface motion did not change with wind speed. Hotwire measurements show no evidence of wind-velocity fluctuations at key drop oscillation frequencies. Instead, the fluctuations are exactly what is expected for solid protuberances [15]. It may be the case that vortex shedding frequencies are so much higher than drop interface frequencies that no possibility of coupling exists. That is, on the timescale of airflow vortex shedding, the drop appears as quasi-steady. In fact, measurements by Simon [18] show this exactly. Simon replaced a water-drop with an equal-volume solid hemisphere and observed equivalent airflow spectra in both cases.
In conclusion, although both large-amplitude drop interface motion and airflow vortex shedding precede drop depinning, these phenomena appear to be uncoupled. Thus, while modeling the unsteady dynamics of a three-dimensional drop near critical conditions will remain a challenging task, it appears as if a successful model will not need to include airflow unsteadiness. On the time scale of key drop oscillation frequencies, the airflow appears quasi-steady.
Acknowledgements
The authors wish to thank Sungyon Lee and Alireza Hooshanginejad for multiple fruitful conversations regarding this work. The authors also with to thank the U.S. National Science Foundation for support from grants CBET-1839103 and HRD-1810995.
References
- [1] G. Macdougall and C. Ockrent. Surface energy relations in liquid/solid systems I. The adhesion of liquids to solids and a new method of determining the surface tension of liquids. Proc. R. Soc. London, Ser. A, 180:151, 1942.
- [2] J. Bikerman. Sliding of drops from surfaces of different roughnesses. J. Colloid Sci., 5:349, 1950.
- [3] C. Furmidge. Studies at phase interfaces I. the sliding of liquid drops on solid surfaces and a theory for spray retention. J. Colloid Sci., 17:309, 1962.
- [4] E.B. Dussan V. On the ability of drops to stick to surfaces of solids. Part 3. The influences of the motion of the surrounding fluid on dislodging drops. J. Fluid Mechanics, 174:381–397, 1987.
- [5] P.A. Durbin. On the wind force needed to dislodge a drop adhered to a surface. J. Fluid Mech., 196:205–222, 1988.
- [6] A. Hooshanginejad and S. Lee. Droplet depinning in a wake. Phys. Rev. Fluids, 2:031601, 2017.
- [7] A. Milne and A. Amirfazli. Drop shedding by shear flow for hydrophilic to superhydrophobic surfaces. Langmuir, 25:14155, 2009.
- [8] E.B. White and J.A. Schmucker. Wind- and gravity-forced drop depinning. Phys. Rev. Fluids, 6:023601, 2021.
- [9] A. Milne, B. Defez, M. Cabrerizo-Vílchez, and A. Amirfazli. Understanding (sessile/constrained) bubble and drop oscillations. Adv. Colloid and Interface Sci., 203:22–36, 2014.
- [10] Z. Lin and X. Peng. Inner flow behavior in an oscillating liquid droplet. Heat Trans. Asian Res., 38:485–491, 2009.
- [11] A. Esposito, A. D. Montello, Y. G. Guezennec, and C. Pianese. Experimental investigation of water droplet–air flow interaction in a non-reacting PEM fuel cell channel. J. Power Sources, 195(9):2691–2699, 2010.
- [12] M. Chiba, S. Michiue, and I. Katayama. Free vibration of a spherical liquid drop attached to a conical base in zero gravity. J. Sound Vib., 331(8):1908–1925, 2012.
- [13] E.B. White and J.A. Schmucker. A runback criterion for water drops in a turbulent accelerated boundary layer. J. Fluid Eng., 130:302, 2008.
- [14] P. M. Seiler, M. Gloerfeld, I. V. Roisman, and C. Tropea. Aerodynamically driven motion of a wall-bounded drop on a smooth solid substrate. Phys. Rev. Fluids, 4:024001, 2019.
- [15] M. Acarlar and C. Smith. A study of hairpin vortices in a laminar boundary layer. J. Fluid Mech., 175:1–41, 1986.
- [16] A. Saal, P.M. Seiler, D. Rettenmaier, M. Ade, I.V. Roisman, R. Berger, H.J. Butt, and C. Tropea. Shuffling gait motion of an aerodynamically driven wall-bound drop. Phys. Rev. Fluids, 5(9):094006, 2020.
- [17] J.A. Schmucker. Experimental Investigation of Wind-Forced Drop Stability. PhD thesis, Texas A&M University, 2012.
- [18] R.L. Simon, Jr. Vortex shedding and interface oscillations of wind-forced liquid drops. Master’s thesis, Texas A&M University, 2021.