Predicting the spectrum of UGC 2885, Rubin’s Galaxy with machine learning.
Abstract
Wu & Peek (2020) predict SDSS-quality spectra based on Pan-STARRS broad-band grizy images using machine learning (ML). In this letter, we test their prediction for a unique object, UGC 2885 (“Rubin’s galaxy”), the largest and most massive, isolated disk galaxy in the local Universe ( Mpc). After obtaining the ML predicted spectrum, we compare it to all existing spectroscopic information that is comparable to an SDSS spectrum of the central region: two archival spectra, one extracted from the VIRUS-P observations of this galaxy, and a new, targeted MMT/Binospec observation. Agreement is qualitatively good, though the ML prediction prefers line ratios slightly more towards those of an active galactic nucleus (AGN), compared to archival and VIRUS-P observed values. The MMT/Binospec nuclear spectrum unequivocally shows strong emission lines except H, the ratios of which are consistent with AGN activity. The ML approach to galaxy spectra may be a viable way to identify AGN supplementing NIR colors. How such a massive disk galaxy ( M⊙), which uncharacteristically shows no sign of interaction or mergers, manages to fuel its central AGN remains to be investigated.
1 Introduction
In recent years, astronomical machine learning has transformed from a niche subject to a well-developed suite of accessible and interpretable algorithms. Machine learning algorithms are used for catalogs, time series, imaging, and unstructured data across a wide array of astronomy subdisciplines (e.g., exoplanets, Shallue & Vanderburg 2018; radio interferometry, Vafaei Sadr et al. 2020; transient photometry, Villar et al. 2020; and studies of the interstellar medium, Xu et al. 2020). For extragalactic imaging data, machine learning is regularly relied upon for classifying galaxy morphology (e.g., Dieleman et al., 2015; Beck et al., 2018), quantifying observed properties (e.g.; Smith et al., 2020), and predicting spectroscopic properties (e.g., Pasquet et al., 2019; Wu & Boada, 2019). These advances have enabled machine learning to take on an outsized role in mitigating the observational disparity between enormous survey imaging data sets and limited spectroscopic follow-up campaigns (e.g, Wu & Peek, 2020). While machine learning results are robust for estimating the properties of typical galaxies, it is less clear if predictions are reliable for rare or unusual systems.
Spectroscopy surveys lag behind imaging ones in coverage and depth simply because of the longer integration time per object (see Davies et al., 2018; Driver et al., 2019, for a discussion on ongoing and near-future surveys). Predicting spectra or spectral features based on imaging is therefore a worthwhile endeavour for both scientific and planning purposes.
UGC 2885 (“Rubin’s Galaxy”) is the largest and most massive spiral galaxy ( kpc, M⊙) in the local Universe (Rubin, 1980). It shows very regular rotation with a maximum rotation velocity of 298 km s-1 ( M⊙ Rubin et al., 1980; Roelfsema & Allen, 1985; Wiegert & English, 2014; McGaugh & Schombert, 2015), rising from the center, indicating a substantial and extended dark matter halo (Marr, 2015). The galaxy has star-formation throughout its disk (Hunter et al., 2013), four spiral arms, and a specific incidence of globular clusters that hints at an uneventful accretion history (Holwerda et al in prep.). It lies just outside the Sloan Digital Sky Survey’s footprint and has no SDSS or DES spectra.
UGC 2885 defies easy classification: to the first order it is an Sc galaxy but it is at the outermost edge of the mass and size envelope for its class. The initial identification of UGC 2885 as the largest isolated spiral galaxy by Rubin (1980) was confirmed by Romanishin (1983) for the whole Uppsala Galaxy Catalog. We measure the Petrosian radius of Rubin’s galaxy at 38.1 kpc (97)̈ in sdss-r. Ogle et al. (2016, 2019) introduce “Super spirals,” a class of massive disk galaxies at the utmost top of the stellar mass-star formation rate (-SFR) relation. Ogle et al. (2015) note that “Super spirals” are almost never in an isolated environment and often show signs of a recent interaction, e.g. perturbed morphology, dual nuclei, or other signs of significant merger activity. Rubin’s galaxy does not meet these qualifications as it has a lower SFR and does not show signs of recent interaction, which appear to be typical for this class of galaxies. Saburova et al. (2020) discusses giant low surface brightness (LSB) disk galaxies. Once again, UGC 2885 does not meet those specifications either: its star-formation is too high and concentrated in a more typical brightness disk. These giant LSB galaxies also often seem to be visibly disturbed from recent accretion or merger activity. Yet Rubin’s galaxy is remarkably unperturbed.
A stellar mass galaxy typically has an active galactic nucleus and our question for this letter is: is Rubin’s galaxy exceptional here as well? Keel (1983a) remains the only study to attempt to characterize the nucleus of this galaxy and does not reach a firm conclusion. Does UGC 2885 show signs of an active nucleus? One would expect its spectrum to lie in the categories of LINER or star-formation/AGN mix. Can this be predicted from broad-band photometry using machine learning? How good is the ML prediction of this galaxy’s spectrum? As a local extreme of size and mass, the lack of a SDSS spectrum offered the opportunity for a direct test of this prediction.
The purpose of this paper is to report a “closed envelope” test of the ML predicted spectrum for the center of Rubin’s galaxy from Wu & Peek (2020) and compare it to spectra obtained from private archives and recent observations: the prediction was made first and then compared to spectra of comparable quality.
2 Machine Learning Prediction of Rubin’s Galaxy’s Spectrum
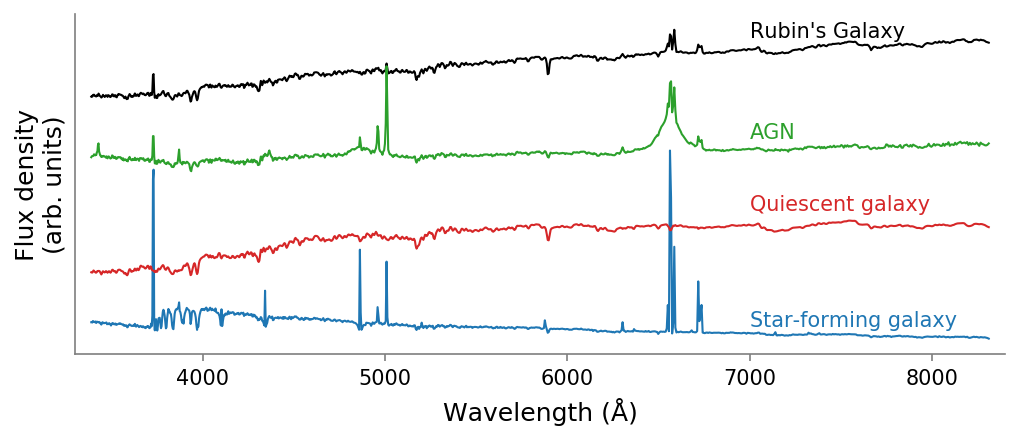
We generate the predicted spectrum for Rubin’s Galaxy using the method described in Wu & Peek (2020). Briefly, the method uses a convolutional neural network (CNN), trained on image cutouts of galaxies from the Pan-STARRS Steradian Survey DR2, and predicts the galaxies’ optical spectra (3 aperture, SDSS resolution and s/n). Galaxy spectra are normalized, shifted to a common reference frame, and rebinned in 1000 logarithmically spaced elements. A variational autoencoder (VAE) represents each spectrum using six latent variables, which can be robustly “decoded” back into SDSS spectra (Portillo et al., 2020). Wu & Peek (2020) train a CNN to predict galaxies’ SDSS spectra solely using image cutouts. Figure 1 shows the results of this ML approach applied to the Pan-STARRS image of Rubin’s galaxy. In the comparisons this spectrum is shifted to the galaxy redshift of km s-1 (Canzian et al., 1993).
3 Data
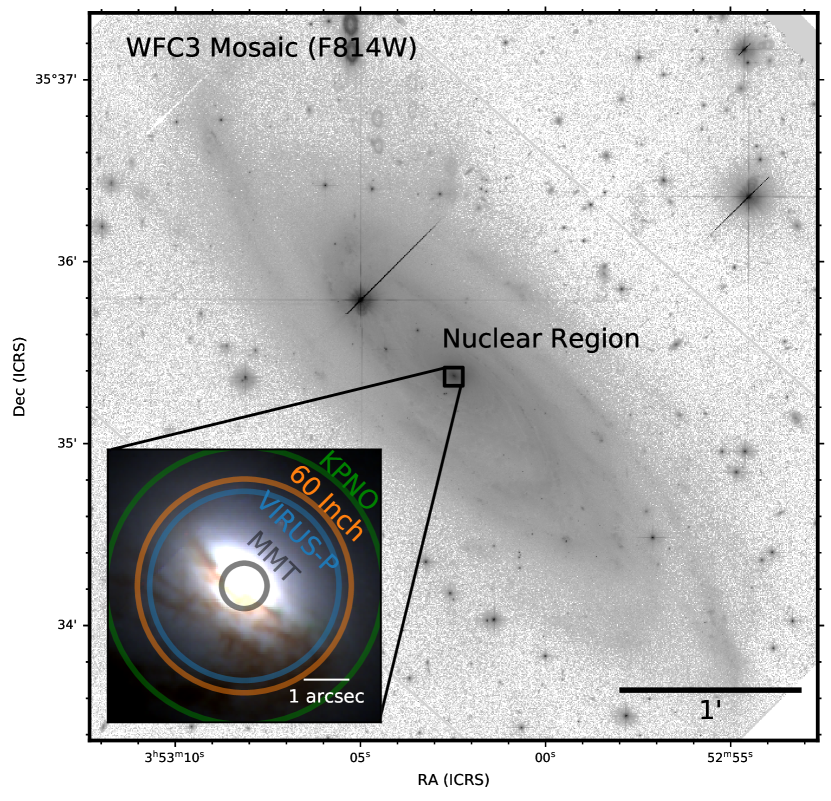
To verify the ML prediction, we obtained two archival spectra, extracted one from the VIRUS-P IFU observation, and obtained new MMT/Binospec observations. The apertures used in each observations is shown in Figure 2.
The first comparison spectrum is originally from Keel (1983a, b), who conducted an aperture spectroscopic survey of nearby galaxies to search for AGN activity. Keel (1983a) reported line strengths for H, [Nii] and [Sii]. Their verdict on nuclear activity was inconclusive.
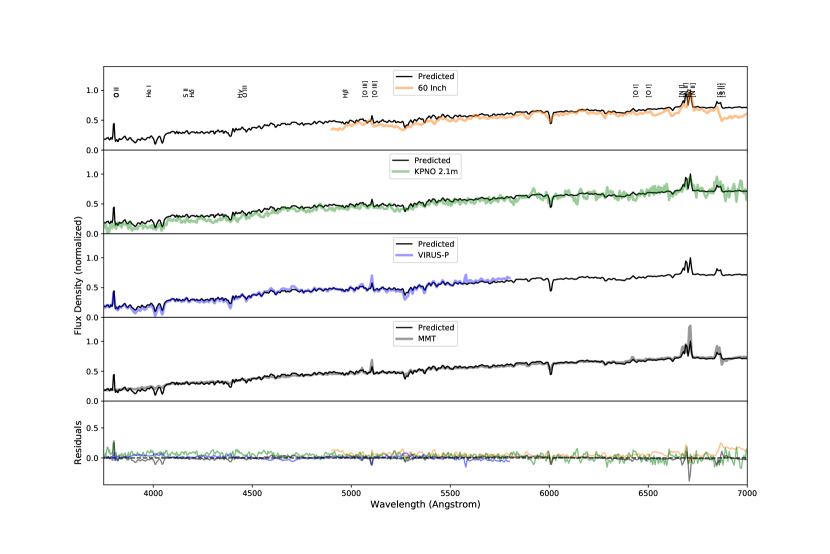
Archival data is a scan of a 4.7 diameter circular aperture spectrum from the Mount Lemmon 1.5 m (60 inch) telescope taken on 4/5 February 1981, shown in the top panel in Figure 3, and a 6.1 circular aperture spectrum taken using the Intensified Image Dissector Scanner on the KPNO 2.1 m, shown in the second panel in Figure 3. The archival spectra are normalized by the maximum value in the spectrum for ease of comparison to the ML spectrum. The 60 Inch spectrum closely resembles an SDSS spectrum in aperture and signal to noise but is limited in wavelength coverage. The KPNO spectrum has a similar wavelength coverage but much lower signal-to-noise and a wider aperture compared to SDSS spectra.
Recent VIRUS-P IFU observations of Rubin’s galaxy seek to reveal star-formation and abundances (Young et al. in prep). A blue spectrum ( 5800 Å) was extracted using a 4.16 aperture to compare with the ML prediction, shown in Figure 3, third panel.
A targeted s optical spectrum was obtained at the MMT Observatory with the instrument Binospec (Fabricant et al., 2019) in November 2020 with a position angle = 35∘ using the 270 lines/mm grating with a central wavelength of 6500 Å. The observations were taken at RA=3:53:02.4811, DEC=+35:35:22.103 with a 1″slit. Data reduction was completed by the Binospec automated pipeline, which is an open-source IDL software package distributed under the GPLv3 license (Chilingarian et al., 2019, https://bitbucket.org/chil_sai/binospec). This standard reduction resulted in the spectrum in Figure 3, fourth panel.
Both the VIRUS-P and the MMT/Binospec spectra have been renormalized using the maximum value in each spectrum’s bandpass (VIRUS-P Å, MMT Å). This leaves a gradual difference in continuum between normalized ML and either spectrum. Subsequently, we modeled this continuum difference between the ML prediction and the observed spectrum as a third degree polynomial to remove bandwidth-wide effects. We subtracted this continuum difference to facilitate a direct comparison between spectra and their features in Figure 3.
4 Discussion
4.1 How well did ML perform?
Figure 3 shows excellent agreement between the ML predicted spectrum and the observations. Discrepancies in the stellar continuum are easily attributed to night sky lines (present in the 60 inch spectrum Å but not preserved in the SDSS vectorization). In the residual, one can identify a slight gradient in the KPNO spectrum’s continuum (5000 Å), which is a similar calibration difference. Discrepancies in H/[Nii] and [Oiii] line strengths are notable in Figure 3.
The 60 inch and VIRUS-P spectra have closely comparable but not identical apertures to SDSS (″ and 3″ diameters respectively, Figure 2), and a slight offset is to be expected. Both archival spectra (Figure 3, top two panels) show excellent agreement with the ML predicted spectrum within their respective noise levels. The major differences are telluric features (e.g. Å in the 60 inch spectrum in Figure 3), not included in the original ML prediction (telluric features are a source of noise in the training set, and are therefore left out as much as practical).
The VIRUS-P spectrum broadly agrees well with the ML prediction. The only deviations are the [Oiii] emission line and the Hei absorption, which are both slightly under-predicted by the ML method (Figure 3, third panel). About a third of the equivalent width in the [Oiii] emission and the Hei absorption is missing (Figure 3, bottom panel).
The MMT/Binospec spectrum (Figure 3, fourth panel) focuses on the very central region of Rubin’s galaxy. The [Oiii] and H/[Nii] emission line strengths, as well as the [Sii] absorption features at 4000 Å, do appear to be under-predicted by the ML in comparison to the MMT spectrum.
There are two factors resulting in differences between the ML predicted spectra and those observed: the aperture of the observed spectra and the aperture-distance effects in the SDSS training sample.
Figure 2 illustrates that the archival spectra and VIRUS-P are for a slightly larger aperture and the MMT one for a smaller aperture than an SDSS spectrum on this galaxy would have been. Stronger H and [Oiii] from the nucleus can be explained by less dilution of the AGN signal. This can be seen as the progression of stronger observed emission lines in Figure 3 with smaller apertures.
Secondly, the ML algorithm was trained on SDSS with a known aperture-distance effect (dilution of AGN signal in more distant galaxies), matching the spectra of more distant galaxies to Rubin’s Galaxy’s nucleus with a wider aperture diluting the AGN signal.
4.2 AGN?
Identifying lower-power AGN can be difficult because selection effects are the most notable at the lower luminosities. Traditionally, one would select obscured or low-power AGN from IR colors rather than x-ray or emission lines in spectra. The ML approach offers an alternative, with Rubin’s Galaxy an instructive example of one that could be identified using imaging alone.
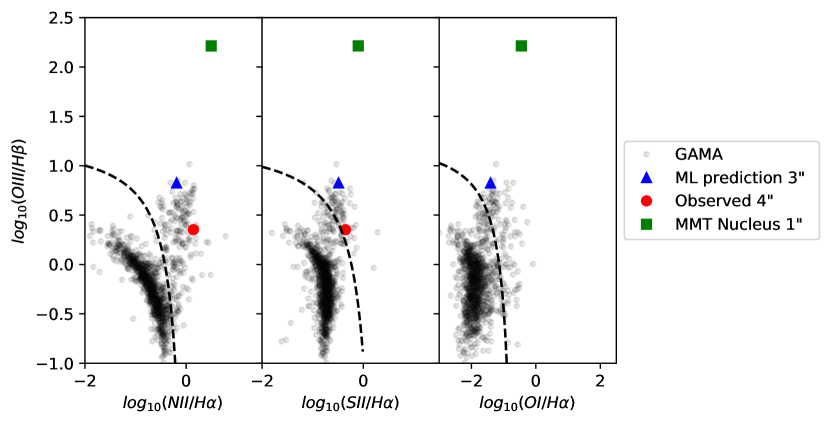
Figure 4 shows where the observed and the ML predicted line strengths place the nucleus of Rubin’s galaxy on the BPT diagram (Baldwin et al., 1981). The line strengths implied by the ML predicted spectrum imply strongly that Rubin’s galaxy is an AGN (blue triangle in Figure 4).
A combination of Keel (1983a) and VIRUS-P line strengths are more consistent with a lower-power AGN, closer to the dividing line between active galaxies and star-forming galaxies (red circle in Figure 4). The MMT/Binospec line strengths put the nucleus of Rubin’s galaxy solidly in the AGN category (green square in Figure 4). The MMT spectrum does not constrain the H well and this skews the Oiii/H ratio. The observed or predicted line ratios are not consistent with those of either a LINER or Seyfert according to the Kewley et al. (2006) criteria.
Figure 5 shows the WISE colors of the central region of Rubin’s galaxy for comparison with the classifications of Jarrett et al. (2011) and Cluver et al. (2014). The WISE colors are consistent with those of spiral, star-forming disk galaxies. The source catalog entry corresponding to the center of Rubin’s Galaxy is in the part of color-space where star-forming galaxies border on obscured AGN and Seyfert galaxies, according to Figure 5 in Cluver et al. (2014). However the WISE color criterion from Assef et al. (2015, 2018) does not place Rubin’s galaxy in the AGN bracket (dashed lines in Figure 5). Given the angular resolution of WISE, dilution of the AGN signal by the PSF likely accounts for this lack of AGN identification i.e. the WISE flux is dominated by the stellar population of Rubin’s galaxy. Based on the spectroscopic line strengths, the center of Rubin’s galaxy is indeed an AGN. WISE colors have the benefit of suffering less from dust obscuration allowing for unbiased searches of AGN in the nearby Universe. However, the WISE color section still misses AGN such as these and the ML approach may be a way to fill in the missing population.
4.3 Discussion
It is exciting to see that the ML prediction of an SDSS quality spectrum of this galaxy is so reliable, even when this galaxy resides in the space between star-forming and AGN. The ML method outperforms WISE color selection, the preferred method of identifying AGN in objects without a spectrum. A successful ML prediction in the loci of galaxy populations is reassuring but a tangible success for an extreme object is especially encouraging. How the ML algorithm transfers from e.g. Pan-STARRS broad-band grizy images to the Rubin Observatory’s LSST looks to be promising example of transfer learning in astronomy.
The combined line strengths of Rubin’s Galaxy point to ongoing AGN activity. Combined with the very extended star-forming disk, the presence of an AGN makes this galaxy an interesting case: a massive disk galaxy, with no signs of interaction, relatively normal star-formation activity, and very regular rotation, yet using secular mechanisms only to fuel its central source.
5 Conclusions
The ML predicted SDSS-quality spectrum from Wu & Peek (2020) is remarkably close to the observed spectra (Figure 3). Deviations can be attributed to small differences in aperture or to residuals from telluric lines. The emission lines in the ML prediction are under-predicting the [Oiii] and H and [Nii] doublet compared to [Oii]. The successful identification of this galaxy’s spectrum is a promising development in the use of ML. It is an encouraging development for future use on the Rubin Observatory data.
In order to supply gas to the central black hole, the gas must lose angular momentum, and astronomers have long suspected that galaxy collisions (or at least interactions) provide the requisite torque to bring that gas into the nucleus (e.g. Hong et al., 2015; Dietrich et al., 2018; Gao et al., 2020; Marian et al., 2020). However, interactions are not the only avenue for fueling the AGN (e.g. McKernan et al., 2010; Marian et al., 2019). Rubin’s galaxy is an example of an extremely isolated, undisturbed, and massive galaxy which shows clear evidence of nuclear activity, it may prove a useful laboratory to study the secular fueling processes on a grand scale. Further dissection of the inner regions of the galaxy may shed light on the secular mechanisms that supply fuel to AGN.
Acknowledgements
The authors would like to thank the anonymous referee for their effort and time improving the manuscript. Observations reported here were obtained at the MMT Observatory, a joint facility of the University of Arizona and the Smithsonian Institution. Support for this work was provided by NASA through grant number GO-15107 from the Space Telescope Science Institute, which is operated by AURA, Inc., under NASA contract NAS 5-26555.
References
- Assef et al. (2018) Assef, R. J., Stern, D., Noirot, G., et al. 2018, ApJS, 234, 23
- Assef et al. (2015) Assef, R. J., Walton, D. J., Brightman, M., et al. 2015, ArXiv e-prints
- Astropy Collaboration et al. (2013) Astropy Collaboration, Robitaille, T. P., Tollerud, E. J., et al. 2013, A&A, 558, A33
- Baldwin et al. (1981) Baldwin, J. A., Phillips, M. M., & Terlevich, R. 1981, PASP, 93, 5
- Beck et al. (2018) Beck, M. R., Scarlata, C., Fortson, L. F., et al. 2018, MNRAS, 476, 5516
- Canzian et al. (1993) Canzian, B., Allen, R. J., & Tilanus, R. P. J. 1993, ApJ, 406, 457
- Chilingarian et al. (2019) Chilingarian, I., Moran, S., Paegert, M., et al. 2019, in Astronomical Society of the Pacific Conference Series, Vol. 523, Astronomical Data Analysis Software and Systems XXVII, ed. P. J. Teuben, M. W. Pound, B. A. Thomas, & E. M. Warner, 629
- Cluver et al. (2014) Cluver, M. E., Jarrett, T. H., Hopkins, A. M., et al. 2014, ApJ, 782, 90
- Davies et al. (2018) Davies, L. J. M., Robotham, A. S. G., Driver, S. P., et al. 2018, MNRAS
- Dieleman et al. (2015) Dieleman, S., Willett, K. W., & Dambre, J. 2015, MNRAS, 450, 1441
- Dietrich et al. (2018) Dietrich, J., Weiner, A. S., Ashby, M. L. N., et al. 2018, MNRAS, 480, 3562
- Driver et al. (2019) Driver, S. P., Liske, J., Davies, L. J. M., et al. 2019, The Messenger, 175, 46
- Fabricant et al. (2019) Fabricant, D., Fata, R., Epps, H., et al. 2019, PASP, 131, 075004
- Gao et al. (2020) Gao, F., Wang, L., Pearson, W. J., et al. 2020, A&A, 637, A94
- Hong et al. (2015) Hong, J., Im, M., Kim, M., & Ho, L. C. 2015, ApJ, 804, 34
- Hunter et al. (2013) Hunter, D. A., Elmegreen, B. G., Rubin, V. C., et al. 2013, AJ, 146, 92
- Jarrett et al. (2011) Jarrett, T. H., Cohen, M., Masci, F., et al. 2011, ApJ, 735, 112
- Kauffmann et al. (2003) Kauffmann, G., Heckman, T. M., White, S. D. M., et al. 2003, MNRAS, 341, 33
- Keel (1983a) Keel, W. C. 1983a, ApJ, 269, 466
- Keel (1983b) —. 1983b, ApJS, 52, 229
- Kewley et al. (2006) Kewley, L. J., Groves, B., Kauffmann, G., & Heckman, T. 2006, MNRAS, 372, 961
- Marian et al. (2019) Marian, V., Jahnke, K., Mechtley, M., et al. 2019, ApJ, 882, 141
- Marian et al. (2020) Marian, V., Jahnke, K., Andika, I., et al. 2020, ApJ, 904, 79
- Marr (2015) Marr, J. H. 2015, MNRAS, 453, 2214
- McGaugh & Schombert (2015) McGaugh, S. S., & Schombert, J. M. 2015, ApJ, 802, 18
- McKernan et al. (2010) McKernan, B., Ford, K. E. S., & Reynolds, C. S. 2010, MNRAS, 407, 2399
- Ogle et al. (2019) Ogle, P. M., Lanz, L., Appleton, P. N., Helou, G., & Mazzarella, J. 2019, ApJS, 243, 14
- Ogle et al. (2015) Ogle, P. M., Lanz, L., Nader, C., & Helou, G. 2015, ArXiv e-prints
- Ogle et al. (2016) —. 2016, ApJ, 817, 109
- Pasquet et al. (2019) Pasquet, J., Bertin, E., Treyer, M., Arnouts, S., & Fouchez, D. 2019, A&A, 621, A26
- Portillo et al. (2020) Portillo, S. K. N., Parejko, J. K., Vergara, J. R., & Connolly, A. J. 2020, AJ, 160, 45
- Roelfsema & Allen (1985) Roelfsema, P. R., & Allen, R. J. 1985, A&A, 146, 213
- Romanishin (1983) Romanishin, W. 1983, MNRAS, 204, 909
- Rubin (1980) Rubin, V. C. 1980, Mercury, 9, 78
- Rubin et al. (1980) Rubin, V. C., Ford, Jr., W. K., & Thonnard, N. 1980, ApJ, 238, 471
- Saburova et al. (2020) Saburova, A., Chilingarian, I., Kasparova, A., et al. 2020, arXiv e-prints, arXiv:2011.01238
- Shallue & Vanderburg (2018) Shallue, C. J., & Vanderburg, A. 2018, AJ, 155, 94
- Smith et al. (2020) Smith, M. J., Arora, N., Stone, C., Courteau, S., & Geach, J. E. 2020, arXiv e-prints, arXiv:2010.00622
- Vafaei Sadr et al. (2020) Vafaei Sadr, A., Bassett, B. A., Oozeer, N., Fantaye, Y., & Finlay, C. 2020, MNRAS, 499, 379
- Villar et al. (2020) Villar, V. A., Hosseinzadeh, G., Berger, E., et al. 2020, ApJ, 905, 94
- Wiegert & English (2014) Wiegert, T., & English, J. 2014, New A, 26, 40
- Wu & Boada (2019) Wu, J. F., & Boada, S. 2019, MNRAS, 484, 4683
- Wu & Peek (2020) Wu, J. F., & Peek, J. E. G. 2020, arXiv e-prints, arXiv:2009.12318
- Xu et al. (2020) Xu, D., Offner, S. S. R., Gutermuth, R., & Oort, C. V. 2020, ApJ, 890, 64