Automating Visual Blockage Classification of Culverts with Deep Learning
Abstract.
Blockage of culverts by transported debris materials is reported as main contributor in originating urban flash floods. Conventional modelling approaches had no success in addressing the problem largely because of unavailability of peak floods hydraulic data and highly non-linear behaviour of debris at culvert. This article explores a new dimension to investigate the issue by proposing the use of Intelligent Video Analytic (IVA) algorithms for extracting blockage related information. Potential of using existing Convolutional Neural Network (CNN) algorithms (i.e., DarkNet53, DenseNet121, InceptionResNetV2, InceptionV3, MobileNet, ResNet50, VGG16, EfficientNetB3, NASNet) is investigated over a custom collected blockage dataset (i.e., Images of Culvert Openings and Blockage (ICOB)) to predict the blockage in a given image. Models were evaluated based on their performance on test dataset (i.e., accuracy, loss, precision, recall, F1-score, Jaccard-Index), Floating Point Operations Per Second (FLOPs) and response times to process a single test instance. From the results, NASNet was reported most efficient in classifying the blockage with the accuracy of 85%; however, EfficientNetB3 was recommended for the hardware implementation because of its improved response time with accuracy comparable to NASNet (i.e., 83%). False Negative (FN) instances, False Positive (FP) instances and CNN layers activation suggested that background noise and oversimplified labelling criteria were two contributing factors in degraded performance of existing CNN algorithms.
1. Introduction
Cross-drainage structures (e.g., culverts, bridges) are prone to blockage by debris and reported as one of the main causes of flash floods in urban areas (French and Jones, 2015; French et al., 2012; Blanc, 2013; Weeks et al., 2013; Roso et al., 2004; Wallerstein et al., 1996; Iqbal et al., 2021). The 1998 and 2011 floods in Wollongong, Australia (French and Jones, 2015; Barthelmess and Rigby, 2011; Rigby and Silveri, 2002; Van Drie et al., 2001; Davis, 2001) and the 2007 flood in Newcastle, Australia (French and Jones, 2015; WBM, 2008) are classical examples where blockage of cross drainage hydraulic structures caused the flash flooding. Project 11: Blockage of Hydraulic Structures (Weeks et al., 2013) was initiated under the Australian Rainfall and Runoff (ARR) (Ball et al., 2016) framework to study the blockage behaviour and design considerations of hydraulic structures. Under this project, Wollongong City Council (WCC) proposed the guidelines to consider the hydraulic blockage in the hydraulic structures design process (Weeks et al., 2013; French and Jones, 2018; Rigby and Silveri, 2001; Ollett et al., 2017; Jones et al., 2016; French et al., 2012). However, because of the unavailability of relevant supporting data from peak flooding events, proposed guidelines were not adaptive and were based on the post flood visual assessments, which many researchers believe is not the correct representation of blockage during the peak flooding events (French and Jones, 2015; French et al., 2012; French and Jones, 2018). The guidelines suggested that any culvert with an opening diagonal of 6m or more is not prone to blockage. However, this claim was only supported by post flood visual assessments and was not considered economically efficient to implement.
Initially, blockage was defined as the percentage occlusion of hydraulic structure opening, however, many argued that hydraulic blockage and visual blockage are two separate concepts. Hydraulic blockage is more complex and has no established relationship with visual blockage. Hydraulic blockage is associated with the interaction of debris with culvert and corresponding effect on fluid dynamics around culvert, however, due to highly non-linear and uncertain behaviour of debris, it is difficult to model and predict the hydraulic blockage using conventional means. From management and maintenance perspective, making use of multi-dimensional information (i.e., visual blockage status, type of debris material, percentage of blocked openings) extracted using computer vision algorithms may prove helpful in making timely decisions as suggested in literature (Iqbal et al., 2021; Arshad et al., 2019). This paper attempts to address the problem from a different perspective and proposes the use of visual information extracted using automated analysis in better management of blockage at cross drainage hydraulic structures.
This paper investigated the potential of CNN algorithms towards classifying culvert images as “clear” or “blocked”. Existing CNN models (i.e., DarkNet53 (Redmon and Farhadi, 2018), DenseNet121 (Huang et al., 2017), InceptionResNetV2 (Szegedy et al., 2016a), InceptionV3 (Szegedy et al., 2016b), MobileNet (Howard et al., 2017), ResNet50 (He et al., 2016), VGG16 (Simonyan and Zisserman, 2014), EfficientNetB3 (Tan and Le, 2019), NASNet (Zoph et al., 2018)) pre-trained over ImageNet were transfer-learned for the culvert blockage classification task and performance was compared based on the standard evaluation measures.
2. ICOB Dataset
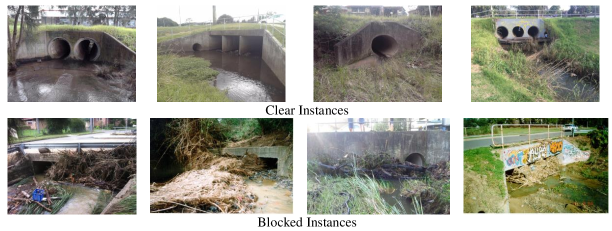
The dataset used for this investigation is referred as “Images of Culvert Openings and Blockage (ICOB)” and consisted of real culverts images collected before and after the flooding events. Main sources of images included WCC historical records, online records and custom captured local culvert images. WCC records were scrutinized using a Microsoft ACCESS based application for filtering the culvert images with visible openings. Final dataset included 929 images of culverts including both blocked and clear. Dataset contained images with high level of variation from each other (intra-class variation) in terms of culvert types, blockage accumulation, presence of debris materials, illumination conditions, culvert view point variations, scale variations, resolution, and backgrounds. This high level of diversity within a relatively small dataset makes it a challenging dataset for visual analytic, even for a binary classification problem.
ICOB dataset was manually labelled for binary classification of a given image with culvert as “clear” or “blocked”. A culvert being visually blocked or clear is not as simple and may require defining a detailed criteria in collaboration with flood management officers; however, for this article, simple occlusion based criteria was used. Following subjective annotation criteria was used for labelling ICOB.
-
•
If all of the culvert openings are visible, classify it as “clear”.
-
•
If any of the culvert opening is visually occluded by debris material or foreground object (e.g., debris control structure, vegetation, tree), classify it as “blocked”.
In total, there were 487 images in “clear” class and 442 images in “blocked ” class. Figure 1 shows the sample instances from each class of ICOB.
| Test Accuracy | Test Loss | Precision Score | Recall Score | F1 Score | Jaccard-Index | FLOPs | |
|---|---|---|---|---|---|---|---|
| DarkNet53 | 0.71 | 1.22 | 0.72 | 0.71 | 0.71 | 0.55 | 14.2 G |
| DenseNet121 | 0.79 | 0.48 | 0.79 | 0.79 | 0.79 | 0.65 | 5.7 G |
| InceptionResNetV2 | 0.83 | 0.46 | 0.84 | 0.83 | 0.83 | 0.71 | 13.3 G |
| InceptionV3 | 0.81 | 0.50 | 0.81 | 0.81 | 0.81 | 0.68 | 5.69 G |
| MobileNet | 0.79 | 0.50 | 0.80 | 0.80 | 0.79 | 0.66 | 1.15 G |
| ResNet50 | 0.80 | 0.52 | 0.81 | 0.81 | 0.80 | 0.67 | 7.75 G |
| VGG16 | 0.75 | 0.56 | 0.75 | 0.75 | 0.75 | 0.59 | 30.7 G |
| EfficientNetB3 | 0.83 | 0.45 | 0.83 | 0.83 | 0.83 | 0.7 | 1.97 G |
| NASNetLarge | 0.85 | 0.54 | 0.86 | 0.85 | 0.85 | 0.74 | 47.8 G |


3. Experimental Setup and Evaluation Measures
Experiments were planned to investigate the performance of existing CNN models for binary classification of ICOB. Pre-trained CNN models with ImageNet weights were used for this investigation and implemented using Keras with Tensorflow at backend. Images of dimension were used as input to model and average pooling technique was used. Data augmentations techniques including samplewise standard deviation normalization, horizontal flip, vertical flip, rotation, width sift and height shift were used in the simulations for improved performance. All the models were tuned with dropout of 0.2, ReLU activation and batch normalization with SoftMax at fully connected layer. Stochastic Gradient Descent (SGD) optimizer with constant learning rate of 0.01 and categorical entropy loss was used. Each model was trained for 30 epochs with dataset divided into train, validate and test (60%, 20%, 20%). All the simulations were performed using Nvidia GeForce RTX 2060 Graphical Processing Unit (GPU) with 6GB memory and 14 Gbps memory speed. Models were trained at full precision using Floating Point (FP-32) optimization.
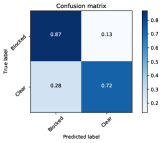
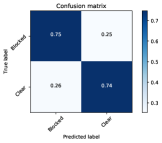
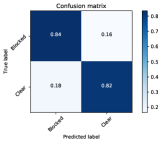
Performance of the models was measured in terms of their test accuracy, test loss, precision score, recall score, F1 score, Jaccard-Index, and processing times. In addition, confusion matrices were plotted to assess the Type I and Type II errors. Type I (False Positive (FP)) and Type II (False Negative (FN)) errors (Banerjee et al., 2009) are commonly used terms in machine learning and main goal of model is to minimize one of these two errors, depending on context that which error is more critical in the given task. By definition, a Type I error is concluding the existence of a relationship while in fact it does not exist (e.g., classifying an image as “blocked” while there is no blockage). Similarly, a Type II error is the rejection of the existence of relationship while in fact it exists (e.g., classifying an image as “clear” while there is blockage). For the given culvert blockage context, Type II error is more critical to be minimized in comparison to Type I error because having notified as blocked while there is no blockage is tolerable in comparison to having notified as clear while there is blockage. Type II error will result in damages because it may be very late for response team to clear the blockage before diversion of flow.
| Model Processing Time (sec) | Total Execution Time (sec) | |||
|---|---|---|---|---|
| Image 1 | Image 2 | Image 3 | ||
| DarkNet53 | 0.05 | 0.12 | 0.2 | 0.35 |
| DenseNet121 | 0.09 | 0.17 | 0.24 | 0.39 |
| InceptionResNetV2 | 0.14 | 0.21 | 0.29 | 0.44 |
| InceptionV3 | 0.09 | 0.17 | 0.24 | 0.39 |
| MobileNet | 0.06 | 0.13 | 0.21 | 0.36 |
| ResNet152 | 0.13 | 0.20 | 0.28 | 0.43 |
| ResNet50 | 0.08 | 0.15 | 0.23 | 0.38 |
| VGG16 | 0.08 | 0.15 | 0.23 | 0.38 |
| EfficientNetB3 | 0.09 | 0.16 | 0.24 | 0.39 |
| NASNetLarge | 0.15 | 0.22 | 0.30 | 0.45 |
4. Results and Discussions
Implemented CNN models were evaluated as per defined measures in Section 3 and results were compared. Table 1 presents the empirical results of all implemented models when evaluated for test dataset in terms of accuracy, loss, precision, recall, F1 score and Jaccard-Index. From the results, NASNet was reported as the best among all others with F1 score of 0.85. EfficientNetB3 and InceptionResNetV2 were reported as the second best with relatively same performance (F1 score of 0.83). DarkNet preformed worst with the F1 score of 0.71.
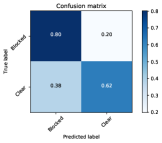
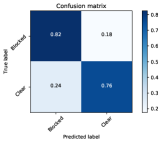
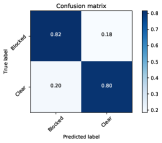
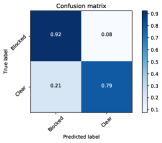
Figure 2 shows the confusion matrices for the implemented CNN model to observe the Type I and Type II errors. From the figures, it can be observed that NASNet performed best in terms of lowest Type II error of only 8%, however, Type I error was reported 21%. On the other hand, EfficientNetB3 was reported with almost similar Type I and Type II errors (14% and 16%). From the FP instances, it was observed that for the cases where there are more than two openings and only one opening was blocked, algorithm classified it as clear. This insight lead to a suggestion in change of labelling criteria. A better approach could be to label image as blocked if half or more than half of openings are blocked otherwise label it as clear. Furthermore, if there is no debris material present in the image and occlusion is due to some foreground object not similar to debris in visual appearance, image should be labelled as clear. From the FN instances, it was observed that for the cases where image contained contents with visual appearance similar to blockage material, image was classified as blocked. This indicated the existence of background clutter/noise problem for this investigation.
Implemented CNN models were also compared for their processing times to investigate the relative response times. Purpose of these analysis was to investigate the hardware implementability of proposed models for real-world applications. Model inference time and image processing time were calculated as two measures to compare the models. Three different size images were used; image 1 of , image 2 of and image 3 of . From the Table 2, it can be observed that MobileNet and DarkNet53 were fastest among others; however, were least accurate in this case. NASNet model was the slowest but most accurate in performance. As a trade-off, EfficientNetB3 model was relatively fast with accuracy towards higher end and recommended as a suitable choice to implement for on-board processing. It is important to mention that reported processing times are for relative comparison between models and not the actual measure of cutting edge hardware performance. However, given the availability of efficient computing hardware such Nvidia Jetson TX2 (Cui and Dahnoun, 2019) and Nvidia Jetson Nano (Basulto-Lantsova et al., 2020), it is highly probable to implement any of the implemented models for real-world applications (e.g., pedestrian detection (Barthélemy et al., 2019), wildlife tracking (Arshad et al., 2020)).
5. Conclusion and Future Directions
Idea of using visual analytic for the culvert blockage analysis has been successfully pitched by implementing existing CNN models for culvert blockage classification. Images of Culvert Openings and Blockage (ICOB) dataset has been developed with diversity of clear and blocked culvert instances for training the CNN models. From the analysis, it has been observed that NASNet model performed best among all in terms of classification performance, however, was the slowest in relative comparison of processing times. Based on the classification performance and processing times, EfficientNetB3 was recommended model to be deployed for real-world application. From the FP and FN instances, background noise and oversimplified labelling criteria were found potential factors for degraded performance. A visual attention based algorithm and/or detection-classification pipeline are the concepts that can be implemented to address the background noise problem. Furthermore, enhancement of dataset by injecting scaled physical model and computer generated synthetic images are potential future directions.
Acknowledgment
I would like to thank WCC for providing resources and support to carryout this study. Furthermore, I would like to thank University of Wollongong (UOW) and Higher Education Commission (HEC) of Pakistan for funding my PhD studies.
References
- (1)
- Arshad et al. (2020) Bilal Arshad, Johan Barthelemy, Elliott Pilton, and Pascal Perez. 2020. Where is my Deer?-Wildlife Tracking And Counting via Edge Computing And Deep Learning. In 2020 IEEE Sensors. IEEE, Rotterdam, Netherlands, 1–4.
- Arshad et al. (2019) Bilal Arshad, Robert Ogie, Johan Barthelemy, Biswajeet Pradhan, Nicolas Verstaevel, and Pascal Perez. 2019. Computer Vision and IoT-Based Sensors in Flood Monitoring and Mapping: A Systematic Review. Sensors 19, 22 (2019), 5012.
- Ball et al. (2016) JE Ball, MK Babister, R Nathan, PE Weinmann, W Weeks, M Retallick, and I Testoni. 2016. Australian Rainfall and Runoff-A guide to flood estimation. Commonwealth of Australia.
- Banerjee et al. (2009) Amitav Banerjee, UB Chitnis, SL Jadhav, JS Bhawalkar, and S Chaudhury. 2009. Hypothesis testing, type I and type II errors. Industrial psychiatry journal 18, 2 (2009), 127.
- Barthélemy et al. (2019) Johan Barthélemy, Nicolas Verstaevel, Hugh Forehead, and Pascal Perez. 2019. Edge-computing video analytics for real-time traffic monitoring in a smart city. Sensors 19, 9 (2019), 2048.
- Barthelmess and Rigby (2011) AJ Barthelmess and EH Rigby. 2011. Culvert Blockage Mechanisms and their Impact on Flood Behaviour. In Proceedings of the 34th World Congress of the International Association for Hydro- Environment Research and Engineering. Engineers Australia, Barton, ACT, 380–387.
- Basulto-Lantsova et al. (2020) Artiom Basulto-Lantsova, Jose A Padilla-Medina, Francisco J Perez-Pinal, and Alejandro I Barranco-Gutierrez. 2020. Performance comparative of OpenCV Template Matching method on Jetson TX2 and Jetson Nano developer kits. In 2020 10th Annual Computing and Communication Workshop and Conference (CCWC). IEEE, Las Vegas, NV, USA, 0812–0816.
- Blanc (2013) Janice Blanc. 2013. An analysis of the impact of trash screen design on debris related blockage at culvert inlets. Ph.D. Dissertation. School of the Built Environment, Heriot-Watt University.
- Cui and Dahnoun (2019) Han Cui and Naim Dahnoun. 2019. Real-Time Stereo Vision Implementation on Nvidia Jetson TX2. In 2019 8th Mediterranean Conference on Embedded Computing (MECO). IEEE, Budva, Montenegro, 1–5.
- Davis (2001) AJ Davis. 2001. An analysis of the effects of debris caught at various points of major catchments during Wollongong’s August 1998 storm event. Bachelor of Engineering Thesis, University of Wollongong.
- French and Jones (2015) Robert French and Malcolm Jones. 2015. Culvert blockages in two Australian flood events and implications for design. Australasian Journal of Water Resources 19, 2 (2015), 134–142.
- French and Jones (2018) Robert French and Malcolm Jones. 2018. Design for culvert blockage: the ARR 2016 guidelines. Australasian Journal of Water Resources 22, 1 (2018), 84–87.
- French et al. (2012) R French, EH Rigby, and AJ Barthelmess. 2012. The non-impact of debris blockages on the August 1998 Wollongong flooding. Australasian Journal of Water Resources 15, 2 (2012), 161–169.
- He et al. (2016) Kaiming He, Xiangyu Zhang, Shaoqing Ren, and Jian Sun. 2016. Deep residual learning for image recognition. In Proceedings of the IEEE conference on computer vision and pattern recognition. IEEE, Las Vegas, NV, USA, 770–778.
- Howard et al. (2017) Andrew G Howard, Menglong Zhu, Bo Chen, Dmitry Kalenichenko, Weijun Wang, Tobias Weyand, Marco Andreetto, and Hartwig Adam. 2017. Mobilenets: Efficient convolutional neural networks for mobile vision applications. arXiv preprint arXiv:1704.04861 (2017).
- Huang et al. (2017) Gao Huang, Zhuang Liu, Laurens Van Der Maaten, and Kilian Q Weinberger. 2017. Densely connected convolutional networks. In Proceedings of the IEEE conference on computer vision and pattern recognition. IEEE, Honolulu, Hawaii, 4700–4708.
- Iqbal et al. (2021) Umair Iqbal, Pascal Perez, Wanqing Li, and Johan Barthelemy. 2021. How Computer Vision can Facilitate Flood Management: A Systematic Review. International Journal of Disaster Risk Reduction 53 (2021), 102030.
- Jones et al. (2016) Rhys Hardwick Jones, William Weeks, and Mark Babister. 2016. Review of Conduit Blockage Policy Summary Report. WMA Water, 160 Clarence Street Sydney, NSW, 2000.
- Ollett et al. (2017) Paul Ollett, Bill Syme, and Phil Ryan. 2017. Australian Rainfall and Runoff guidance on blockage of hydraulic structures: numerical implementation and three case studies. Journal of Hydrology (New Zealand) 56, 2 (2017), 109–122.
- Redmon and Farhadi (2018) Joseph Redmon and Ali Farhadi. 2018. Yolov3: An incremental improvement. arXiv preprint arXiv:1804.02767 (2018).
- Rigby and Silveri (2001) EH Rigby and P Silveri. 2001. The impact of blockages on flood behaviour in the Wollongong storm of August 1998. In 6th Conference on Hydraulics in Civil Engineering: The State of Hydraulics. Engineers Australia, Barton, ACT, 107–115.
- Rigby and Silveri (2002) EH Rigby and P Silveri. 2002. Causes and effects of culvert blockage during large storms. In Ninth International Conference on Urban Drainage (9ICUD). Engineers Australia, Lloyd Center Doubletree Hotel, Portland, Oregon, United States, 1–16.
- Roso et al. (2004) Steven Roso, Michael Boyd, E Rigby, and Rudy VanDrie. 2004. Prediction of increased flooding in urban catchments due to debris blockage and flow diversions. In Proceedings of the 5th International Conference on Sustainable Techniques and Strategies in Urban Water Management (NOVATECH). Water Science and Technology, Lyon, France, 8–13.
- Simonyan and Zisserman (2014) Karen Simonyan and Andrew Zisserman. 2014. Very deep convolutional networks for large-scale image recognition. arXiv preprint arXiv:1409.1556 (2014).
- Szegedy et al. (2016a) Christian Szegedy, Sergey Ioffe, Vincent Vanhoucke, and Alex Alemi. 2016a. Inception-v4, inception-resnet and the impact of residual connections on learning. arXiv preprint arXiv:1602.07261 (2016).
- Szegedy et al. (2016b) Christian Szegedy, Vincent Vanhoucke, Sergey Ioffe, Jon Shlens, and Zbigniew Wojna. 2016b. Rethinking the inception architecture for computer vision. In Proceedings of the IEEE conference on computer vision and pattern recognition. IEEE, Las Vegas, NV, USA, 2818–2826.
- Tan and Le (2019) Mingxing Tan and Quoc V Le. 2019. Efficientnet: Rethinking model scaling for convolutional neural networks. arXiv preprint arXiv:1905.11946 (2019).
- Van Drie et al. (2001) R Van Drie, MJ Boyd, and EH Rigby. 2001. Modelling of hydraulic flood flows using WBNM2001. In 6th Conference on Hydraulics in Civil Engineering. Institution of Engineers Australia, Hobart, Australia, 523–531.
- Wallerstein et al. (1996) N Wallerstein, Colin R Thorne, and S Abt. 1996. Debris control at hydraulic structures, contract modification: management of woody debris in natural channels and at hydraulic structures. Technical Report. Nottingham University (United Kingdom) Department of Geography.
- WBM (2008) BMT WBM. 2008. Newcastle Flash Flood 8 June 2007 (the Pasha Bulker Storm) Flood Data Compendium. Prepared for Newcastle City Council, BMT WBM, Broadmeadow (2008).
- Weeks et al. (2013) W Weeks, G Witheridge, E Rigby, A Barthelmess, and G O‘Loughlin. 2013. Project 11: Blockage of Hydraulic Structures. Technical Report P11/S2/021. Engineers Australia, Water Engineering, 11 National Circuit Barton ACT 2600.
- Zoph et al. (2018) Barret Zoph, Vijay Vasudevan, Jonathon Shlens, and Quoc V Le. 2018. Learning transferable architectures for scalable image recognition. In Proceedings of the IEEE conference on computer vision and pattern recognition. IEEE, Salt Lake City, USA, 8697–8710.