∎
e1e-mail: davide.chiesa@mib.infn.it \thankstexte2e-mail: massimiliano.nastasi@unimib.it
Improving radioactive contaminant identification through the analysis of delayed coincidences with an -spectrometer
Abstract
In the framework of rare event searches, the identification of radioactive contaminants in ultra-pure samples is a challenging task, because the signal is often at the same level of the instrumental background. This is a rather common situation for -spectrometers and other detectors used for low-activity measurements. In order to obtain the target sensitivity without extending the data taking live-time, analysis strategies that highlight the presence of the signal sought should be developed. In this paper, we show how to improve the contaminant tagging capability relying on the time-correlation of radioactive decay sequences. We validate the proposed technique by measuring the impurity level of both contaminated and ultra-pure copper samples, demonstrating the potential of this analysis tool in disentangling different background sources and providing an effective way to mitigate their impact in rare event searches.
1 Introduction
Experiments searching for rare events in the field of neutrino physics and heavy dark matter searches require detectors with large active mass (up to several kton) surrounded by proper shields Dolinski:2019nrj ; Tanabashi:2018oca . In this scenario, the radiopurity of the materials, active or passive, is a fundamental parameter that impacts on the sensitivity and the scientific potential of the experiments themselves. Hence the request to develop high-performance techniques and methods for material screening, allowing to set stringent limits on contaminant concentrations.
The best results in this sector are obtained from mass spectroscopy Kaizer:2019rfw ; Povinec:2018wgd and neutron activation analysis Clemenza:2018mry . These techniques measure very effectively the concentration of stable or very long half-lived nuclides (e.g. 232Th and 238U). By measuring a few grams of material for less than a month, a sensitivity of Bq/kg can be obtained for 232Th and 238U, which represent the most worrisome contaminants for low background experiments. Due to the possible breakdown of the secular equilibrium, this information is not enough to measure the activity of isotopes belonging to the lower part of the radioactive chains which produces background in many experiments Azzolini:2019nmi ; Alduino:2016vtd . In this case, we exploit complementary measurements based on - and -spectroscopy, which however reach limits of 10-100 Bq/kg Laubenstein:2020rbe .
Among these techniques, -spectroscopy has some advantages that make it suitable for future developments that improve its sensitivity. Being sensitive both to the progenitors and to the lower part of radioactive chains (also to -signals), -spectrometers provide a more complete picture of the material contaminations. The short -particle interaction range (m Cu, Eα MeV) allows for studying also the contamination diffusion through the sample, performing interesting studies on the implantation mechanism. The sensitivity of commercial silicon detectors for -spectroscopy is currently limited by their active surface (10 cm2), which can be suitably increased in the case of custom detectors. However, measurements of extremely clean samples would still be limited by the inability to separate the very small signal from the background fluctuations.
A very effective way to identify and measure the contaminations of the lower parts of the 232Th, 238U and 235U natural chains consists in analyzing the time-delayed coincidences produced by decay cascades occurring in relatively short time scales. This technique consists in searching for couples of parent–daughter events associated with the decay of the same precursor isotope. By exploiting the information on time correlations, it is possible to suppress the background and to bring out the distinctive signatures of different radioisotopes, especially when the complementary information provided by the energy spectrum does not allow for a clear identification of the contaminants Chiesa:2021 .
Depending on the features of the measurement system, it is possible to detect different cascades in the natural decay chains. The factor that plays the most important role is the time response of the detector in relation to the counting rate conditions. Obviously, the longer the half-life of the daughter nuclide, the lower must be the event rate on the detector, otherwise random coincidences would spoil the effectiveness of this technique.
For instance, bolometric detectors used in rare event searches Adams:2021rbc ; Azzolini:2019tta ; Armengaud:2020luj ; Abdelhameed:2019hmk ; Alenkov:2019jis ; Amaral:2020ryn ; Arnaud:2020svb allow to detect time coincidences up to a few minutes delay Azzolini:2019nmi , thanks to the very low counting rate characterizing these experiments. However, since they have signal rise times of the order of few ms, they are not able to resolve in time the fast BiPo sequences in the 232Th and 238U chains. On the contrary, devices such as scintillating and semiconductor detectors allow to detect also faster sequences Barabash:2017hst , with the advantage of being able to exploit this technique also in presence of a higher counting rate.
Ion implanted silicon charged particle radiation detectors are produced with thin windows optimized for -spectroscopy measurements. Nevertheless they can also detect -radiation. They are manufactured with surfaces from 25 to 3000 mm2, thus allowing to achieve a relatively high detection efficiency in the study of surface contaminations of various samples, ranging from environmental to radiation protection or radio-assay applications. The time resolution of these detectors is ns, so they are suitable to study several decay sequences in the 232Th, 238U and 235U chains. Moreover, they can be assembled by selecting high purity materials, thus enabling for low background measurements. Thanks to the fact that their active layer is very thin, of the order of a few hundreds , the muon background is negligible. Last but not least, these devices can be easily purchased at an affordable cost. Thanks to the aforementioned features, silicon detectors are an excellent tool to search for and time-delayed coincidences.
In this work, we report the results obtained with an -spectrometer specially adapted for the analysis of delayed-coincidences. Particularly, we will show the results obtained from the analysis of the following decay cascades:
In Sect. 2, we introduce the experimental setup, the tagging of delayed coincidences and the Monte Carlo reconstruction. In Sect. 3, we detail the validation of the analysis strategy on high-contaminated sample measurements. In Sect. 4 finally, we proof the very-high potential of this technique investigating the contaminations of an ultra-pure copper sample.
2 Experimental set-up and Monte Carlo reconstruction
The measurements presented in this paper have been performed using an Ortec detection system, which is an integrated spectrometer for measuring low activity samples. The detector is a ion implanted silicon semiconductor inside a vacuum chamber and is equipped with a complete amplifying chain composed by a charge sensitive pre-amplifier and an amplifier with s shaping time. Our silicon detector belongs to the Ortec series of the Ultra partially depleted detectors. Its active area is 900 mm2 and the minimum depletion depth is 100 m. The energy resolution, measured with an 241Am source, is keV at 5.5 MeV.
The signals from the electronic chain are digitized with a CAEN multi-channel analyzer module (MCA N957) that usually only records the pulse amplitude and builds a spectrum with a resolution of 13 bit. In order to analyze the delayed coincidences, we modified the data acquisition system to also record the timestamp of each event. The timer frequency of this module is 103 Hz and, thus, the time resolution of our experimental set-up is 1 ms.
After the measurement, we analyze the raw experimental data to search for couples of parent–daughter events, like those listed at (1), (2), and (3). Particularly, we select the events with an energy compatible with a possible parent decay, and we open a time window () of the order of a few half-lives of the daughter nucleus to search for its signature. When such a time-delayed coincidence is found, we tag both events for subsequent analyses in which the information about time correlation is exploited to improve the signal to background ratio.
In order to reproduce the experimental energy spectra and to determine the corresponding detection efficiency, we use a Monte Carlo (MC) code based on the Geant4 toolkit GEANT . We implement the experimental configuration of the silicon detector starting from the factory specifications which quote an active layer in the 100500 m range and a dead layer of 50 nm. Then, by analyzing the spectrum produced by a decay (see the next section 3), we find that the active layer allowing for an optimal reconstruction of the measured spectral shape is m. The MC tool allows us to choose the contamination depth of the source and to simulate any natural decay chain. The MC output is processed to introduce the detector features in terms of time and energy resolution and to record, for each event, the energy deposited in the silicon active layer and the time at which the interaction occurs.
3 Experimental measurements with radioactive sources
In this section, we present three measurements performed with different radioactive sources in order to test and validate the selection technique and the data analysis of delayed coincidences. The three sources have been produced by contaminating copper samples with different mechanisms so as to include a part or the full decay chains of 238U, 235U, and 232Th, respectively. Depending on the contamination process, we obtained sources with radioisotopes distributed on the sample surface at different average depths. In the following, we show the potential of the analysis of delayed coincidences in extracting information about surface contaminations even when the spectrum does not exhibit any peak due to the energy degradation process of escaping -particles from deeper surface layers.
3.1 Analysis of 214Bi 214Po delayed coincidence (238U chain)
The goal of the first test is to identify and study the 214Bi 214Po delayed coincidences in the 238U chain. The source used for this measurement is a cm3 copper plate contaminated with 222Rn daughters. This source was produced in a radon-box, an environment where the concentration of this gas reaches high values (250 kBq/cm3) and the -decaying 222Rn daughters are implanted on the sample surfaces. After the copper plate has been exposed for 8 months in the radon-box, we started a measurement immediately after its extraction using the experimental set-up previously described for a total time of 19 hours and 20 minutes.
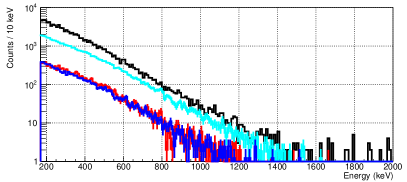
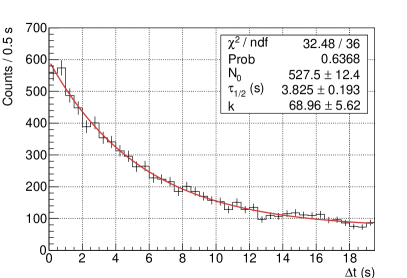
We analyze the data to search for the 214Bi 214Po delayed coincidences. Our detector amplifier, being characterized by a shaping time of the order of 1 s, allows to separately record the energies of 214Bi and 214Po events. However, since the 214Po half-life is shorter than the time resolution of our acquisition system (limited by the MCA timer frequency), the same timestamp is assigned to both events. In Fig. 1, we show the measured spectrum and we highlight the 214Bi 214Po correlated events satisfying the following requirements:
-
•
the 214Bi events must have an energy below the Q-value of the decay (3.3 MeV);
-
•
the 214Po events must be recorded at the 7.687 MeV peak (in a range extending from 7.42 to 7.72 MeV) within 1 s from the 214Bi event.
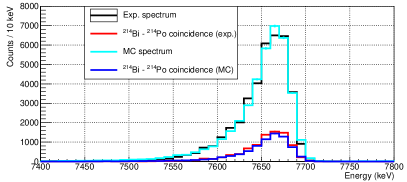
In order to verify the goodness of our selection, we analyze the 214Bi 214Po event rate () as a function of time. For this purpose, we consider only the data collected after the 218Po has almost completely decayed, discarding the initial part of the measurement corresponding to 5 half-lives of 218Po ( min). In this way, by solving the Bateman equations for the 214Pb 214Bi 214Po decay sub-chain, we can fit the following function to the selected 214Bi 214Po data:
| (4) |
where and are, except for an efficiency term, the activities of 214Pb and 214Bi at the beginning of the considered data taking, whereas and are their decay constants. In order not to have too many free parameters in the fit, we fix the decay constants to the values reported in literature WU2009681 and we obtain the result shown in Fig. 2, where we highlight the contributions from the two summed terms in Eq. 4 due to 214Pb and 214Bi decays, respectively. The chi-square test demonstrates that the experimental data are well interpolated, thus proving that the event rate as a function of time of 214Bi 214Po selected data is consistent with the expectations.
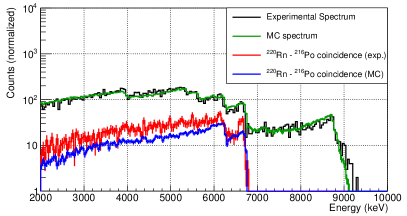
To complete the analysis of this experimental measurement we simulate it with the MC model of the set-up, including the detector and the copper plate. We model the radioactive source, produced by implanting 222Rn daughters, as a surface contamination with an exponential density profile , where is the average implantation depth. We tune the parameter to match the line shape of the 214Po peak, obtaining a value of nm. Then, we search for 214Bi 214Po coincidences in the MC data, applying the same procedure used for the experimental data. By analyzing the -spectrum shape and integral of the selected 214Bi events, we find (by scanning different thicknesses) that the active layer to be used in MC simulations to match the experimental data is 40050 m. In Fig. 1 we show the MC spectrum obtained by simulating 214Bi 214Po decays in comparison with the experimental data. The MC spectrum is normalized to the counts recorded at the 214Po peak and, as expected, does not fully reproduce the experimental data at low energies because of the contributions from other decays and from the environmental background. By looking at the selected spectra of delayed coincidences, we observe a good agreement (within 10%) between the experimental data and the MC reconstruction both at the 214Po peak and in the energy range of 214Bi emission. This is a remarkable achievement because it highlights our capability to select the 214Bi events in the low energy spectrum that includes contributions from other background sources.
3.2 Analysis of 223Ra 219Rn 215Po delayed coincidence (235U chain)
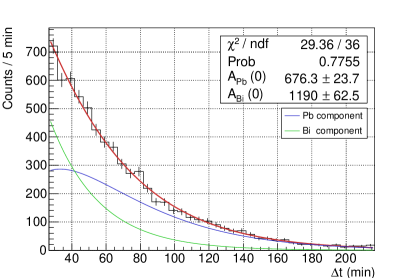
The second test is performed with a source of 223Ra, belonging to the 235U decay chain. The radioactive sample consists of a cm3 copper plate that was exposed to a 227Ac source, thus implanting 223Ra and its daughters. We measured the copper plate for 53.2 days using the same experimental set-up previously described. The measured spectrum, shown in Fig. 3, exhibits prominent peaks at the energies of the -particles emitted by the source. From the analysis of -peak intensities, we observe a secular equilibrium break at 219Rn decay, whose average activity is nearly half that of 223Ra. Nevertheless, we can analyze the collected data to search for subsequent decays of 223Ra 219Rn 215Po, characterized by 11.4 d, 3.96 s, and 1.78 ms half-lives, respectively. We use the following criteria to select sequences of three consecutive -decays:
-
•
the 223Ra parent events must fall in the [56] MeV energy range, which includes the main lines of this decay;
-
•
the 219Rn daughter events in the [67] MeV range must be recorded within a time window s (corresponding to of 219Rn) and must be followed by a 215Po event detected within a very short time (17.8 ms).
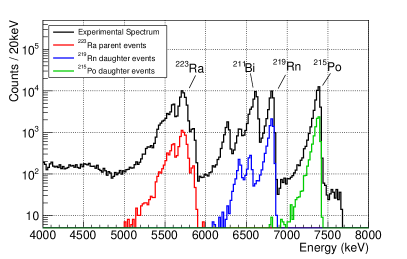
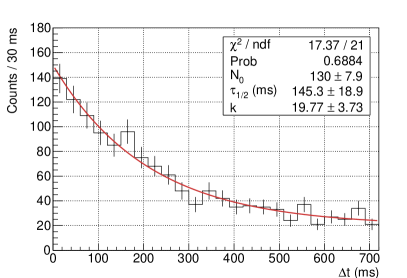
The coincident events are highlighted in Fig. 3, where it is possible to appreciate that the spectrum of daughter events is dominated by the peaks at the energies of the -particles emitted by 219Rn and 215Po. Since in this case the half-life of the daughter nucleus 219Rn is much longer than the time resolution of the system, we can study the distribution of time intervals () between couples of 223Ra 219Rn events. In Fig. 4, we fit to the experimental data a function of the form:
| (5) |
where is a free parameter which is expected to be compatible with the 219Rn half-life, is the amplitude of the exponential term, and is a flat component to account for random delayed coincidences in the approximation that their rate (, which is ) Hz at most) satisfies the condition . The fit results are compatible with the expectations, confirming the effectiveness of the selection technique. Particularly, the value determined for the 219Rn half-life ( s) is in perfect agreement with that reported in literature MAPLES1977223 .
The measurement of delayed coincidences allows us to evaluate the detection efficiency of -particles directly from the experimental data. We can reasonably assume that the detection efficiency of -particles () is nearly constant in the energy range considered for this analysis. This is also confirmed by our MC simulations. Since 219Rn and 215Po have the same activity, the following equations hold:
| (6) |
In this system is the total number of events recorded at the 215Po -peak, are the 219Rn (or equivalently 215Po) decays occurred during the measurement, are the 219Rn 215Po delayed coincidences, and is the fraction of decays expected to occur in the time window set to search for 215Po daughters. By solving the system in Eq. 6, we get that:
| (7) |
The search for 219Rn 215Po delayed coincidences, i.e. events in the [67] MeV range followed by a 215Po within 17.8 ms, gives us (Binomial uncertainty). Thanks to the strong constraint provided by the relatively short half-life of 215Po, the expected number of random delayed coincidences is negligible. To determine , we integrate the counts in the [6.97.5] MeV range (black spectrum in Fig. 4), obtaining . Since 215Po is the only -emitter in this energy range, the background from other possible sources is negligible. Finally, since we open a time window of 17.8 ms, corresponding to 10 half-lives of 215Po, we can set . The -detection efficiency determined through Eq. 7 is . The efficiency evaluated from the MC simulations analyzing the 219Rn and 215Po peaks results is . The comparison between the experimental and the MC reconstruction of the -detection efficiency gives us a difference which cannot be traced back to a statistical fluctuation, thus pointing out a systematic uncertainty of the order of 5%.
3.3 Analysis of 220Rn 216Po delayed coincidence (232Th chain)
To perform the third test, we produced a source by pouring and then evaporating a diluted 232Th liquid standard on a cm3 copper support. Assuming secular equilibrium, we measured the sample activity to be mBq through a -spectroscopy measurement with a low background High Purity Germanium detector. Then, we measured the 232Th source with the -spectroscopy apparatus for 73 hours. Differently from the previous measurements, the measured spectrum (Fig. 5) does not show any peak. We trace this feature back to the formation of an oxidized layer due to the reaction between the nitric acid in the 232Th solution and the copper. This layer of copper oxide was clearly visible on the sample surface and, in light of the experimental measurement, it is thick enough to degrade in energy the emitted -particles.
In this measurement, we search for 220Rn 216Po delayed coincidences using the same experimental setup. The challenge we have to face in this case is that there are no clear energy signatures to distinguish the different s emitted by the 232Th source. Nevertheless, we can rely on the time information, which becomes fundamental.
We set a very wide energy window, from 2 MeV to the maximum energies of 220Rn and 216Po s (6.3 MeV and 6.8 MeV, respectively), to select parent-daughter coincidences within a ms, corresponding to 5 half-lives of 216Po ( ms). In Fig. 5, we show the spectrum of parent-daughter selected coincidences.
To validate our selection, we fit the distribution of the time intervals between 220Rn 216Po events with the function of Eq. 5 (Fig.6), obtaining a decay constant perfectly compatible with the 216Po half-life WU20071057 ; Beretta:2021 . Also in this case the rate of random coincidences () Hz) is small enough to satisfy the condition , which justifies our choice to fit the background with a flat function.
Next, we exploit MC simulations to describe the source-detector system and extract information about the detection efficiency. In order to simulate energy-degraded s, we use a depth parameter of the order of the range of -particles in copper (which we assume to be similar to the one in copper oxide). Particularly, we choose m, which gives us a good reconstruction of the spectral shape in the whole range of energy-degraded s (Fig. 5, green spectrum). By selecting the delayed coincidences in the MC simulation, we get that in this measurement (with a point-like source faced to the detector) the probability to observe a 220Rn 216Po delayed coincidence involving two events with MeV is %, including a 5% systematic uncertainty. After subtracting the random component evaluated through the fit in Fig. 6, the experimental number of delayed coincidence is . Thus, from the analysis of delayed coincidences, we get that the sample activity is mBq, which is statistically compatible at 2 with the one determined through the aforementioned -spectroscopy measurement ( mBq).
This result proves that even in the absence of clear signatures in the energy spectrum, we are able to identify a relatively deep surface contamination and evaluate its activity thank to the analysis of time correlations. As shown in the next section, this approach is particularly useful in the analysis of samples with a low contamination level.
4 Analysis of a low activity sample
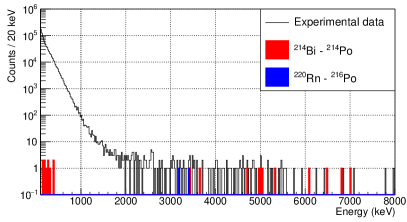
After testing and validating the selection of delayed coincidences with different sources, we apply this technique to analyze a weakly contaminated sample. This allows to probe the sensitivity of the measurement apparatus and to highlight the potential of this method in the framework of low background measurements. The weakly radioactive sample consists of a cm3 high-purity copper plate (OFHC, Oxygen-Free High Conductivity) treated with surface plasma ablation, a typical cleaning technique for materials used in rare event searches Azzolini:2018tum . In Fig. 7, we show the spectrum collected with a 31.9 days measurement. In the region above the 2.6 MeV 208Tl -line, we do not observe any peak, thus the analysis of the energy spectrum does not allow to identify any particular emitter. Nevertheless, as shown in the previous section, the analysis of time correlations is a powerful tool to increase our knowledge about contaminations even in the absence of peaks. Therefore, we analyze the data to search for delayed coincidences involving the energy-degraded events that populate the spectrum above the 2615 keV 208Tl line (representing the endpoint of the main environmental radiation). Taking into account the energy resolution of the detector, we set at MeV the lower bound for the energy region of degraded s. The total number of events detected in this energy region is 122, thus the rate of degraded s is Hz.
The data analysis strategy is set up in the following steps with the goal of identifying possible contaminants belonging to the 232Th and 238U decay chains (235U contaminations can be neglected due to its low isotopic abundance in nature).
-
1.
In order to investigate 238U chain contaminations, we search for 214Bi 214Po coincident events between a with MeV and an energy-degraded . In this search, there is no ambiguity with the 212Bi 212Po sequence of the 232Th chain, because the 212Po half-life ( s) is shorter than the shaping time of the amplifier (1 s) and, thus, it produces piled-up events. We find 11 coincidences in the collected data. Taking into account that we opened time-windows with ms, the expected number of random coincidences is . Therefore, we can reasonably state that all the 11 observed coincidences are produced by a 214Bi 214Po decay sequence belonging to the 238U chain.
-
2.
To probe 232Th chain contaminations, we search for 220Rn 216Po delayed coincidences between degraded s occurring within a s. We find only 1 pair of events satisfying this requirement, in front of an expected number of random coincidences estimated to be . Since there are no other decay sequences occurring on this time scale in both 232Th and 238U chains, this event can be attributed to a 220Rn 216Po cascade.
-
3.
As a final cross-check, we search for delayed coincidences between degraded s with s min, (upper bound corresponding to of 218Po). Indeed, since we observed 11 214Bi 214Po events, we expect to detect also 222Rn 218Po sequences belonging to the previous part of the 238U chain. The selection criteria adopted in this case include also the 224Ra 220Rn ( s) sequence belonging to the 232Th chain. However, given the results obtained from the previous selections, the dominant contribution is expected to come from the 238U chain. In this case we find 7 delayed coincidences with an expected number of random . This result is compatible with the previous ones, because, according to our MC simulations, the efficiency to detect a 214Bi 214Po coincidence is a factor higher with respect to the 222Rn 218Po one.
In Table 1, we summarize the results obtained from this analysis. Since we found delayed coincidences involving energy-degraded s, the contamination depth must be on the same scale of the -range in copper (i.e few tens of m). Thus, in order to evaluate the efficiencies to detect a delayed coincidence (), we simulate the surface contamination of the sample with a depth parameter m. The efficiencies reported in Table 1 are obtained by generating the decays on the whole sample surface (52 cm2), in front of a detector active area of 9 cm2. We obtain contaminant activities per unit of surface area () on the order of Bq/cm2 for both 238U and 232Th chains. Given the relatively small number of detected coincidences, we apply the Feldman-Cousins approach PhysRevD.57.3873 to calculate the 90% C.L. interval for known mean background equal to zero and to assess the uncertainty range on results.
| Decay chain | 238U | 232Th |
|---|---|---|
| Decay sequence | 214Bi 214Po | 220Rn 216Po |
| Decay type | ||
| Range parent (MeV) | [0.1 – 2.65] | [2.65 – 6.32] |
| Range daughter (MeV) | [2.65 – 7.72] | [2.65 – 6.81] |
| (ms) | 1 | 725 |
| (Delayed coincidences) | 11 | 1 |
| (%) | 1.10 0.01 | 0.74 0.01 |
| (Bq/cm2) | 7.6 | 0.9 |
The sensitivity we obtain through the analysis of delayed coincidences is on the same scale as that which would be obtained assuming that the events observed in the higher energy region of the spectrum ( MeV) are produced by decays belonging to the 232Th chain (212Po, MeV) or to the 238U one (214Po, MeV). Particularly, there are 3 events with MeV (that can not originate from the 238U chain) and 8 events in the range from 6 to 7.72 MeV, which can be produced by both decay chains. If we conservatively attribute the counts in these ranges to 232Th and 238U chains, respectively, we would obtain that the activities are at maximum Bq/cm2 for 232Th and Bq/cm2 for 238U (which are compatible with those reported in Tab. 1 taking into account their respective 90% confidence intervals). In both cases, we obtain results on the Bq/cm2 sensitivity scale, because the efficiency loss due to the search of a coincident event is practically fully compensated by the fact that we can extend the energy range down to 2.65 MeV. However, thanks to the analysis of delayed coincidences, we get clear signatures to disentangle the 238U chain contaminations from the 232Th ones, allowing to determine their activity without ambiguity in the identification of the radioactive contaminant (232Th or 238U chain) that produces the energy-degraded s. Indeed, the discrimination power of this technique to identify 238U versus 232Th contaminations, evaluated as the probability that a 220Rn 216Po coincidence happens with a ms and, thus, is not tagged as a 214Bi 214Po one is . For example, in this test case, we have been able to assess that the 238U contamination activity is higher than the 232Th one, and such information can be extremely useful in the framework of radiopurity assay measurements. Moreover, the observation of delayed coincidences involving energy-degraded s, allows us also to extract precious information about the features of surface contaminations in terms of average contamination depth.
Finally, as can be seen in Fig. 7, there are no delayed coincidences detected in the ranges where 214Po, 220Rn, and 216Po -peaks would be expected to show up in the case of very shallow surface contaminations. In order to provide a limit for such kind of contaminations, we run the MC simulations with a depth parameter nm small enough to make the -energy degradation effect negligible. By evaluating the efficiencies to detect delayed coincidences at the -peaks (in a FWHM range), and calculating 90% C.L. upper limits, we obtain the following results:
for the 238U and 232Th chain, respectively.
5 Conclusions
In this article, we described the delayed coincidence analysis technique and its application to -spectroscopy measurements with silicon detectors. We validated the data acquisition software and the analysis procedure through dedicated measurements with different contaminated samples, demonstrating the reliability and the flexibility of this technique. Moreover, we highlighted the potential of this analysis applying it to the radiopurity assessment of an ultra-pure sample. Although the achieved sensitivity is comparable to the one calculated with the standard approach (Bq/cm2), the time correlation allowed us to disentangle contaminations of 238U chain from those of 232Th one with a discrimination power , determining their activity and average implantation depth. This information is essential for several reasons, such as the investigation of contamination mechanisms (e.g. deposition, implantation, diffusion) and the development of new purification strategies for further improvement of material radiopurity. These aspects will play a crucial role in the selection of materials for the next generation experiments CUPIDInterestGroup:2019inu . Finally, the analysis of delayed coincidences can also be applied to identify and reject background events from surface contaminations of detector materials.
Acknowledgements.
This work makes use of the Arby software for Geant4 based Monte Carlo simulations, that has been developed in the framework of the Milano – Bicocca R&D activities and that is maintained by O. Cremonesi and S. Pozzi.References
- (1) M.J. Dolinski, A.W. Poon, W. Rodejohann, Ann. Rev. Nucl. Part. Sci. 69, 219 (2019). doi:10.1146/annurev-nucl-101918-023407
- (2) M. Tanabashi, et al., Phys. Rev. D 98(3), 030001 (2018). doi:10.1103/PhysRevD.98.030001
- (3) J. Kaizer, S. Nisi, P.P. Povinec, J. Radioanal. Nucl. Chem. 322(3), 1447 (2019). doi:10.1007/s10967-019-06857-3
- (4) P. Povinec, et al., J. Radioanal. Nucl. Chem. 318(1), 677 (2018). doi:10.1007/s10967-018-6105-9
- (5) M. Clemenza, J. Radioanal. Nucl. Chem. 318(3), 1765 (2018). doi:10.1007/s10967-018-6333-z
- (6) O. Azzolini, et al., Eur. Phys. J. C 79(7), 583 (2019). doi:10.1140/epjc/s10052-019-7078-8
- (7) C. Alduino, et al., Eur. Phys. J. C 77(1), 13 (2017). doi:10.1140/epjc/s10052-016-4498-6
- (8) M. Laubenstein, I. Lawson, Front. in Phys. 8, 506 (2020). doi:10.3389/fphy.2020.577734
- (9) O. Azzolini, et al., Eur. Phys. J. C 81(8), 722 (2021). doi:10.1140/epjc/s10052-021-09476-z
- (10) D.Q. Adams, et al., (2021). ArXiv: 2104.06906
- (11) O. Azzolini, et al., Phys. Rev. Lett. 123(3), 032501 (2019). doi:10.1103/PhysRevLett.123.032501
- (12) E. Armengaud, et al., Phys. Rev. Lett. 126, 181802 (2021). doi:10.1103/PhysRevLett.126.181802
- (13) A.H. Abdelhameed, et al., Phys. Rev. D 100(10), 102002 (2019). doi:10.1103/PhysRevD.100.102002
- (14) V. Alenkov, et al., Eur. Phys. J. C 79(9), 791 (2019). doi:10.1140/epjc/s10052-019-7279-1
- (15) D.W. Amaral, et al., Phys. Rev. D 102(9), 091101 (2020). doi:10.1103/PhysRevD.102.091101
- (16) Q. Arnaud, et al., Phys. Rev. Lett. 125(14), 141301 (2020). doi:10.1103/PhysRevLett.125.141301
- (17) A.S. Barabash, et al., JINST 12(06), P06002 (2017). doi:10.1088/1748-0221/12/06/P06002
- (18) S. Agostinelli, , et al., Nuclear Instruments and Methods in Physics Research Section A: Accelerators, Spectrometers, Detectors and Associated Equipment 506(3), 250 (2003). doi:10.1016/S0168-9002(03)01368-8
- (19) S.C. Wu, Nuclear Data Sheets 110(3), 681 (2009). doi:https://doi.org/10.1016/j.nds.2009.02.002
- (20) C. Maples, Nuclear Data Sheets 22(2), 223 (1977). doi:https://doi.org/10.1016/S0090-3752(77)80006-9
- (21) S.C. Wu, Nuclear Data Sheets 108(5), 1057 (2007). doi:https://doi.org/10.1016/j.nds.2007.04.001
- (22) O. Azzolini, et al., (2021). ArXiv: 2105.03329
- (23) O. Azzolini, et al., Eur. Phys. J. C 78(5), 428 (2018). doi:10.1140/epjc/s10052-018-5896-8
- (24) G.J. Feldman, R.D. Cousins, Phys. Rev. D 57, 3873 (1998). doi:10.1103/PhysRevD.57.3873
- (25) W. Armstrong, et al., arXiv 1907.09376 (2019)