Formation of the first galaxies in the aftermath of the first supernovae
Abstract
We perform high-resolution cosmological hydrodynamic simulations to study the formation of the first galaxies that reach the masses of at . The resolution of the simulations is high enough to resolve minihaloes and allow us to successfully pursue the formation of multiple Population (Pop) III stars, their supernova (SN) explosions, resultant metal-enrichment of the inter-galactic medium (IGM) in the course of the build-up of the system. Metals are ejected into the IGM by multiple Pop III SNe, but some of the metal-enriched gas falls back onto the halo after . The star formation history of the first galaxy depends sensitively on the initial mass function (IMF) of Pop III stars. The dominant stellar population transits from Pop III to Pop II at in the case of power-law Pop III IMF, with the mass range . At , stars are stably formed in the first galaxies with a star formation rate of -. In contrast, for the case with a flat IMF, gas-deprived first galaxies form due to frequent Pop III pair-instability SNe, resulting in the suppression of subsequent Pop II star formation. In addition, we calculate UV continuum, Ly- and H-line fluxes from the first galaxies. We show that the James Webb Space Telescope will be able to detect both UV continuum, Ly and H line emission from first galaxies with halo mass at .
keywords:
galaxies: evolution – galaxies: formation – galaxies: high-redshift – stars: Population III1 Introduction
In the modern cosmology, first stars, so-called Population III (Pop III) stars, are supposed to form in small H2-cooling haloes, so-called minihaloes () at (e.g., Couchman & Rees, 1986; Haiman et al., 1996; Tegmark et al., 1997; Abel et al., 2002; Bromm et al., 2002; Yoshida et al., 2003). Star formation in minihaloes occurs presumably just in one or two episodes because of fragility of molecular hydrogen and strong radiative/supernova feedback exerted by the formed Pop III stars (Omukai & Nishi, 1999; Glover & Brand, 2001). Through the hierarchical merging process, those small haloes subsequently grow into a larger system. Once their mass exceeds and the virial temperature reaches , the gas in the halo collapses via more robust hydrogen atomic cooling, and the hosting halo is referred to as an atomic cooling halo and the galaxy as a first galaxy, where star formation proceeds in a sustainable way (e.g., Bromm & Yoshida, 2011).
The first galaxies are the initial stage of galactic evolution and building blocks of the present-day counterparts. Also, they are believed to be important radiation sources in the cosmic reionization (Yajima et al., 2011, 2014; Wise et al., 2012; Paardekooper et al., 2013; Kimm & Cen, 2014; Paardekooper et al., 2015; Trebitsch et al., 2018; Ma et al., 2020). Understanding the formation of the first galaxies is one of major goals in contemporary extra-galactic astronomy. Observationally, the first galaxies are among prime targets in the era of next generation telescopes, such as the James Webb Space Telescope (JWST). Thus, theoretical prediction for their physical properties is vital for successful searches with future observations.
Pop III stars are thought to form by gravitational collapse induced by cooling (e.g., Omukai & Nishi, 1998; Yoshida et al., 2008). Theoretical studies assessing the initial mass function (IMF) of Pop III stars predict their masses widely ranging in 10-1000 (e.g., Nakamura & Umemura, 2001; Hirano et al., 2014; Susa et al., 2014; Hirano et al., 2015). At the end of their lives, Pop III stars with the initial mass of 8-40 are expected to explode as core-collapse supernovae (CCSNe). If stars are in the mass range of 140-260 , they explode as pair-instability SNe (PISNe). More massive stars directly collapse into black holes (BHs) without explosion (Heger & Woosley, 2002). The supernovae evacuate the gas not only in the host but also in neighbouring haloes, thereby suppressing subsequent star formation in them (e.g., Smith et al., 2015; Chiaki et al., 2018). Furthermore, massive Pop III stars emit intense ultraviolet (UV) radiation (Tumlinson & Shull, 2000; Bromm et al., 2001; Schaerer, 2002). The ionizing and H2-dissociating (so-called Lyman-Werner, LW) photons prevent the collapse of gas and subsequent star formation not only in the parental minihaloes (Omukai & Nishi, 1999; Glover & Brand, 2001) but also in neighbouring ones (Haiman et al., 1997; Susa & Umemura, 2006; Hasegawa et al., 2009; Trenti & Stiavelli, 2009; Agarwal et al., 2014; Latif & Khochfar, 2019). This radiative feedback has been shown to play a major role in regulating the cosmic Pop III star formation rate density in the Universe (Johnson et al., 2013).
As for modelling of first galaxy formation, Greif et al. (2010) carried out high-resolution cosmological hydrodynamics simulations considering the Pop III SNe. They showed that although the Pop III SN explosion ejects metal-enriched gas into the surrounding IGM, the ejected gas eventually falls back onto the halo as it evolves into a larger system, with its mass at . If a single PISN occurs, metallicity at the centre of the halo can reach , which is sufficient to cause the transition of star formation mode from massive Pop III to low-mass Pop II stars (Omukai, 2000; Bromm et al., 2001; Schneider et al., 2002; Omukai et al., 2005). Pawlik et al. (2013) carried out radiation-hydrodynamic simulations to investigate the impact of photo-ionization/dissociation radiation during the formation of the first galaxies. They pointed out that radiation feedback can suppress condensation of the gas and star formation in the main progenitor minihalo. Jeon et al. (2015) investigated the assembly of a first galaxy that reaches the mass of at assuming a top-heavy initial mass function (IMF) for Pop III stars. Johnson et al. (2013) performed a high-resolution large-scale cosmological hydrodynamic simulation taking into account the photo-dissociating radiation and supernovae (SNe) feedback in modelling Pop III star formation, first metal enrichment and formation of Pop II stars in galaxies. Taking advantage of the large ( Mpc on a side) simulation box, they could pin down the star formation rate (SFR) densities of Pop II and III stars, and the transition redshift from Pop III to Pop II stars. However, those studies have not resolved formation of individual Pop III stars but only considered average IMF properties.
On the other hand, high-resolution hydrodynamic simulations with smaller computational boxes resolving a single Pop III star were carried out to see its impact on formation of second-generation stars. Chiaki et al. (2018) investigated metal enrichment due to Pop III SNe by way of cosmological radiation hydrodynamics combined with a metal propagation model based on a Lagrangian test-particle technique. They showed that SN ejecta fall back to the original halo and the internal enrichment takes place in the case of a CCSN, whereas the ejecta reach a neighbouring minihalo and induces its external enrichment in the case of PISN explosion (see also, Maio et al., 2011; Smith et al., 2015; Hicks et al., 2020). Due to the numerical cost in resolving the detailed structures of minihaloes, however, their simulation was limited to a small volume containing only several minihaloes.
Thus, building-up of a first galaxy, starting from the formation of individual Pop III stars, has not been modelled in great detail yet. One exception is the Renaissance simulations, where high-resolution adaptive mesh refinement (AMR) cosmological hydrodynamic simulations have been pioneered with modelling Pop III stars and first galaxies (Xu et al., 2013, 2014; Chen et al., 2014; Ahn et al., 2015; O’Shea et al., 2015). They focused on overdense regions and investigated the evolution up to . More than Pop III stars and first galaxies are found in their computational volume. Although they also followed formation of individual Pop III stars, the minimum halo mass they resolved is limited to and stars formed in smaller haloes were not properly taken into account. In addition, in the modelling of the Pop III star formation, they assumed a single functional form for the IMF although it is still under debate (e.g, Nakamura & Umemura, 2001; Susa et al., 2014; Hirano et al., 2015; Stacy et al., 2016). It is still unclear how the IMF of the Pop III stars impacts on the physical properties of the first galaxies. In this paper, we perform high-resolution cosmological hydrodynamic simulation, resolving individual Pop III stars in minihaloes down to and its subsequent evolution, and investigate the impact of multiple Pop III feedback events on the formation of the first galaxies. Besides, we investigate the effects of different Pop III IMFs by changing the power-law slope of the IMF.
This paper is organized as follows. In Section 2, we present the numerical method for our simulations. The numerical results are described in Section 3, where we show the assembly of first galaxy taking into account the mass dependence of the system. Effects of different model assumptions on e.g., treatment of the LW radiation feedback, adopted Pop III IMF, etc. are discussed in Section 4. Section 5 is devoted to discussion on observability of first galaxies by future instruments. Finally, we conclude our results in Section 6. Throughout this paper, we assume CDM cosmology with the cosmological parameters; , , and .
2 Method
2.1 Code and initial condition
We carry out a suite of first galaxy simulations with the modified version of the smoothed particle hydrodynamic (SPH)/ -body code GADGET-3 (Springel et al., 2001; Springel, 2005a). The code treats the formation/evolution of Pop III stars, LW radiation feedback, SN feedback, non-equilibrium primordial chemistry with equilibrium metal cooling, which are implemented in the First Billion Year (FiBY) project (Johnson et al., 2013). Recently the code was updated in regard to the feedback from stars and black holes and the dust destruction in Forever22 project (Yajima et al., 2020). Our implementation for the thermal evolution is based on Johnson et al. (2013). We solve non-equilibrium primordial chemistry and molecular cooling and (collisional or photoionization) equilibrium metal cooling.
In this work, we newly incorporate the photo-ionization feedback into the code. For the high-resolution cosmological hydrodynamic simulation, we generate a zoom-in initial condition by utilizing MUSIC code (Hahn & Abel, 2011). First we carry out a cosmological -body simulation with the box size of (4 Mpc)3 with coarse-grained dark matter particles. Then, we perform friends-of-friends (FOF) group finding to identify dark matter haloes with masses of (M8run) and (M9run). We refer to M8run as our fiducial run and investigate its feedback and parameter dependencies. In addition, we carry out five more simulations with different initial conditions producing haloes at considering diversity of galaxy formation environments (summarized in Table 1). The zoom-in regions have the size of comoving kpc, and contain high-resolution DM and SPH particles with the mass of and , corresponding to the effective resolution of (4096)3. We set the gravitational softening length comoving pc for both DM and SPH particles. We also consider a case of formation of a first galaxy in a higher-density region (M9runH). In the M9runH, we select a region that evolves into a halo at within a (14 Mpc)3 box and generate the zoom-in initial condition. In the M9runH, the mass resolution is worse compared to M8run and M9run due to the computational cost. The refined DM and SPH particle masses are and , respectively. However, the mass resolution is still high enough to allow us to resolve minihaloes hosting Pop III stars.
2.2 Star formation
With resolution of physical pc scale, our simulations can follow the prestellar collapse of gas in minihaloes. However, even with current computer facilities, it is too expensive to resolve individual protostar formation simultaneously with cosmological large-scale structure. We avoid this difficulty by introducing a sink particle method, in which we convert gas particles into a collisionless single star particle, if the hydrogen number density exceeds the threshold density of and the velocity is converging . Recent cosmological simulations show that Pop III stars are typically more massive than with the mass spectrum ranging from to (e.g., Hirano et al., 2015). Note, however, that the mass spectrum and its lower mass limit are still under debate because of the difficulties in following long-term disk instability and fragmentation (e.g., Clark et al., 2011a, b; Susa et al., 2014; Sugimura et al., 2020). For the fiducial cases shown in Section 3, we adopt a Salpeter-like IMF, e.g., with with the mass range of , but also studied a case of more top-heavy IMF later in Section 4. The mass of a single Pop III star particle is randomly chosen with probability given by the assumed IMF. We note that if the stellar mass exceeds the SPH particle mass, we subtract the mass of the neighbouring gas particles to fill the gap.
Pop II star formation takes place in the form of star clusters (e.g., Lada & Lada, 2003). To take this into account, we treat each Pop II stellar particle as a “star cluster” and assume a single stellar population with the Chabrier IMF with mass in the range 0.1 - 100 . If and are satisfied, we estimate the local free-fall time which roughly corresponds to the local star-formation timescale. Then, the local star formation rate (SFR) is calculated as
| (1) |
where is the local stellar density and is a dimensionless parameter that controls the star formation efficiency. Throughout this paper, we assume .
The thermal history of the collapsing gas sensitively depends on the metallicity, resulting in different stellar masses (Omukai et al., 2005). We assume that Pop III stars form if , while Pop II star clusters form at higher metallicity. The critical metallicity is set to (e.g., Johnson et al., 2013). We also investigate the impacts of the critical metallicity in §4.3.
2.3 Stellar feedback
2.3.1 Supernova and metal enrichment
SN feedback alters structure of the inter-stellar/galactic media (ISM/IGM) significantly and thereby affects subsequent star formation. The treatment of SN feedback is thus an essential element in studying the assembly of a first galaxy. In this study, we adopt the subgrid recipe proposed by Dalla Vecchia & Schaye (2012), which can avoid the so-called overcooling problem regardless of the mass resolution. In this scheme, SN thermal energy is stochastically distributed to neighbouring SPH particles by elevating the temperature by . We set the heating temperature K and the SN energy per a supernova for CCSN of Pop III or Pop II, while K and are set for PISN of Pop III. Dalla Vecchia & Schaye (2012) argued that thermal energy is efficiently converted into kinetic energy when the sound crossing time is less than the cooling time. This condition is satisfied for the gas density below the following value,
| (2) |
When SN releases the energy , we randomly input the thermal energy to neighbouring SPH particles in accordance with the probability so that the total thermal energy coincides with . The probability is given by
| (3) |
where is the feedback efficiency and we assume it to be unity, is the number of neighbour SPH particles and is the mass of an SPH particle , is the increase of the thermal energy per unit mass. For each neighbour SPH particle, we generate the uniform random number between 0 and 1. We increase the temperature to if the SPH particle satisfies the condition of . The expectation value of the number of heated particles is evaluated as
| (4) |
In this setup, we typically heat 5 particles for CCSN and 14 particles for PISN.
We follow the metal enrichment as in Wiersma et al. (2009). Once the the neighbour SPH particles are chosen for the thermal feedback, the metals produced by SNe are also injected into them. The mass of metals assigned to an SPH particle is estimated with the weight based on the kernel function. Note that, here we do not take into account the metal transfer between SPH particles. Instead, we consider the local metallicity smoothed over 48 neighbour SPH particles.
2.3.2 Photoionization feedback
Previous studies pointed out that the ionization/dissociation radiation from Pop III stars regulates subsequent star formation nearby (e.g., Johnson et al., 2013; Pawlik et al., 2013, see also Susa et al. (2009); Hasegawa et al. (2009)). However, the ionization radiation feedback has a strong effect only in early phases of the assembly and becomes powerless once the system reaches the atomic cooling regime (Pawlik et al., 2013). In systems lager than the atomic cooling halo limit, SN feedback becomes more important in regulating the evolution than radiation feedback (e.g., Yajima et al., 2017). In this work, we model the photo-ionized region based on a photon conservation approach as
| (5) |
where , , are SPH particle mass, density and hydrogen number density of -th particle, is the case-B recombination coefficient at temperature K. Note that the summation is carried out in ascending order of distance from ionizing sources. For of Pop III stars, we refer to the table in Schaerer (2002). If SPH particles are in the photo-ionization region, the temperature is raised to . The photo-ionization regions push the surrounding neutral gas via high pressure even before the explosions of SNe. In addition to Pop III stars, we also consider the photo-ionization feedback from Pop II stars in the same way. We set the ionizing photon emissivity per stellar mass for Pop II stars as , which is estimated from the SED of a typical high-redshift galaxy using starburst99 (Leitherer et al., 1999).
2.3.3 photodissociation and photodetachment
We take into account UV radiation from young stars to include the photodissociation of and photodetachment of . Since molecules are the dominant coolant in low-metallicity gas at K (Susa & Umemura, 2004), UV radiation is likely to have a significant impact on Pop III/II formation efficiency and subsequent properties of the first galaxies. In calculating the dissociation rate of , we evaluate the UV flux from the geometrical dilution , where is the distance from the radiation source to the gas, considering also the self-shielding based on the column density over a local Jeans length. The self-shielding function proposed by Wolcott-Green et al. (2011) (equation 11 in their paper) is used in our simulations.
3 Result
3.1 Formation of first galaxy
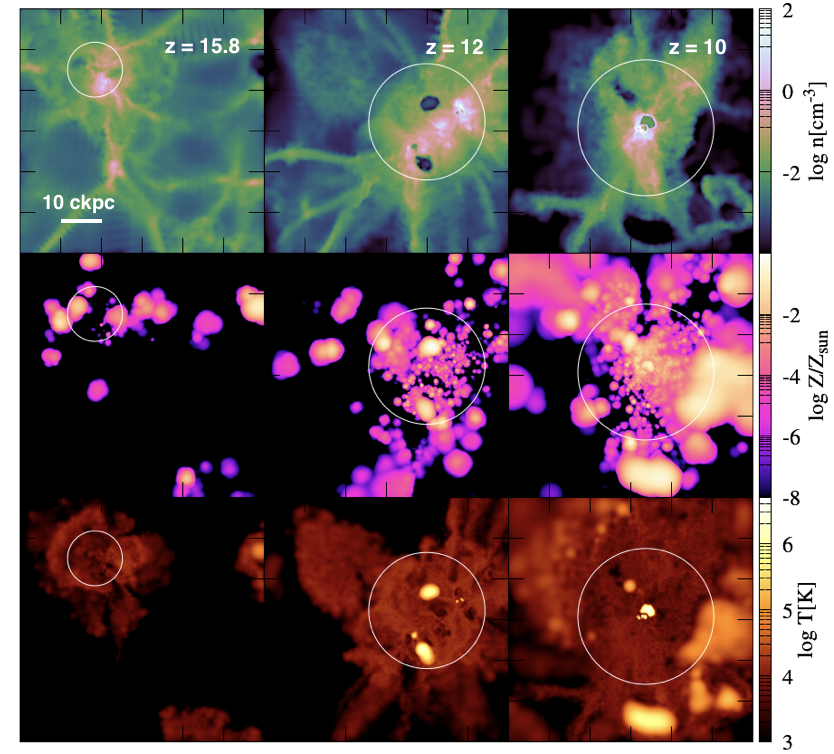
Fig. 1 shows the time evolution of the gas density (top), the metallicity (middle) and the temperature (bottom) in the M8run (fiducial run). These snapshots show a typical qualitative picture for the formation sequence of a first galaxy. The field of view is 60 comoving kpc, which roughly corresponds to twice the virial radius of the main progenitor halo at . At (left panels), minihaloes form and gas in some of them collapses via molecular cooling, resulting in the formation of Pop III stars. In the other minihaloes the gas collapse is prevented by the LW radiation emitted by nearby Pop III stars formed earlier. In §4.2, we will discuss in more detail the impact of LW radiation feedback on the formation of first galaxies. At (middle panels), an atomic-cooling halo () forms. At this stage, SNe of Pop II stars generate hot bubbles as seen in the temperature map. The high thermal pressure of the hot bubble evacuates the surrounding gas and creates a hole-like structure in ISM/IGM. As the galaxy grows, the gravitational potential becomes able to keep the gas against the stellar feedback. Then, the gas continues to accrete onto the galaxy along large scale filaments and is fed to forming stars. As the star formation proceeds, the cosmic volume is filled with metals ejected from SNe (middle row). In the early stages, Pop III stars pollute the IGM with metals, resulting in a patchy metal-enriched structure. At (right panel), most of the zoom-in region becomes metal-enriched with a volume filling factor of (, within box region). The gas metallicity in the galaxy reaches which is much higher than the critical value for the Pop III-II transition.
To study the propagation of the metal-enriched gas in the IGM, we trace the trajectories of all SPH particles in minihaloes hosting Pop III stars. Fig. 2 displays the time evolution of the peculiar velocities of the SPH particles in these minihaloes.
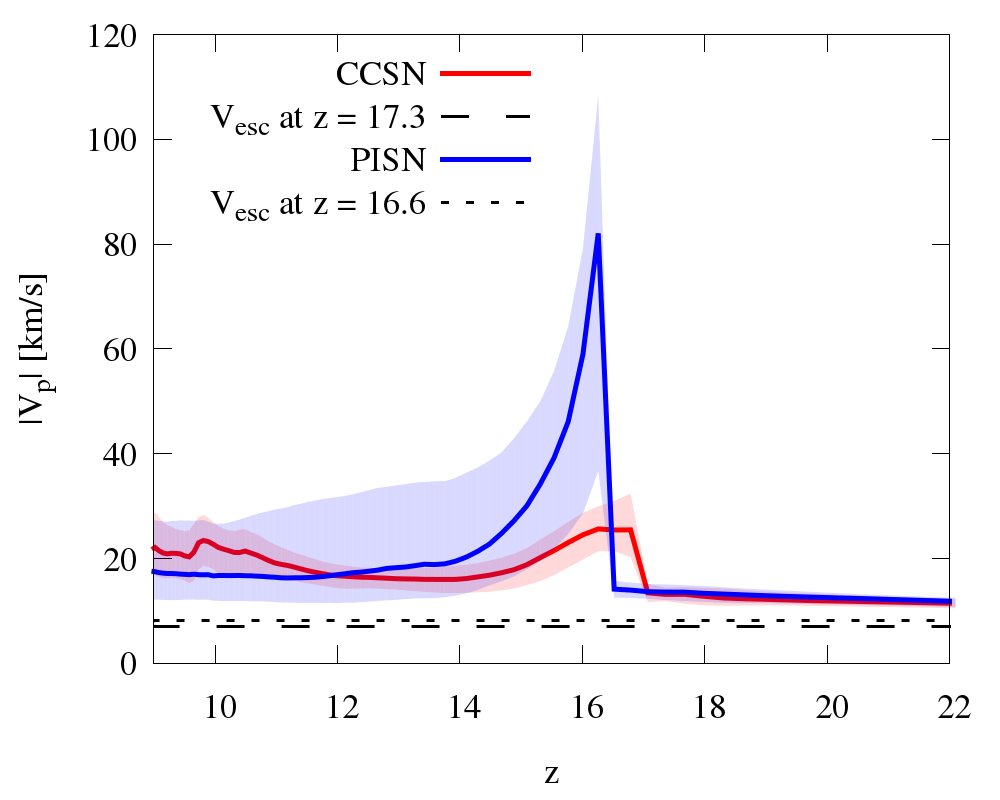
To understand the behaviour seen in Fig. 2 we select two minihaloes and discuss them in detail; one minihalo with mass that hosts a Pop III that will explode in a CCSN at (red line), and another minihalo with that hosts a PISN at (blue line, picked up from M8run but assumed a top-heavy Pop III IMF, see §4.1). In the former, the CCSN occuring at ejects gaseous material with the speed 25.4 km/s. On the other hand, the escape velocity of the halo can be evaluated as (Chon et al., 2016):
| (6) |
where is the matter density at and is the critical overdensity of the halo. This gives the escape velocities around km s-1 at , smaller than the actual wind velocity. Consequently we find large outflow rates for gas from the haloes. In the case of the Salpeter-like IMF, per cent of stars explode as CCSNe. This would suggest that, the IGM around most of the minihaloes hosting Pop III stars should be metal-enriched. The outflowing gas propagates through the IGM conserving momentum, slowing down as it sweeps up material in the IGM. The velocity decreases with the distance from its origin as
| (7) |
where and are the initial velocity and total mass of the gas blown out from the minihalo, respectively, is the propagation distance in physical units. After traveling sometime in the IGM, the metal-enriched gas eventually falls back onto the halo, which has become more massive after the SN event (see also, Jeon et al., 2014). In the case of a PISN, the outflow velocity reaches as high as . As a result, most of the gas reaches far from the host halo and escapes without falling back again. We will discuss the impact of the type of Pop III SNe on the properties of the first galaxies later in Sec.4.1.
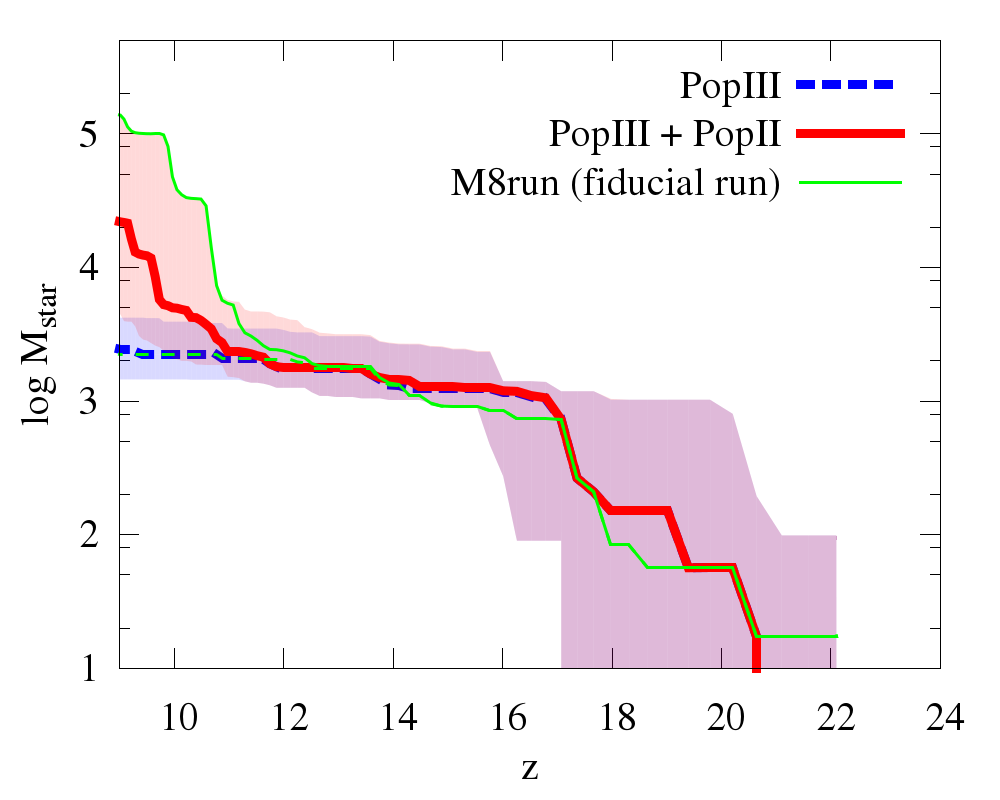
Fig. 3 shows the star formation histories in the zoom-in regions. A step-like increase of the Pop III cumulative mass corresponds to birth of a single Pop III star. We simulate the evolution of five different zoom-in regions that end up with haloes at (see table 1) to account for statistical variance of such a system. At , Pop III star formation terminates as a result of metal enrichment and Pop II stars start to form continuously in the galaxies thereafter. Here we define the transition epoch so that the cumulative mass of the Pop II stars exceeds that of Pop III stars. In four out of the five runs the transition epoch is around , while in the M8run-3 the mass in Pop II stars falls short of the Pop III stellar mass even at . The epochs of the Pop III to II transition are presented in Table 1.
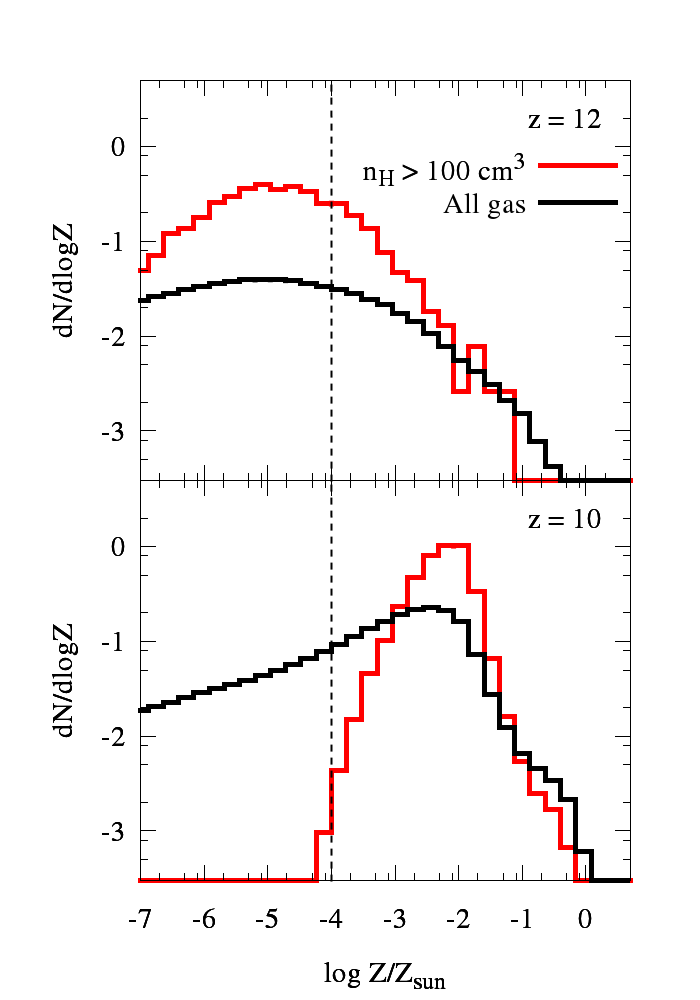
As seen in Fig. 1, most of the zoom-in volume is filled with metal-enriched gas by the time . To understand the transition of the stellar population in more detail, we show the probability density function (PDF) for the gas metallicity in Fig. 4. At (upper panel), the metallicity has a broad distribution and some gases have such high metallicity as . Note also that some dense gases (with , solid lines) already have metallicity exceeding the critical value of . By (lower panel), most of minihaloes in the zoom-in region have been merged into the main progenitor and most of star formation takes place there. At this epoch, more than 99 percent of high-density gases have super-critical metallicity. Consequently, although gases with sub-critical metallicity still survive in the IGM, the mode of star formation completely shifts from Pop III to Pop II.
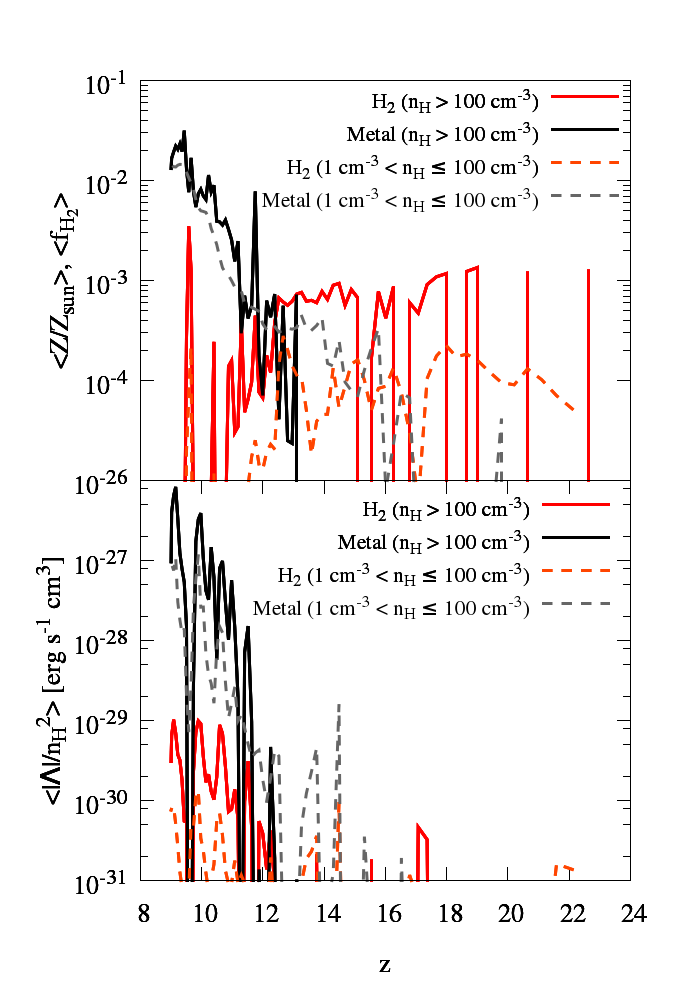
In the top panel of Figure 5, the mass-weighted mean fraction and metallicity in high-density gases () in the M8run are shown as a function of redshift. We also display the mass-weighted cooling rate of and the net cooling rate of metals in the bottom panel. In early stages before , the fraction has a high value of in the high-density regions and the is the major coolant. Then, at , the mean metallicity reaches and the metal cooling becomes as important as that by . As the star formation proceeds, the metallicity increases and Pop II stars form mainly via the metal cooling.
| run ID | |||||||||
|---|---|---|---|---|---|---|---|---|---|
| M8run (fiducial run) | 9.0 | 12 | 66 | 11.1 | |||||
| M8run-2 | 9.0 | 12 | 66 | 9.7 | |||||
| M8run-3 | 9.0 | 12 | 66 | - | - | ||||
| M8run-4 | 9.0 | 12 | 66 | 9.5 | |||||
| M8run-5 | 9.0 | 12 | 66 | 10.5 | |||||
| M9run | 9.0 | 12 | 66 | 13.3 | |||||
| M9runH | 9.9 | 60 | 330 | 15.5 | |||||
| M8run-flat | 9.0 | 12 | 66 | - | - | 48 | |||
| M8run-noLW | 9.0 | 12 | 66 | 10.7 | |||||
| M8run-lowZcr | 9.0 | 12 | 66 | 11.3 |
3.2 Halo mass dependence
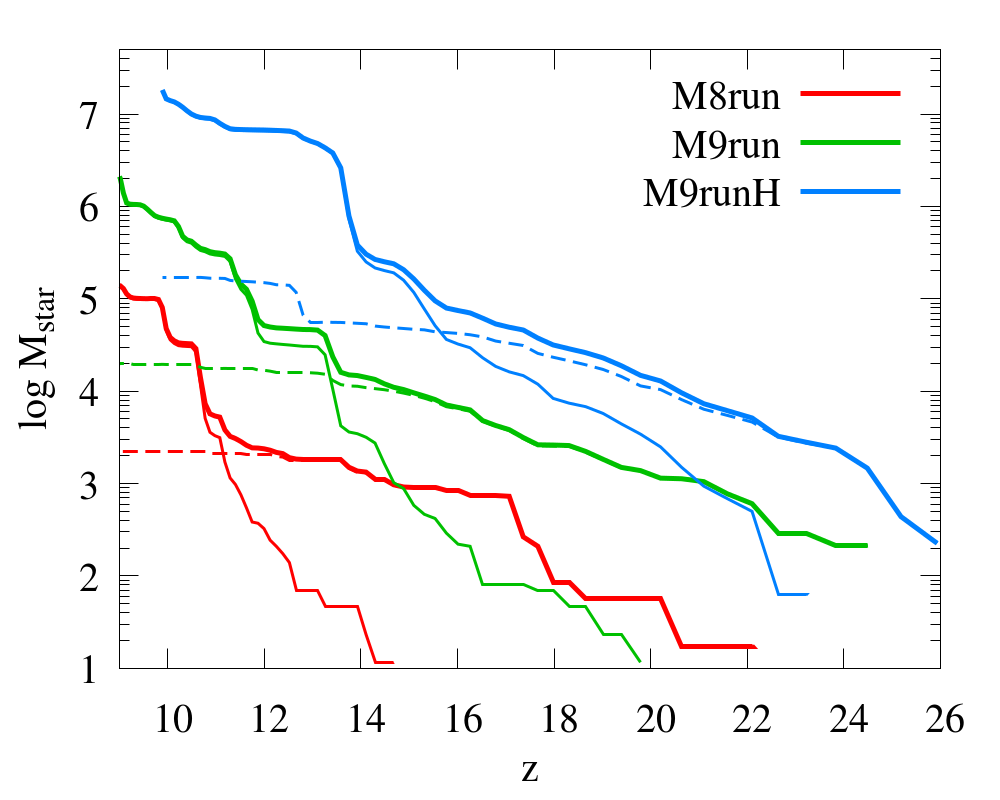
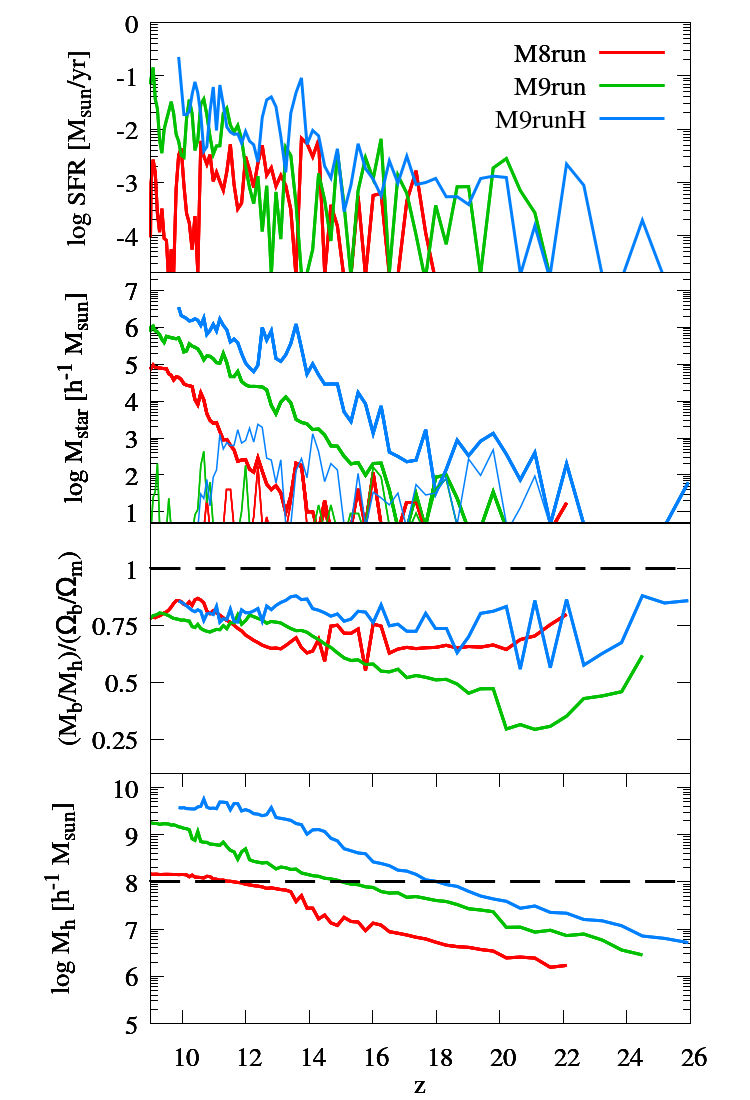
In Fig. 6, we compare the star formation histories in three runs, M8run, M9run and M9runH. As seen in the figure, the Pop III to II transition redshift tends to be earlier with increasing final halo mass since the halo growth and metal enrichment take place faster. We find that the transition epochs are and for M9run and M9runH, respectively (table 1). The growth of the main progenitors in M8run, M9run and M9runH is shown in Fig. 7. We see in the bottom panel of Fig. 7, halo masses of the main progenitor in M9run and M9runH reach at and , respectively. We also see in the second and bottom panels of Fig. 7 that the stellar masses rapidly increase once the halo masses reach corresponding to the atomic-cooling halo mass. Because of deep gravitational potential wells, the atomic-cooling haloes can keep gas in the face of single SN explosion with . Therefore, those haloes can form stars continuously with . One can regard this phase as the birth of the first galaxies. In our models, the main-progenitor haloes of M8run, M9run, M9runH continuously show star formation after and 21.1, and the corresponding halo masses are and , respectively.
During the early stages, the gaseous content ( see third panel) in the main-progenitor haloes decreases significantly due to star formation and the associated feedback. However, the haloes recover the gas as the system grows with time. In all the three runs, the baryonic fraction of the first galaxies becomes of the cosmic mean value by = 10, and the main progenitor haloes reach the phase in which Pop II stars continue to form steadily.
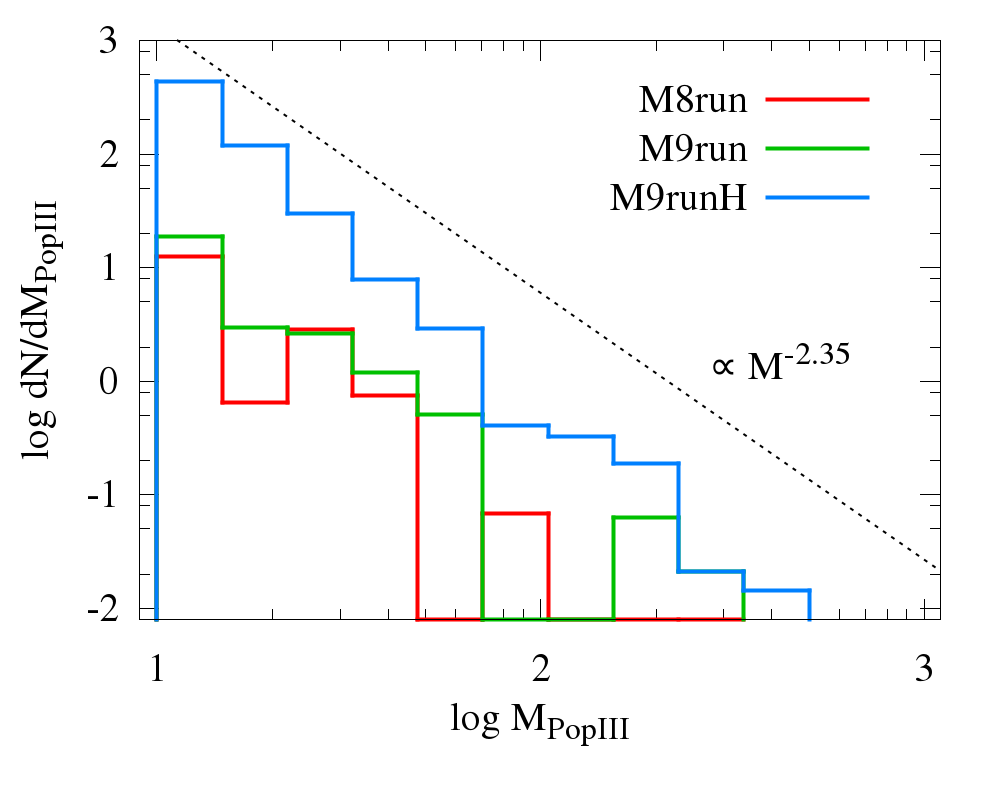
Note that, the first galaxies continue to form Pop III stars along with Pop II stars, as shown by the thin line in the second panel of Fig. 7. This suggests that metal mixing is not completed and pockets of pristine gas survive. In Fig. 8, we show the mass distribution of all the Pop III stars ever formed in the first galaxies. Although the mass spectra almost follow the assumed Pop III IMF, no star is formed with a mass higher than in the M8run because of the small number of stars. In the cases of M9run and M9runH, some massive Pop III stars, which eventually explode as either core-collapse or pair-instability SNe, are formed according to the assumed IMF. Using our Pop III IMF, the released energy per unit stellar mass is estimated as , which is times larger than that of a Pop II star cluster. This suggests the importance of Pop III stellar feedback in controlling the gas dynamics in those haloes if Pop III stars account for percent of the total stellar content. Pop III feedback, however, would play a role only in the early stage of galaxy evolution since the mass fraction in Pop III stars rapidly decreases as metal enrichment proceeds. Recall that the metal transport among gas particles is not considered in our calculation. More efficient metal mixing would reduce the mass fraction of Pop III stars in the later stage. Our estimate should be regarded as the upper limit in this sense.
As seen in the top-panel in Fig. 7, star formation occurs intermittently in all three runs. Such intermittency has been reported for low-mass galaxies by theoretical studies (e.g., Davis et al., 2014; Yajima et al., 2017). This studies claim that the SN feedback evacuates the gas from the galaxy after starburst, thereby quenching subsequent star formation episode. However, the evacuated gas may fall back to the galaxy after some interval and another episode of starburst may be triggered. In our simulations, the SFR is higher with increasing halo mass and reaches at and in M9runH, and in M9run. Those starburst galaxies are prime targets for future observations by such telescopes as JWST. We will discuss the observability of the first galaxies later in §5.
4 Effect of different model assumptions
4.1 Pop III IMF
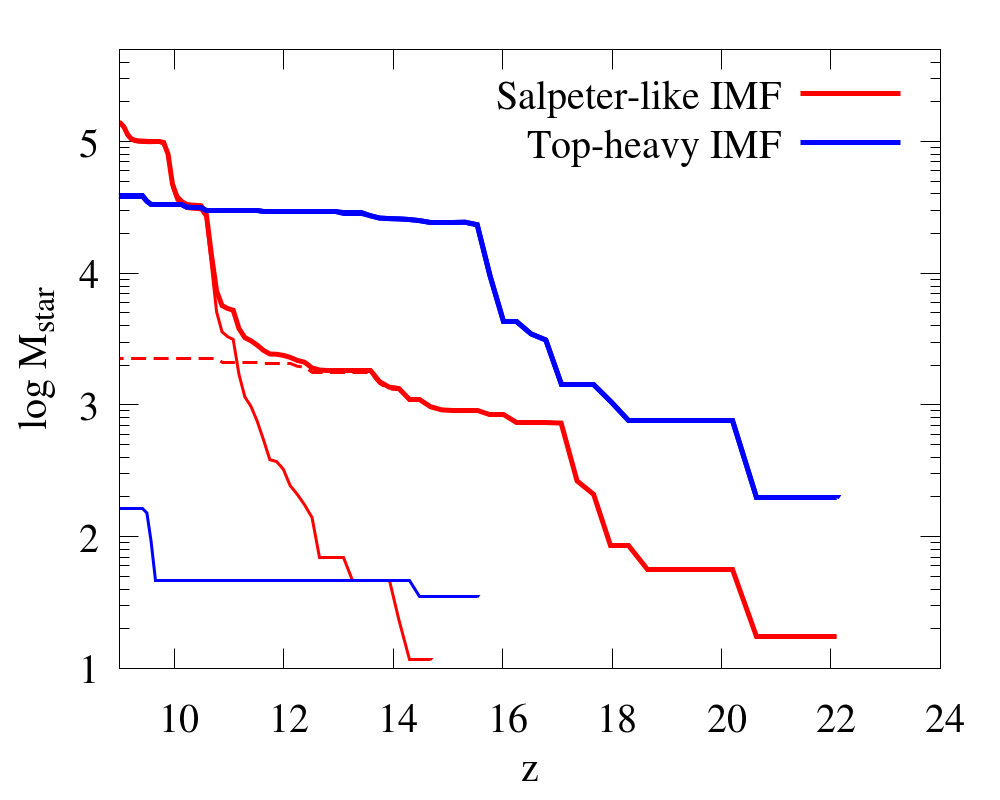
As seen in §3.1, the gas in the minihalo hosting a Pop III star will be metal-enriched and evacuated by its SN explosion. Some of the metal-enriched gas re-accretes onto the halo. Therefore, physical conditions in the first galaxies are affected by the statistical nature of Pop III stars (Chen et al., 2020). In particular, frequency of SNe strongly depends on the mass spectrum of the Pop III stars. However, the IMF of Pop III stars is not firmly constrained yet (e.g., Susa, 2013; Stacy & Bromm, 2014; Susa et al., 2014). In this section, we investigate the impact of different Pop III IMFs on the first galaxies. In addition to the fiducial Salpeter-like IMF (), we also consider a flat IMF with in the same mass range as yet another example (M8run-flat). The event ratios of the CCSNe and PISNe are for the Salpeter-like IMF, while for the flat IMF. The released energy by SNe per unit stellar mass is similar: for the Salpeter-like IMF and for the flat IMF.
Fig. 9 shows the time evolution of the stellar masses for the different IMF models. During the early Pop III phase, the flat IMF run exhibits higher cumulative stellar mass since massive Pop III stars tend to be formed compared to the case with the Salpeter-like IMF. However, star formation becomes inefficient (i.e., flattened SFH) at . In the flat IMF run, a large fraction of massive Pop III stars explode as PISNe, releasing energy 100 times higher than that of CCSNe. In this case, a large amount of gases are evacuated from the host minihaloes with high velocities of as shown in Figure 2. Part of the outflowing gas sweeps up the surrounding medium and escapes from the gravitational potential well of the haloes. Considering that a fraction of the SN energy is converted into kinetic energy of the gas in a minihalo, the total momentum is estimated as where is the conversion rate from thermal to kinetic energy. The outflowing gas is likely to propagate through the IGM conserving the momentum. The propagation speed stays at within at ( in comoving scale), which is close to the circular velocity of the first galaxies at . In the case of the top-heavy IMF model, 31 PISNe explode by . Therefore, the fallback of the gas within the physical volume of onto the first galaxies is unlikely.
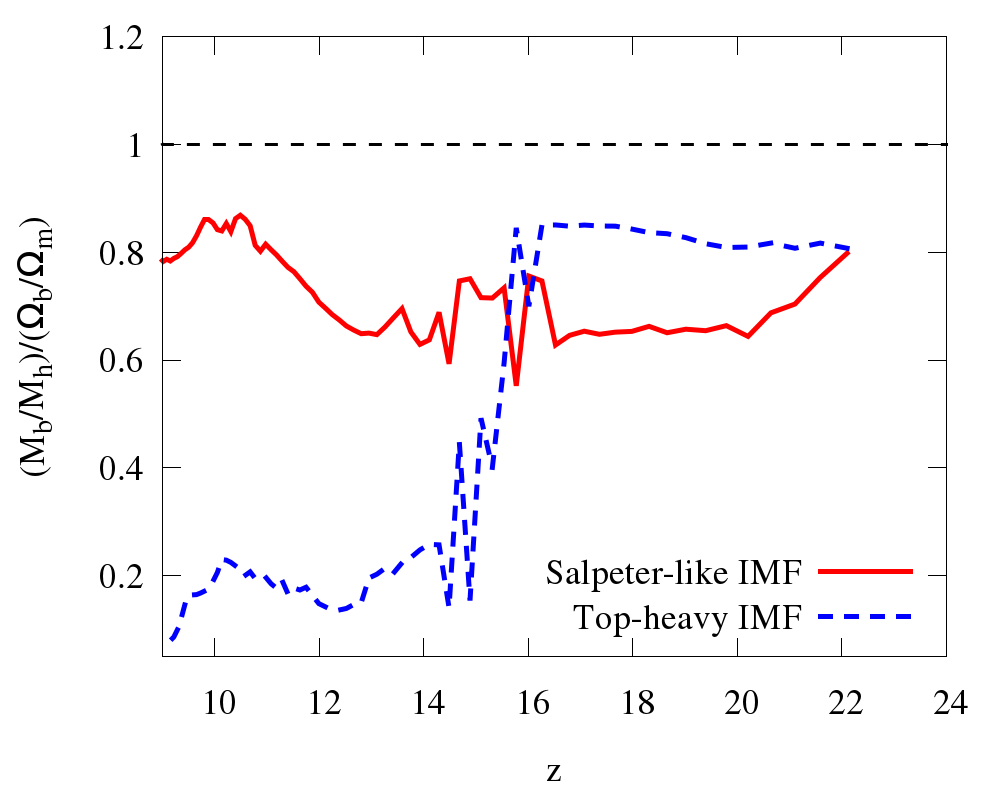
Fig. 10 shows the time evolution of the baryonic fraction in the main progenitors relative to the cosmic mean in the cases with the top-heavy and Salpeter IMFs. Because of the evacuation by SNe, the first galaxies have a low gas content in the case of the top-heavy IMF , with of the cosmic mean at , while it is in the fiducial case. In the top-heavy IMF case, the stellar mass in Pop III stars increases rapidly at and reaches more than (Fig. 9). Therefore PISNe explode and evacuate both the ISM in the halo and surrounding IGM. In this simulation, SNe occurs only in less than half the minihaloes either because formed massive Pop III stars directly collapse to BHs without explosion or star formation is prohibited by the LW radiation. Interestingly, we find that multiple PISNe strip gases of nearby minihaloes in which no SN occurs. With little Pop II star formation due to a small amount of remaining gas in the galaxy, the Pop III to II transition does not take place by the end of simulation at in the case of the top-heavy Pop III IMF.
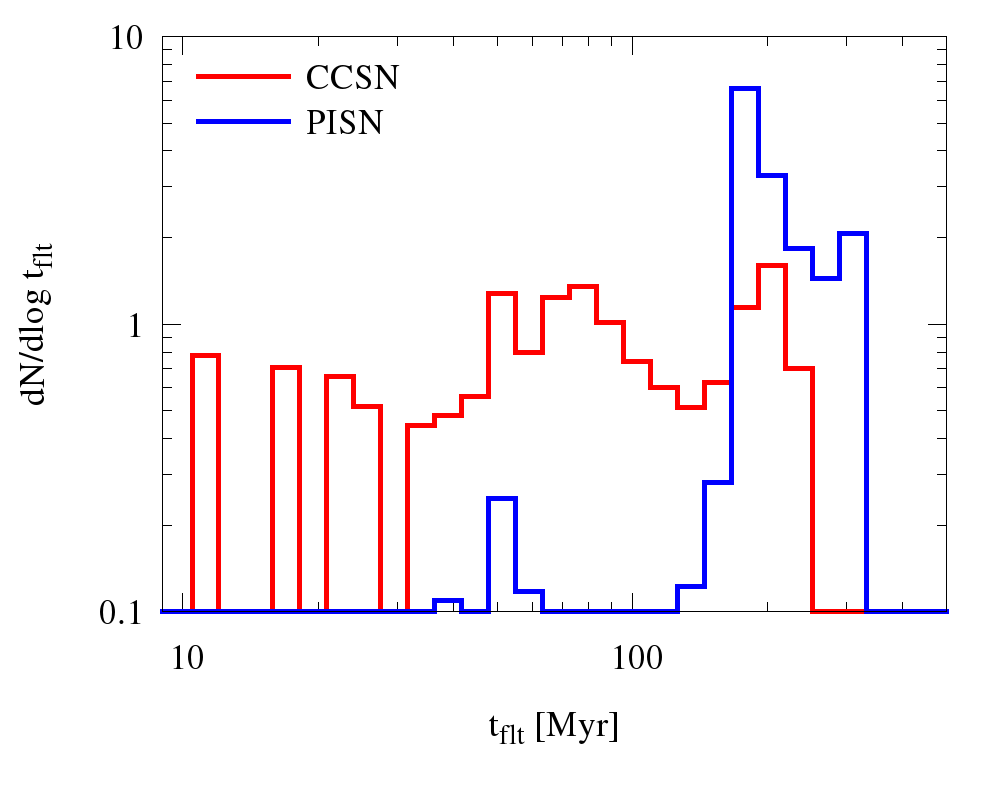
A small fraction of the gas evacuated from minihaloes re-accretes onto the galaxy after a long time delay, . Figure 11 shows the distributions of the floating time of the SPH particles. We estimate the floating time by measuring the duration from the time evacuated from minihaloes until they re-enter within the virial radius of the (now grown-up) galaxy. Jeon et al. (2014) showed that the floating time strongly depends on the type of SNe and could be longer than for PISNe. Next we see the dependence of the floating time on the shape of the IMF. In the fiducial run, the floating time distributes in a wide range from to . Most of the gas evacuated by CCSNe re-accretes onto the galaxy. However, there are some variations in the distance from the parental minihaloes to the eventual formation site of the galaxy. This causes the observed wide distribution. In addition, a fraction of long-traveling gas particles with are due to PISNe. With the top-heavy IMF, the distribution concentrates around . This indicates that even the gas in minihaloes locating near the formation site of the galaxy can travel out of its gravitational potential well. Later, a fraction of the escaping gas re-accretes onto the galaxy when the halo mass reaches . On the other hand, most of the gas reaches far from the virial radius of the halo at , although this material may eventually fall back when the galaxy becomes even more massive at later epoch.
4.2 Lyman-Werner radiation feedback
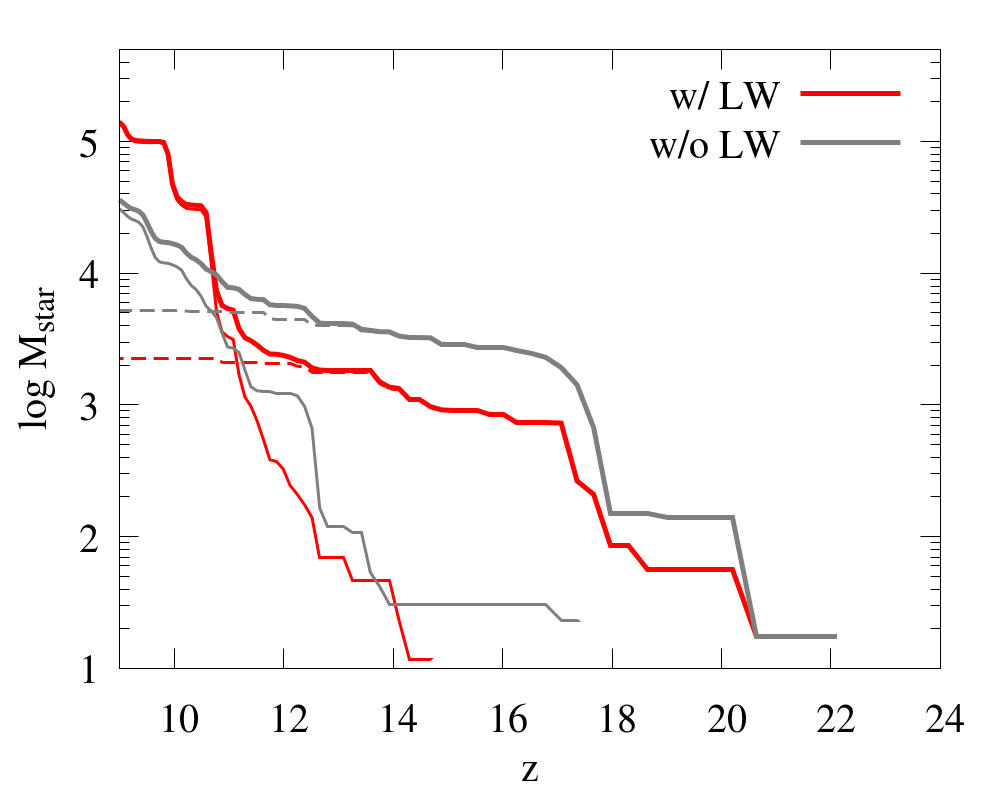
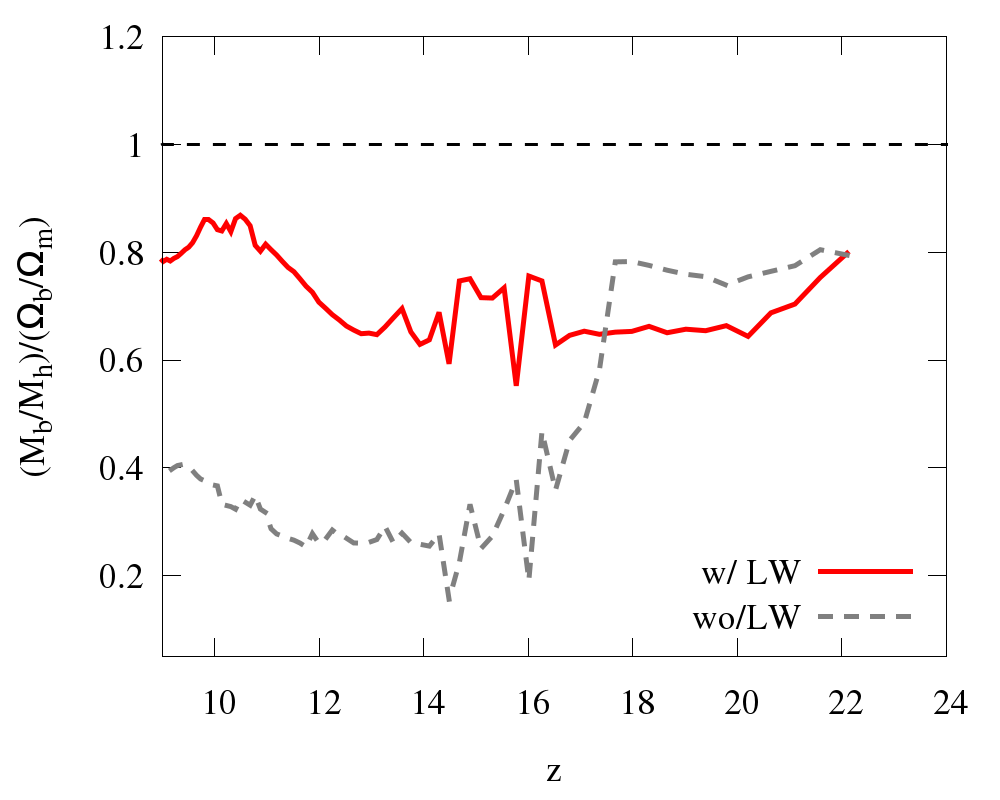
LW radiation feedback can play an important role in determining the cosmic star formation history in the early Universe. In particular, the collapse of gas in minihaloes is suppressed due to the lack of cooling (Haiman et al., 1997). Johnson et al. (2013) showed that the LW feedback reduces the cosmic SFR density of Pop III stars by a factor of a few. Here we investigate the impact of LW feedback on the formation of the first galaxies. Figure 12 shows the time evolution of the total stellar masses. We find that the Pop III star formation starts to be suppressed at . The number of minihaloes hosting Pop III stars is percent of that in the case without the LW feedback. It is known that star formation is suppressed in minihaloes exposed to the LW flux with , where is the mean intensity of the background radiation in the unit of (e.g., Latif & Khochfar, 2019; Wise et al., 2019). In our model, a Pop III star of emits , where is the physical distance from the star to a neighbouring halo. Since the typical separation between minihaloes is at , even a single Pop III star can suppress the star formation in neighbouring minihaloes (Agarwal et al., 2012, 2019). Interestingly, once Pop II stars start to form in the first galaxies, the star formation rate becomes higher than that for the the case without the LW feedback, resulting in the total stellar mass twice higher at . This is induced by more frequent Pop III SNe in the case without the LW feedback (see also Johnson et al., 2013).
In Fig. 13, we show the time evolution of the baryonic fraction in the main progenitors. Without LW feedback, as the Pop III SFR increases at , the baryonic fraction decreases significantly, resulting in of the cosmic mean. In this case, most of the minihaloes host Pop III stars and percent of Pop III stars explode as SNe at the end of their lifetime. Therefore most of the minihaloes becomes deprived of the gas while the dark matter continues to accrete onto them. In the case with LW feedback, the baryonic fraction stays high () because some gas-rich minihaloes merge with the galaxy. Gas rich infall induces starbursts at . This shows that the LW feedback is not only important in regulating Pop III star formation, but also has impact on the evolution of the first galaxies.
4.3 Pop III-II critical metallicity
Thermal evolution of collapsing gas clouds sensitively depends on the metallicity (Omukai, 2000; Omukai et al., 2005, 2010). Dust and C/O metals can be efficient coolants and induce fragmentation of the clouds. In a cold metal-enriched gas, the accretion rate onto a formed protostar is lower than in the primordial gas, resulting in the formation of lower-mass stars. Previous studies have argued that low-mass Pop II-star formation occurs if the metallicity exceeds (e.g., Frebel et al., 2007; Johnson et al., 2013, our fiducial), or possibly due to the efficient dust cooling (Schneider et al., 2003, 2006, 2012).
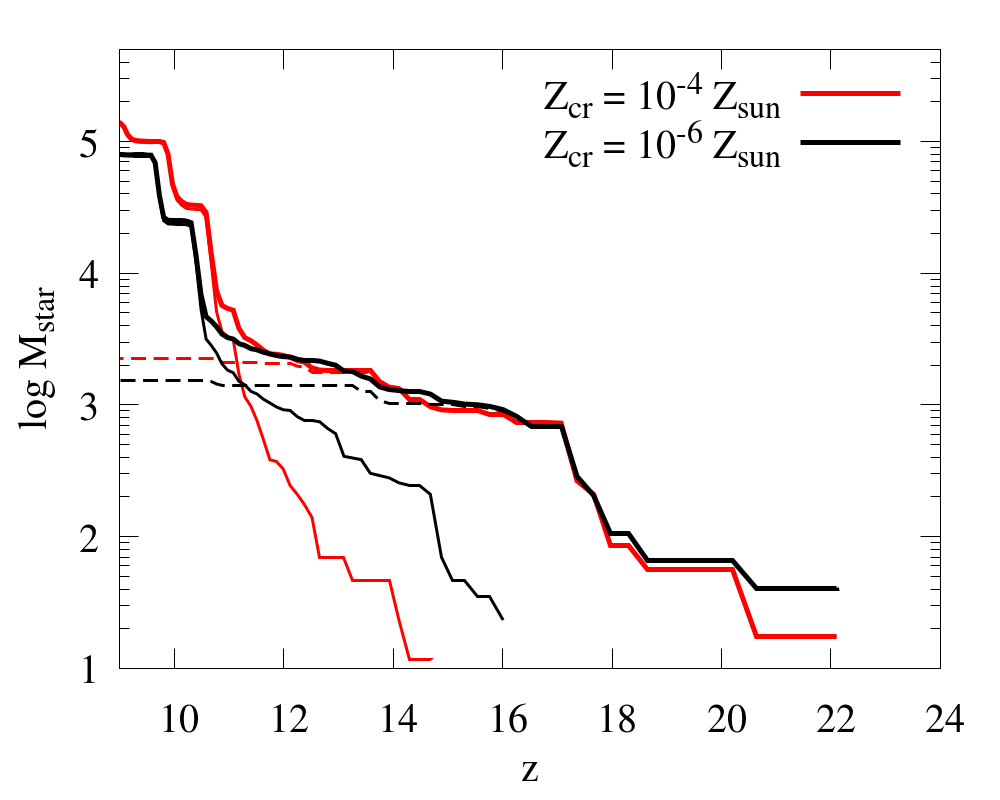
We investigate the impact of the different choices of critical metallicity on the star formation history by performing additional simulations of the M8run with a critical metallicity of above which Pop II stars form (M8run-lowZcr). Fig. 14 shows the star formation histories for the two values of the critical metallicity. In the case of , the transition from Pop III to II stars occurs earlier at , while the transition redshift is in the fiducial run . This is consistent with the result of numerical simulations by Maio et al. (2010). However, the difference in the total mass of Pop III stars formed is not significant, and only amounts to percent. If a Pop III star ends as a CCSN, the surrounding gas becomes highly metal-enriched. Accretion of the metal-enriched gas rapidly enhances the metallicity in the haloes. In the fiducial M8run, the time interval of the metallicity increasing from to is quite short . As shown in the previous section, star formation in the main progenitor proceeds episodically due to stellar feedback. During those , only a few star formation events occur. This suggests that the star formation history and the formation of the first galaxies are not very sensitive to the detailed value of the critical metallicity (Maio et al., 2010).
5 Observability of first galaxies
First galaxies will be main targets of future observational missions via UV continuum, and line emission, especially the Near Infrared Camera (NIRCam), Mid Infrared Instrument (MIRI) and Near Infrared Spectrograph (NIRSpec) on board JWST. Here we estimate the UV continuum and / line fluxes by post-processing and discuss the observability by JWST.
The intrinsic H and Ly luminosities are calculated by summing up the emissivity of each SPH particle in the galaxy as
| (8) |
and
| (9) |
where and are the gas density and mass of -th SPH particles, and are the emission coefficient of each line, and indicate the ionized hydrogen and electron number densities respectively. We consider the ionization structure of the ISM calculated on the fly in the simulations. The spectral energy distribution (SED) of the galaxy is modeled by using starburst99 (Leitherer et al., 1999). First, we generate a table of SEDs for different metallicities (0.0004, 0.004, 0.008, 0.02, 0.05) and ages assuming an instantaneous starburst model with the Kroupa IMF (Kroupa, 2001). We pick the SED of a star particle considering its age and metallicity and compute the integrated SED for the whole galaxy. Here, we do not take into account the intrinsic nebular line emissions.
Following Pawlik et al. (2011), we calculate the flux densities of H and lines and UV continuum as
| (10) | |||||
| (11) | |||||
and
| (12) | |||||
where is the speed of light, is the luminosity distance and is the luminosity density of UV continuum at the wavelength of 1500 Å.
Fig. 15 shows the time evolution of UV continuum, H and flux densities (, and ) of first galaxies with the different masses.
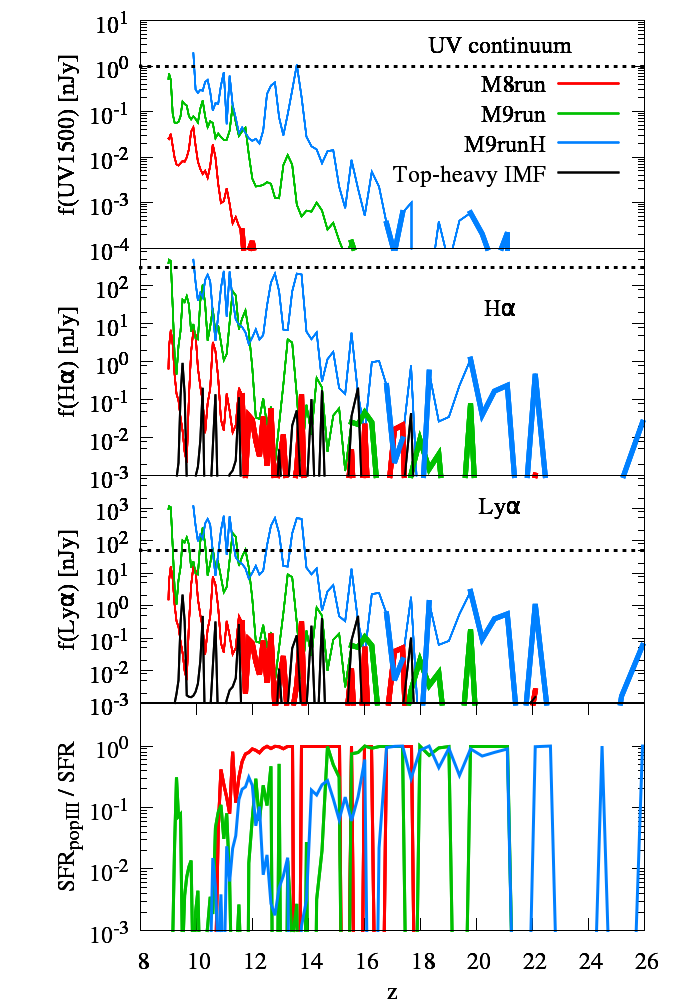
The photons are emitted from Hii regions created by young massive stars, while the UV continuum also mainly emitted by the same population. Therefore, the flux densities in Fig. 15 reflects the instantaneous star formation activity. As seen in the Fig. 7, the star formation in first galaxies takes place intermittently due to the stellar feedback. Correspondingly, the flux densities violently fluctuate in time, as also found by Jeon & Bromm (2019). The dotted lines in Fig. 15 denote the detection limit for MIRI and NIRCam onboard JWST assuming the exposure time of s and a signal-to-noize ratio S/N = 10. We see in the figure that H line, Ly line emissions and UV continuum exceed the detection limit at in the M9runH. In this phase, the starburst takes place with SFR and the stellar mass is exceeding . To observationally confirm the redshift of the galaxy, detection of H/Ly lines and UV continuum is preferable. We suggest that future observations would be able to observe first galaxies with stellar mass beyond redshift . On the other hand, even JWST cannot detect first galaxies in early phases of their evolution with stellar mass . Interestingly, even at , the Pop III star formation rate accounts for of the total star formation rate in the M9run. Thus, Pop III stars make an important contribution to the observable UV fluxes from the first galaxies. As for the Ly emission, there are uncertainties due to the resonant scattering nature and the IGM transmission (Laursen et al., 2011, 2019; Yajima et al., 2012b, 2014, 2015). In Fig. 15, we assume that all Ly photons escape from the galaxies and penetrate into the IGM. Before cosmic reionization is completed, development of a giant Hii bubble () around the galaxy is required for a high IGM transmission (Yajima et al., 2018). Thus, shown in Fig. 15 is the upper limit of the emergent Ly flux. Note, however, that we confirm that the flux density exceeds the detection limit at in the M9runH, even if the flux is decreased by multiplying a factor 0.1, corresponding to a low IGM transmission. Therefore, the Ly line might be a powerful tool to detect the first galaxies at . Note that, as described in §4.1, star formation history significantly depends on the Pop III IMF. We overplot the flux densities of the Top-heavy IMF run in Fig. 15. Due to inactive star formation, the flux densities are significantly lower than that in the fiducial run. Therefore, future statistical observational studies of the first galaxies might be able to constrain the IMF of Pop III stars. In a future work, we plan to investigate the relation between the observational properties of first galaxies and the IMFs of Pop III stars with a larger number of galaxy samples.
6 Discussion
In this study, we have modelled the formation of individual Pop III stars in minihaloes by taking into account the feedback from Pop III stars in the course of the build-up of first galaxies. For the photo-ionization feedback, we have estimated the size of an ionized region by the balance between the total recombination rate in the region with the ionizing photon emissivity from the star (Eq 5). This method cannot capture the radiative transfer effect in inhomogeneous density fields, such as the shadowing effect, i.e., shielding of the gas behind a dense clump from the ionizing radiation (e.g. Susa & Umemura, 2006; Yajima et al., 2012a). If such an effect is properly included, star formation could continue in the shadowed region.
In addition, X-rays from high-mass X-ray binaries (HMXBs) or isolated black-hole (BH) remnants of Pop III stars, which are not taken into account in this work, may change the star formation histories in the first galaxies. For instance, Jeon et al. (2012) investigated the impact of X-ray feedback on the formation of the first galaxies and found that radiation feedback from isolated BHs and HMXBs suppressed the local star formation significantly. Intriguingly, they also observed that the HMXBs enhanced Pop III star formation in nearby minihaloes by inducing molecular hydrogen formation. In §4.2, we saw that efficient star formation in minihaloes and the resultant frequent SNe from Pop III stars evacuate the gas and reduce the star formation rate in the first galaxies. Some of those Pop III stars would evolve into the HMXBs and X-rays from them can be a key factor to understand the early phase of the first galaxies, although the feedback strength suffers large uncertainties in IMF and binary fraction of Pop III stars.
Our current simulations do not have enough resolution to follow the star formation within a small scale of , and ab initio calculations of individual star formation as well as binary formation are beyond the scope of this study. Instead, we have assumed a simple power-law IMF and determined the mass of individual Pop III stars by random sampling with the weight of the IMF. On the other hand, the shape and mass range of the IMF are still under debate and can be different from ours. For instance, Hirano et al. (2015) predicted a double-peak IMF with the mass range of . With this IMF, PISNe occur more frequently compared to our fiducial simulations and the gas evacuation by the explosions would result in the formation of gas-deprived first galaxies as discussed in §4.1. Hirano et al. (2015) also found a relatio between the mass of forming Pop III stars and the local gas infall rate in a minihalo, as well as the external UV radiation field. We can evaluate the gas infall rate in a minihalo even with our current resolution and we plan to study Pop III star formation by using more physically motivated relation between the mass and infall rate in a future work.
Recently, Sugimura et al. (2020) investigated the formation of binary/multiple Pop III stars via fragmentation of a circumstellar disk by performing high-resolution radiation hydrodynamics simulations. They observed the formation of a Pop III stellar system consisting of a wide binary of 60 and 70 and smaller mass () companion stars . If such binary/multiple stellar systems are more common than isolated stars and the IMF is quite different from that assumed here, physical properties of the first galaxies can largely differ from our simulations.
Currently, even state-of-the-art simulations of galaxy formation cannot resolve individual supernova remnants. Therefore, various models of the SN feedback have been proposed so far (Springel, 2005b; Stinson et al., 2006; Dalla Vecchia & Schaye, 2012; Kimm & Cen, 2014). Predicted properties of the first galaxies depends on the adopted feedback prescription. We have adopted the stochastic thermal feedback model, which successfully produce galactic outflows by overcoming the over-cooling problem (e.g, Katz et al., 1996). We observed a clumpy gas structure and intermittent star formation history in the first galaxies (see also Jeon & Bromm, 2019). On the other hand, previous studies with different feedback models instead found a long-standing disk structure and continuous star formation (Pawlik et al., 2011, 2013; Ricotti et al., 2016). As discussed in Section 5, future observations would be able to detect first galaxies only during the starburst phase. The duty cycle of the starburst is likely to depend on the feedback process as well as the IMF of Pop III stars. Therefore, future observations combined with theoretical studies might constrain statistically reasonable numerical treatment of SN feedback.
7 Conclusions
With cosmological hydrodynamic simulations, we have investigated the formation of the first galaxies that reaches the halo masses of at under the influence of feedback from forming Pop III stars. The high resolution of the simulations allows us to follow the formation of minihaloes hosting Population III (Pop III) stars and metal enrichment of the inter-galactic medium (IGM) via their supernova (SN) explosions. Our major findings can be summarised as follows:
-
•
The star formation history in the first galaxies depends sensitively on the assumed initial mass function of Pop III stars. The dominant stellar population shifts from Pop III to Pop II stars at in the case of the power-law Pop III IMF, with the mass range .
-
•
In the case of a flat top-heavy IMF, frequent pair-instability SNe evacuate the gas from the host halo of a first galaxy. This leads to the formation of a gas-deprived galaxy, where the subsequent Pop II star formation is strongly suppressed.
-
•
First galaxies are bright in the UV continuum and hydrogen Ly and H recombination lines during their starburst phases. James Webb Space Telescope will be able to detect both UV, Ly and H fluxes from the first galaxies with the halo mass at redshift as high as .
-
•
Lyman-Werner (LW) radiation from Pop III stars affects properties of the first galaxies. Without the LW radiation feedback, Pop III stars would be formed in most of the minihaloes, whose gas is evacuated by the subsequent SN explosions, and the total gas mass in the forming galaxy would be times smaller than that in the case with LW radiation feedback.
In this work, we have shown that physical nature of the first galaxies is affected by previous episodes of Pop III star formation. Upcoming telescopes, including JWST or 30-m class telescopes will be able to detect these first galaxies and shed light on the first generation of stars.
Acknowledgments
The authors wish to express their cordial thanks to our most revered mentor, Prof. Masayuki Umemura, President of Astronomical Society of Japan, for his continuous interest and advice. The authors also thank to Ken Ohsuga, Masao Mori and Hajime Fukushima for useful discussions. The numerical simulations were performed on the computer cluster, XC50 in NAOJ, and Trinity at Center for Computational Sciences in University of Tsukuba. This work is financially supported by the Grants-in-Aid for Basic Research by the Ministry of Education, Science and Culture of Japan (HY:17H04827, 20H04724, 21H04489, KO:25287040, 17H01102, 17H02869), National Astronomical Observatory of Japan (NAOJ) ALMA Scientific Research Grant Number 2019-11A, JST FOREST Program, Grant Number JPMJFR202Y (HY). CDV acknowledges support through grants RYC-2015-18078 and PGC2018-094975-C22 from the Spanish Ministry of Science and Innovation.
Data availability
The data underlying this article will be shared on reasonable request to the corresponding author.
References
- Abel et al. (2002) Abel T., Bryan G. L., Norman M. L., 2002, Science, 295, 93
- Agarwal et al. (2019) Agarwal B., Cullen F., Khochfar S., Ceverino D., Klessen R. S., 2019, MNRAS, 488, 3268
- Agarwal et al. (2014) Agarwal B., Dalla Vecchia C., Johnson J. L., Khochfar S., Paardekooper J.-P., 2014, MNRAS, 443, 648
- Agarwal et al. (2012) Agarwal B., Khochfar S., Johnson J. L., Neistein E., Dalla Vecchia C., Livio M., 2012, MNRAS, 425, 2854
- Ahn et al. (2015) Ahn K., Xu H., Norman M. L., Alvarez M. A., Wise J. H., 2015, ApJ, 802, 8
- Bromm et al. (2002) Bromm V., Coppi P. S., Larson R. B., 2002, ApJ, 564, 23
- Bromm et al. (2001) Bromm V., Kudritzki R. P., Loeb A., 2001, ApJ, 552, 464
- Bromm & Yoshida (2011) Bromm V., Yoshida N., 2011, ARA&A, 49, 373
- Chen et al. (2020) Chen L.-H., Chen K.-J., Tsai S.-h., Whalen D., 2020, arXiv e-prints, arXiv:2010.02212
- Chen et al. (2014) Chen P., Wise J. H., Norman M. L., Xu H., O’Shea B. W., 2014, ApJ, 795, 144
- Chiaki et al. (2018) Chiaki G., Susa H., Hirano S., 2018, MNRAS, 475, 4378
- Chon et al. (2016) Chon S., Hirano S., Hosokawa T., Yoshida N., 2016, ApJ, 832, 134
- Clark et al. (2011a) Clark P. C., Glover S. C. O., Klessen R. S., Bromm V., 2011a, ApJ, 727, 110
- Clark et al. (2011b) Clark P. C., Glover S. C. O., Smith R. J., Greif T. H., Klessen R. S., Bromm V., 2011b, Science, 331, 1040
- Couchman & Rees (1986) Couchman H. M. P., Rees M. J., 1986, MNRAS, 221, 53
- Dalla Vecchia & Schaye (2012) Dalla Vecchia C., Schaye J., 2012, MNRAS, 426, 140
- Davis et al. (2014) Davis A. J., Khochfar S., Dalla Vecchia C., 2014, MNRAS, 443, 985
- Frebel et al. (2007) Frebel A., Johnson J. L., Bromm V., 2007, MNRAS, 380, L40
- Glover & Brand (2001) Glover S. C. O., Brand P. W. J. L., 2001, MNRAS, 321, 385
- Greif et al. (2010) Greif T. H., Glover S. C. O., Bromm V., Klessen R. S., 2010, ApJ, 716, 510
- Hahn & Abel (2011) Hahn O., Abel T., 2011, MNRAS, 415, 2101
- Haiman et al. (1997) Haiman Z., Rees M. J., Loeb A., 1997, ApJ, 476, 458
- Haiman et al. (1996) Haiman Z., Thoul A. A., Loeb A., 1996, ApJ, 464, 523
- Hasegawa et al. (2009) Hasegawa K., Umemura M., Kitayama T., 2009, MNRAS, 397, 1338
- Heger & Woosley (2002) Heger A., Woosley S. E., 2002, ApJ, 567, 532
- Hicks et al. (2020) Hicks W., Wells A., Norman M. L., Wise J. H., Smith B. D., O’Shea B. W., 2020, arXiv e-prints, arXiv:2009.05499
- Hirano et al. (2015) Hirano S., Hosokawa T., Yoshida N., Omukai K., Yorke H. W., 2015, MNRAS, 448, 568
- Hirano et al. (2014) Hirano S., Hosokawa T., Yoshida N., Umeda H., Omukai K., Chiaki G., Yorke H. W., 2014, ApJ, 781, 60
- Jeon & Bromm (2019) Jeon M., Bromm V., 2019, MNRAS, 485, 5939
- Jeon et al. (2015) Jeon M., Bromm V., Pawlik A. H., Milosavljević M., 2015, MNRAS, 452, 1152
- Jeon et al. (2014) Jeon M., Pawlik A. H., Bromm V., Milosavljević M., 2014, MNRAS, 444, 3288
- Jeon et al. (2012) Jeon M., Pawlik A. H., Greif T. H., Glover S. C. O., Bromm V., Milosavljević M., Klessen R. S., 2012, ApJ, 754, 34
- Johnson et al. (2013) Johnson J. L., Dalla Vecchia C., Khochfar S., 2013, MNRAS, 428, 1857
- Katz et al. (1996) Katz N., Weinberg D. H., Hernquist L., 1996, ApJS, 105, 19
- Kimm & Cen (2014) Kimm T., Cen R., 2014, ApJ, 788, 121
- Kroupa (2001) Kroupa P., 2001, MNRAS, 322, 231
- Lada & Lada (2003) Lada C. J., Lada E. A., 2003, ARA&A, 41, 57
- Latif & Khochfar (2019) Latif M. A., Khochfar S., 2019, MNRAS, 490, 2706
- Laursen et al. (2019) Laursen P., Sommer-Larsen J., Milvang-Jensen B., Fynbo J. P. U., Razoumov A. O., 2019, A&A, 627, A84
- Laursen et al. (2011) Laursen P., Sommer-Larsen J., Razoumov A. O., 2011, ApJ, 728, 52
- Leitherer et al. (1999) Leitherer C., Schaerer D., Goldader J. D., Delgado R. M. G., Robert C., Kune D. F., de Mello D. F., Devost D., Heckman T. M., 1999, ApJS, 123, 3
- Ma et al. (2020) Ma X., Quataert E., Wetzel A., Hopkins P. F., Faucher-Giguère C.-A., Kereš D., 2020, arXiv e-prints, arXiv:2003.05945
- Maio et al. (2010) Maio U., Ciardi B., Dolag K., Tornatore L., Khochfar S., 2010, MNRAS, 407, 1003
- Maio et al. (2011) Maio U., Khochfar S., Johnson J. L., Ciardi B., 2011, MNRAS, 414, 1145
- Nakamura & Umemura (2001) Nakamura F., Umemura M., 2001, ApJ, 548, 19
- Omukai (2000) Omukai K., 2000, ApJ, 534, 809
- Omukai et al. (2010) Omukai K., Hosokawa T., Yoshida N., 2010, ApJ, 722, 1793
- Omukai & Nishi (1998) Omukai K., Nishi R., 1998, ApJ, 508, 141
- Omukai & Nishi (1999) —, 1999, ApJ, 518, 64
- Omukai et al. (2005) Omukai K., Tsuribe T., Schneider R., Ferrara A., 2005, ApJ, 626, 627
- O’Shea et al. (2015) O’Shea B. W., Wise J. H., Xu H., Norman M. L., 2015, ApJ, 807, L12
- Paardekooper et al. (2013) Paardekooper J.-P., Khochfar S., Dalla Vecchia C., 2013, MNRAS, 429, L94
- Paardekooper et al. (2015) —, 2015, MNRAS, 451, 2544
- Panagia (2005) Panagia N., 2005, Detecting Primordial Stars, Corbelli E., Palla F., Zinnecker H., eds., Vol. 327, p. 479
- Pawlik et al. (2011) Pawlik A. H., Milosavljević M., Bromm V., 2011, ApJ, 731, 54
- Pawlik et al. (2013) —, 2013, ApJ, 767, 59
- Ricotti et al. (2016) Ricotti M., Parry O. H., Gnedin N. Y., 2016, ApJ, 831, 204
- Schaerer (2002) Schaerer D., 2002, A&A, 382, 28
- Schneider et al. (2002) Schneider R., Ferrara A., Natarajan P., Omukai K., 2002, ApJ, 571, 30
- Schneider et al. (2003) Schneider R., Ferrara A., Salvaterra R., Omukai K., Bromm V., 2003, Nature, 422, 869
- Schneider et al. (2006) Schneider R., Omukai K., Inoue A. K., Ferrara A., 2006, MNRAS, 369, 1437
- Schneider et al. (2012) Schneider R., Omukai K., Limongi M., Ferrara A., Salvaterra R., Chieffi A., Bianchi S., 2012, MNRAS, 423, L60
- Smith et al. (2015) Smith B. D., Wise J. H., O’Shea B. W., Norman M. L., Khochfar S., 2015, MNRAS, 452, 2822
- Springel (2005a) Springel V., 2005a, MNRAS, 364, 1105
- Springel (2005b) —, 2005b, MNRAS, 364, 1105
- Springel et al. (2001) Springel V., Yoshida N., White S. D. M., 2001, Nature, 6, 79
- Stacy & Bromm (2014) Stacy A., Bromm V., 2014, ApJ, 785, 73
- Stacy et al. (2016) Stacy A., Bromm V., Lee A. T., 2016, MNRAS, 462, 1307
- Stinson et al. (2006) Stinson G., Seth A., Katz N., Wadsley J., Governato F., Quinn T., 2006, MNRAS, 373, 1074
- Sugimura et al. (2020) Sugimura K., Matsumoto T., Hosokawa T., Hirano S., Omukai K., 2020, ApJ, 892, L14
- Susa (2013) Susa H., 2013, ApJ, 773, 185
- Susa et al. (2014) Susa H., Hasegawa K., Tominaga N., 2014, ApJ, 792, 32
- Susa & Umemura (2004) Susa H., Umemura M., 2004, ApJ, 600, 1
- Susa & Umemura (2006) —, 2006, ApJ, 645, L93
- Susa et al. (2009) Susa H., Umemura M., Hasegawa K., 2009, ApJ, 702, 480
- Tegmark et al. (1997) Tegmark M., Silk J., Rees M. J., Blanchard A., Abel T., Palla F., 1997, ApJ, 474, 1
- Trebitsch et al. (2018) Trebitsch M., Volonteri M., Dubois Y., Madau P., 2018, MNRAS, 478, 5607
- Trenti & Stiavelli (2009) Trenti M., Stiavelli M., 2009, ApJ, 694, 879
- Tumlinson & Shull (2000) Tumlinson J., Shull J. M., 2000, ApJ, 528, L65
- Wiersma et al. (2009) Wiersma R. P. C., Schaye J., Theuns T., Dalla Vecchia C., Tornatore L., 2009, MNRAS, 399, 574
- Wise et al. (2019) Wise J. H., Regan J. A., O’Shea B. W., Norman M. L., Downes T. P., Xu H., 2019, Nature, 566, 85
- Wise et al. (2012) Wise J. H., Turk M. J., Norman M. L., Abel T., 2012, ApJ, 745, 50
- Wolcott-Green et al. (2011) Wolcott-Green J., Haiman Z., Bryan G. L., 2011, MNRAS, 418, 838
- Xu et al. (2014) Xu H., Ahn K., Wise J. H., Norman M. L., O’Shea B. W., 2014, ApJ, 791, 110
- Xu et al. (2013) Xu H., Wise J. H., Norman M. L., 2013, ApJ, 773, 83
- Yajima et al. (2020) Yajima H., Abe M., Khochfar S., Nagamine K., Inoue A. K., Kodama T., Arata S., Dalla-Vecchia C., Fukushima H., Hashimoto T., Kashikawa N., Kubo M., Li Y., Matsuda Y., Mawatari K., Ouchi M., Umehata H., 2020, arXiv e-prints, arXiv:2011.11663
- Yajima et al. (2011) Yajima H., Choi J.-H., Nagamine K., 2011, MNRAS, 412, 411
- Yajima et al. (2012a) —, 2012a, MNRAS, 427, 2889
- Yajima et al. (2012b) Yajima H., Li Y., Zhu Q., Abel T., 2012b, MNRAS, 424, 884
- Yajima et al. (2015) —, 2015, ApJ, 801, 52
- Yajima et al. (2014) Yajima H., Li Y., Zhu Q., Abel T., Gronwall C., Ciardullo R., 2014, MNRAS, 440, 776
- Yajima et al. (2017) Yajima H., Ricotti M., Park K., Sugimura K., 2017, ApJ, 846, 3
- Yajima et al. (2018) Yajima H., Sugimura K., Hasegawa K., 2018, MNRAS, 477, 5406
- Yoshida et al. (2003) Yoshida N., Abel T., Hernquist L., Sugiyama N., 2003, ApJ, 592, 645
- Yoshida et al. (2008) Yoshida N., Omukai K., Hernquist L., 2008, Science, 321, 669