Constraints on the dust extinction law of the Galaxy with Swift/UVOT, Gaia and 2MASS
Abstract
We explore variations of the dust extinction law of the Milky Way by selecting stars from the Swift/UVOT Serendipitous Source Catalogue, cross-matched with Gaia DR2 and 2MASS to produce a sample of 10,452 stars out to 4 kpc with photometry covering a wide spectral window. The near ultraviolet passbands optimally encompass the 2,175Å bump, so that we can simultaneously fit the net extinction, quoted in the band (AV), the steepness of the wavelength dependence () and the bump strength (Eb). The methodology compares the observed magnitudes with theoretical stellar atmospheres from the models of Coelho. Significant correlations are found between these parameters, related to variations in dust composition, that are complementary to similar scaling relations found in the more complex dust attenuation law of galaxies – that also depend on the distribution of dust among the stellar populations within the galaxy. We recover the strong anticorrelation between AV and Galactic latitude, as well as a weaker bump strength at higher extinction. is also found to correlate with latitude, with steeper laws towards the Galactic plane. Our results suggest that variations in the attenuation law of galaxies cannot be fully explained by dust geometry.
keywords:
dust, extinction – ISM: general – Galaxy: general1 Introduction
Dust is one of the key observable components of galaxies. Through
absorption and scattering, dust affects the way starlight reaches the
observer, and a good characterization of the wavelength dependence of
these processes is fundamental to be able to, for instance, derive
accurate stellar masses or star formation rates of galaxies. There are
two main ways in which the presence of dust will shape the
spectral energy distribution of a galaxy: the dust properties will lead to an
extinction law that reflects how the superposition of dust grains of
different size and composition absorbs and scatters incoming
light (see, e.g. Draine, 2003). In addition, the distribution
of dust within the galaxy will affect light from the constituent stellar
populations in different ways. Most importantly, light from other regions
of the galaxy may be scattered into the line of sight to the observer,
complicating the interpretation of attenuation, that no longer depends
exclusively on dust composition (see, e.g. Witt & Gordon, 2000; Panuzzo et al., 2007).
A deeper understanding of the dust extinction law in the Milky Way Galaxy and
its variations, will help remove these degeneracies.
Note studies of dust extinction in the Milky Way
are free from such effects, as we are simply probing direct lines of sight to
stars. We emphasize that extinction and attenuation are different concepts
measured in similar ways.
For instance, clumpiness in the distribution of dust, typically
found in star forming regions, will affect the steepness of the
wavelength dependence of the attenuation
law (e.g., Witt & Gordon, 2000), whereas the same steepness parameter
only depends on dust composition when considering extinction,
as it is measured along a single line of
sight towards a star (e.g., Fitzpatrick & Massa, 1990). This paper focuses solely
on dust extinction, as we are observing single stars in our
Galaxy. Therefore, any variations found in the derived parameters can only be
caused by changes in dust composition.
The observations in the Milky
Way and the Magellanic Clouds reveal an overarching trend towards higher
extinction at shorter wavelengths, along with
a reduced set of spectral features, most notably the 2,175Å NUV
bump and the 9.7m and 18m silicate features
(see, e.g. Galliano, Galametz, & Jones, 2018).
The most likely candidate to explain the NUV bump – targeted in this
paper – is related to the resonance present in benzene-based
structures such as Polycyclic Aromatic Hydrocarbons (PAHs, see, e.g. Duley & Seahra, 1998).
However there are other
potential carriers (Bradley et al., 2005), so a full account of this
feature remains an open question.
There has been a number of parameterizations of the wavelength dependence
of the extinction law in the Milky Way,
and the observational constraints led to
the definition of standard extinction laws, although with a
large amount of scatter among different sight lines
(see, e.g. Cardelli et al., 1989; Fitzpatrick & Massa, 1990; Fitzpatrick, 1999).
The extinction
law of the Small Magellanic Cloud (SMC, Pei, 1992; Gordon et al., 2003) features
a steeper wavelength dependence, characteristic of smaller dust
grains (see, e.g., Weingartner & Draine, 2001).
In addition, the SMC law also lacks the NUV bump
(Hagen et al., 2017).
Knowledge of the dependence of the
scatter of the extinction law on dust composition allows us to extend
the analysis to dust attenuation in unresolved galaxies to find out
about dust composition (see, e.g. Tress, et al., 2019)
The UVOT camera (Roming et al., 2005) on board the Neil Gehrels Swift
Observatory features three NUV filters, UVW2, UVM2 and UVW1, that
straddle the 2,175Å bump, along with three standard
, , filters in the optical spectral window.
The optimal location of the NUV passbands has been exploited in studies
to constrain the dust attenuation law in nearby
galaxies (e.g., Hoversten et al., 2011; Hutton et al., 2014; Decleir et al., 2019) as well
as the dust extinction law in the SMC (Hagen et al., 2017). For instance,
in Hutton et al. (2014) it was shown that the attenuation law in
nearby prototypical starburst galaxy M82, cannot be explained by
the standard starburst prescription of Calzetti et al. (2000), as the NUV bump
is present throughout the galaxy. Moreover, a substantial radial
gradient was evident in the strength of the bump and the
total-to-selective extinction parameter, RV (Hutton et al., 2015).
This paper explores a large archival sample of stars observed by the
UVOT camera, cross-matched with the Gaia and 2MASS catalogues, as presented
in §2. The methodology that allows us to extract
constraints on the dust extinction parameters is presented in
§3, including an analysis based on simulated data to
explore the systematics. A discussion of the results is shown in Sec. 4,
followed by a summary in §5. Throughout this paper,
all magnitudes are quoted in the AB system (Oke & Gunn, 1983).
2 Data
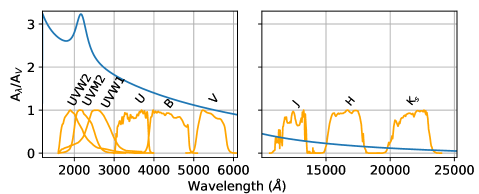
This work focuses on photometric data from the UVOT Serendipitous Source catalogue (UVOT/SSC, Page et al., 2014; Yershov et al., 2014), a compilation of all sources (resolved and unresolved) found in the archive of observations taken by the Swift/UVOT instrument, produced by processing all archival data. We use v1.1 of the UVOT/SSC catalogue, comprising a total of 23,059 observations in which over 13.86 million sources are detected, although we note that the same sources could have been observed repeatedly in several runs. The number of unique sources in this catalogue, with available fluxes in all six photometric bands is 170,801. From this set, we select those observations with good photometric measurements – defined as those with an uncertainty below 0.2 mag in all six passbands, along with a quality flag equal to zero. This constraint ensures good accuracy in the derivation of the dust extinction parameters, as we show below, and only decreases the sample size by 8.8%. The sample is cross-matched with the Gaia DR2 (Gaia Collaboration, et al., 2018) stellar catalogue, selecting those sources with an available effective temperature from Bai et al. (2019), and a distance estimate from Bailer-Jones, et al. (2018). The set is also matched with the point source catalogue of 2MASS (Cutri et al., 2003) to include NIR photometry in the , and passbands. The cross-matching was done with the help of the excellent service provided by the Centre de Données astronomiques de Strasbourg (CDS)111http://cdsxmatch.u-strasbg.fr. The sample from this cross-match comprises 80,104 stars. Fig. 1 shows the response of the nine passbands used in this study – separated into the UVOT NUV and optical filters, (left) and the 2MASS NIR filters (right). For reference, the standard dust extinction law of the Milky Way is shown (Cardelli et al., 1989).
One of the key parameters explored in this paper is the 2,175Å bump, that requires a significant amount of flux in the NUV bands. Trial and error in our methodology (see below) results in setting a lower limit in the effective temperature to be able to constrain the dust extinction parameters. We opted to impose a threshold in the effective temperature, T K, producing a final working sample that comprises 10,452 stars. We emphasize that the temperature mentioned here has been obtained independently, using a supervised machine learning algorithm (Bai et al., 2019), trained on a standard assumption for the dust extinction law. Since we adopt a more generic function, the actual values of the temperature may vary. However, we only use this one to impose a Gaussian prior in the analysis, as shown in the next section. Hence, the final estimates of temperature will be consistent with the best fit extinction law for each star.
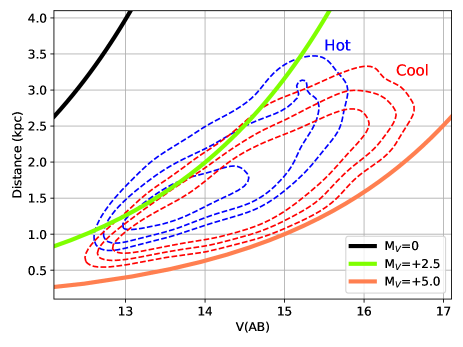
The distribution of the sample in the distance versus apparent magnitude plane is shown in Fig. 2, split at the median Teff (7,500 K) with hot and cold stars shown as blue/red dashed contours, respectively. From the inside out, the contours engulf 90, 95 and 99% of each subset. We note that due to both sample selection and the actual distribution of stars as a function of temperature, the cooler subsample mostly consists of A- and F-type stars. For reference, the figure includes the expected location of unreddened stars with absolute -band magnitude of 0, +2.5 and +5.0 (black, green, and orange lines, respectively). The number of stars drops at apparent magnitudes fainter than 16.5 AB, and extends to a distance 4 kpc. It is also worth noting that a segregation based on colour does not introduce a bias regarding distance or apparent magnitude. This will be relevant when we explore in §4 the distribution of dust extinction parameters.
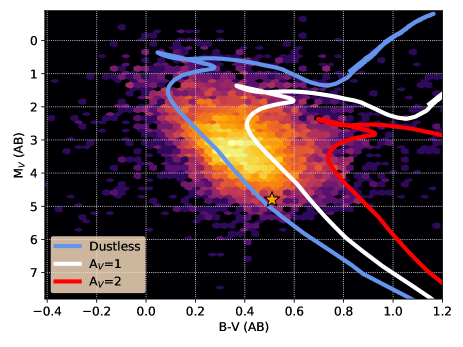
Fig. 3 shows the sample in a Hertzsprung-Russell diagram, with -band absolute magnitude against colour. For reference, a solar metallicity, 1 Gyr isochrone from the PARSEC team (Bressan, et al., 2012) is overlaid, including the effect of extinction, as labelled, adopting a standard Milky Way extinction law (=3.1, see, e.g. Cardelli et al., 1989). Models based on these isochrones provide accurate fits to the observed colour-magnitude distribution of the Gaia data (Alzate, Bruzual, & Díaz-González, 2021). This choice is only meant to illustrate the location of our data on a standard colour-magnitude diagram. As the population ages, the Main Sequence turnoff will shift towards redder and fainter values, in the same direction as an increased dust extinction, reflecting the well-known age-dust degeneracy of stellar populations. This work does not attempt to fit isochrones, and focuses instead on a combined constraint of the temperature and dust extinction from the observed fluxes of single stars. This figure illustrates the nature of our sample as mostly turn-off and sub-giant stars with a range of extinction A2 mag. Our sample is biased in favour of the brighter and bluer sources, as we impose detection in all NUV and optical filters from the UVOT catalogue as the main selection criterion. This implies a preponderance of stars on the Galactic plane (90% of the sample has Galactic latitude ), and allows us to cover a wide range of distance, with 90% of the sample probing out to kpc, without a significant bias regarding temperature (Fig. 2).
| Parameter | Range | Gridpoints |
| Stellar parameters (log g=4.5, cgs) | ||
| Teff | [4000, 18000] K | 42 |
| 3 | ||
| Dust parameter (flat) priorsa | ||
| — | ||
| — | ||
| — | ||
a Note the parameters are explored as a continuous function with an MCMC sampler, and the stellar spectra are retrieved from a bilinear (Teff, [Fe/H]) interpolation of the model grid.

3 Methodology
There are several functional forms in the literature to describe the wavelength dependence of dust extinction and attenuation (see, e.g. Cardelli et al., 1989; Fitzpatrick & Massa, 1990, 2007; Noll et al., 2009; Conroy, Schiminovich, & Blanton, 2010). We choose the parametric function presented by Kriek & Conroy (2013) from the previous work of Noll et al. (2009)222There is no evident advantage of using this parameterisation with respect to other choices, but we find this one is used rather extensively in the literature.. At each wavelength, , the extinction, in magnitudes, can be written:
| (1) |
where is the standard reddening curve found in equation 4 of Calzetti et al. (2000). The NUV bump is described by a Lorentzian-like profile, (often termed a Drude profile), scaled by the NUV bump strength parameter, , with two additional parameters, the central wavelength and the width. We follow Kriek & Conroy (2013) to define this absorption feature, namely adopting 2,175Å for the central wavelength and 350Å for the width. The central wavelength does not vary among different lines of sight, but the width does show significant scatter (see, e.g., Valencic, Clayton, & Gordon, 2004; Fitzpatrick & Massa, 2007). However, it is beyond the scope of this paper to treat the width as a free parameter, so that our constraints of should be taken as the effective bump strength for a fixed absorption profile. Finally, is a parameter that changes the steepness of the original wavelength dependence of the Calzetti et al. (2000) law – that corresponds to =0, =0. Positive/negative values of correspond to a shallower/steeper wavelength dependence, respectively. Note that the number 4.05 in equation 1 refers to the original total to selective extinction parameter RV for the Calzetti law. Therefore, the wavelength dependence of this prescription is concisely defined by three parameters: AV, Eb and . An alternative description of the extinction/attenuation law is the one defined by Conroy, Schiminovich, & Blanton (2010), where the steepness of the law is parameterised by the more traditional , and the bump strength is described by , so that the choice RV=3.1, B=1 closely follows the standard Milky Way law of Cardelli et al. (1989). In the appendix of Tress, et al. (2018) a simple analytic expression is presented to convert between these two parameterisations. For instance, the Milky Way standard corresponds to , E. We emphasize that our analysis, based on broadband photometry, does not consider independent variations in the wavelength dependence in the NUV and optical windows, a task that can only be attempted by use of spectroscopic data (e.g. Fitzpatrick & Massa, 1990; Gordon, Cartledge, & Clayton, 2009; Fitzpatrick et al., 2019).
Our methodology rests on a comparison between the combined NUV, optical and NIR photometry with a set of stellar atmospheres from the models of Coelho (2014). The spectra are retrieved in FITS format from Coelho’s webpage333http://www.astro.iag.usp.br/pcoelho/. These models include a homogeneous computation of opacity distribution functions, and provide a set of stellar spectra for a wide range of effective temperature, surface gravity and chemical composition, including non-solar abundance ratios. However, since our analysis is based on low spectral resolution photometry using traditional broadband filters, we restrict the parameter space to effective temperature and metallicity, keeping a fixed value of surface gravity and abundance ratios. We adopt these models as they have been thoroughly tested in population synthesis models by Coelho et al. (2020), where it is shown that some of the existing discrepancies in the output of synthetic populations based on either empirical or theoretical stellar libraries is mostly due to the sampling of the underlying stellar parameters, rather than the stellar spectra themselves. Therefore, spectra from state-of-the-art stellar atmosphere models are suitable for this type of analysis and free from the dust correction residuals present in empirical data. Moreover, the computed colours based on filters with broad bandpasses only carry systematic uncertainties that are substantially smaller than the typical statistical uncertainties of the observations. We emphasize here the need to use theoretical libraries, and note that some of the stars in empirical libraries that cover NUV wavelengths, such as NGSL (Gregg et al., 2006) do suffer from a prominent absorption feature at the position of the NUV bump. This absorption is caused by dust along the line of sight to the star, that would require an accurate knowledge of the properties of dust in the Milky Way along specific directions. Therefore, the model predictions from empirical spectra will be compromised.
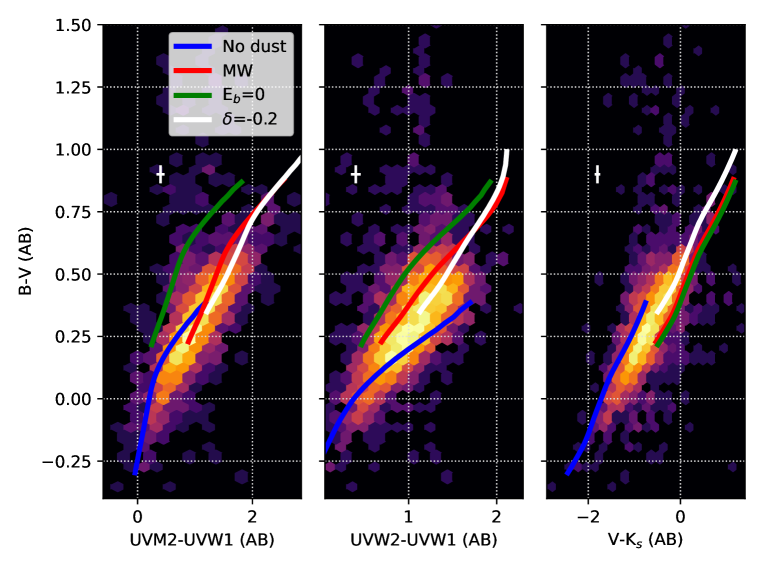
To illustrate the power of a photometric analysis to constrain the dust extinction law, we show in Fig. 4 three colour-colour diagrams with our sample represented as a density plot. Three tracks are overlaid that correspond to models, at solar metallicity, solar abundance ratios and surface gravity log g=4.5 (cgs). The tracks cover the temperature range from T=6,500 K (top-right corner of the three panels) to 18,000 K, and are shown at zero dust extinction (blue), for a Milky-Way standard law (i.e. , ) with A mag (red), and for the same amount of extinction with a law that lacks the NUV bump (represented by , keeping , green). The white line keeps the same bump strength as that of the Milky Way (), but changes to a steeper value () to show the effect of a change in the slope of the extinction law. The error bars show the worst case scenario for the statistical uncertainty of the colour measurements. Note, for instance, the lack of sensitivity to the bump strength of , as expected, whereas the NUV colours show a substantial sensitivity. Although UVW2UVW1 avoids the central part of this resonance, it does show a dependence on Eb given the rather extended width of this feature. Variations in the slope produce changes in colour that progressively decrease with wavelength. Making use of all these different sensitivities to the dust parameters, combining photometric information from NUV to NIR along with the optimal spectral range of the UVOT NUV filters, it is possible to constrain all three extinction parameters.
For each star in the cross-matched UVOT sample, we compare the observed fluxes with a range of stellar atmosphere models based on a grid of 42 values of effective temperature, from Teff=4,000 K to 18,000 K and three values of metallicity: [Fe/H]=0.5,0.0,0.2. We emphasize that although we do have a previous estimate of Teff from Bai et al. (2019), the value is not consistent with a generic dust extinction law as the one adopted here. Therefore, it is expected that, due to the temperature-dust degeneracy, the effective temperature may change either to lower or higher values. Therefore, we take stellar atmosphere models with lower temperatures than the threshold of 6,500 K. At the other end, we limit the highest temperature in the models to 18,000 K given the drop in the number of stars shown in the colour-colour plots at the hot end of the isochrone trails (Fig. 4). Also note that in this sample, none of the values of Teff from the analysis of Bai et al. (2019) reaches temperatures above 10,000 K. Moreover, the fits to the observed stars produce a temperature range markedly lower, as shown below. We seek a balance between runtime and accuracy. Given the low spectral resolution of broadband photometry, we opted to restrict the stellar parameters to a single value of surface gravity, log g=4.5 (cgs) and solar abundance ratios ([/Fe]=0). Different values of surface gravity do not vary significantly the colours based on broadband fluxes. We emphasize that the dust parameters will only be constrained with flux ratios (i.e. colours), so that the luminosity of a given model cannot introduce any bias. For each trial, the solver chooses five parameters, namely {Teff, [Fe/H], AV, , Eb}. The first two are used to interpolate a stellar spectrum from the grid, and the last three parameters allow us to attenuate the spectrum using the adopted extinction law. For each observed star, we define a standard (log-)likelihood:
| (2) |
where is a normalization factor. For each choice of the stellar parameters ( and [Fe/H]), we extract an interpolated spectrum from the grid of Coelho (2014) models, then the dust extinction corresponding to the choice of dust parameters (, , ) is applied to the spectra, and the magnitudes computed for each of the filters, using the official passbands in each case444The passband response curves can be found at the following link: http://svo2.cab.inta-csic.es/theory/fps/. The value of the statistic is computed by comparing observed and model magnitudes, taking the V-band flux as an anchor point, meaning that all stars are assumed to have the same band magnitude, so that only the colours are used to constrain the parameters. A standard MCMC sampler is applied to explore the 5-dimensional parameter space, making use of the Python code emcee (Foreman-Mackey et al., 2013). The MCMC solver comprises 100 chains, taking 2000 steps, from which we remove the first 500 to derive the probability distribution function (PDF) of each parameter. The values of the parameters are quoted at the median of these distributions.
Flat priors are imposed on the dust parameters over a wide range of values, see Table 1 for details of the range allowed. To overcome the potential degeneracy between temperature and the dust parameters, we impose a Gaussian prior centered at the value of Teff obtained by Bai et al. (2019) with a standard deviation corresponding to twice the quoted error. This way we will allow for a variable Teff, but will avoid fits that correspond to very different temperatures. Fig. 5 shows the distribution of the best fit parameters for the total sample. It is worth noting that only 1.4% of the sample has -band extinction higher than 2 mag. In the next section we explore the accuracy of the parameter retrieval using a simulated sample, and will determine whether substantial degeneracies are present.
3.1 Simulations
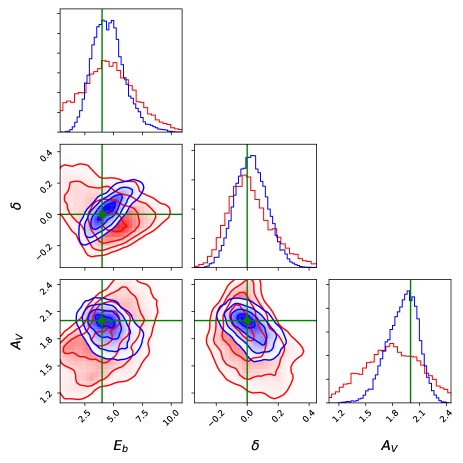
We test the methodology by constructing a set of mock photometric measurements, choosing a random set of dust- and stellar-related parameters, to produce the NUV, optical and NIR fluxes. To illustrate the retrieval process for a single star, Fig. 6 shows cuts of the posterior probability distribution for two stars with the same dust extinction parameters (Eb=4, =0 AV=2, represented by the green lines) and different effective temperatures: 6,500 K (red) and 10,000 K (blue). The contours are shown at four confidence levels: 0.5, 1, 1.5, and 2 . The lower temperature case produces a less accurate constraint of the parameters, as expected, since cooler stars do not have enough NUV flux to probe in detail the extinction law.
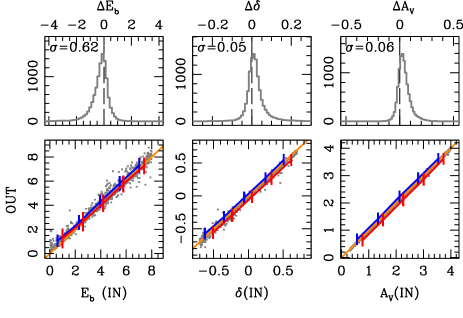
Each synthetic observation has compatible photometric uncertainties with respect to the original sample: the mock set comprises the same number of stars (10,452), and for each one we use the original Teff and flux uncertainties. In this way, we guarantee that the simulations mimick as much as possible the properties of the original sample. A random value of the metallicity (from a uniform deviate in log space, between [Fe/H]=0.5 and 0.2) and dust parameters (also uniform deviates, E, , A) are chosen for each star, producing the fluxes according to the theoretical models adopted in this work. Note that the range is different from the grid models explored in Table 1. The grid models are expected to extend over a significantly larger range than the actual dust parameters of the sample, for robustness. Fig. 5 shows that the parameters extracted from the actual observations are contained within the intervals explored in the simulated data, thus justifying this choice. We note the distribution of Eb appears truncated at high values, but the results presented below do not show any pile up at high bump strengths in the trends, so we do not anticipate any systematic effect from the chosen range of values for Eb. The comparison between input and output are shown in Fig. 7. The bottom row compares the input parameters (horizontal axes), with respect to the ones retrieved by the MCMC-based methodology described above. Individual mock stars are shown as grey dots, and closely follow the ideal 1:1 trend (orange lines). To explore a potential systematic, we split the sample into high (blue) and low (red) effective temperature, with the cut at 7,500 K (that corresponds to the median of the sample). The lines show the averaged trends, with the error bars spanning one standard deviation. No significant segregation is found, within error bars, although the cooler stars consistently produce lower values of AV and , with differences that are, nevertheless very small. The top row shows the distribution of the difference between input and output (grey histograms), i.e. , where is one of the three dust extinction parameters. The behaviour is acceptable, with standard deviations shown in the panels, namely Eb=0.62; =0.05; AV=0.06. The 1 uncertainties extracted from the posterior of the individual star measurements have median values =1.63; =0.11; =0.25. Although temperature is treated as a nuisance parameter, the simulations produce good results with differences between the input values and the extracted ones of K.
We also emphasize that for each star the dust law is determined from a random set of parameters (, , ), so that no spurious correlation should be expected between them. This sanity check allows us to assess whether there is any systematic from the underlying degeneracies when comparing the results with actual stars. Columns 2 and 3 of Table 2 show the Pearson correlation coefficients of the input and output parameters for four pairings. The data for the output includes the 1 scatter derived from bootstrapping according to the retrieved error in each parameter. Most importantly, only a weak covariance is found between AV and both bump strength and effective temperature, and a weaker trend is found in the random simulations between steepness and bump strength. Nevertheless, we will show in the next section that the mild correlation found here is statistically smaller than the one obtained for the actual sample. The results of these simulations allow us to assess the limit of applicability of the models. We emphasize that, at present, this is the best possible data to probe the NUV and optical dust extinction law in the Milky Way, with a sample comprising over 10 thousand stars.
| Params | Mocks | Observations | |
|---|---|---|---|
| IN | OUT | ||
| (1) | (2) | (3) | (4) |
| vs | |||
| vs | |||
| vs | |||
| vs | |||
4 Results and Discussion
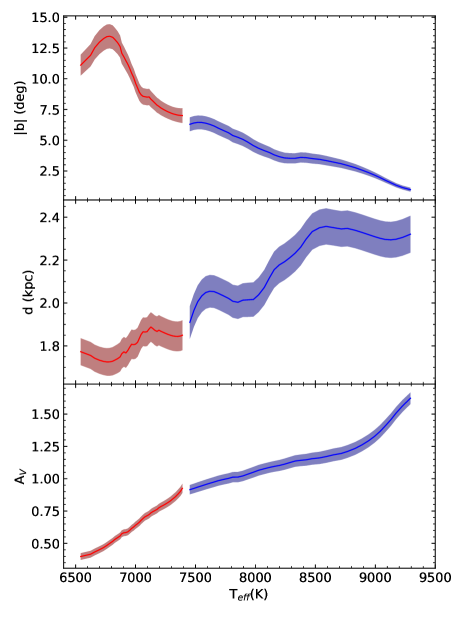
Fig. 8 shows the trends between the best fit effective temperature and some of the parameters that define the sample, from bottom to top, extinction in the band, distance and Galactic latitude. The shaded regions encompass a running median along with its (1 ) uncertainty, using a moving interval that includes 200 stars in each trial. In this plot, as well as in the next few figures that apply a similar running median to show the trends of the various parameters, please note that the range on the vertical axis strongly depends on the choice of the horizontal axis, so that it should not come as a surprise that these plots may extend over different ranges, being always smaller than those of the original parameter search of Table 1. Regarding this plot, Teff is derived exclusively from the observed colours (we do not use the absolute fluxes), therefore the trends found with distance and latitude are non-trivial and strengthen the validity of our approach, as we find a strong correlation towards higher temperature stars with increasing distance (as expected in a flux limited survey) and decreasing latitude, as expected from the well-known distribution of stars on the Galactic plane (e.g. Sparke & Gallagher, 2007). The blue/red shaded regions in this figure show the split with respect to effective temperature at the median value (7,500 K), as presented in Figs. 9 and 11, below.
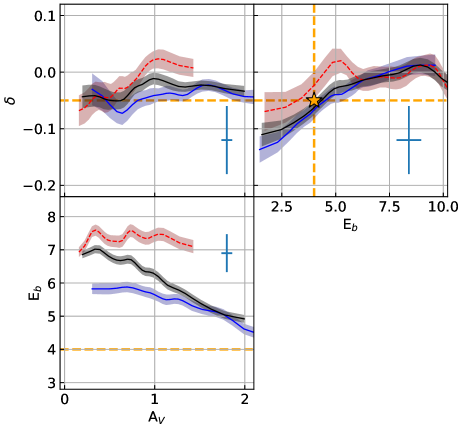
The general comparison between the different parameters can be found in Fig. 9, where the three extinction parameters are plotted against each other. We follow the same split with respect to temperature as in Fig. 8. For reference, the orange star and dashed lines mark the Milky Way standard extinction law (, ), and a characteristic error bar of the dust parameters is also shown in each panel, defined as the median error bar for each parameter from the MCMC-based fits to the whole sample, given at the level. Regarding the parameter we note two main results: 1) There is a negative correlation between the NUV bump strength and -band extinction, mostly caused by the hotter subsample that follows more closely the Galactic plane. The bump is stronger in the cooler subsample. However, this difference might be partly caused by the fact that at lower temperature, the stellar flux is rather weak in the NUV part of the spectrum, and the bump is harder to constrain (see Fig. 6), hence we put more emphasis on the result for the hotter stars. 2)There is also a slightly positive correlation between and Eb, so that steeper laws (i.e. lower values of ) display weaker bumps. This correlation is independent of the effective temperature. However, the trend is rather mild, note the small variation of the running median for . These two results can be put in context with the equivalent relations found in galaxies – i.e. regarding the attenuation law, and thus more complex to disentangle (Kriek & Conroy, 2013; Hagen et al., 2017; Salim, Boquien, & Lee, 2018; Tress, et al., 2018; Decleir et al., 2019). The attenuation studies also find a similar trend towards decreasing with , but the correlation between and is opposite to the one found here – although the observational trends show a rather large scatter. We emphasize that the trends with respect to attenuation also depend on dust geometry, and, indeed, some numerical simulations can explain the observed trends with models at constant composition but variable dust geometry (Narayanan et al., 2018). These trends so far have only been reported in dust attenuation studies in galaxies, not in the original extinction curve. Our results suggest that substantial variations in dust composition are present within the same galaxy (in a relatively small volume, kpc), so that these variations should be accounted for in any theoretical model of attenuation. This result suggests the carrier responsible for the NUV bump suffers significant variations across different lines of sight, with a well-defined trend towards stronger bumps at low extinction and in regions where the law is shallower. On a speculative tone, one could argue that low extinction regions provide an environment where the formation of large grains is less efficient (i.e. steeper wavelength dependence, and thus, lower ), whereas in this environment the much smaller carriers of the NUV bump are not destroyed, therefore leading to higher Eb. At high values of AV, the formation of larger grains and a higher efficiency in the destruction of, e.g. PAHs, would lead to the observed relations (Fischera & Dopita, 2011). However, it is beyond the scope of this paper to provide a physical scenario to explain these trends.
The validity of these trends can also be quantified by comparing the Pearson correlation coefficient of the data to those quoted above for the best fits corresponding to mock simulations, whose parameters were, by construction, uncorrelated. The results are shown in Table 2, with column 4 showing the correlation coefficients for the actual sample, to be contrasted with column 3, that corresponds to a fully uncorrelated set of mock observations with the same number of stars and with the same flux uncertainties (see §3.1). The strong positive correlation between AV and is confirmed, along with an anticorrelation between NUV bump strength and AV. Fig. 9 shows that the cooler subsample features a slight correlation between and AV, and there is also a slightly positive correlation between and , so that steeper laws (i.e. lower values of ) display weaker bumps.
Notice the trend between the steepness parameter () and AV, with an overall value very close to the commonly adopted Milky Way standard (=0.05, corresponding to RV=3.1). The cooler subsample features increasing with extinction. A simple interpretation of changes in would be due to variations in the distribution of dust grain sizes, with smaller grains producing steeper laws (i.e. tending to Rayleigh scattering) and larger grains tending towards a weak wavelength dependence (i.e. tending to Mie scattering). Our results suggest that the general distribution of dust particle sizes does not depend strongly on the net amount of dust extinction, with a weak correlation towards greyer extinction with increasing (expected in dust with a higher contribution from larger grains). Note that the attenuation law in galaxies also becomes shallower at increasing amounts of dust (see, e.g., Chevallard et al., 2013; Hagen et al., 2017; Salim, Boquien, & Lee, 2018; Tress, et al., 2018; Decleir et al., 2019), an effect expected from the inhomogeneous distribution of dust within the stellar populations of a galaxy (e.g., Witt & Gordon, 2000).
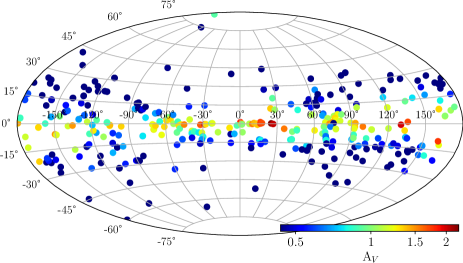
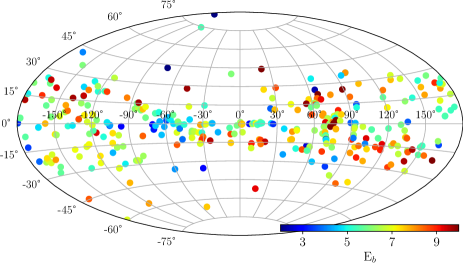
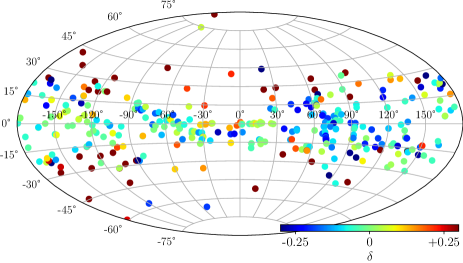
Fig. 10 shows the spatial distribution of the dust extinction parameters, from top to bottom: AV, Eb and . The Aitoff projections are shown in Galactic coordinates. We should emphasize that our working sample originates from all available pointings made by the Swift/UVOT instrument, assembled in the Serendipitous Source Catalogue. Therefore it is not a dedicated / programmed survey, and only consists of what could be considered sets of random pointings on the sky. This means that the sky is covered very sparsely, with many sources located within relatively narrow patches – the field of view of UVOT is 1717 arcmin2 (Roming et al., 2005). Therefore, to create a meaningful representation of the spatial variations of the dust parameters, we grouped all source detections within a single UVOT pointing and obtained single measurements of (AV, Eb, ) that correspond to the median of the dust fits within the same field of view. Within each group, we found that the scatter of the dust parameters is roughly compatible with the expected uncertainties. For instance, the scatter of the intra-group parameters – i.e. the distribution of measurements of , , towards stars within the same field of view of the UVOT camera – has a median of , , .
The figure shows that most of our targets are located on a thin layer of the Galactic plane – we emphasize that this sample is constrained to have all NUV fluxes with uncertainty below 20%, therefore restricting the sample to hotter, more luminous stars, mostly around the turn-off point of the Main Sequence (see Fig. 3). The top panel illustrates the expected increase in total extinction towards the plane of the Galaxy, more clearly shown in Fig. 11. The middle panel shows a random distribution of NUV bump strengths. The bottom panel shows some weak coherence in the variation of the steepness parameter, , not only in latitude but also in longitude, with a preference for lower values of towards 30–120 degrees.
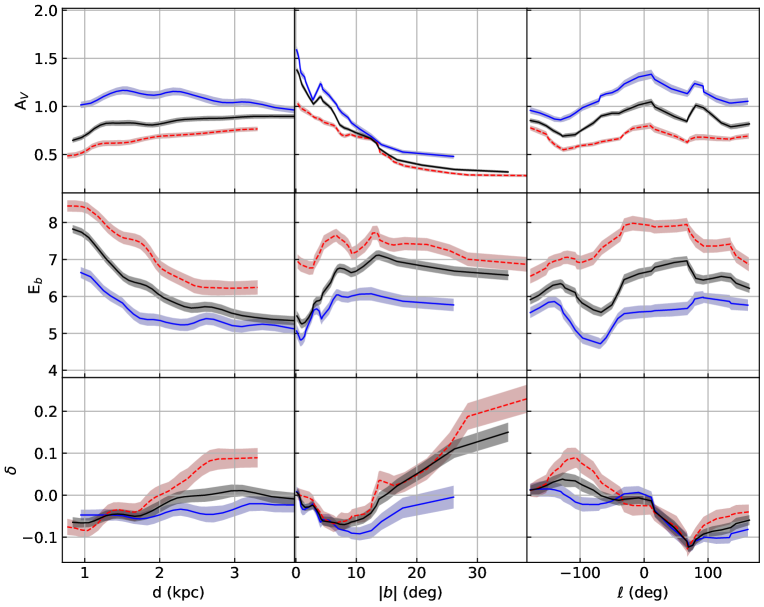
A more detailed view of these trends can be seen in Fig. 11 where we show the projection of the dust extinction parameters (vertical axes) along the three astrometric quantities (from left to right: distance, Galactic latitude and longitude), following the same running median criteria as in Fig. 9. In the top row it is worth highlighting the strong increasing extinction towards low Galactic latitude, with values A1 close to the Galactic plane (). Note that this correlation confirms the validity of the parameter constraints, as it is derived from totally independent methods (i.e. astrometry vs flux ratios). Moreover the strong anticorrelation between AV and is found regardless of temperature, although the cooler subsample extends to higher latitude, as shown in Fig. 8. The trend between AV and distance depends on temperature: at fixed distance, the hotter subsample features higher extinction, a result due in part to the previous correlation and the fact that hotter stars are preferentially found at lower Galactic latitude (Fig. 8). However, a selection bias might be present, as the cooler stars at high extinction will not be included in this NUV flux-limits sample. The NUV bump strength (middle panels) is highly covariant with distance, with the sightlines towards the more distant stars showing the weaker bump strengths. Noting the trend between AV and Eb shown in Fig. 9 along with the mild increase of AV with distance, we could argue that the nearer stars probe regions of lower extinction, where the bump is expected to be stronger. The strong separation with respect to effective temperature is, once more, apparent, as in Fig. 9. Finally, in the bottom panels we show , that appears mostly correlated with latitude, with steeper laws towards the Galactic plane. The previously mentioned “dip” at 30–120 degrees is also evident here. It is also worth mentioning that the cooler stars drive the trends of , possibly due to the fact that these stars are more spread in Galactic latitude, hence probing more diverse regions regarding dust composition. This result would naively suggest that at lower Galactic latitude, large dust grains are destroyed more efficiently, leading to a steeper extinction law. Note, though, that the behaviour of Eb suggests no significant variation with Galactic latitude in the cooler subset, and that AV decreases quite strongly with latitude. The interpretation of these trends is non trivial given the interlinked dependence between AV, steepness and bump strength, requiring a detailed analysis based on a dust model along with a proper radiative transfer treatment in a disc-like geometry, beyond the scope of this paper. We also note that no significant trends have been found in the other panels.
5 Summary
By cross-matching the Swift/UVOT Serendipitous Source Catalogue (Yershov et al., 2014) with Data Release 2 of the Gaia mission (Gaia Collaboration, et al., 2018) and the 2MASS point source catalogue (Cutri et al., 2003), we assembled a sample of 10,452 stars with good photometry covering a wide spectral range from the near ultraviolet (with filters that straddle the well-known dust absorption feature at 2,175Å) to near infrared. The sample extends out to several kpc (95% of the sample is located within 3.7 kpc), and is limited in effective temperature (T K) in order to have enough flux in the NUV to constrain the NUV bump. A comparison of the colours with a grid of synthetic stellar atmospheres from the models of Coelho (2014) allows us to constrain the most fundamental parameters of dust extinction in this spectral window, namely the steepness of the wavelength dependence (), the strength of the NUV bump (), and the band extinction (AV), following the standard prescription of Noll et al. (2009). We note that the serendipitous nature of this data set produces sparse sampling on the sky, preventing us from producing a dust map (e.g., Chen et al., 2019; Lallement et al., 2019). However, this is the first time a large sample (comprising over 10 thousand stars) is used to constrain both optical and NUV features of the dust extinction law of the Galaxy.
In addition to the well-known correlation between total extinction and Galactic latitude (Fig. 11), we find in Fig. 9 that the NUV bump strength appears anticorrelated with total extinction () and positively correlated with the extinction law steepness (). Comparisons with simulations allow us to reject the hypothesis of a systematic from the inherent degeneracies as the cause of these trends (Table 2). These trends are stronger in the subsample of hotter stars – mostly located towards low Galactic latitude. The steepness of the extinction law does not vary significantly when plotted with respect to AV, and appears consistent with the value adopted for the Milky Way standard ().
In Fig. 10, we show the distribution of our sample in Galactic coordinates, colour-coded according to the dust extinction parameters. We note the sparsity of the set, as the parent sample originates from the analysis of all sources found in archival images of the Swift/UVOT camera, and therefore does not follow an optimal survey strategy. Despite the low coverage of the sky, the strong trend between AV and Galactic latitude is apparent once more. The steepness of the extinction law also appears to be correlated with latitude, and perhaps longitude, with a prominence of low (i.e. steeper law) around 30–120o. A more detailed illustration of the trends with astrometric quantities is shown in Fig. 11. This paper presents for the first time substantial correlations between dust extinction parameters, analogous but not equivalent to such variations in the dust attenuation law in galaxies. A more detailed analysis comprising large samples of spectroscopic data including the NUV optical window (e.g. Gordon, Cartledge, & Clayton, 2009; Fitzpatrick et al., 2019) is needed to confirm or refute the trends presented here. Understanding in detail the extinction law in the Galaxy is a very important stage in the more general area of galaxy formation and evolution. Dust attenuation in galaxies remains an open problem, where dust composition and its distribution among the stellar populations play equally important roles (see, e.g. Galliano, Galametz, & Jones, 2018, and references therein). Therefore, constraints on dust extinction parameters derived from nearby resolved systems allow us to understand one of these important components. Our results emphasize that theoretical/numerical models of galaxy formation have to take into account dust composition variations to explain the observed trends in the dust attenuation law, as simple models based on a fixed composition would not be able to explain these trends in our own Galaxy.
Acknowledgements
The referee is warmly thanked for a very careful reading of this paper, providing useful comments and suggestions that have improved this paper. This work has made use of data from the European Space Agency (ESA) mission Gaia (http://www.cosmos.esa.int/gaia), processed by the Gaia Data Processing and Analysis Consortium (DPAC, http://www.cosmos.esa.int/web/gaia/dpac/consortium). Funding for the DPAC has been provided by national institutions, in particular the institutions participating in the Gaia Multilateral Agreement. This research made use of the cross-match service provided by CDS, Strasbourg. MP was supported by the UK Science and Technology Facility Council (STFC), grant number ST/N000811/1. MP and PK acknowledge support from the UK Space Agency. The authors acknowledge the use of the UCL Myriad High Throughput Computing Facility (Myriad@UCL), and associated support services, in the completion of this work.
Data availability
This sample is extracted from a cross-match of publicly available datasets (UVOT Serendipitous Source Catalogue, Gaia DR2, and 2MASS point source catalogue). The combined final dataset is available upon request.
References
- Alzate, Bruzual, & Díaz-González (2021) Alzate J. A., Bruzual G., Díaz-González D. J., 2021, MNRAS, 501, 302
- Bai et al. (2019) Bai Y., Liu J., Bai Z., Wang S., Fan D., 2019, AJ, 158, 93
- Bailer-Jones, et al. (2018) Bailer-Jones C. A. L., Rybizki J., Fouesneau M., Mantelet G., Andrae R., 2018, AJ, 156, 58
- Bradley et al. (2005) Bradley J., Dai Z. R., Erni R., Browning N., Graham G., Weber P., Smith J., et al., 2005, Sci, 307, 244
- Bressan, et al. (2012) Bressan A., Marigo P., Girardi L., Salasnich B., Dal Cero C., Rubele S., Nanni A., 2012, MNRAS, 427, 127
- Calzetti et al. (2000) Calzetti D., Armus L., Bohlin R. C., Kinney A. L., Koornneef J., Storchi-Bergmann T., 2000, ApJ, 533, 682
- Cardelli et al. (1989) Cardelli J. A., Clayton G. C., Mathis J. S., 1989, ApJ, 345, 245
- Chen et al. (2019) Chen B.-Q., Huang Y., Yuan H.-B., Wang C., Fan D.-W., Xiang M.-S., Zhang H.-W., et al., 2019, MNRAS, 483, 4277
- Chevallard et al. (2013) Chevallard J., Charlot S., Wandelt B., Wild V., 2013, MNRAS, 432, 2061
- Coelho (2014) Coelho P. R. T., 2014, MNRAS, 440, 1027
- Coelho et al. (2020) Coelho, P. R. T., Bruzual, G., Charlot, S., 2020, MNRAS, 491, 2025
- Conroy, Schiminovich, & Blanton (2010) Conroy C., Schiminovich D., Blanton M. R., 2010, ApJ, 718, 184
- Cutri et al. (2003) Cutri R. M., Skrutskie M. F., van Dyk S., Beichman C. A., Carpenter J. M., Chester T., Cambresy L., et al., 2003, yCat, II/246
- Decleir et al. (2019) Decleir M., De Looze I., Boquien M., Baes M., Verstocken S., Calzetti D., Ciesla L., et al., 2019, MNRAS, 486, 743
- Draine (2003) Draine B. T., 2003, ARA&A, 41, 241
- Duley & Seahra (1998) Duley W. W., Seahra S., 1998, ApJ, 507, 874
- Fischera & Dopita (2011) Fischera J., Dopita M., 2011, A&A, 533, A117
- Fitzpatrick & Massa (1990) Fitzpatrick E. L., Massa D. L., 1990, ApJS, 72, 163
- Fitzpatrick (1999) Fitzpatrick, E. L., 1999, PASP, 111, 63
- Fitzpatrick et al. (2019) Fitzpatrick E. L., Massa D., Gordon K. D., Bohlin R., Clayton G. C., 2019, ApJ, 886, 108
- Fitzpatrick & Massa (2007) Fitzpatrick, E. L., Massa, D. L., 2007, ApJ, 663, 320
- Foreman-Mackey et al. (2013) Foreman-Mackey D., Hogg D. W., Lang D., Goodman J., 2013, PASP, 125, 306
- Gaia Collaboration, et al. (2018) Gaia Collaboration, et al., 2018, A&A, 616, A1
- Galliano, Galametz, & Jones (2018) Galliano F., Galametz M., Jones A. P., 2018, ARA&A, 56, 673
- Gordon et al. (2003) Gordon K. D., Clayton G. C., Misselt K. A., Landolt A. U., Wolff M. J., 2003, ApJ, 594, 279
- Gordon, Cartledge, & Clayton (2009) Gordon K. D., Cartledge S., Clayton G. C., 2009, ApJ, 705, 1320
- Gregg et al. (2006) Gregg M. D., Silva D., Rayner J., Worthey G., Valdes F., Pickles A., Rose J., et al., 2006, hstc.conf, 209
- Hagen et al. (2017) Hagen L. M. Z., Siegel M. H., Hoversten E. A., Gronwall C., Immler S., Hagen A., 2017, MNRAS, 466, 4540
- Hoversten et al. (2011) Hoversten E. A., Gronwall C., Vanden Berk D. E., Basu-Zych A. R., Breeveld A. A., Brown P. J., Kuin N. P. M., et al., 2011, AJ, 141, 205
- Hutton et al. (2014) Hutton S., Ferreras I., Wu K., Kuin P., Breeveld A., Yershov V., Cropper M., et al., 2014, MNRAS, 440, 150
- Hutton et al. (2015) Hutton, S., Ferreras, I., Yershov, V., 2015, MNRAS 452, 1412
- Kriek & Conroy (2013) Kriek, M., Conroy, C., 2013, ApJ, 775, L16
- Lallement et al. (2019) Lallement R., Babusiaux C., Vergely J. L., Katz D., Arenou F., Valette B., Hottier C., et al., 2019, A&A, 625, A135
- Narayanan et al. (2018) Narayanan D., Conroy C., Davé R., Johnson B. D., Popping G., 2018, ApJ, 869, 70
- Noll et al. (2009) Noll, S., et al., 2009, A&A, 499, 69
- Oke & Gunn (1983) Oke J. B., Gunn J. E., 1983, ApJ, 266, 713
- Panuzzo et al. (2007) Panuzzo, P., Granato, G. L., Buat, V., Inoue, A. K., Silva, L., Iglesias-Páramo, J., Bressan, A., 2007, MNRAS, 375, 640
- Pei (1992) Pei, Y. C., 1992, ApJ, 395, 130
- Page et al. (2014) Page M. J., et al., 2014, Proceedings of Scinec (SWIFT-10), 037
- Roming et al. (2005) Roming P. W. A., Kennedy T. E., Mason K. O., Nousek J. A., Ahr L., Bingham R. E., Broos P. S., et al., 2005, SSRv, 120, 95
- Salim, Boquien, & Lee (2018) Salim S., Boquien M., Lee J. C., 2018, ApJ, 859, 11
- Sparke & Gallagher (2007) Sparke L. S., Gallagher J. S., 2007, gitu.book
- Tress, et al. (2018) Tress M., et al., 2018, MNRAS, 475, 2363
- Tress, et al. (2019) Tress M., et al., 2019, MNRAS, 488, 2301
- Valencic, Clayton, & Gordon (2004) Valencic L. A., Clayton G. C., Gordon K. D., 2004, ApJ, 616, 912
- Weingartner & Draine (2001) Weingartner J. C., Draine B. T., 2001, ApJ, 548, 296
- Witt & Gordon (2000) Witt A. N., Gordon K. D., 2000, ApJ, 528, 799
- Yershov et al. (2014) Yershov, V., et al., 2014, Astrophysics & Space Science, 354, 97