Herbig Ae/Be stars towards the dark cloud LDN 1667111Based on the observations made with the 2.2 m telescope at the European Southern Observatory (La Silla, Chile) under the agreement between Observatório Nacional (Brazil) and European Southern Observatory (ESO) and also under the agreement between Observatório Nacional (Brazil) and Max Planck Institut für Astronomie (MPG) and also based on observations at Centro Astronómico Hispano Alemán (CAHA) at Calar Alto operated jointly by Instituto de Astrofísica de Andalucía (CSIC) and Max Planck Institut für Astronomie (MPG). Centro Astronómico Hispano en Andalucía is now operated by Instituto de Astrofísica de Andalucía and Junta de Andalucía.
Abstract
We report the discovery of a new emission-line object, named SPH 4South = (GAIA EDR3 5616553300192230272), towards the dark cloud LDN 1667. This object came to our attention after inspecting public images that show a faint diffuse nebula a few arcsec southern from SPH 4, an emission-line object previously classified as a T Tauri star. We present high-resolution spectra and analyzed JHK photometry of SPH 4 and SPH 4South, and new narrow-band and archival broad-band images of these objects. A comparison of the spectra of SPH 4 and SPH 4South with high-resolution ones of DG Cir and R Mon, strongly suggests that SPH 4 and SPH 4South are Herbig Ae/Be stars. The classification of SPH 4South is further supported by using a -NN algorithm to its position in HK versus JH color-color diagram. Both stars are detected in the four WISE bands and the WISE colors allow us to classify SPH 4 as a Class I and SPH 4South as a Class II source. We also show that the faint nebula is most probably associated with SPH 4South. Using published results on LDN 1667 and the Gaia Early Data Release 3, we conclude that SPH 4 is a member of LDN 1667. The case of SPH 4South is not clear because the determination of its distance and proper motion could be affected by the nebulosity around the star, although membership of SPH 4South to LDN 1667 cannot be ruled out.
xxx
1 Introduction
SPH 4 was first discovered as an H emission-line object by Schwartz, Persson, & Hamann (1990) in the Canis Majoris region and, in particular, towards the dark cloud LDN 1667 (Lynds 1962). This and other 24 emission-line objects were studied using low-resolution spectroscopy by Pereira et al. (2001; hereafter P2001) with the aim of investigating their nature. As a result of that investigation, 16 new Be stars and 7 new T Tauri stars were identified while two objects failed to show the H emission line in the new spectra.
Among the seven stars classified as new T Tauri stars, it was later realized that two of them, SPH 4 and SPH 17, could be in fact Herbig AeBe (HAeBe) stars rather than T Tauri stars. The source of this suspicion was the absence of the H component of the Ca ii line in their spectra. This K:H anomaly seems to be a common feature among some HAeBe stars (Herbig et al. 2003) and is due to the presence of the absorption of the P-Cygni profile of the H line at 3970.08 Å which obliterates the calcium line at 3968.49 Å. In Figure 1 we illustrate this phenomenon by comparing high-resolution UVES spectra of the HAeBe star Z CMa and of the T Tauri star BP Tau. As can be seen in Figure 1, the K and H calcium lines are present in the spectrum of BP Tau while the H calcium line is absent in the spectrum of Z CMa. In the low-resolution spectra of both SPH 4 and SPH 17 the H calcium line was absent, a fact that was not realized by P2001. Therefore, during a mission in March 2016 at the ESO, SPH 4 was re-observed, this time with high-resolution spectroscopy, to obtain a more precise classification of its nature.
Besides, inspecting the images of the stellar field in Simbad/Aladin around SPH 4 (already mentioned as Bran 23 by Brand, Blitz & Wouterloot (1986)), we noticed a stellar-like object at 14 arcsec southern of SPH 4, that seemed to be surrounded by a faint diffuse nebula. Therefore, we included this object, hereafter called SPH 4South, in the target list for our spectroscopic observations, and also obtained narrow-band optical images of the region around SPH 4 to investigate the faint nebula. The coordinates of SPH 4, and SPH 4South are given in Table 1 and have been obtained from the Gaia Early Data Release 3 (GEDR 3, Gaia Collaboration, Brown et al. 2020).
In this paper, we present the high-resolution spectra of SPH 4 and SPH 4South, our narrow-band and public optical broad-band images, and analyze JHK photometry of the two objects. We compare our spectra with high-resolution ones of two well-known HAeBe stars, DG Cir and R Mon, to classify our targets, and discuss the association between SPH 4, SPH 4South, the faint nebula, and LDN 1667.
2 Observations
The high-resolution spectra of SPH 4 and SPH 4–South were obtained with the Feros (Fiberfed Extended Range Optical Spectrograph) echelle spectrograph, Kaufer et al., 1999) of the 2.2 m ESO telescope at La Silla (Chile). SPH 4 was observed in the night of March 23, 2016 with a exposure time of 3600 s while SPH 4–South was observed in the nights of March 20 and 21, 2016, with exposure times of 3600 and 3000 s, respectively. The FEROS spectral resolving power is , corresponding to 2.2 pixels of m, and the wavelength coverage goes from 4000 Å to 9200 Å. The spectra were reduced with the midas pipeline reduction package consisting of the following standard steps: CCD bias correction, flat-fielding, spectrum extraction, wavelength calibration, correction of barycentric velocity and spectrum rectification. The spectrum of DG Cir, used as a HAeBe comparison star, was also obtained with the Feros spectrograph on May 2, 2010. Like the spectra of BP Tau and Z CMa, the spectrum of R Mon used in this study was also obtained with the UVES spectrograph.
Due to the large exposure times, the spectra of SPH 4 and SPH 4South presented many cosmic rays events and OH telluric emission lines. We used the full width at half maximum (FWHM) to distinguish cosmic rays from telluric emission lines, and a comparison between spectra of the same object taken at different nights. For the identification of OH telluric emission lines we used the high-resolution night-sky emission atlas provided by Osterbrock et al. (1995) and Hanuschik (2003).
| Star | ID | (2016.0) | (2016.0) |
|---|---|---|---|
| (h m s) | (∘ ′ ′′) | ||
| SPH 4 | 5616553304497133568 | 7 24 12.756 | 25 49 57.91 |
| SPH 4South | 5616553300192230272 | 7 24 13.167 | 25 50 10.33 |
Narrow-band images of the field around SPH 4 and SPH 4South were obtained on 2017 November 1 with CAFOS at the 2.2 m telescope at the Calar Alto Observatory (Almería, Spain). The detector was a SiTe CCD with 20482048 pixel2 and a plate scale of 0.53 arcsec pixel-1. We employed two filters covering the H (0 = 6580 Å, FWHM = 100 Å) and the [S ii] (0 = 6700 Å, FWHM = 180 Å) emission lines to obtain images with an exposure time of 21800 s in each filter. The spatial resolution, mainly determined by the seeing, is 2.5 arcsec. The images were cosmic ray cleaned, bias subtraction, and flat fielded using the corresponding tasks in the midas package.
To complete our set of data, we have downloaded the images of the region around SPH 4 and SPH 4South from the PanSTARRS1 archive (Chambers et al. 2016; Flewelling et al., 2016) in the following filters: g (0 = 4881 Å, FWHM = 1256 Å), r (0 = 6198 Å, FWHM = 1404 Å), and y (0 = 9510 Å, FWHM = 628 Å). These images have a spatial resolution of 2 arcsec, somewhat better than the narrow-band ones.

3 Optical imaging
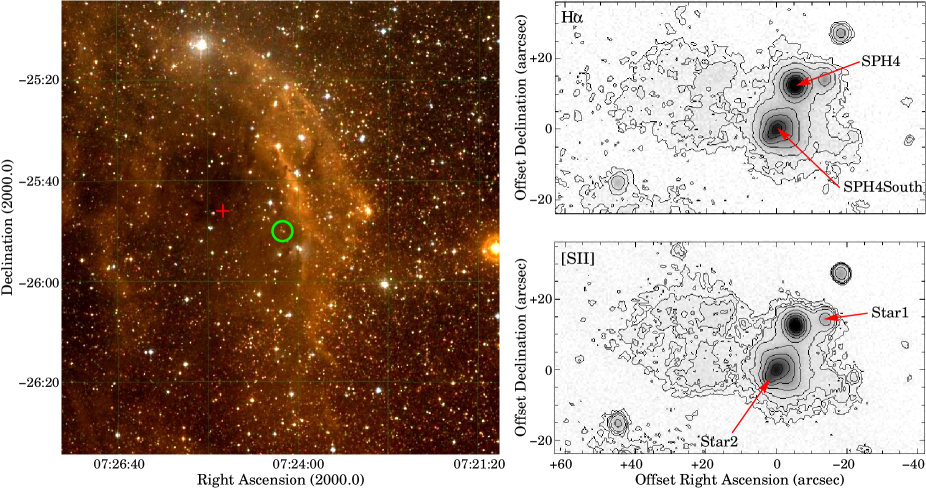
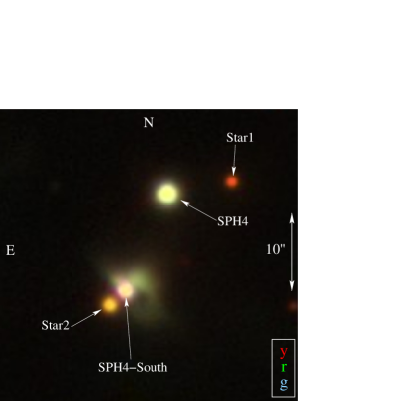
Figure 2 presents an image of LDN 1667 obtained from the Palomar Observatory Sky Survey (POSS) where the location of SPH 4 and SPH 4South is indicated, and the H and [S ii] images around the two stars. SPH 4 and SPH 4South are located towards the west and at 12.6 arcmin from the center of the cloud. They are close to bright filamentary structures. The H and [S ii] images show a faint bipolar nebula with the main axis at PA70∘ that crosses SPH 4South, and unequal lobes with the eastern lobe extending up to 45 arcsec and the western lobe up to 23 arcsec from the star. Some structure can be recognized in the eastern lobe in the form of two relatively bright regions. Figure 3 presents a color composite image obtained from the y, r, and g PanSTARRS1 images to show the brightest regions of the nebula. These regions are relatively complex and show a narrow structure towards the NE emanating from the star, bright emission encircling a cavity towards the SW, and a bright knot towards the NW. The images strongly suggest that the faint nebula is associated to SPH 4South.
As we will see below, the spectra of SPH 4 and SPH 4South are mainly characterized by emission lines. The fiber size of FEROS is 2 arcsec and was centered on the stars and we have not used an off-source fiber to study the spectrum of the nebula. Therefore, it is important to discuss whether the “stellar” spectra could be contaminated by nebular emission. Emission lines due to [N ii] and, perhaps, [S ii] are present in the stellar spectra and could have a nebular origin. Balmer lines (H and H) are strong and present a P Cygni profiles typical of young stars. Other emission lines due to Fe ii or Mg i (see below) are relatively strong, in many cases stronger than the [N ii] emission lines. These emission lines are very faint (if detected) in nebulae associated to young stars and, in addition, they are not expected from the detected nebula given its faintness. Thus, we conclude that contamination of the stellar spectra by nebular emission lines has not influence in the analysis and in the classification of the stars.
4 Line identification and the nature of SPH 4 and SPH 4–South


Figures 4, 5 and 6 shows portions of the spectra of SPH 4 and/or SPH 4South together with spectra of R Mon and/or DG Cir that have been used as comparisons to investigate the nature of the two emission-line stars. Figures 10 to 22 (in the Appendix) show additional spectral regions.
Table 5 (also in the Appendix) lists the observed wavelength, the FWHM, the equivalent width of the identified emission lines, the line identification, whenever possible, and the number of the Figure showing the spectra. For some emission lines, such as H (Figure 6), H (Figure 9), the sodium lines (Figure 16) and [O i] at 6300 Å (Figure 18), we do not provide the equivalent width and the FWHM due to their observed complex profiles. Besides, the emission line profiles of these these lines are affected by circumstellar absorption and/or emission as well as by telluric absorption and/or emission. We note that very faint [N ii] and, perhaps, [S ii] emission lines are detected in both stars (Figure 6).
SPH 4 presents a rich emission line spectrum, mainly due to Fe ii lines, as earlier shown in the low-resolution spectra presented by P2001. The spectrum of this star shows remarkable similarities with that of DG Cir, as can be recognized in the figures. Particularly noticeable is the absence of the H calcium line, which is in agreement with that observed in DG Cir and other HAeBe stars (Figures 1 and 4). The Balmer emission lines H and H present a P Cygni profile that is very similar to that observed in DG Cir. From these similarities we conclude that SPH 4 is a HAeBe star, rather than a T Tauri star. SPH 4South does not exhibit a rich emission-line spectrum. In general, the spectrum of SPH 4South is similar to that of R Mon, although we did not detected any emission in the region of the H and K calcium lines. The spectra suggest that SPH 4South may also be a HAeBe star. Alike SPH 4 and DG Cir, R Mon is considered as a “continuum star” by Hernández et al. (2004) due to a high nonphotospheric continuum veiling and, hence, the absence of some photospheric absorption lines. A similar classification may hold from SPH 4South. Yet, a few absorption lines could be identified such as Mg i at 5183.62 Å in the spectrum of SPH 4, (Figure 12), K i at 7698.98 Å in the spectra of SPH 4 and SPH 4South and the oxygen triplet at 77717775 Å in the spectra of SPH 4South and R Mon (Figure 5).
From well defined emission lines, we obtain (LSR) radial velocities of +15.21.3 and 32.30.9 km s-1 for SPH 4 and SPH 4South, respectively. We have tried to measure the stellar velocity from the few observed absorption lines but the faintness or broadening of these lines does not provide reliable results.
5 SPH 4 and SPH 4South in the HK versus JH diagram and in the WISE bands
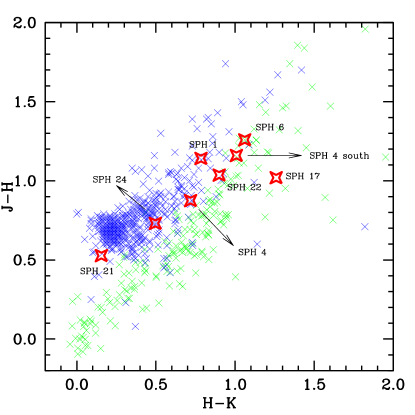
In Figure 7 we examine the positions of SPH 4 and SPH 4South in the HK versus JH diagram based on data given in Table 2 and compare them with a sample of T Tauri and HAeBe stars. In addition, we also insert in the diagram the objects classified as T Tauri stars by P2001. Based in the infrared diagram, it is difficult to classify SPH 4 and SPH 4South either as HAeBe or T Tauri star since they both lie in between the region occupied by these two groups of stars. SPH 17 previously classified as T Tauri star by P2001, occupies the region of HAeBe objects. In fact, inspecting the low-resolution spectrum of SPH 17 (see P2001), we see that it is very similar to the low-resolution spectrum of SPH 4 and, in addition, the H calcium line is absent (see above). Therefore, we re-classify SPH 17 as HAeBe star. The other pre-main sequence stars SPH 1, SPH 6, SPH 21, SPH 22, and SPH 24, only analyzed with low-resolution spectroscopy, may still be considered candidate T Tauri stars although some of them lie in between the region occupied by the HAeBe and T Tauri stars.
Figure 8 presents another version of the HK versus JH color-color diagram. To gain insight into the classification of SPH4 and SPH4South, we computed a decision surface around their locations using a -NN algorithm. With this method, each point of the (HK, JH) plane was classified as T Tauri or HAeBe star, based on the most common classification of its -nearest neighbors. Using cross-validation in our data set, we found that was the optimal value.
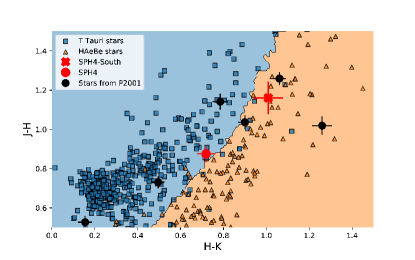
Overall, the T Tauri and HAeBe stars were well separated. SPH4-south is on the HAeBe side and SPH4 falls very close to the frontier between T Tauri and HAeBe stars. A definitive classification for the objects close to the frontier is hard to establish because there is some overlap in the observed colors. Without the additional information provided by their spectra, their classification is risky. Nevertheless, Figure 8 at least indicates that the classification of SPH4South as an HAeBe star is indeed statistically possible.
The accuracy achieved with the kNN method was high. The number of misclassified T-Tauri stars is 26, which is only about 6% of the total T-Tauri sample. For the HAeBe stars, there were 14 misclassifications, which is about 7% of the HAeBe sample. In Figure 8, each of these objects are in the wrong side of the computed frontier. We also display in Figure 8 the error bars for the HK and JH colors of SPH 4 and SPH 4 South, computed from individual magnitude errors. The error bars for SPH 4 are relatively small and barely cross the frontier. Analogously, SPH 4-South remains on the HAeBe side, despite the larger color uncertainties.
| Star | J | e | H | e | K | e |
|---|---|---|---|---|---|---|
| SPH 1 | 13.102 | 0.027 | 11.961 | 0.029 | 11.176 | 0.023 |
| SPH 4 | 12.392 | 0.028 | 11.517 | 0.031 | 10.798 | 0.029 |
| SPH 6 | 11.610 | 0.024 | 10.351 | 0.023 | 9.290 | 0.019 |
| SPH 17 | 12.802 | — | 11.783 | 0.037 | 10.523 | 0.029 |
| SPH 21 | 12.884 | 0.023 | 12.357 | 0.021 | 12.202 | 0.025 |
| SPH 22 | 13.181 | 0.027 | 12.145 | 0.022 | 11.245 | 0.023 |
| SPH 24 | 12.608 | 0.022 | 11.877 | 0.021 | 11.381 | 0.021 |
| SPH 4South | 12.254 | 0.056 | 11.094 | 0.061 | 10.085 | 0.030 |
To further investigate the nature of the two stars, we have followed the method by Fischer et al. (2016) who used the Wide-field Infrared Survey Explorer (WISE) and the W1W2 and W2W3 colors to classify Class I and Class II sources in the Canis Majoris region (see also Lada 1987). Table 3 lists the magnitudes of the two stars that are detected in the four bands, being SPH 4 particularly bright in W4. According Figure 2 in Fischer et al. (2016), SPH 4 may be classified as a Class I source and SPH 4South as a Class II one. The infrared emission of Class I sources is dominated by a dusty circumstellar envelope while a dusty disk dominates the infrared emission of Class II sources that are expected to be more evolved than Class I ones.
| Star | W1 | e | W2 | e | W3 | e | W4 | e |
|---|---|---|---|---|---|---|---|---|
| SPH 4 | 9.085 | 0.023 | 7.976 | 0.019 | 5.144 | 0.014 | 2.710 | 0.018 |
| SPH 4South | 8.746 | 0.025 | 7.845 | 0.021 | 5.827 | 0.019 | 4.033 | 0.039 |
6 The relationship among SPH 4, SPH 4South and LDN 1667
As already mentioned, SPH 4 and SPH 4South are observed towards the dark cloud LDN 1667 and it is interesting to investigate their possible membership to this cloud.
LDN 1667 has not been studied in detail. May, Gyulbudaghian & Alvarez (2005, hereafter MGA05) mapped several molecular clouds towards the Pupis–Canis Majoris region using the 13CO (J=1-0) line. SPH 4 and SPH 4South are observed towards the B molecular cloud identified by MGA05 at 239.63 and 4.63 that coincide with those of LDN 1667 at 239.57 and 4.64. These authors obtained an LSR radial velocity between 18.42 and 23.62 km s-1 for the B cloud, and a kinematical distance between 1.7 and 2.1 kpc with errors of 0.5 kpc from their CO observations. The kinematical distance largely differs from that determined using stars presumably being members of the region, that results to be between 300 and 650 pc (see MGA05).
From the data in GEDR3, we have obtained the distances, proper motions, and magnitudes of SPH 4 and SPH 4South that are listed in Table 4. In addition, for comparison purposes, the same information has been obtained for Star 1 and Star 2 that are marked in Figures 2 and 3, and is included in Table 4.
The distance of SPH 4 is in agreement with the kinematical distance to the cloud B, strongly suggesting that it is a member of LDN 1667. Star 1 and Star 2 present a similar distance and they should also be members of the cloud. Moreover, the proper motions of SPH 4, Star 1, and Star 2 present similar magnitude and direction. We also note that the (LSR) radial velocity of SPH 4 (+15 km s-1) is similar to that of LDN 1667, although this could be a simple chance and the stellar velocity of SPH 4 should be used to make a better comparison.
The case of SPH 4South is different. Its distance is clearly smaller than those of the other three stars and of LDN 1667. The magnitude of its proper motion is very different from those of the other three stars, although the direction coincides within the errors (Table 4). The radial velocity of SPH 4South (32 km s-1) is very different from that of LDN 1667, although this value has been derived from the emission lines and should not necessarily represent that of the star. In general, the data seem to suggest that SPH 4South is not related to SPH 4 and LDN 1667. However, we note that the errors in the distance and proper motion of SPH 4South are considerably larger than those associated to the other three stars. In principle, the errors could be related to the brightness of the star, as it can be inferred from Table 2 for Star 1, Star 2, and SPH 4. However, Star 1 and Star 2 are clearly fainter than SPH 4South and show smaller errors in distance and proper motion than SPH 4South. We suspect that the measurements of SPH 4South might be affected by the presence of the nebula, that could introduce uncertainties in the measurements of its photocenter. Therefore, membership of SPH 4South to LDN 1667 cannot not be ruled out from the current data and obtaining its stellar velocity is mandatory to confirm or reject such a membership.
| Star | Distance | Proper motion magnitude | Proper motion PA | GBp | GG | GRp |
|---|---|---|---|---|---|---|
| (pc) | (mas) | (∘) | (mag) | (mag) | (mag) | |
| SPH 4 | 1387+38-34 | 3.330.02 | 321.50.4 | 15.6130.010 | 14.6750.004 | 13.6690.007 |
| SPH 4South | 896+205-141 | 0.950.27 | 30916 | 16.5210.029 | 15.7400.011 | 14.4730.025 |
| Star 1 | 1324+187-145 | 3.430.12 | 317.32.2 | 19.4730.030 | 17.9470.003 | 16.5560.007 |
| Star 2 | 1381+94-83 | 3.420.06 | 3211 | 17.9590.036 | 16.6080.008 | 15.4140.026 |
7 Conclusions
We have presented high-resolution spectra of the emission-line star SPH 4 and of a new emission-line object, named SPH 4South, that is presumably associated to a faint diffuse nebula detected in public images. We also analyzed narrow- and broad-band images to investigate the faint nebula. By comparing the spectra of SPH 4 and SPH 4South with similar ones of DG Cir and R Mon, respectively, we re-classify SPH 4 as a HAeBe star, correcting the previous T Tauri classification, and also suggest an HAeBe classification for SPH 4South. An analysis of the HK versus JH color-color diagram by means of a -NN algorithm provides support for the HAeBe classification of SPH 4South. he two stars are detected in the four WISE bands and their W1W2 and W2W3 colors suggest a Class I and Class II classification for SPH 4 and SPH 4South, respectively. The faint nebula appears associated to SPH 4South. Both stars are observed towards the dark cloud LDN 1667. Using published data on LDN 1667 and GEDR 3 we conclude that SPH 4 is a member of the cloud. The GEDR 3 data of SPH 4South seems to exclude its association with LDN 1667. Nevertheless, these data present relatively large errors that might be caused by the presence of the nebula, and membership of SPH 4South to LDN 1667 cannot be still ruled out.
Acknowledgements
We thank Calar Alto Observatory for allocation of director’s discretionary time to this program. LFM acknowledges partial support by MCIU grant AYA2017-84390-C2-1-R, co-funded with FEDER funds, and financial support from the State Agency for Research of the Spanish MCIU through the “Center of Excellence Severo Ochoa” award for the Instituto de Astrofísica de Andalucía (SEV-2017-0709). This research has made use of the SIMBAD database, operated at CDS, Strasbourg, France, and of the VizieR catalogue access tool, CDS, Strasbourg, France (DOI: 10.26093/cds/vizier). The original description of the VizieR service was published in Ochsenbein, Bauer & Marcout (2000). The Pan-STARRS1 Surveys (PS1) and the PS1 public science archive have been made possible through contributions by the Institute for Astronomy, the University of Hawaii, the Pan-STARRS Project Office, the Max-Planck Society and its participating institutes, the Max Planck Institute for Astronomy, Heidelberg and the Max Planck Institute for Extraterrestrial Physics, Garching, The Johns Hopkins University, Durham University, the University of Edinburgh, the Queen’s University Belfast, the Harvard-Smithsonian Center for Astrophysics, the Las Cumbres Observatory Global Telescope Network Incorporated, the National Central University of Taiwan, the Space Telescope Science Institute, the National Aeronautics and Space Administration under Grant No. NNX08AR22G issued through the Planetary Science Division of the NASA Science Mission Directorate, the National Science Foundation Grant No. AST-1238877, the University of Maryland, Eotvos Lorand University (ELTE), the Los Alamos National Laboratory, and the Gordon and Betty Moore Foundation. The Digitized Sky Surveys were produced at the Space Telescope Science Institute (STScI) under US Government grant NAG W-2166. The images of these surveys are based on photographic data obtained using the Oschin Schmidt Telescope on Palomar Mountain and the UK Schmidt Telescope. The plates were processed into the present compressed digital form with the permission of these institutions. The National Geographic Society – Palomar Observatory Sky Atlas (POSS-I) was made by the California Institute of Technology with grants from the National Geographic Society. The second Palomar Observatory Sky Atlas (POSS-II) was made by the California Institute of Technology with funds from the National Science Foundation, the National Geographic Society, the Sloan Foundation, the Samuel Oschin Foundation and the Eastman Kodak Corporation. The Oschin Schmidt Telescope is operated by the California Institute of Technology and Palomar Observatory. The UK Schmidt Telescope was operated by the Royal Observatory, Edinburgh, with funding from the UK Science and Engineering Research Council (later the UK Particle Physics and Astronomy Research Council), until 1988 June, and thereafter by the Anglo-Australian Observatory. Supplemental funding for skysurvey work at the STScI is provided by the European Southern Observatory. This publication makes use of data products from the Wide-field Infrared Survey Explorer, which is a joint project of the University of California, Los Angeles, and the Jet Propulsion Laboratory/California Institute of Technology, funded by the National Aeronautics and Space Administration.
References
- Brand et al. (1986) Brand J., Blitz L., Wouterloot J. G. A., 1986, A&ASS, 65, 537
- Chambers et al (2016) Chambers K. C. et al., 2016, arXiv:1612.05560
- Cutri et al (2003) Cutri, R.M., Skrutski, M.F., van Dyk, S., Beichman, C.A., Carpenter, J.M. et al. 2003, The IRSA 2MASS All Sky Point Source Catalog, NASA/IPAC Infrared Science Archive
- Dahm (2005) Dahm S. E, Simon T., 2005, AJ, 129, 829
- Fischer et al. (2016) Fischer W. E., Padgett D. L., Stapelfeldt K. L., Sewiło M., 2016, ApJ, 876, A96
- Flewelling et al (2016) Flewelling H.A., et al., 2016, arXiv:1612.05243
- Gaia2020 (2020) Gaia Collaboration, Brown A.G.A., et al., 2020, arXiv:2012.01533
- Hanuschik (2003) Hanuschik R. W., 2003, A&A, 407, 1157.
- Herbig (2003) Herbig G. H., Petrov P. P., Duemmler R., 2003, ApJ, 595, 384
- Herández (2004) Hernández J., Calvet N., Briceño C., Hartmann L., Berlind P., 2004, AJ, 127, 1682
- Kaufer et al (1999) Kaufer A., Stahl O., Tubbesing S., Nörregaard P., Avila G., Francois P., 1999, The Messenger, 95, 8
- Lada (1962) Lada C. J., 1987, in Proc. IAU Symp. 115, Star Forming Regions, ed. M. Peimbert & J. Jugaku (Dordrecht: Reidel), 1
- Lynds (1962) Lynds B. T., 1962, ApJS, 1962, 7, 1
- May et al. (2005) May J., Gyulbudaghian A. L., Alvarez H., 2005, Astrophysics., 48, 411
- Osterbrock et al (1996) Osterbrock D. E., Fulbright J. P., Martel A. R., Keane M. J., Trager S. C., Basri G., 1996, PASP, 108, 277
- Percy et al (2010) Percy J. R., Seneviratne R., Herbst W., 2010, PASP, 122 753
- Pereira et al (2001) Pereira C. B., Schiavon R. P., de Araújo F. X., Landaberry S. J. C., 2001, AJ, 121, 1071
- Schwartz et al (1990) Schwartz R. D., Persson S. E., Hamann F. W., 1990, AJ, 100, 793
- Vioque et al (2018) Vioque M., Oudmaijer R. D. Baines D., Mendigutía I., Pérez-Martínez R., 2018, A&A, 620, A128
Appendix A Additional figures
In this section we present additional figures that compare the spectra of SPH 4 and SPH 4South with those of DG Cir and R Mon, respectively.


Appendix B Tables
This section provides measurements of observed wavelength, FWHM, equivalent width (Wλ), and identification of the emission lines for the stars studied in this work. The number of the figure where the corresponding spectrum is included in the table.
| Star | Observed wavelength | FWHM | Wλ | Line | Figure |
|---|---|---|---|---|---|
| (Å) | (Å) | (Å) | Identification | ||
| SPH 4 | 4924.84 | 1.9 | 3.3 | Fe ii(42) 4923.9 | 10 |
| DG Cir | 4823.87 | 1.9 | 2.1 | ||
| SPH 4south | — | — | — | ||
| R Mon | — | — | — | ||
| ——— | ——— | ——— | ——— | ||
| SPH 4 | 4994.65 | 1.3 | 0.8 | Fe ii(36) 4993.4 | 10 |
| DG Cir | |||||
| SPH 4south | — | — | — | ||
| R Mon | — | — | — | ||
| ——— | ——— | ——— | ——— | ||
| SPH 4 | 5012.98 | 1.1 | 0.8 | 11 | |
| DG Cir | — | — | — | ||
| SPH 4south | — | — | — | ||
| R Mon | — | — | — | ||
| ——— | ——— | ——— | ——— | ||
| SPH 4 | 5019.43 | 2.2 | 2.4 | Fe ii(42) 5018.5 | 11 |
| DG Cir | 5018.53 | 2.1 | 2.6 | ||
| SPH 4south | — | — | — | ||
| R Mon | — | — | — | ||
| ——— | ——— | ——— | ——— | ||
| SPH 4 | 5042.33 | 1.7 | 1.3 | 11 | |
| DG Cir | — | — | — | ||
| SPH 4south | — | — | — | ||
| R Mon | — | — | — | ||
| ——— | ——— | ——— | ——— | ||
| SPH 4 | 5050.60 | 0.8 | 0.4 | 11 | |
| DG Cir | — | — | — | ||
| SPH 4south | — | — | — | ||
| R Mon | — | — | — | ||
| ——— | ——— | ——— | ——— | ||
| SPH 4 | 5052.51 | 1.2 | 0.7 | 11 | |
| DG Cir | — | — | — | ||
| SPH 4south | — | — | — | ||
| R Mon | — | — | — | ||
| ——— | ——— | ——— | ——— | ||
| SPH 4 | 5080.42 | 1.7 | 1.2 | 11 | |
| DG Cir | — | — | — | ||
| SPH 4south | — | — | — | ||
| R Mon | — | — | — |
Table 5, continued
| Star | Observed wavelength | FWHM | Wλ | Line | Figure |
|---|---|---|---|---|---|
| (Å) | (Å) | (Å) | Identification | ||
| SPH 4 | 5084.23 | 1.3 | 0.5 | 11 | |
| DG Cir | — | — | — | ||
| SPH 4south | — | — | — | ||
| R Mon | — | — | — | ||
| ——— | ——— | ——— | ——— | ||
| SPH 4 | 5108.45 | 1.3 | 0.8 | 12 | |
| DG Cir | — | — | — | ||
| SPH 4south | — | — | — | ||
| R Mon | — | — | — | ||
| ——— | ——— | ——— | ——— | ||
| SPH 4 | 5111.18 | 1.3 | 0.9 | 12 | |
| DG Cir | 5110.51 | 1.5 | 0.3 | ||
| SPH 4south | — | — | — | ||
| R Mon | — | — | — | ||
| ——— | ——— | ——— | ——— | ||
| SPH 4 | 5128.27 | 1.0 | 0.3 | 12 | |
| DG Cir | 5128.72 | 2.3 | 0.1 | ||
| SPH 4south | — | — | — | ||
| R Mon | — | — | — | ||
| ——— | ——— | ——— | ——— | ||
| SPH 4 | 5129.97 | 1.1 | 0.5 | 12 | |
| DG Cir | — | — | — | ||
| SPH 4south | — | — | — | ||
| R Mon | — | — | — | ||
| ——— | ——— | ——— | ——— | ||
| SPH 4 | 5152.05 | 1.4 | 0.6 | 12 | |
| DG Cir | — | — | — | ||
| SPH 4south | — | — | — | ||
| R Mon | — | — | — | ||
| ——— | ——— | ——— | ——— | ||
| SPH 4 | 5156.80 | 1.1 | 0.8 | 12 | |
| DG Cir | — | — | — | ||
| SPH 4south | — | — | — | ||
| R Mon | — | — | — | ||
| ——— | ——— | ——— | ——— | ||
| SPH 4 | 5169.80 | 2.2 | 2.3 | Fe ii(42) 5169.0 | 12 |
| DG Cir | 5168.92 | 3.0 | 3.1 | ||
| SPH 4south | — | — | — | ||
| R Mon | — | — | — | ||
| ——— | ——— | ——— | ——— | ||
| SPH 4 | 5173.61 | 2.1 | 2.1 | Mg i 5172.7 | 12 |
| DG Cir | 5172.51 | 1.6 | 1.5 | ||
| SPH 4south | — | — | — | ||
| R Mon | — | — | — |
Table 5, continued
| Star | Observed wavelength | FWHM | Wλ | Line | Figure |
|---|---|---|---|---|---|
| (Å) | (Å) | (Å) | Identification | ||
| SPH 4 | 5173.61 | 2.1 | 2.1 | Mg i 5172.7 | 12 |
| DG Cir | 5172.51 | 1.6 | 1.5 | ||
| SPH 4south | — | — | — | ||
| R Mon | — | — | — | ||
| ——— | ——— | ——— | ——— | ||
| SPH 4 | 5184.50 | — | — | Mg i 5183.6 | 12 |
| asymmetric | |||||
| profile | |||||
| DG Cir | 5183.60 | 2.5 | 1.3 | ||
| SPH 4south | — | — | — | ||
| R Mon | — | — | — | ||
| ——— | ——— | ——— | ——— | ||
| SPH 4 | 5198.50 | 1.6 | 1.4 | Fe ii (49) 5197.6 | 12 |
| DG Cir | 5197.52 | 1.5 | 0.9 | ||
| SPH 4south | — | — | — | ||
| R Mon | — | — | — | ||
| ——— | ——— | ——— | ——— | ||
| SPH 4 | 5217.17 | — | — | 13 | |
| broad double peak | |||||
| DG Cir | — | — | — | ||
| SPH 4south | — | — | — | ||
| R Mon | — | — | — | ||
| ——— | ——— | ——— | ——— | ||
| SPH 4 | 5227.95 | 1.7 | 1.2 | 13 | |
| DG Cir | 5226.72 | 2.4 | 0.7 | ||
| SPH 4south | — | — | — | ||
| R Mon | — | — | — | ||
| ——— | ——— | ——— | ——— | ||
| SPH 4 | 5233.92 | 0.9 | 0.3 | 13 | |
| DG Cir | — | — | — | ||
| SPH 4south | — | — | — | ||
| R Mon | — | — | — | ||
| ——— | ——— | ——— | ——— | ||
| SPH 4 | 5235.51 | 2.0 | 1.6 | Fe ii(49) 5234.6 | 13 |
| DG Cir | 5234.48 | 2.2 | 0.9 | ||
| SPH 4south | — | — | — | ||
| R Mon | — | — | — | ||
| ——— | ——— | ——— | ——— | ||
| SPH 4 | 5270.78 | 1.9 | 2.1 | 13 | |
| DG Cir | 5259.58 | 2.0 | 1.2 | ||
| SPH 4south | — | — | — | ||
| R Mon | — | — | — |
Table 5, continued
| Star | Observed wavelength | FWHM | Wλ | Line | Figure |
|---|---|---|---|---|---|
| (Å) | (Å) | (Å) | Identification | ||
| SPH 4 | 5276.95 | 1.5 | 2.2 | Fe ii(49) 5276.0 | 13 |
| DG Cir | 5275.95 | 2.0 | 1.5 | ||
| SPH 4south | — | — | — | ||
| R Mon | — | — | — | ||
| ——— | ——— | ——— | ——— | ||
| SPH 4 | 5283.89 | — | — | Fe ii(41) 5284.1 | 13 |
| broad double peak | |||||
| DG Cir | 5285.00 | 1.1 | 1.2 | ||
| SPH 4south | — | — | — | ||
| R Mon | — | — | — | ||
| ——— | ——— | ——— | ——— | ||
| SPH 4 | 5317.58 | — | — | Fe ii(49) 5316.2 | 14 |
| DG Cir | 5316.58 | — | — | ||
| SPH 4south | — | — | — | ||
| R Mon | — | — | — | ||
| ——— | ——— | ——— | ——— | ||
| SPH 4 | 5363.80 | 1.6 | 1.5 | Fe ii(48) 5362.9 | 14 |
| DG Cir | 5362.75 | 1.7 | 0.8 | ||
| SPH 4south | — | — | — | ||
| R Mon | — | — | — | ||
| ——— | ——— | ——— | ——— | ||
| SPH 4 | 5372.34 | 1.0 | 0.8 | 14 | |
| DG Cir | 5371.22 | 2.7 | 0.4 | ||
| flat topped profile | |||||
| SPH 4south | — | — | — | ||
| R Mon | — | — | — | ||
| ——— | ——— | ——— | ——— | ||
| SPH 4 | 5398.00 | 1.2 | 1.2 | 14 | |
| DG Cir | 5396.94 | 1.6 | 0.4 | ||
| SPH 4south | — | — | — | ||
| R Mon | — | — | — | ||
| ——— | ——— | ——— | ——— | ||
| SPH 4 | 5406.70 | 1.6 | 0.9 | 15 | |
| DG Cir | — | — | — | ||
| SPH 4south | — | — | — | ||
| R Mon | — | — | — | ||
| ——— | ——— | ——— | ——— | ||
| SPH 4 | 5415.35 | 2.1 | 0.6 | 15 | |
| DG Cir | — | — | — | ||
| SPH 4south | — | — | — | ||
| R Mon | — | — | — |
Table 5, continued
| Star | Observed wavelength | FWHM | Wλ | Line | Figure |
|---|---|---|---|---|---|
| (Å) | (Å) | (Å) | Identification | ||
| SPH 4 | 5425.92 | — | — | Fe ii(49) 5425.3 | |
| asymmetric profile | 15 | ||||
| DG Cir | 5425.24 | — | — | ||
| flat topped profile | |||||
| SPH 4south | — | — | — | ||
| R Mon | — | — | — | ||
| ——— | ——— | ——— | ——— | ||
| SPH 4 | 5430.60 | 1.4 | 1.2 | 15 | |
| DG Cir | 5429.53 | 2.0 | 0.4 | ||
| SPH 4south | — | — | — | ||
| R Mon | — | — | — | ||
| ——— | ——— | ——— | ——— | ||
| SPH 4 | 5435.09 | — | — | 15 | |
| asymmetric profile | |||||
| DG Cir | 5434.08 | — | — | ||
| double peak | |||||
| SPH 4south | — | — | — | ||
| R Mon | — | — | — | ||
| ——— | ——— | ——— | ——— | ||
| SPH 4 | 5447.83 | 1.2 | 0.8 | 15 | |
| DG Cir | 5447.85 | 2.0 | 0.4 | ||
| double peak | |||||
| SPH 4south | — | — | — | ||
| R Mon | — | — | — | ||
| ——— | ——— | ——— | ——— | ||
| SPH 4 | 5456.50 | 1.2 | 0.8 | 15 | |
| DG Cir | — | — | — | ||
| SPH 4south | — | — | — | ||
| R Mon | — | — | — | ||
| ——— | ——— | ——— | ——— | ||
| SPH 4 | 6138.27 | 2.1 | 1.6 | 17 | |
| DG Cir | 6137.18 | 2.0 | 0.4 | ||
| double peak | |||||
| SPH 4south | — | — | — | ||
| R Mon | — | — | — | ||
| ——— | ——— | ——— | ——— | ||
| SPH 4 | 6142.45 | 1.4 | 0.3 | 17 | |
| DG Cir | — | — | — | ||
| SPH 4south | — | — | — | ||
| R Mon | — | — | — |
Table 5, continued
| Star | Observed wavelength | FWHM | Wλ | Line | Figure |
|---|---|---|---|---|---|
| (Å) | (Å) | (Å) | Identification | ||
| SPH 4 | 6149.68 | — | — | Fe ii(74) 6149.2 | 17 |
| double peak | |||||
| DG Cir | 6148.35 | 3.1 | 0.5 | ||
| SPH 4south | — | — | — | ||
| R Mon | 6150.0 | 5.0 | 1.6 | ||
| ——— | ——— | ——— | ——— | ||
| SPH 4 | 6192.53 | 1.6 | 0.9 | 17 | |
| DG Cir | — | — | — | ||
| SPH 4south | — | — | — | ||
| R Mon | — | — | — | ||
| ——— | ——— | ——— | ——— | ||
| SPH 4 | 6231.81 | 1.8 | 0.6 | 17 | |
| DG Cir | — | — | — | ||
| SPH 4south | — | — | — | ||
| R Mon | — | — | — | ||
| ——— | ——— | ——— | ——— | ||
| SPH 4 | 6239.64 | 2.0 | 0.7 | Fe ii(34) 6238.3 | 17 |
| DG Cir | 6238.56 | — | — | ||
| asymmetric profile | |||||
| SPH 4south | — | — | — | ||
| R Mon | 6240.11 | 4.8 | 0.5 | ||
| ——— | ——— | ——— | ——— | ||
| SPH 4 | 6248.52 | 1.7 | 1.1 | Fe ii(34) 6247.5 | 17 |
| DG Cir | 6247.45 | 2.1 | 0.6 | ||
| SPH 4south | — | — | — | ||
| R Mon | 6249.00 | 4.5 | 1.0 | ||
| ——— | ——— | ——— | ——— | ||
| SPH 4 | 6253.69 | 1.3 | 0.5 | 17 | |
| DG Cir | — | — | — | ||
| SPH 4south | — | — | — | ||
| R Mon | — | — | — | ||
| ——— | ——— | ——— | ——— | ||
| SPH 4 | 6394.71 | 1.6 | 0.6 | 19 | |
| DG Cir | — | — | — | ||
| SPH 4south | — | — | — | ||
| R Mon | — | — | — | ||
| ——— | ——— | ——— | ——— | ||
| SPH 4 | 6401.19 | 1.7 | 0.4 | 19 | |
| DG Cir | — | — | — | ||
| SPH 4south | — | — | — | ||
| R Mon | — | — | — |
Table 5, continued
| Star | Observed wavelength | FWHM | Wλ | Line | Figure |
|---|---|---|---|---|---|
| (Å) | (Å) | (Å) | Identification | ||
| SPH 4 | 6417.98 | 2.3 | 0.5 | Fe ii(74) 6416.9 | 19 |
| DG Cir | 6416.71 | — | — | ||
| asymmetric profile | |||||
| SPH 4south | — | — | — | ||
| R Mon | — | — | — | ||
| ——— | ——— | ——— | ——— | ||
| SPH 4 | 6422.44 | 1.9 | 0.4 | 19 | |
| DG Cir | — | — | — | ||
| SPH 4south | — | — | — | ||
| R Mon | — | — | — | ||
| ——— | ——— | ——— | ——— | ||
| SPH 4 | 6432.40 | 1.9 | 0.4 | Fe ii(40) 6432.7 | 19 |
| double peak | |||||
| DG Cir | 6431.48 | — | — | ||
| asymmetric profile | |||||
| SPH 4south | — | — | — | ||
| R Mon | — | — | — | ||
| ——— | ——— | ——— | ——— | ||
| SPH 4 | 6457.53 | 1.8 | 1.3 | Fe ii(74) 6456.4 | 19 |
| DG Cir | 6456.23 | 2.1 | 0.9 | ||
| SPH 4south | — | — | — | ||
| R Mon | — | — | — | ||
| ——— | ——— | ——— | ——— | ||
| SPH 4 | 6496.15 | 1.7 | 0.7 | 19 | |
| DG Cir | — | — | — | ||
| SPH 4south | — | — | — | ||
| R Mon | — | — | — | ||
| ——— | ——— | ——— | ——— | ||
| SPH 4 | 6517.23 | 1.6 | 1.8 | Fe ii(40) 6516.1 | 19 |
| DG Cir | 6515.93 | 1.8 | 1.1 | ||
| SPH 4south | — | — | — | ||
| R Mon | — | — | — | ||
| ——— | ——— | ——— | ——— | ||
| SPH 4 | 8348.97 | 5.8 | 1.3 | 20 | |
| DG Cir | — | — | — | ||
| SPH 4south | — | — | — | ||
| R Mon | — | — | — | ||
| ——— | ——— | ——— | ——— | ||
| SPH 4 | 8389.13 | 1.6 | 2.2 | 20 | |
| DG Cir | 8387.69 | 2.6 | 1.0 | ||
| SPH 4south | — | — | — | ||
| R Mon | — | — | — |
Table 5, continued
| Star | Observed wavelength | FWHM | Wλ | Line | Figure |
|---|---|---|---|---|---|
| (Å) | (Å) | (Å) | Identification | ||
| SPH 4 | 8394.65 | 3.5 | 0.6 | H i(P20) 8392.40 | 20 |
| DG Cir | 8392.05 | — | — | ||
| asymmetric profile | |||||
| SPH 4south | — | — | — | ||
| R Mon | 8383.60 | 9.5 | 1.8 | ||
| ——— | ——— | ——— | ——— | ||
| SPH 4 | 8414.73 | — | — | H i(Pa19) 8413.30 | 20 |
| contaminated by OH emission | |||||
| DG Cir | 8412.93 | 4.2 | 1.0 | ||
| SPH 4south | — | — | — | ||
| R Mon | 8415.26 | 10.9 | 2.3 | ||
| ——— | ——— | ——— | ——— | ||
| SPH 4 | 8439.35 | 5.4 | 1.0 | 20 | |
| DG Cir | 8438.18 | 4.4 | 1.1 | ||
| SPH 4south | — | — | — | ||
| R Mon | 8440.38 | 9.1 | 2.4 | ||
| ——— | ——— | ——— | ——— | ||
| SPH 4 | 8448.01 | 3.5 | 3.0 | O i 8446.74 | 20 |
| DG Cir | 8446.43 | 3.8 | 4.3 | ||
| SPH 4south | 8446.19 | 3.0 | 0.6 | ||
| double peak | |||||
| R Mon | 8448.52 | 5.3 | 4.5 | ||
| ——— | ——— | ——— | ——— | ||
| SPH 4 | 8469.58 | 2.9 | 1.0 | H i(Pa17) 8467.80 | 20 |
| DG Cir | 8467.22 | 4.0 | 1.3 | ||
| SPH 4south | — | — | — | ||
| R Mon | 8468.84 | 7.9 | 2.0 | ||
| ——— | ——— | ——— | ——— | ||
| SPH 4 | 8499.67 | 3.9 | 27.4 | Ca ii 8498.06 | 20 |
| DG Cir | 8498.02 | 3.6 | 30.0 | ||
| SPH 4south | 8498.17 | 5.5 | 5.4 | ||
| R Mon | 8499.98 | 5.0 | 14.5 | ||
| ——— | ——— | ——— | ——— | ||
| SPH 4 | 8515.64 | 1.8 | 1.1 | Ca ii 8498.06 | 20 |
| DG Cir | — | — | — | ||
| SPH 4south | — | — | — | ||
| R Mon | — | — | — | ||
| ——— | ——— | ——— | ——— | ||
| SPH 4 | — | — | — | Ca ii 8542.14 | 21 |
| DG Cir | — | — | — | ||
| SPH 4south | — | — | — | ||
| R Mon | 8544.31 | 6.0 | 12.8 |
Table 5, continued
| Star | Observed wavelength | FWHM | Wλ | Line | Figure |
|---|---|---|---|---|---|
| (Å) | (Å) | (Å) | Identification | ||
| SPH 4 | 8599.73 | 3.7 | 1.6 | H i 8598.39 | 21 |
| DG Cir | 8598.28 | 4.3 | 4.3 | ||
| SPH 4south | — | — | — | ||
| R Mon | 8599.60 | 10.0 | 3.4 | ||
| ——– | ——— | ——— | ——— | ||
| SPH 4 | — | — | — | 21 | |
| DG Cir | — | — | — | ||
| SPH 4south | — | — | — | ||
| R Mon | 8616.92 | 3.3 | 1.9 | ||
| ——— | ——— | ——— | ——— | ||
| SPH 4 | 8664.00 | 4.4 | 21.9 | Ca ii 8662.17 | 21 |
| DG Cir | 8662.20 | 4.5 | 29.6 | ||
| SPH 4south | 8662.32 | 5.3 | 4.4 | ||
| R Mon | 8664.38 | 6.2 | 11.9 | ||
| ——— | ——— | ——— | ——— | ||
| SPH 4 | 8690.01 | 1.8 | 1.5 | 22 | |
| DG Cir | 8688.38 | 2.4 | 0.7 | ||
| SPH 4south | — | — | — | ||
| R Mon | — | — | — | ||
| ——— | ——— | ——— | ——— | ||
| SPH 4 | 8751.90 | 3.5 | 1.6 | H i(Pa12) 8750.38 | 22 |
| DG Cir | 8750.34 | 4.2 | 2.6 | ||
| SPH 4south | — | — | — | ||
| R Mon | 8751.83 | 9.5 | 4.1 | ||
| ——– | ——— | ——— | ——— | ||
| SPH 4 | 8808.32 | 2.4 | 1.6 | 22 | |
| DG Cir | 8806.44 | 2.9 | 0.9 | ||
| SPH 4south | — | — | — | ||
| R Mon | — | — | — | ||
| ——– | ——— | ——— | ——— | ||
| SPH 4 | 8825.40 | — | — | Fe ii 8824.59 | 22 |
| contaminated by OH emission | |||||
| DG Cir | 8824.40 | 3.4 | 0.7 | ||
| SPH 4south | — | — | — | ||
| R Mon | — | — | — |