Ethics and Governance of Artificial Intelligence: Evidence from a Survey of Machine Learning Researchers
Abstract
Machine learning (ML) and artificial intelligence (AI) researchers play an important role in the ethics and governance of AI, including taking action against what they perceive to be unethical uses of AI (?, ?). Nevertheless, this influential group’s attitudes are not well understood, which undermines our ability to discern consensuses or disagreements between AI/ML researchers. To examine these researchers’ views, we conducted a survey of those who published in the top AI/ML conferences (). We compare these results with those from a 2016 survey of AI/ML researchers (?) and a 2018 survey of the US public (?). We find that AI/ML researchers place high levels of trust in international organizations and scientific organizations to shape the development and use of AI in the public interest; moderate trust in most Western tech companies; and low trust in national militaries, Chinese tech companies, and Facebook. While the respondents were overwhelmingly opposed to AI/ML researchers working on lethal autonomous weapons, they are less opposed to researchers working on other military applications of AI, particularly logistics algorithms. A strong majority of respondents think that AI safety research should be prioritized and that ML institutions should conduct pre-publication review to assess potential harms. Being closer to the technology itself, AI/ML researchers are well placed to highlight new risks and develop technical solutions, so this novel attempt to measure their attitudes has broad relevance. The findings should help to improve how researchers, private sector executives, and policymakers think about regulations, governance frameworks, guiding principles, and national and international governance strategies for AI.
1 Introduction
Tech companies and governments alike see the potential for AI and have moved to develop machine learning, particularly deep learning, applications across a variety of sectors — from healthcare to national security (?, ?). Civil society groups, governments, and academic researchers have expressed concerns about AI related to safety (?, ?), discrimination and racial bias (?, ?), and risks associated with uses of AI in a military and government context (?, ?, ?).
“Narrow” AI applications (such as self-driving cars, lethal autonomous weapons systems, and surveillance systems) have become an immediate cause for concern for AI/ML researchers, policymakers, and the public (?). Over the past two years, corporations, governments, civil society groups, and multi-stakeholder organizations have published dozens of high-level AI ethics principles (?). Some early attempts at international governance include the OECD AI Principles adopted in May 2019 and the G20 Human-centered AI Principles adopted in June 2019 (?, ?).
Technical researchers are crucial in the formation of AI governance. Being close to the technology, AI/ML researchers are well placed to highlight new risks, develop technical solutions, and choose to work for organizations that align with their values. Just as epistemic communities have developed norms to manage technologies that emerged in the 20th century, such as nuclear weapons and chlorofluorocarbons (?, ?, ?), we expect AI/ML researchers to play a key role in AI governance. For example, the Institute for Electrical and Electronics Engineers (IEEE) established the Global Initiative on Ethics of Autonomous and Intelligent Systems in 2016. Leading tech companies such as IBM, Google, and Microsoft have published frameworks and principles intended to guide how they deploy AI systems, and in several cases, have established research positions and units focused on AI ethics (?). Individuals working within the AI/ML community have also begun to take an active role in directly shaping the societal and ethical implications of AI, by engaging with employers and governments (?). For example, in summer 2018, over 3,000 Google employees signed a petition protesting Google’s involvement with Project Maven, a computer vision project run by the US Department of Defense (?).
Through a survey of leading AI/ML researchers, we explore technical experts’ attitudes about the governance of AI. We surveyed 524 AI/ML researchers in September and October 2019 who had a paper accepted at one of two leading AI research conferences: the Conference on Neural Information Processing Systems (NeurIPS) and the International Conference on Machine Learning (ICML). Our survey includes direct measures of trust, including attitudes about private and public sector actors. We then compare those results to a 2018 survey of AI attitudes among the US general public. This allows us to analyze attitudes on the current state of global AI governance: who are the most trusted actors to manage the technology, what AI governance challenges are perceived to be the most important, and which norms have already begun to shape AI development and deployment.
There is a small but growing literature that surveys the AI/ML community. Most existing surveys focus on eliciting researcher forecasts on AI progress, such as when specific milestones will be reached or when AI will surpass human performance at nearly all tasks (?, ?, ?, ?, ?, ?). Others have focused on how computer scientists define AI (?) or the impact of AI on society (?). AI/ML professionals have also been surveyed in regard to their views on working on military-related projects (?) and their immigration pathways and intentions (?). A number of existing studies examine public opinion toward AI. Past survey research related to AI tends to focus on specific governance challenges, such as lethal autonomous weapons (?), algorithmic fairness (?), or facial recognition technology (?, ?). A few large-scale surveys have taken a more comprehensive approach by asking about a range of AI governance challenges (?, ?, ?, ?, ?, ?, ?, ?, ?). While previous work has compared the public’s and AI/ML researchers’ forecast of AI development timelines (?, ?), little work compares the attitudes of AI/ML researchers and the public toward AI governance.
Key results from our survey include:
-
•
Relative to the American public, AI/ML researchers place high levels of trust in international organizations (e.g., the UN, EU, etc.) to shape the development and use of AI in the public interest. While the American public rated the US military as one of the most trustworthy actors, AI/ML researchers place relatively low levels of trust in the militaries of countries where they do research.
-
•
The majority of AI/ML researchers (68%) indicate that AI safety, broadly defined, should be prioritized more than it is at present.
-
•
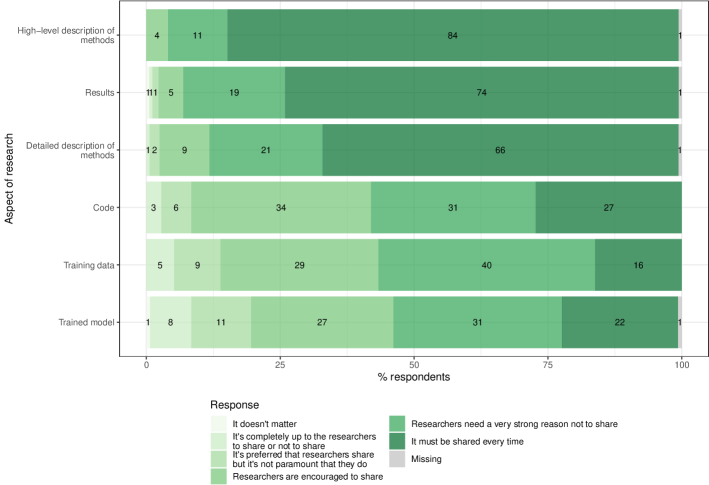
While most researchers support openly sharing all aspects of research, a majority of AI/ML researchers (59%) also support “pre-publication review” for “work that has some chance of adverse impact.” Furthermore, there is considerable variation among the aspects of research that they feel must be shared: 84% think that high-level description of the methods must be shared every time while only 22% think that of the trained model.
-
•
The respondents are wary of AI/ML researchers working on certain military applications of AI. Respondents are the most opposed to other researchers working on lethal autonomous weapons (58% strongly oppose) but far fewer are opposed to others working on logistics algorithms (6% strongly oppose) for the military. 31% of researchers indicate that they would resign or threaten to resign from their jobs, and 25% indicate that they would speak out publicly to the media or online, if their organization decided to work on lethal autonomous weapons.
2 Methods
To study attitudes about trust and governance in AI, we conducted a survey of AI/ML researchers between September 16 and October 13, 2019. The researchers were selected based on having papers accepted at two top AI research conferences, following the sampling frame of (?). One group of respondents had papers accepted to the 2018 NeurIPS conference and the other to the 2018 ICML conference. Another group had papers accepted at NeurIPS and ICML in 2015 and participated in a 2016 researcher survey on AI (?). Out of the 3,030 researchers who were contacted via email to complete our survey, 524 researchers (17%) completed at least some part of the survey. To incentivize participation, we offered one in every ten respondents (via lottery) a gift card of $250 USD. The survey took a median 17.4 minutes to complete.
This paper presents the results from the component of the survey focused on AI governance. Other parts of the survey asked the respondents to forecast developments in AI research and about their immigration preferences. The full text of the survey questions reported in this paper can be found in the Supplementary Materials. We also collected relevant demographic data about the respondents (e.g., country of their undergraduate degree, workplace type, citation count, etc.) using publicly available information. For some questions, we compare responses from this survey with those from the US public. This public opinion data come from a representative national survey of 2,000 US adults conducted in 2018, in which similar questions were asked (?).111For the public opinion results, we weighted the responses to be representative of the US adult population using weights provided to us by the survey firm YouGov that conducted the survey on our behalf.
Our analysis is pre-registered using the Open Science Framework.222The project URL is https://osf.io/fqz82/. Unless specified, we use multiple linear regression to analyze the associations between variables. For estimates of summary statistics or coefficients, “don’t know” or missing responses were re-coded to the weighted overall mean, unconditional on treatment conditions. Almost all questions had a “don’t know” option. If more than 10% of the variable’s values were “don’t know” or missing, we included a (standardized) dummy variable for “don’t know”/missing in the analysis. For survey experiment questions, we compared “don’t know”/missing rates across experimental conditions. Our decision was informed by the Standard Operating Procedures for Don Green’s Lab at Columbia University (?).
Heteroscedasticity-consistent standard errors were used to generate the margins of error at the 95% confidence level. We report cluster-robust standard errors whenever there is clustering by respondent. In figures, each error bar shows the 95% confidence intervals.
3 Results
3.1 Evaluation of AI governance challenges
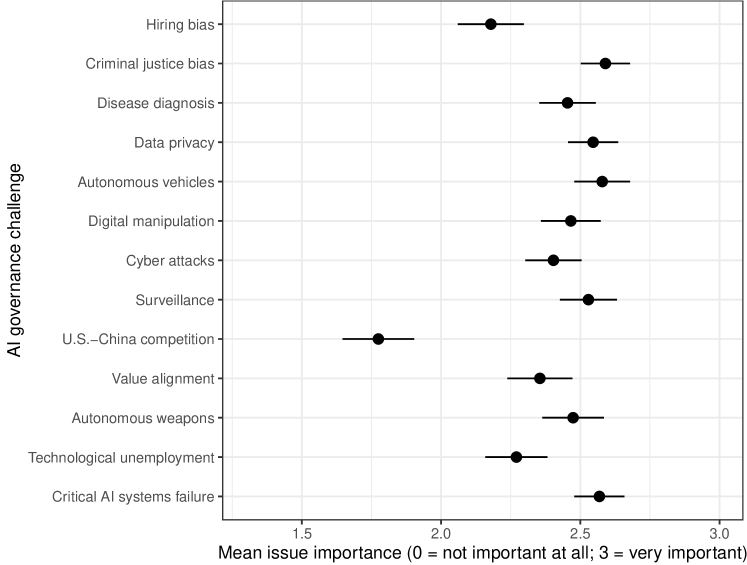
To gauge their views on AI governance challenges, we asked our respondents: “In the next 10 years, how important is it for tech companies and governments to carefully manage the following issues?” Respondents were presented with a list of 5 randomly-selected items out of a total list of 13, that they then assigned a number value on a 4-point slider scale that allowed value input to the tenth decimal place. The scale ranged from 0 “not at all important” to 3 “very important.”333All the multiple-choice questions include an “I don’t know” answer option.
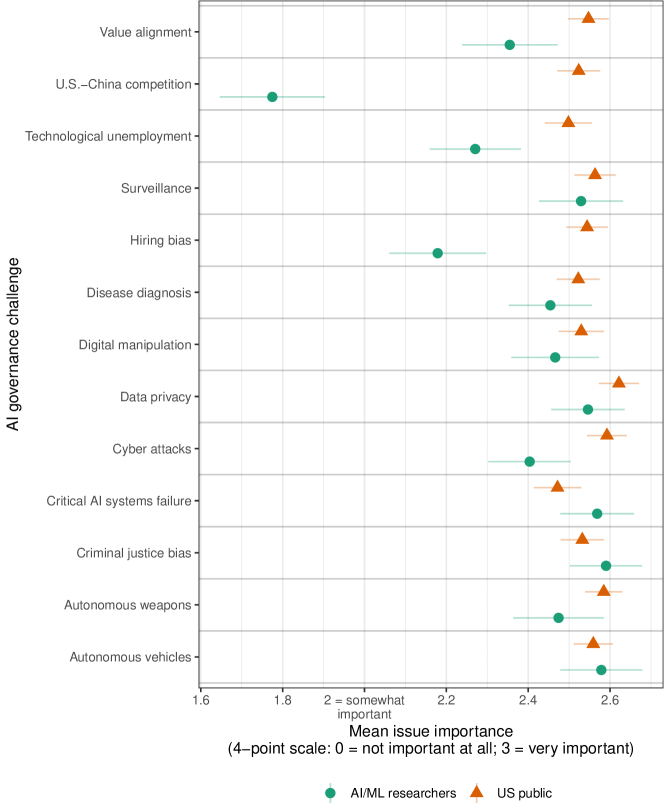
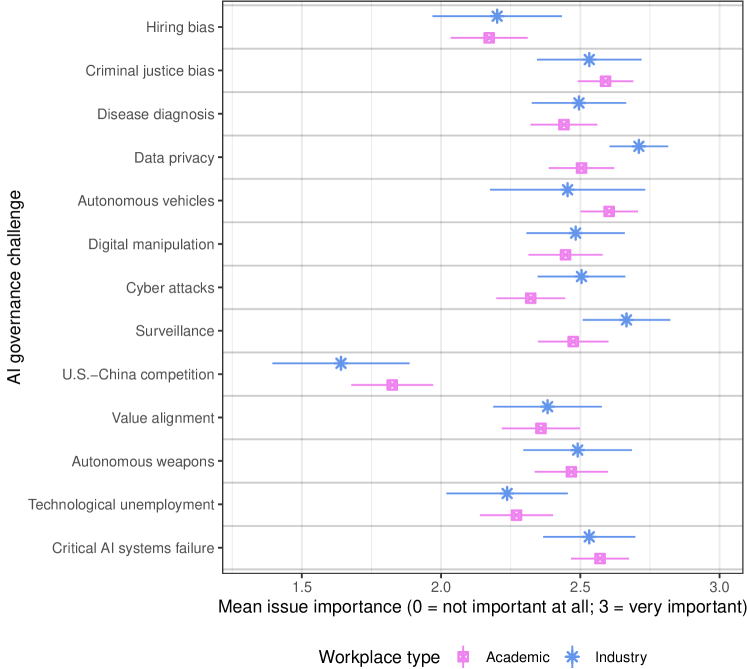
Figure 1 shows the mean importance of AI governance challenges, along with the corresponding 95% confidence interval for both AI/ML researchers and the general public (?). For the AI/ML researcher group, almost all issues were rated as having a mean importance of 2.5, between “somewhat important” and “very important,” with the top five issues including preventing criminal justice bias, ensuring autonomous vehicles are safe, preventing critical AI system failure, protecting data privacy, and preventing mass surveillance. Hiring bias and technological unemployment are rated slightly (about 0.3 points) lower than other issues. The one outlier is “Reducing risks from US-China competition over AI,” is rated significant below the other challenges at 1.8 (just below “somewhat important”); this result may be an artifact of our question phrasing, in that AI/ML researchers may believe that risks from US-China competition are real, but not one that is helped by “tech companies and governments” trying to “carefully manage” them (see the Supplementary Materials for the text of the survey questions). As Table S9 shows, AI/ML researchers who identified as male, compared with those who identify as female or other, tend to have lower issue importance scores across the board.
There is considerable overlap between the assessment of AI governance challenges by AI/ML researchers and the US public (for details, see Table S3). Both groups rate protecting data privacy, preventing mass surveillance, and ensuring that autonomous vehicles are safe as among the five most important governance challenges. AI/ML researchers placed significantly less importance on value alignment444Defined as “AI systems are safe, trustworthy, and aligned with human values”, technological unemployment, and hiring bias, and slightly more importance on critical AI systems failure, criminal justice bias, and autonomous vehicles, than the public.
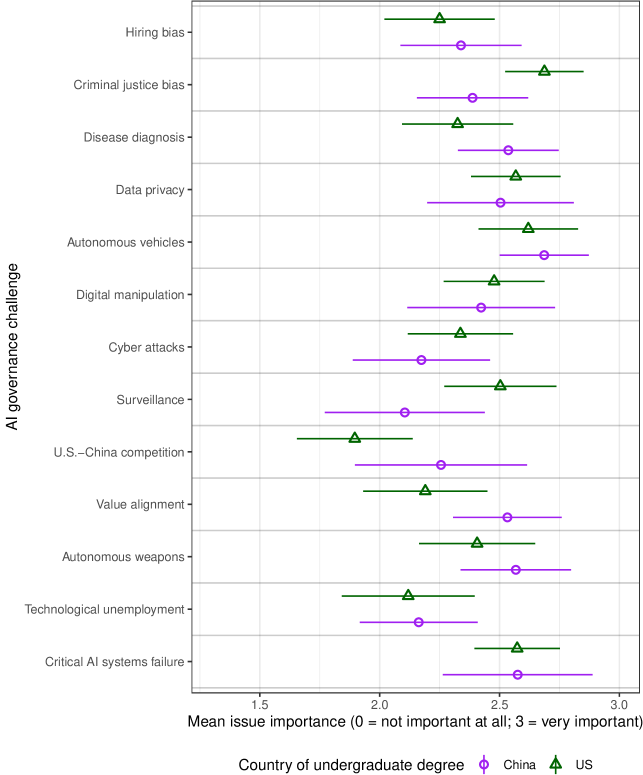
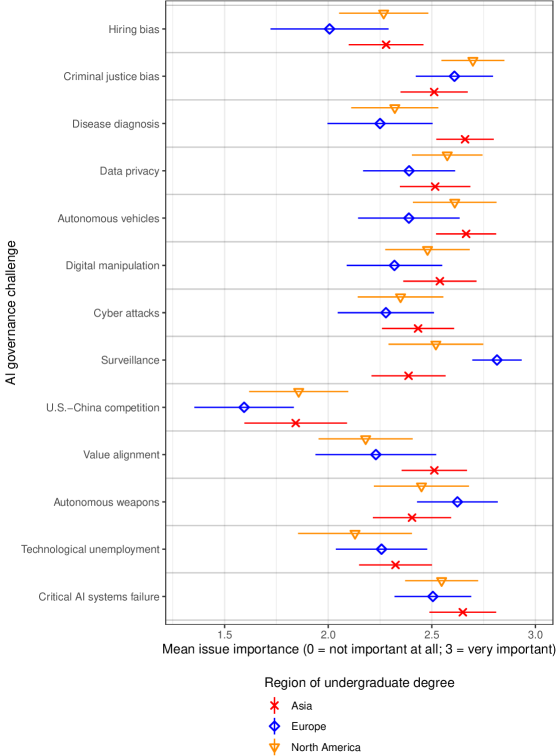
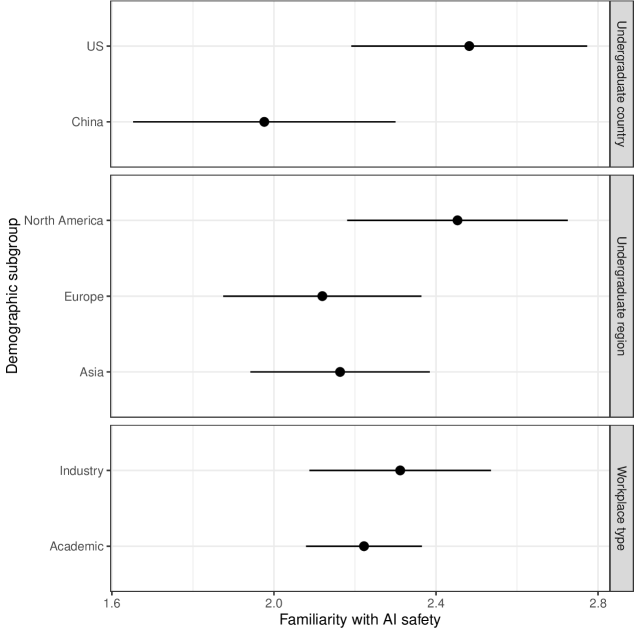
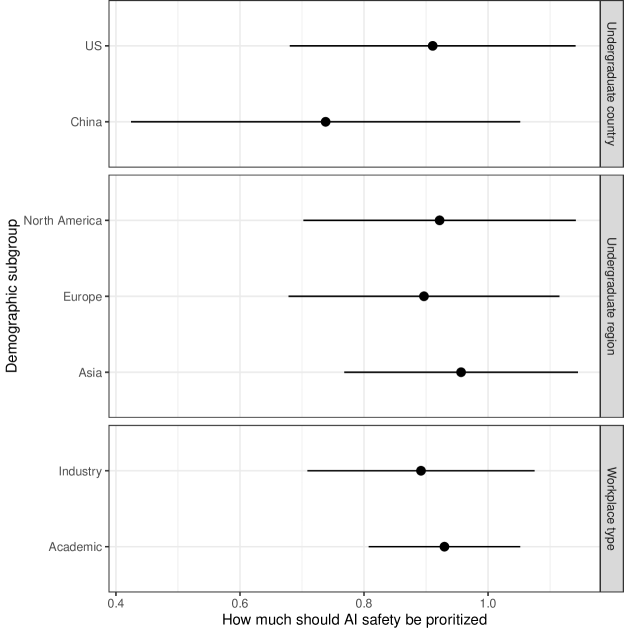
The gap between AI/ML researchers and the US public is particularly large when it comes to preventing the risks from US-China competition in AI. In contrast to AI/ML researchers’ relatively low mean rating of 1.77 out of 3, the US public gave US-China competition a mean rating of 2.52 out of 3. One might think that breaking down the AI/ML researchers’ responses by demographic subgroups (see Figure S2 - S4), would reveal some potential explanations for the response pattern. However, the results are mixed. Respondents who attended undergraduate in China rate this issue relatively high (mean score of 2.26); in contrast, respondents who attended undergraduate in Europe give a mean score of only 1.59. While respondents who attended undergraduate in the US give a mean score of 1.90, the difference is not statistically significantly different to respondents with undergraduate degrees from China.
3.2 Trust in actors to shape the development and use of AI in the public interest
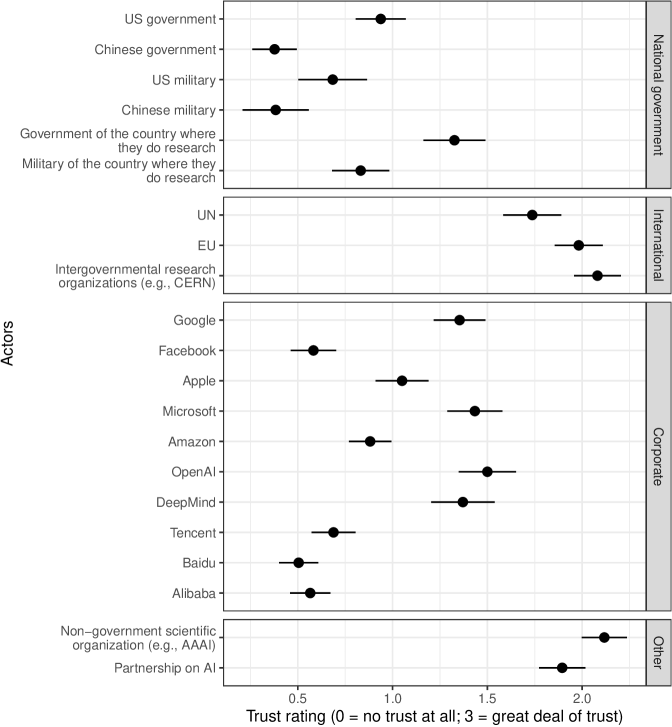
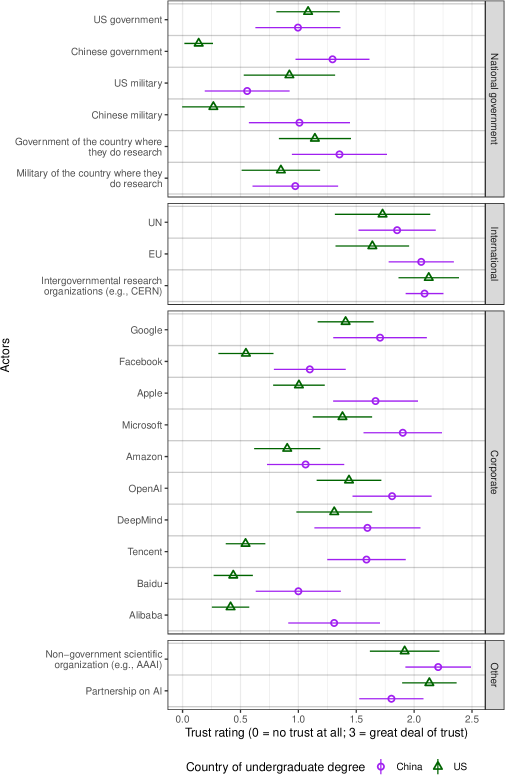
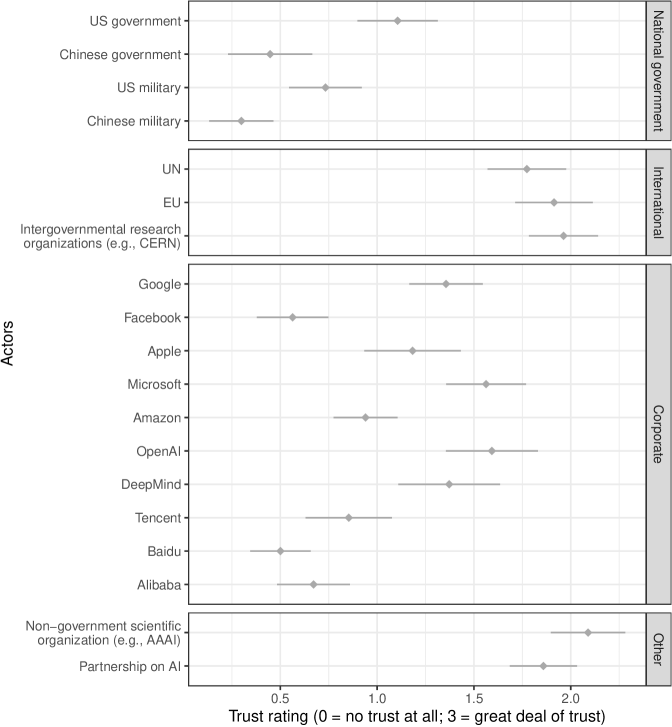
Good governance requires understanding of what institutions and organizations AI/ML researchers (and other stakeholders) trust. To test AI/ML researcher trust in different governance options, we ask: “Suppose the following organizations were in a position to strongly shape the development and use of advanced AI. How much trust do you have in each of these organizations to do so in the best interests of the public?” Similar to the structure of the previous question, respondents were shown 5 randomly-selected actors. For each actor, they then assigned a number value on a 4-point scale ranging from 0 “no trust at all” to 3 “a great deal of trust.”555The US military and the Chinese military were shown only to respondents who reported the US or China as the countries where they spend the most time doing research. These respondents had equal probability of being shown the US military or the Chinese military. Because very few responses came from respondents who do research in China, we dropped their responses in this figure. We break down responses to these two actors by the country where the respondents completed their undergraduate degree (US and China) in Figure S6.
Figure 2 shows the mean trust value for the actors, along with the corresponding 95% confidence interval for both AI/ML researchers and the public. For AI/ML researchers, the most trusted actors, with a score above 2.0, were non-governmental scientific associations and intergovernmental research organizations. The Partnership on AI, a consortium of tech companies, academics, and civil society groups, is also rated relatively highly (mean score of 1.89). Out of the international institutions listed, the European Union (EU) is perceived to be the most trusted, with a mean score of 1.98, while the United Nations’ (UN) mean trust rating is lower at 1.74 (two-sided =0.010).666For comparing trust between actors, we use -tests to test the equality of coefficients from the regression model presented in Table S16. It is noteworthy that these more neutral, scientific organizations received the highest trust ratings but currently play a relatively small role in AI development and management.
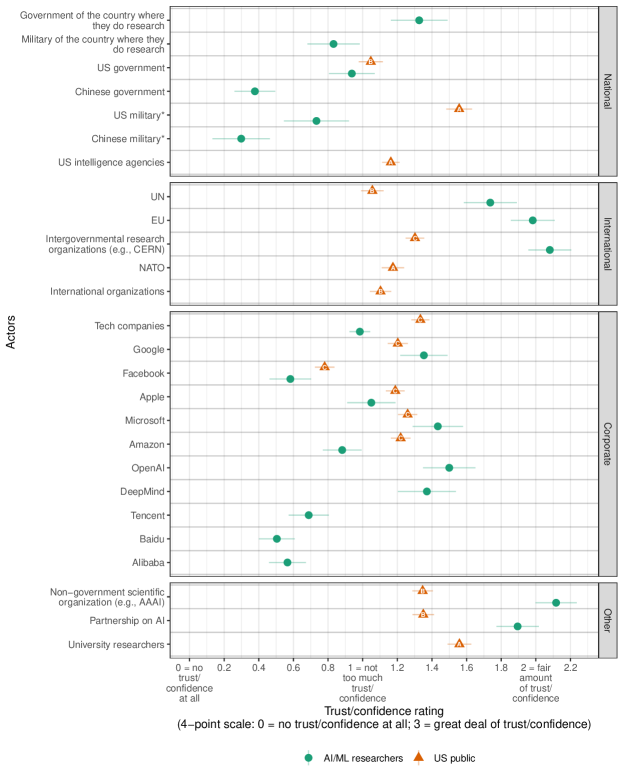
Out of all the private tech companies listed, OpenAI777OpenAI announced in March 2019 that it would move from being a non-profit to being a “capped-profit” company, a for-profit and non-profit hybrid (?). The survey of the public was conducted before this change, whilst the survey of AI/ML researchers occurred afterwards., DeepMind, Google, and Microsoft are relatively more trusted. Facebook is ranked the least trustworthy of American tech companies, and the Chinese companies rated significantly less trustworthy than all listed US tech companies apart from Facebook. State actors, such as the US and Chinese governments or the militaries of the countries where the respondents do research, received relatively low trust scores from AI/ML researchers. In general, respondents trust the government of the country where they do research more than the military of that country (two-sided 0.001). As Figure S6 shows, respondents who attended undergraduate in the US, compared with those who attended undergraduate in China, are significantly less trustful of the Chinese government and military, as well as the three Chinese tech companies presented to respondents (Tencent, Baidu, and Alibaba). The interaction plot in Figure S10 shows that those who attended undergraduate in China trust both Chinese tech companies and Western tech companies more than those who attended undergraduate in the US. The difference in trust in Western versus Chinese tech companies is smaller for those who attended undergraduate in China than those who attended undergraduate in the US (two-sided 0.001), as can be seen in Figure S10.
AI/ML researchers, like the US public, as Figure 2 shows, distrust Facebook more than any other US tech company. A major difference between AI/ML researchers and the US public is their assessment of the military. Whereas surveyed AI/ML researchers, on average, do not have too much trust in the military of the countries where they do research, the US military is among the most trusted of institutions for the US public. Respondents who do research in the US gave the US military a mean rating of 0.73 (below “1 - not too much trust”), whereas the US public gave their country’s military a mean rating of 1.56 (see Tables S10 - S11 and S15).
In contrast, the US public, compared with AI/ML researchers, places much less trust in international institutions such as the UN. AI/ML researchers gave the UN a mean rating of 1.74 while the US public gave a mean rating of 1.06.
3.3 AI safety
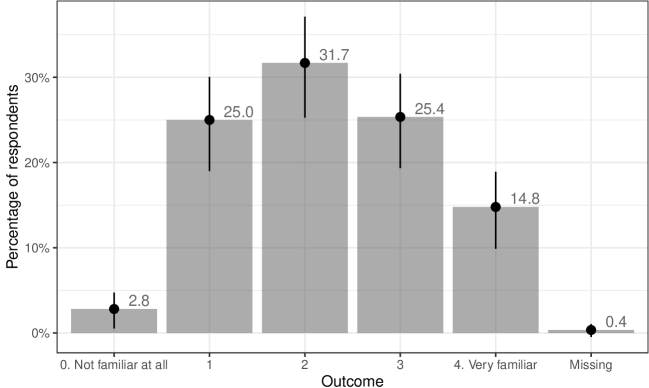
The safety of AI systems may be a critical factor in their development and adoption. We asked respondents about their familiarity with and prioritization of AI safety. We described AI safety in a broad way, as focused on “making AI systems more robust, more trustworthy, and better at behaving in accordance with the operator’s intentions,” and also provided examples (see Supplementary Materials). We first sought to understand how familiar researchers were with AI safety research. We asked them to make a self-assessment using a five-point scale, ranging from 0 “not familiar at all (first time hearing of the concept)” to 4 “very familiar (worked on the topic).” To evaluate views about the value of AI safety research, we asked respondents, “How much should AI safety be prioritized relative to today?” Respondents selected answers on a 5-point Likert scale, ranging from -2 “much less” to 2 “much more” with 0 meaning “about the same.”
The AI/ML researchers we surveyed report, on average, moderate familiarity with AI safety as a concept (see Figure S11). The distribution follows an approximately normal distribution, although it is right-skewed.
3% of respondents say that they are “not familiar at all” with AI safety while 15% say that they are “very familiar.”
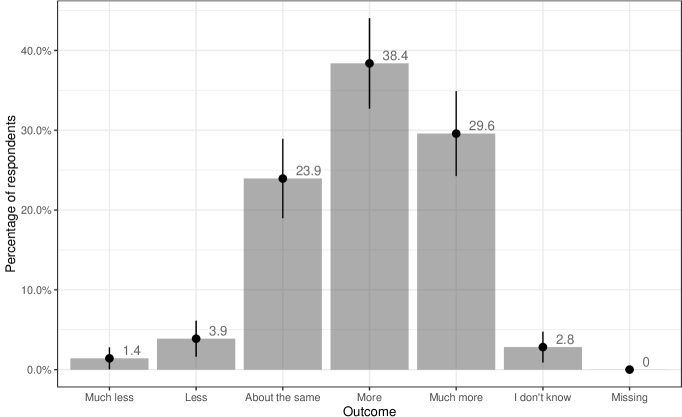
When asked about prioritizing AI safety, as Figure S13 shows, an overwhelming majority of our respondents (68%) say that the field should be prioritized more than at present. These results demonstrate significant growth in the reported prioritization of AI safety in the research community, though these differences may be driven by different definitions. In a similar survey of AI/ML researchers conducted in 2016, 47% of respondents believed that AI safety should be prioritized more than it was at the time (?).888We updated the definition of AI safety research from (?) after consultation with AI/ML researchers working in AI safety research. Contrasting with our definition (see Supplementary Materials), the 2016 definition of AI safety was as “any AI-related research that, rather than being primarily aimed at improving the capabilities of AI systems, is instead primarily aimed at minimizing potential risks of AI systems (beyond what is already accomplished for those goals by increasing AI system capabilities).” The examples provided in 2016 included: improving the human-interpretability of machine learning algorithms for the purpose of improving the safety and robustness of AI systems, not focused on improving AI capabilities; research on long-term existential risks from AI systems; AI-specific formal verification research; and policy research about how to maximize the public benefits of AI.
3.4 Publication norms
The AI/ML research community has recently seen innovation and subsequent controversy regarding publication norms, which also relate to questions of trust. Such norms concern when, how, and where research is published. OpenAI’s release strategy for GPT-2, a text generation system, is a prime example. Citing concerns the system could be used for “malicious purposes”, they employed a staged release strategy; the initial paper was accompanied by a smaller version of GPT-2, the full model only being released 8 months later (?). NeurIPS introduced further innovation, for the first time requiring researchers submit impact statements along with their papers to the 2020 conference (?, ?). The conference also employed a form of pre-publication review, rejecting four papers on ethical grounds after review from ethics advisors.
We asked questions to generate insights into AI/ML researchers views on publication norms. First, we assessed how much they agree or disagree that “machine learning research institutions (including firms, governments, and universities) should practice pre-publication review,” which involves “a strong norm or policy” to have discussions which are “informed, substantive, and serious” about “the ethical implications of publication” (see Supplementary Materials). A majority of respondents agree (20% strongly agree; 39% somewhat agree) with the statement (see Table S28). Additionally, as shown in Table S30, both familiarity with AI safety and prioritization of AI safety significantly predict support for pre-publication review. These results speak to an interest amongst AI/ML researchers to take steps to address the risks of misuse of their work.
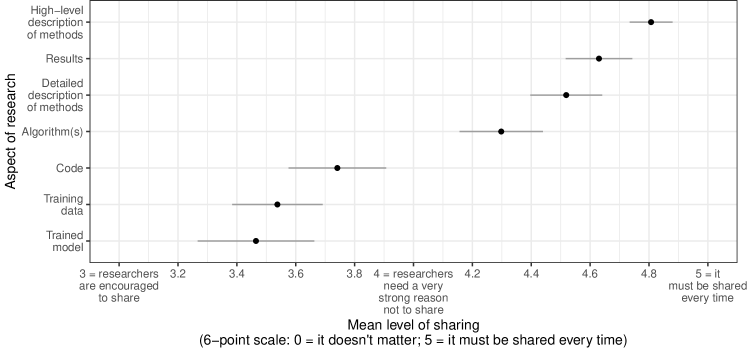
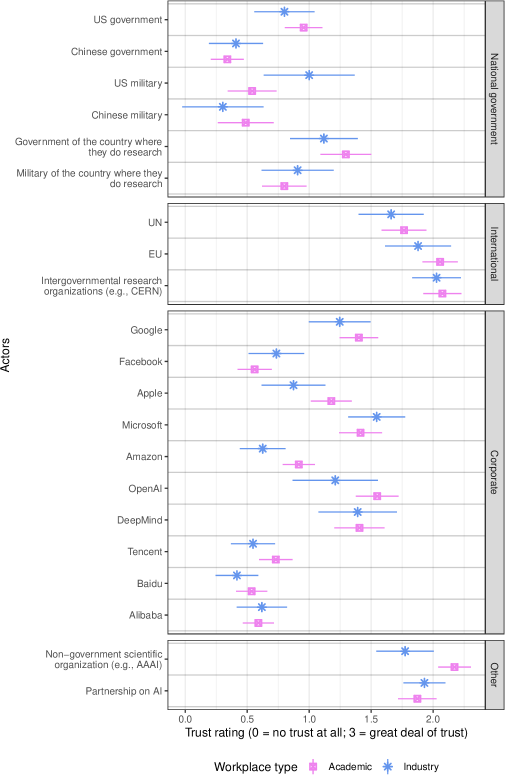
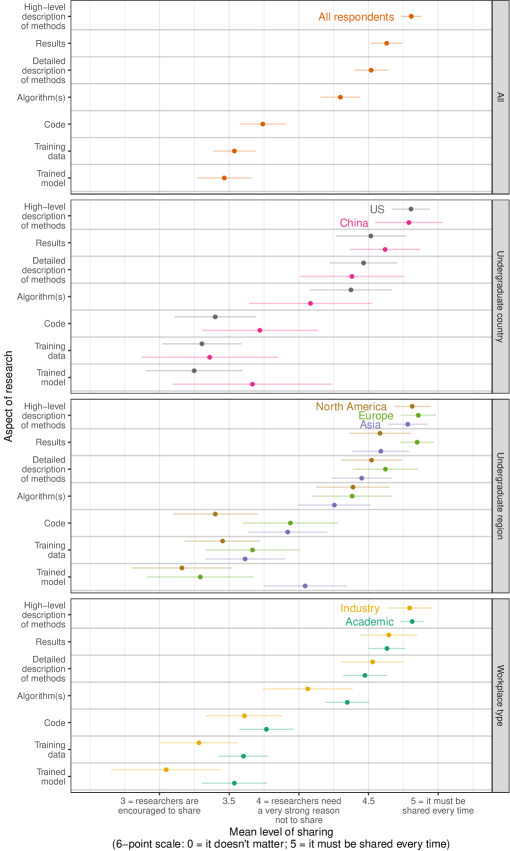
Next, we asked respondents about the importance of sharing various aspects of AI/ML research. Respondents were shown three aspects of research, randomly selected from a list of seven (e.g. high-level description of methods, code, and training data). For each aspect of research, respondents could select from six levels of sharing, ranging from “it doesn’t matter” to “it must be shared every time.” As Figure 3 shows, the respondents think that high-level descriptions of the methods, the results, and a detailed description of the methods should almost always be openly shared. However, support declines for requiring the sharing of other information that would be essential for replication, such as the code, the training data, or the trained model. Researchers felt that sharing these aspects of research should be encouraged, not required. On the high end, 84% indicated that high-level description of methods must be shared every time; on the low end, only 22% indicated that the trained model must be shared every time (see Figure S18). We do not find significant differences in responses between researchers who work in academia versus in industry.
3.5 Attitudes toward military applications of AI
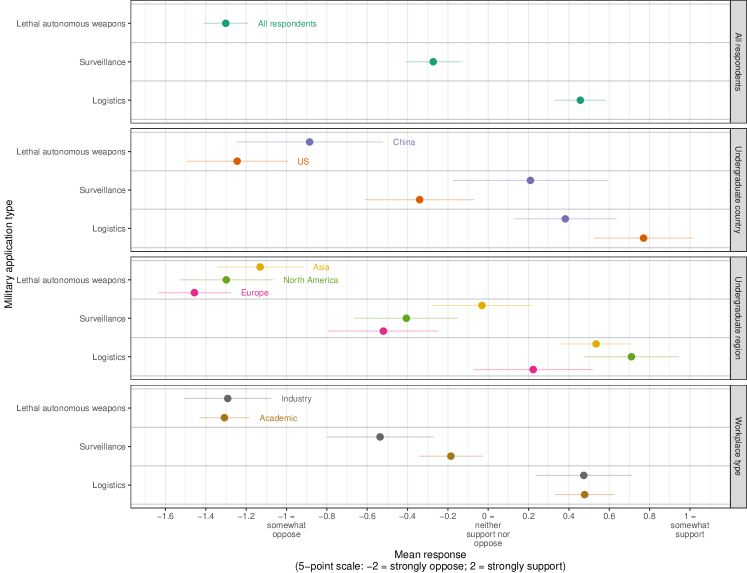
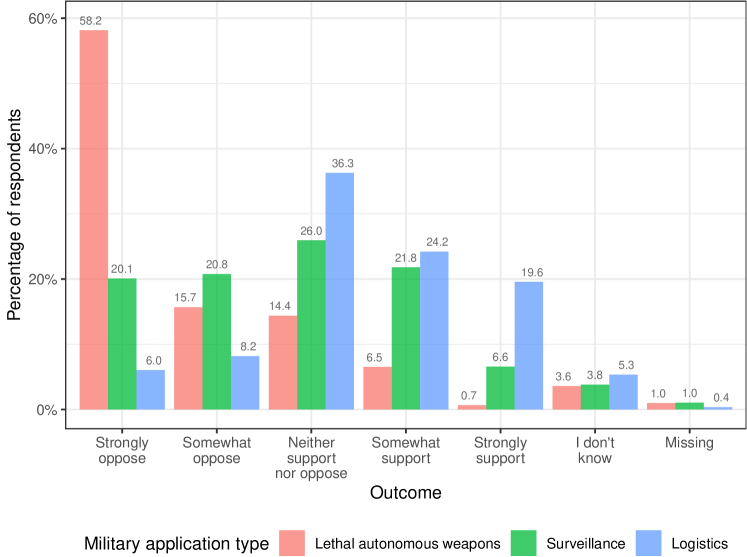
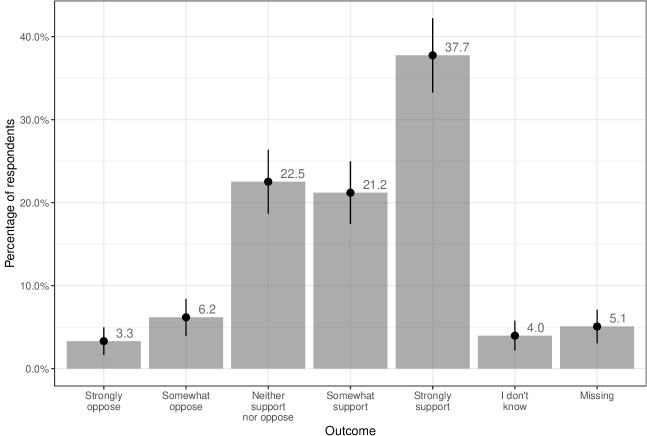
We also investigated researchers’ views toward military applications of AI. Working on military uses of AI requires a great deal of trust in how they might be used, because of the central role that some think AI could play in the future of military power (?). We asked about three areas of military applications of AI that have received public scrutiny: lethal autonomous weapon systems, surveillance technologies for intelligence agencies, and military logistics. Respondents were asked to evaluate two randomly-selected military applications out of the three. They were asked whether they would support or oppose researchers working on the application in the country where the respondent currently works or studies. Respondents selected answers on a Likert scale, ranging from -2 “strongly oppose” to 2 “strongly support.” Those who answered that they “strongly oppose” or “somewhat oppose” researchers working on the applications were asked what types of collective actions (e.g., signing a petition, or protesting) they would take if their organization decided to conduct such research.
Our results show researchers have substantial concerns regarding working on some military applications of AI. Nevertheless, there are nuances to their views. Figure 4 illustrates that researchers, on average, more than somewhat oppose work on lethal autonomous weapon systems (-1.3), very weakly oppose work on surveillance applications (-0.3), and very weakly support work on logistics applications (0.5). Additional detail in Figure S15 demonstrates that 58% strongly oppose other researchers working on lethal autonomous weapons, 20% strongly oppose others working on surveillance tools, but only 6% strongly oppose others working on military logistics. This is consistent with work by Aiken, Kagan, and Page (?), which focuses just on US-based AI professionals and finds that US-based AI professionals are more opposed to working on battlefield applications of AI than other applications.
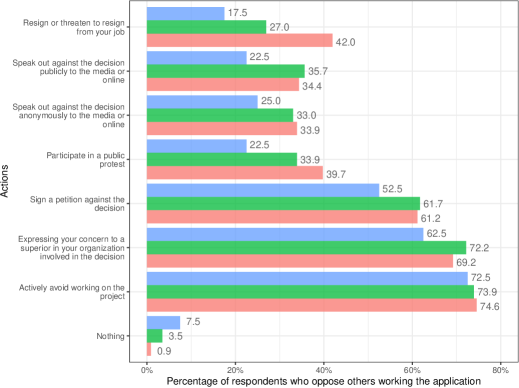
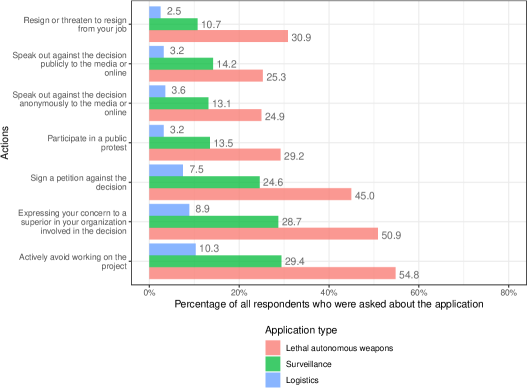
How would these AI/ML researcher attitudes translate into potential action? For each application (lethal autonomous weapon systems, surveillance, and logistics), the respondents who said that they strongly or somewhat opposed other researchers working on the application received a follow-up question asking if they would take action if their organization decided to work on the application. Figure S16 shows the distribution of responses for each application. A majority of researchers who said they opposed others working on each application said that they would actively avoid working on the project, express their concern to a superior in their organization involved in the decision, and sign a petition against the decision. 75% of researchers who said they opposed others working on lethal autonomous weapons said they would avoid working on lethal autonomous weapons themselves, and 42% of those respondents said they would resign or threaten to resign from their jobs. In absolute terms, 31% of researchers indicate that they would resign or threaten to resign from their jobs, and 25% indicate that they would speak out publicly to the media or online if their organization decided to work on lethal autonomous weapons. Of those who say they oppose other researchers working on lethal autonomous weapons, less than 1% said they would do nothing. The percentages for surveillance and logistical software are 4% and 8%, respectively (for further results see Figure S16).
A prominent conflict between the AI/ML community and a national military involved Google engineers protesting their company’s participation in Project Maven in the US. In June 2018, some 3,000 Google employees signed a petition, voicing ethical concerns regarding the project (?). As a result, Google decided not to renew its Project Maven contract with the US Department of Defense.
Given the controversy over Google’s participation in Project Maven, we asked respondents if they supported or opposed Google’s decision not to renew its contract, using a five-point Likert scale with -2 meaning “strongly oppose” to 2 meaning “strongly support.” Figure S17 details broad support within our AI/ML research respondents for Google’s decision to withdraw from Project Maven. 38% strongly support and 21% support Google’s decision to pull out of Project Maven while only 9% strongly or somewhat oppose the decision.
The results are broadly consistent across demographic subgroups, as seen in Figure 4. Generally, across subgroups, respondents are the most opposed to working on lethal autonomous weapons and least opposed to working on military logistics.
4 Conclusion
It is important to recognize some of the limits to our findings, which future research can address. First, our sample strategy focused on those who publish in the top two AI/ML conferences; it thus may underweight the perspective of those subgroups of the AI/ML community who are less likely to publish there, such as perhaps product focused industry researchers. Second, this survey captures the views of the researchers at a particular point in time, while the norms around AI research and publishing continue to evolve, and significant shifts in the psychological, political, and socioeconomic landscape continue to occur, for example, as a result of COVID-19. Future work could expand the sampling frame of respondents (e.g., to include more researchers who work in industry, and develop a more representative sample of the AI/ML community) and include panel studies that examine changes in respondents’ attitudes over time.
Another limitation might include demographic biases or response bias. Demographic characteristics of the respondents and non-respondents are found in Table S1. A multiple regression that examines the association between demographic characteristics and response finds that respondents have lower h-indexes (a measure of productivity and citation impact of researchers) and are more likely to work in academia compared with non-respondents (see Table S2). Overall, however, we do not see evidence of concerning levels of response bias. Compared with other work of its kind, our survey has more respondents, a higher response rate, and more global coverage than other surveys of AI/ML researchers we reviewed. Separately from response bias, there are other aspects of the population of AI/ML researchers worth keeping in mind, such as gender (91% of our respondents and 89% of non-respondents were male).
As institutions, regulations, and norms of AI governance are forming, this survey of AI/ML researchers provides insight into how this emerging epistemic community views the ethical and governance issues related to the technology. The respondents place relatively high levels of trust in international organizations to manage the development and use of AI in the public interest. But compared with the US public who place high levels of trust in the US military, AI/ML researchers are relatively distrustful of the military. Furthermore, the AI/ML researchers we surveyed are very opposed to working on certain military applications of AI, particularly lethal autonomous weapon systems. The respondents are also aware of potential adverse impacts of their research. Finally, a majority of respondents think that AI safety research should be prioritized and researchers should conduct pre-publication reviews to assess the potential harms their research could cause. This line of research could help guide policymakers, tech companies, civil society, and the AI/ML community in building and deploying safe and ethical AI systems.
Acknowledgements
Funding: This research was supported by: the Ethics and Governance of AI Fund, the Open Philanthropy Project grant for “Oxford University – Research on the Global Politics of AI,” and the Minerva Research Initiative under Grant #FA9550-18-1-0194. The research reported here should solely be attributed to the authors; all errors are the responsibilities of the authors.
Authors contributions: A.D., B.Z., M.A., and M.H. (in alphabetical order) designed the research and provided the conceptual framing of the work. B.Z. and M.A. handled the data acquisition. B.Z. and N.D. analyzed the data. A.D., B.Z., L.K., M.A., M.H., and N.D. wrote the paper.
Competing interests: The authors declare no competing interests.
Data and materials availability: Due to the data privacy promised to respondents and that our IRB applications noted that we would not share individual-level results, we cannot release the data in full. We made this decision because the population we are sampling from is a relatively small group of individuals, which increases the likelihood of respondents being identifiable from individual-level data. Instead, we have opted to report detailed breakdowns of the data by key demographics in the Supplementary Materials.
References
- Ada Lovelace Institute Ada Lovelace Institute (2019). Beyond face value: public attitudes to facial recognition technology. Tech. rep., Ada Lovelace Institute.
- Adler Adler, E. (1992). The emergence of cooperation: national epistemic communities and the international evolution of the idea of nuclear arms control. International Organization, 46(1), 101–145.
- Aiken, Dunham, & Zwetsloot Aiken, C., Dunham, J., & Zwetsloot, R. (2020a). Immigration pathways and plans of AI talent. Tech. rep., Center for Security and Emerging Technology.
- Aiken, Kagan, & Page Aiken, C., Kagan, R., & Page, M. (2020b). “Cool projects” or “expanding the efficiency of the murderous American war machine?”: AI professionals’ views on working with the Department of Defense. Tech. rep., Center for Security and Emerging Technology.
- Amodei, Olah, Steinhardt, Christiano, Schulman, & Mané Amodei, D., Olah, C., Steinhardt, J., Christiano, P., Schulman, J., & Mané, D. (2016). Concrete problems in AI safety. CoRR, abs/1606.06565.
- Anderson, Rainie, & Luchsinger Anderson, J., Rainie, L., & Luchsinger, A. (2018). Artificial intelligence and the future of humans. Tech. rep., Pew Research Center.
- Ashurst, Anderljung, Prunkl, Leike, Gal, Shevlane, & Dafoe Ashurst, C., Anderljung, M., Prunkl, C., Leike, J., Gal, Y., Shevlane, T., & Dafoe, A. (2020). A guide to writing the NeurIPS impact statement.. Available at: https://medium.com/@GovAI/a-guide-to-writing-the-neurips-impact-statement-4293b723f832 [accessed: 12 Aug. 2020].
- Balaram, Greenham, & Leonard Balaram, B., Greenham, T., & Leonard, J. (2018). Artificial Intelligence: real public engagement. Tech. rep., RSA.
- Barocas, Hardt, & Narayanan Barocas, S., Hardt, M., & Narayanan, A. (2019). Fairness and Machine Learning. fairmlbook.org. http://www.fairmlbook.org.
- Baum, Goertzel, & Goertzel Baum, S. D., Goertzel, B., & Goertzel, T. G. (2011). How long until human-level AI? Results from an expert assessment. Technological Forecasting & Social Change, 78, 185–195.
- Belfield Belfield, H. (2020). Activism by the AI community: analysing recent achievements and future prospects. In Proceedings of the AAAI/ACM Conference on AI, Ethics, and Society, AIES ’20, p. 15–21, New York, NY, USA. Association for Computing Machinery.
- Brundage, Avin, Clark, Toner, Eckersley, Garfinkel, Dafoe, Scharre, Zeitzoff, Steinhardt, Flynn, Ó hÉigeartaigh, Beard, Belfield, Farquhar, Lyle, Crootof, Evans, Page, Bryson, Yampolskiy, & Amodei Brundage, M., Avin, S., Clark, J., Toner, H., Eckersley, P., Garfinkel, B., Dafoe, A., Scharre, P., Zeitzoff, T., Steinhardt, J., Flynn, C., Ó hÉigeartaigh, S., Beard, S., Belfield, H., Farquhar, S., Lyle, C., Crootof, R., Evans, O., Page, M., Bryson, J., Yampolskiy, R., & Amodei, D. (2018). The malicious use of artificial intelligence: Forecasting, prevention, and mitigation. Tech. rep., Future of Humanity Institute and University of Oxford and Centre for the Study of Existential Risk and University of Cambridge and Center for a New American Security and Electronic Frontier Foundation and OpenAI.
- Butcher & Beridze Butcher, J., & Beridze, I. (2019). What is the state of artificial intelligence governance globally?. The Rusi Journal, 164(5-6), 88–96.
- Cave, Coughlan, & Dihal Cave, S., Coughlan, K., & Dihal, K. (2019). Scary robots: Examining public responses to AI. In Proceedings of the 2019 AAAI/ACM Conference on AI, Ethics, and Society, pp. 331–337. ACM.
- Deahl Deahl, D. (2018). Google employees demand the company pull out of Pentagon AI project.. Available at: https://www.theverge.com/2018/4/4/17199818/google-pentagon-project-maven-pull-out-letter-ceo-sundar-pichai [accessed:12 Nov. 2020.
- Eurobarometer Eurobarometer (2017). Special Eurobarometer 460: Attitudes towards the impact of digitisation and automation on daily life. Tech. rep., Eurobarometer.
- Eurobarometer Eurobarometer (2019). Standard Eurobarometer 92: Autumn 2019 Europeans and artificial intelligence. Tech. rep., Eurobarometer.
- European Commission European Commission (2020). Open public consultation on the European White Paper on Artificial Intelligence: Summary Report on the open public consultation on the White Paper on Artificial Intelligence. Tech. rep., European Commission.
- Fjeld, Achten, Hilligoss, Nagy, & Srikumar Fjeld, J., Achten, N., Hilligoss, H., Nagy, A., & Srikumar, M. (2020). Principled artificial intelligence: Mapping consensus in ethical and rights-based approaches to principles for AI. Tech. rep., Berkman Klein Center for Internet & Society.
- G20 G20 (2019). G20 ministerial statement on trade and digital economy. Tech. rep., G20.
- Grace, Salvatier, Dafoe, Zhang, & Evans Grace, K., Salvatier, J., Dafoe, A., Zhang, B., & Evans, O. (2018). When will AI exceed human performance? Evidence from AI experts. Journal of Artificial Intelligence Research, 62, 729–754.
- Gruetzemacher, Paradice, & Lee Gruetzemacher, R., Paradice, D., & Lee, K. B. (2020). Forecasting extreme labor displacement: A survey of AI practitioners. Technological Forecasting and Social Change, 161. 120323.
- Haas Haas, P. M. (1992a). Banning chlorofluorocarbons: epistemic community efforts to protect stratospheric ozone. International Organization, 46(1), 187–224.
- Haas Haas, P. (1992b). Introduction: epistemic communities and international policy coordination.. International Organization, 46(1), 1–35.
- Hoff & Bashir Hoff, K., & Bashir, M. (2015). Trust in automation: Integrating empirical evidence on factors that influence trust. Human Factors The Journal of the Human Factors and Ergonomics Society, 57, 407–434.
- Horowitz Horowitz, M. C. (2016). Public opinion and the politics of the killer robots debate. Research & Politics, 3(1).
- Horowitz Horowitz, M. C. (2018). Artificial intelligence, international competition, and the balance of power. Texas National Security Review, 1(3).
- Horowitz Horowitz, M. C. (2019). When speed kills: Lethal autonomous weapon systems, deterrence and stability. Journal of Strategic Studies, 42(6), 764–788.
- Kanaan Kanaan, M. (2020). T-Minus AI: Humanity’s Countdown to Artificial Intelligence and the New Pursuit of Global Power. BenBella Books, Dallas, TX.
- Krafft, Young, Katell, Huang, & Bugingo Krafft, P. M., Young, M., Katell, M., Huang, K., & Bugingo, G. (2020). Defining AI in policy versus practice. In Proceedings of the AAAI/ACM Conference on AI, Ethics, and Society, AIES ’20, p. 72–78, New York, NY, USA. Association for Computing Machinery.
- Lin, Balcan, Hadsell, & Ranzato Lin, H.-T., Balcan, M.-F., Hadsell, R., & Ranzato, M. (2020). Getting started with NeurIPS 2020.. Available at: https://medium.com/@NeurIPSConf/getting-started-with-neurips-2020-e350f9b39c28 [accessed: 12 Aug. 2020].
- Lin & Green Lin, W., & Green, D. P. (2016). Standard operating procedures: A safety net for pre-analysis plans. PS: Political Science & Politics, 49(3), 495–500.
- Müller & Bostrom Müller, V. C., & Bostrom, N. (2016). Future progress in artificial intelligence: A survey of expert opinion. In Müller, V. (Ed.), Fundamental Issues of Artificial Intelligence, pp. 553–571. Springer International Publishing, Cham.
- Noble Noble, S. U. (2018). Algorithms of Oppression. NYU Press, New York.
- OpenAI LP OpenAI LP (2019). OpenAI LP.. Available at: https://openai.com/blog/openai-lp/ [accessed: 11 Mar. 2020].
- Russell Russell, S. (2019). Human Compatible: Artificial Intelligence and the Problem of Control. Penguin, New York.
- Sandberg & Bostrom Sandberg, A., & Bostrom, N. (2011). Machine intelligence survey. Tech. rep., Future of Humanity Institute, Oxford University. Technical Report #2011-1.
- Saxena, Huang, DeFilippis, Radanovic, Parkes, & Liu Saxena, N. A., Huang, K., DeFilippis, E., Radanovic, G., Parkes, D. C., & Liu, Y. (2019). How do fairness definitions fare?: Examining public attitudes towards algorithmic definitions of fairness. In Proceedings of the 2019 AAAI/ACM Conference on AI, Ethics, and Society, AIES ’19, pp. 99–106, New York, NY, USA. ACM, Association for Computing Machinery.
- Scharre Scharre, P. (2018). Army of None: Autonomous Weapons and the Future of War. WW Norton & Company, New York.
- Smith Smith, A. (2018). Public attitudes toward computer algorithms. Tech. rep., Pew Research Center.
- Smith Smith, A. (2019). More than half of U.S. adults trust law enforcement to use facial recognition responsibly. Tech. rep., Pew Research Center.
- Smith & Anderson Smith, A., & Anderson, M. (2016). Automation in everyday life. Tech. rep., Pew Research Center.
- Solaiman, Clark, & Brundage Solaiman, I., Clark, J., & Brundage, M. (2019). GPT-2: 1.5B release.. Available at: https://openai.com/blog/gpt-2-1-5b-release/ [accessed: 23 Jul. 2020].
- The OECD Council on Artificial Intelligence The OECD Council on Artificial Intelligence (2019). Recommendation of the council on artificial intelligence. Tech. rep. JT03447952, Organisation for Economic Co-operation and Development.
- Van Noorden Van Noorden, R. (2020). The ethical questions that haunt facial-recognition research. Nature, 587(7834), 354–358.
- Wakabayashi & Shane Wakabayashi, D., & Shane, S. (2018). Google will not renew Pentagon contract that upset employees.. Available at https://www.nytimes.com/2018/06/01/technology/google-pentagon-project-maven.html/ [accessed: 29 Apr. 2020].
- Walsh Walsh, T. (2018). Expert and non-expert opinion about technological unemployment. International Journal of Automation and Computing, 15(5), 637–642.
- West West, D. M. (2018). Brookings survey finds worries over AI impact on jobs and personal privacy, concern U.S. will fall behind China. Tech. rep., The Brookings Institute.
- Zhang & Dafoe Zhang, B., & Dafoe, A. (2019). Artificial intelligence: American attitudes and trends. Tech. rep., Centre for the Governance of AI, University of Oxford.
- Zhang & Dafoe Zhang, B., & Dafoe, A. (2020). US public opinion on the governance of artificial intelligence. In Proceedings of the AAAI/ACM Conference on AI, Ethics, and Society, AIES ’20, p. 187–193, New York, NY, USA. Association for Computing Machinery.
- Zwetsloot & Dafoe Zwetsloot, R., & Dafoe, A. (2019). Thinking about risks from AI: Accidents, misuse and structure.. Available at: https://www.lawfareblog.com/thinking-about-risks-ai-accidents-misuse-and-structure [accessed: 23 Sep. 2020].
Supplementary Materials
Supplementary Text: Text of the Survey
Table S1 - S31
Fig S1 - S19
Supplementary Text: Text of the Survey
Unless specified, the order of the items or scales presented here is the order presented to respondents in the survey.
AI governance challenges
In the next 10 years, how important is it for tech companies and governments to carefully manage the following issues?
[Respondents were shown 5 randomly-selected items.]
-
•
Ensure fairness and transparency in AI used in hiring
-
•
Ensure fairness and transparency in AI used in criminal justice
-
•
Make AI used for medical diagnosis accurate and transparent
-
•
Protect data privacy
-
•
Ensure that autonomous vehicles are safe
-
•
Prevent AI from being used to spread fake and harmful content online
-
•
Prevent AI cyber attacks against governments, companies, organizations, and individuals
-
•
Prevent AI-assisted surveillance from violating privacy and civil liberties
-
•
Reducing risks from US-China competition over AI
-
•
Make sure AI systems are safe, trustworthy, and aligned with human values
-
•
Develop treaties to prevent the misuse of lethal autonomous weapons
-
•
Guarantee a good standard of living for those who lose their jobs to automation
-
•
Prevent critical AI systems failures, such as a multi-day regional power outage or a trillion dollar market crash from automated algorithms
Answer choices: Slider that you can choose in between whole numbers (to 1 decimal point), marked
-
•
3 = Very important
-
•
2 = Somewhat important
-
•
1 = Not too important
-
•
0 = Not at all important
-
•
I don’t know
Trust in actors
Suppose that the following organizations were in a position to strongly shape the development and use of advanced AI. How much trust do you have in each of these organizations to do so in the best interests of the public?
[Respondents were shown 5 randomly-selected actors.]
Included if the person does not work in the US:
-
•
The government of <COUNTRY WHERE THEY DO RESEARCH>999Earlier in the survey, respondents were asked the following question: “In which country do you spend the most time doing research?”. Respondents input the country from a drop-down menu. Those who did not input a country were assigned “the country where you do research” in questions that piped in the country where the respondent spent most of their time doing research.
-
•
The military of <COUNTRY WHERE THEY DO RESEARCH>
Included if the person works in the US or China:
-
•
The US military
-
•
The Chinese military
To everyone else:
-
•
The US government
-
•
The Chinese government
-
•
The United Nations (UN)
-
•
The European Union (EU)
-
•
An intergovernmental AI research organization (similar to CERN)
-
•
Google
-
•
Facebook
-
•
Apple
-
•
Microsoft
-
•
Amazon
-
•
OpenAI
-
•
DeepMind
-
•
Tencent
-
•
Baidu
-
•
Alibaba
-
•
Non-governmental scientific organizations (e.g., AAAI)
-
•
Partnership on AI, a consortium of tech companies, academics, and civil society groups
Answer choices:
-
•
A great deal of trust (3)
-
•
A fair amount of trust (2)
-
•
Not too much trust (1)
-
•
No trust at all (0)
-
•
I don’t know
AI safety
AI safety introduction
AI safety research focuses on making AI systems more robust, more trustworthy, and better at behaving in accordance with the operator’s intentions.
Examples of such AI safety research include:
-
•
Making AI algorithms interpretable to humans
-
•
Making sure that an AI system is robust to distributional shifts or adversarial inputs
-
•
Making sure that an AI system’s behavior aligns with the operator’s true intentions
Familiarity with AI safety research
How familiar are you with AI safety research?
Use the slider to indicate your familiarity.
-
•
0 means not familiar at all (e.g., this is the first time you’re hearing about the concept)
-
•
4 means very familiar (e.g., you have worked on the topic)
Prioritizing AI safety research
How much should AI safety research be prioritized – by, for instance, the tech industry, the academic field, and governments – relative to today?
Answer choices:
-
•
Much less (-2)
-
•
Less (-1)
-
•
About the same (0)
-
•
More (1)
-
•
Much more (2)
-
•
I don’t know
Attitudes toward military application of AI
Support for others and themselves researching military technology
[Respondents where shown 2 out of the 3 applications below; the order that the two questions were shown appear were randomized.]
Do you support or oppose researchers in <COUNTRY WHERE THEY DO RESEARCH>working on the development of lethal autonomous weapons to be used by the military of <COUNTRY WHERE THEY DO RESEARCH>?
Lethal autonomous weapons are systems that, once activated by a human, are capable of targeting and firing on their own.
Do you support or oppose researchers in <COUNTRY WHERE THEY DO RESEARCH>working on the development of surveillance technologies to be used by intelligence agencies of <COUNTRY WHERE THEY DO RESEARCH>?
Intelligence agencies could use AI to expand their capacity to analyze image, video, sound, and text data.
Do you support or oppose researchers in <COUNTRY WHERE THEY DO RESEARCH>working on the development of logistics algorithms to optimize storage and transportation for the military of <COUNTRY WHERE THEY DO RESEARCH>?
The military could use machine learning algorithms to improve their logistics, such as the storage, purchasing and transportation of weapons and food.
Answer choices:
-
•
Strongly support (2)
-
•
Somewhat support (1)
-
•
Neither support nor oppose (0)
-
•
Somewhat oppose (-1)
-
•
Strongly oppose (-2)
-
•
I don’t know
[For each of the questions above, if they selected “somewhat oppose” or “strongly oppose” above, the respondents were shown the respective question below.]
Suppose your organization has decided to research lethal autonomous weapons to be used by the military of <COUNTRY WHERE THEY DO RESEARCH>. Which, if any, of the following actions would you take?
Suppose your organization has decided to research surveillance technologies to be used by intelligence agencies of <COUNTRY WHERE THEY DO RESEARCH>. Which, if any, of the following actions would you take?
Suppose your organization has decided to research logistics algorithms to optimize storage and transportation for the military of <COUNTRY WHERE THEY DO RESEARCH>. Which, if any, of the following actions would you take?
-
•
Nothing
-
•
Actively avoid working on the project
-
•
Expressing your concern to a superior in your organization involved in the decision
-
•
Sign a petition against the decision
-
•
Participate in a public protest
-
•
Speak out against the decision anonymously to the media or online
-
•
Speak out against the decision publicly to the media or online
-
•
Resign or threaten to resign from your job
-
•
Other: [short textbox]
Project Maven
Google had a contract to work on Project Maven, a US Department of Defense project that develops and integrates computer vision algorithms to support military operations. Some Google employees voiced ethical concerns regarding the project. Google decided not to renew its Project Maven contract with the US Department of Defense.
Do you support or oppose this decision by Google not to renew its contract?
Answer choices:
-
•
Strongly support (2)
-
•
Somewhat support (1)
-
•
Neither support nor oppose (0)
-
•
Somewhat oppose (-1)
-
•
Strongly oppose (-2)
-
•
I don’t know
[Optional question]: Would you like to elaborate on the reasoning behind your previous answer? [Text box]
Publication norms
Pre-publication review
Define “pre-publication review” as follows: For work that has some chance of adverse impacts, having a strong norm or policy to have discussions about the ethical implications of publication that are
-
•
Informed: the discussion includes the lead and senior authors
-
•
Substantive: the discussion lasts for at least an hour
-
•
Serious: the discussion can lead to real-world decisions (e.g., not to publish parts of the research in question)
Taking into account the cost (e.g., in terms of researcher time) to what extent do you agree or disagree with the following statement?
Machine learning research institutions (including firms, governments, and universities) should practice pre-publication review.
-
•
Strongly agree (2)
-
•
Somewhat agree (1)
-
•
Somewhat disagree (-1)
-
•
Strongly disagree (-2)
-
•
I don’t know
Sharing various aspects of research
What is your view toward publicly sharing the following aspects of research, such as at conferences, in academic journals, or online?
[Respondents were shown 3 aspects of research.]
-
•
High-level description of methods
-
•
Detailed description of methods
-
•
Results
-
•
Code
-
•
Training data
-
•
Trained model
-
•
Algorithm(s)
Answer choices:
-
•
It must be shared every time (5)
-
•
Researchers need a very strong reason not to share (4)
-
•
Researchers are encouraged to share (3)
-
•
It’s preferred that researchers share but it’s not paramount that they do (2)
-
•
It’s completely up to the researchers to share or not to share (1)
-
•
It doesn’t matter (0)
Demographics of survey respondents
| Variable | Nonrespondent | Respondent | Difference (SE) | Percent missing |
|---|---|---|---|---|
| Prop. male | 0.89 | 0.91 | 0.01 (0.02) | 0.01 |
| Mean undergrad graduation year | 2007.62 | 2008.95 | 1.33 (0.47) | 0.21 |
| Prop. undergrad region: North America | 0.25 | 0.27 | 0.02 (0.03) | 0.15 |
| Prop. undergrad region: Europe | 0.26 | 0.29 | 0.02 (0.03) | 0.15 |
| Prop. undergrad region: Asia | 0.43 | 0.39 | -0.04 (0.03) | 0.15 |
| Prop. undergrad region: Other | 0.04 | 0.05 | 0.01 (0.01) | 0.15 |
| Prop. PhD region: North America | 0.28 | 0.33 | 0.06 (0.03) | 0.08 |
| Prop. PhD region: Europe | 0.59 | 0.53 | -0.07 (0.03) | 0.08 |
| Prop. PhD region: Asia | 0.11 | 0.09 | -0.01 (0.02) | 0.08 |
| Prop. PhD region: Other | 0.02 | 0.02 | 0.01 (0.01) | 0.08 |
| Prop. currently enrolled in PhD | 0.20 | 0.33 | 0.12 (0.03)*** | 0.05 |
| Mean log citations (all) | 6.75 | 6.26 | -0.49 (0.12)*** | 0.17 |
| Mean h-index (all) | 19.68 | 14.42 | -5.26 (1.12)*** | 0.17 |
| Prop. work region: Europe | 0.28 | 0.33 | 0.05 (0.03) | 0.01 |
| Prop. work region: North America | 0.59 | 0.54 | -0.05 (0.03) | 0.01 |
| Prop. work region: Asia | 0.12 | 0.12 | ¡0.01 (0.02) | 0.01 |
| Prop. work region: Other | 0.01 | 0.02 | 0.01 (0.01) | 0.01 |
| Prop. work in academia | 0.68 | 0.80 | 0.12 (0.03)*** | 0.00 |
| Prop. work in industry | 0.36 | 0.35 | -0.01 (0.03) | 0.00 |
| Coefficient (SE) | |
| (Intercept) | 0.540∗∗∗ |
| (0.016) | |
| Male | 0.022 |
| (0.016) | |
| Undergrad graduation year | 0.002 |
| (0.021) | |
| Undergrad region: Europe | 0.030 |
| (0.022) | |
| Undergrad region: Asia | 0.037 |
| (0.020) | |
| Undergrad region: Other | 0.013 |
| (0.018) | |
| PhD region: Europe | 0.039 |
| (0.026) | |
| PhD region: Asia | 0.019 |
| (0.023) | |
| PhD region: Other | 0.009 |
| (0.021) | |
| Currently enrolled in PhD | 0.033 |
| (0.019) | |
| Log all citations | 0.022 |
| (0.028) | |
| All h-index | 0.083∗ |
| (0.026) | |
| Work region: Europe | 0.017 |
| (0.026) | |
| Work region: Asia | 0.034 |
| (0.024) | |
| Work region: Other | 0.014 |
| (0.021) | |
| Work in academia | 0.069∗∗∗ |
| (0.017) | |
| Missing: undergrad year | 0.001 |
| (0.028) | |
| Missing: undergrad region | 0.044 |
| (0.028) | |
| Missing: all citations | 0.009 |
| (0.016) | |
| N | 970 |
| * p 0.05, ** p 0.01, *** p 0.001 | |
| F(18, 951) = 4.196; p-value: | |
Additional figures
Evaluation of AI governance challenges
Trust in actors to shape the development and use of AI in the public interest
AI safety
Attitudes toward military applications of AI
Publication norms
Additional tables
Evaluation of AI governance challenges
| Governance challenge | Mean | SE | N | Respondent type |
|---|---|---|---|---|
| Hiring bias | 2.18 | 0.06 | 170 | AI/ML researchers |
| Criminal justice bias | 2.59 | 0.05 | 167 | AI/ML researchers |
| Disease diagnosis | 2.45 | 0.05 | 147 | AI/ML researchers |
| Data privacy | 2.55 | 0.05 | 177 | AI/ML researchers |
| Autonomous vehicles | 2.58 | 0.05 | 165 | AI/ML researchers |
| Digital manipulation | 2.47 | 0.05 | 157 | AI/ML researchers |
| Cyber attacks | 2.40 | 0.05 | 176 | AI/ML researchers |
| Surveillance | 2.53 | 0.05 | 172 | AI/ML researchers |
| US-China competition | 1.77 | 0.07 | 159 | AI/ML researchers |
| Value alignment | 2.35 | 0.06 | 156 | AI/ML researchers |
| Autonomous weapons | 2.47 | 0.06 | 157 | AI/ML researchers |
| Technological unemployment | 2.27 | 0.06 | 168 | AI/ML researchers |
| Critical AI systems failure | 2.57 | 0.05 | 179 | AI/ML researchers |
| Hiring bias | 2.54 | 0.03 | 760 | US Public |
| Criminal justice bias | 2.53 | 0.03 | 778 | US Public |
| Disease diagnosis | 2.52 | 0.03 | 767 | US Public |
| Data privacy | 2.62 | 0.03 | 807 | US Public |
| Autonomous vehicles | 2.56 | 0.02 | 796 | US Public |
| Digital manipulation | 2.53 | 0.03 | 741 | US Public |
| Cyber attacks | 2.59 | 0.02 | 745 | US Public |
| Surveillance | 2.56 | 0.03 | 784 | US Public |
| US-China competition | 2.52 | 0.03 | 766 | US Public |
| Value alignment | 2.55 | 0.03 | 783 | US Public |
| Autonomous weapons | 2.58 | 0.02 | 757 | US Public |
| Technological unemployment | 2.50 | 0.03 | 738 | US Public |
| Critical AI systems failure | 2.47 | 0.03 | 778 | US Public |
| Ranking | AI/ML researchers | US Public |
|---|---|---|
| 1 | Criminal justice bias | Data privacy |
| 2 | Autonomous vehicles | Cyber attacks |
| 3 | Critical AI systems failure | Autonomous weapons |
| 4 | Data privacy | Surveillance |
| 5 | Surveillance | Autonomous vehicles |
| Governance challenge | Mean | SE | N | Undergraduate country |
|---|---|---|---|---|
| Hiring bias | 2.25 | 0.12 | 36 | US |
| Criminal justice bias | 2.69 | 0.08 | 47 | US |
| Disease diagnosis | 2.33 | 0.12 | 34 | US |
| Data privacy | 2.57 | 0.10 | 42 | US |
| Autonomous vehicles | 2.62 | 0.11 | 35 | US |
| Digital manipulation | 2.48 | 0.11 | 37 | US |
| Cyber attacks | 2.34 | 0.11 | 38 | US |
| Surveillance | 2.50 | 0.12 | 30 | US |
| US-China competition | 1.90 | 0.12 | 39 | US |
| Value alignment | 2.19 | 0.13 | 31 | US |
| Autonomous weapons | 2.41 | 0.12 | 38 | US |
| Technological unemployment | 2.12 | 0.14 | 35 | US |
| Critical AI systems failure | 2.57 | 0.09 | 43 | US |
| Hiring bias | 2.34 | 0.13 | 23 | China |
| Criminal justice bias | 2.39 | 0.12 | 24 | China |
| Disease diagnosis | 2.54 | 0.11 | 26 | China |
| Data privacy | 2.50 | 0.16 | 24 | China |
| Autonomous vehicles | 2.69 | 0.09 | 31 | China |
| Digital manipulation | 2.42 | 0.16 | 20 | China |
| Cyber attacks | 2.17 | 0.15 | 23 | China |
| Surveillance | 2.10 | 0.17 | 27 | China |
| US-China competition | 2.26 | 0.18 | 17 | China |
| Value alignment | 2.53 | 0.12 | 23 | China |
| Autonomous weapons | 2.57 | 0.12 | 25 | China |
| Technological unemployment | 2.16 | 0.13 | 25 | China |
| Critical AI systems failure | 2.58 | 0.16 | 22 | China |
| Governance challenge | Mean | SE | N | Undergraduate region |
|---|---|---|---|---|
| Hiring bias | 2.01 | 0.15 | 43 | Europe |
| Criminal justice bias | 2.61 | 0.10 | 43 | Europe |
| Disease diagnosis | 2.25 | 0.13 | 30 | Europe |
| Data privacy | 2.39 | 0.11 | 41 | Europe |
| Autonomous vehicles | 2.39 | 0.12 | 37 | Europe |
| Digital manipulation | 2.32 | 0.12 | 41 | Europe |
| Cyber attacks | 2.28 | 0.12 | 41 | Europe |
| Surveillance | 2.81 | 0.06 | 42 | Europe |
| US-China competition | 1.59 | 0.12 | 42 | Europe |
| Value alignment | 2.23 | 0.15 | 42 | Europe |
| Autonomous weapons | 2.62 | 0.10 | 32 | Europe |
| Technological unemployment | 2.26 | 0.11 | 35 | Europe |
| Critical AI systems failure | 2.50 | 0.09 | 41 | Europe |
| Hiring bias | 2.27 | 0.11 | 40 | North America |
| Criminal justice bias | 2.70 | 0.08 | 52 | North America |
| Disease diagnosis | 2.32 | 0.11 | 40 | North America |
| Data privacy | 2.57 | 0.09 | 47 | North America |
| Autonomous vehicles | 2.61 | 0.10 | 38 | North America |
| Digital manipulation | 2.48 | 0.10 | 40 | North America |
| Cyber attacks | 2.35 | 0.11 | 45 | North America |
| Surveillance | 2.52 | 0.12 | 31 | North America |
| US-China competition | 1.86 | 0.12 | 44 | North America |
| Value alignment | 2.18 | 0.12 | 36 | North America |
| Autonomous weapons | 2.45 | 0.12 | 41 | North America |
| Technological unemployment | 2.13 | 0.14 | 40 | North America |
| Critical AI systems failure | 2.55 | 0.09 | 46 | North America |
| Hiring bias | 2.28 | 0.09 | 55 | Asia |
| Criminal justice bias | 2.51 | 0.08 | 44 | Asia |
| Disease diagnosis | 2.66 | 0.07 | 49 | Asia |
| Data privacy | 2.52 | 0.09 | 53 | Asia |
| Autonomous vehicles | 2.67 | 0.07 | 67 | Asia |
| Digital manipulation | 2.54 | 0.09 | 56 | Asia |
| Cyber attacks | 2.43 | 0.09 | 60 | Asia |
| Surveillance | 2.39 | 0.09 | 63 | Asia |
| US-China competition | 1.84 | 0.13 | 47 | Asia |
| Value alignment | 2.51 | 0.08 | 55 | Asia |
| Autonomous weapons | 2.40 | 0.10 | 57 | Asia |
| Technological unemployment | 2.32 | 0.09 | 68 | Asia |
| Critical AI systems failure | 2.65 | 0.08 | 56 | Asia |
| Governance challenge | Mean | SE | N | Workplace type |
|---|---|---|---|---|
| Hiring bias | 2.17 | 0.07 | 131 | Academic |
| Criminal justice bias | 2.59 | 0.05 | 124 | Academic |
| Disease diagnosis | 2.44 | 0.06 | 113 | Academic |
| Data privacy | 2.50 | 0.06 | 125 | Academic |
| Autonomous vehicles | 2.60 | 0.05 | 131 | Academic |
| Digital manipulation | 2.45 | 0.07 | 113 | Academic |
| Cyber attacks | 2.32 | 0.06 | 132 | Academic |
| Surveillance | 2.47 | 0.06 | 127 | Academic |
| US-China competition | 1.82 | 0.07 | 123 | Academic |
| Value alignment | 2.36 | 0.07 | 111 | Academic |
| Autonomous weapons | 2.47 | 0.07 | 117 | Academic |
| Technological unemployment | 2.27 | 0.07 | 128 | Academic |
| Critical AI systems failure | 2.57 | 0.05 | 135 | Academic |
| Hiring bias | 2.20 | 0.12 | 42 | Industry |
| Criminal justice bias | 2.53 | 0.10 | 43 | Industry |
| Disease diagnosis | 2.50 | 0.09 | 42 | Industry |
| Data privacy | 2.71 | 0.05 | 53 | Industry |
| Autonomous vehicles | 2.45 | 0.14 | 35 | Industry |
| Digital manipulation | 2.48 | 0.09 | 46 | Industry |
| Cyber attacks | 2.50 | 0.08 | 48 | Industry |
| Surveillance | 2.67 | 0.08 | 52 | Industry |
| US-China competition | 1.64 | 0.13 | 40 | Industry |
| Value alignment | 2.38 | 0.10 | 51 | Industry |
| Autonomous weapons | 2.49 | 0.10 | 42 | Industry |
| Technological unemployment | 2.24 | 0.11 | 45 | Industry |
| Critical AI systems failure | 2.53 | 0.08 | 51 | Industry |
| Coefficient (SE) | |
| (Intercept) | 2.579∗∗∗ |
| (0.051) | |
| Autonomous weapons | 0.104 |
| (0.077) | |
| Criminal justice bias | 0.012 |
| (0.067) | |
| Critical AI systems failure | 0.010 |
| (0.065) | |
| Cyber attacks | 0.175 |
| (0.071) | |
| Data privacy | 0.033 |
| (0.066) | |
| Digital manipulation | 0.113 |
| (0.072) | |
| Disease diagnosis | 0.124 |
| (0.070) | |
| Hiring bias | 0.400∗∗∗ |
| (0.077) | |
| Surveillance | 0.049 |
| (0.071) | |
| Technological unemployment | 0.308∗∗∗ |
| (0.076) | |
| U.S.-China competition | 0.804∗∗∗ |
| (0.082) | |
| Value alignment | 0.224∗ |
| (0.075) | |
| N | 2,150 responses; 430 unique respondents |
| F-Statistic | 13.93∗∗∗ (df = 12; 429) |
| ∗p .05; ∗∗p .01; ∗∗∗p .001 | |
| Coefficient (SE) | |
| (Intercept) | 3.058∗∗∗ |
| (0.135) | |
| Gender: male | 0.283∗∗∗ |
| (0.055) | |
| Gender: prefer not to say/NA | 0.311 |
| (0.172) | |
| Place of undergraduate degree: Europe | 0.005 |
| (0.091) | |
| Place of undergraduate degree: missing | 0.105 |
| (0.089) | |
| Place of undergraduate degree: other | 0.155 |
| (0.079) | |
| Place of undergraduate degree: US | 0.032 |
| (0.079) | |
| Place of work: Europe | 0.230 |
| (0.106) | |
| Place of work: other | 0.269 |
| (0.114) | |
| Place of work: US | 0.201 |
| (0.094) | |
| Job: industry | 0.021 |
| (0.071) | |
| Job: academic | 0.074 |
| (0.072) | |
| N | 2,150 responses, 430 unique respondents |
| F-Statistic | 8.935∗∗∗ (df = 23; 429) |
| ∗p .05; ∗∗p .01; ∗∗∗p .001 | |
Trust in actors to shape the development and use of AI in the public interest
| Actor | Question type | Mean | SE | N | Subgroup | Actor type |
|---|---|---|---|---|---|---|
| Government of the country where they do research | 1.33 | 0.08 | 100 | AI/ML researchers | National | |
| Military of the country where they do research | 0.83 | 0.08 | 106 | AI/ML researchers | National | |
| US government | 0.94 | 0.07 | 113 | AI/ML researchers | National | |
| Chinese government | 0.38 | 0.06 | 115 | AI/ML researchers | National | |
| US military* | 0.73 | 0.10 | 56 | AI/ML researchers (does research in the US only) | National | |
| Chinese military* | 0.30 | 0.08 | 60 | AI/ML researchers (does research in the US only) | National | |
| UN | 1.74 | 0.08 | 122 | AI/ML researchers | International | |
| EU | 1.98 | 0.06 | 114 | AI/ML researchers | International | |
| Intergovernmental research organizations (e.g., CERN) | 2.08 | 0.06 | 114 | AI/ML researchers | International | |
| Tech companies | 0.98 | 0.03 | 1171 | AI/ML researchers | Corporate | |
| 1.35 | 0.07 | 131 | AI/ML researchers | Corporate | ||
| 0.58 | 0.06 | 104 | AI/ML researchers | Corporate | ||
| Apple | 1.05 | 0.07 | 117 | AI/ML researchers | Corporate | |
| Microsoft | 1.43 | 0.07 | 118 | AI/ML researchers | Corporate | |
| Amazon | 0.88 | 0.06 | 108 | AI/ML researchers | Corporate | |
| OpenAI | 1.50 | 0.08 | 113 | AI/ML researchers | Corporate | |
| DeepMind | 1.37 | 0.09 | 99 | AI/ML researchers | Corporate | |
| Tencent | 0.69 | 0.06 | 116 | AI/ML researchers | Corporate | |
| Baidu | 0.50 | 0.05 | 134 | AI/ML researchers | Corporate | |
| Alibaba | 0.57 | 0.05 | 131 | AI/ML researchers | Corporate | |
| Non-government scientific organization (e.g., AAAI) | 2.12 | 0.06 | 104 | AI/ML researchers | Other | |
| Partnership on AI | 1.89 | 0.06 | 103 | AI/ML researchers | Other | |
| US government | B | 1.05 | 0.04 | 743 | US public | National |
| US military* | A | 1.56 | 0.04 | 638 | US public | National |
| US intelligence agencies | A | 1.16 | 0.03 | 2096 | US public | National |
| UN | B | 1.06 | 0.03 | 802 | US public | International |
| Intergovernmental research organizations (e.g., CERN) | C | 1.30 | 0.03 | 1392 | US public | International |
| NATO | A | 1.17 | 0.03 | 695 | US public | International |
| International organizations | B | 1.10 | 0.03 | 827 | US public | International |
| Tech companies | C | 1.33 | 0.03 | 1432 | US public | Corporate |
| C | 1.20 | 0.03 | 1412 | US public | Corporate | |
| C | 0.78 | 0.03 | 1373 | US public | Corporate | |
| Apple | C | 1.19 | 0.03 | 1367 | US public | Corporate |
| Microsoft | C | 1.26 | 0.03 | 1368 | US public | Corporate |
| Amazon | C | 1.22 | 0.03 | 1469 | US public | Corporate |
| Non-government scientific organization (e.g., AAAI) | B | 1.35 | 0.03 | 792 | US public | Other |
| Partnership on AI | B | 1.35 | 0.03 | 780 | US public | Other |
| University researchers | A | 1.56 | 0.03 | 666 | US public | Other |
| Actor | Mean | SE | N | Actor type | Respondent type |
|---|---|---|---|---|---|
| US government | 0.94 | 0.07 | 113 | National | AI/ML researchers |
| Chinese government | 0.38 | 0.06 | 115 | National | AI/ML researchers |
| Government of the country where they do research | 1.33 | 0.08 | 100 | National | AI/ML researchers |
| Military of the country where they do research | 0.83 | 0.08 | 106 | National | AI/ML researchers |
| US military | 0.68 | 0.09 | 60 | National | AI/ML researchers |
| Chinese military | 0.38 | 0.09 | 66 | National | AI/ML researchers |
| UN | 1.74 | 0.08 | 122 | International | AI/ML researchers |
| EU | 1.98 | 0.06 | 114 | International | AI/ML researchers |
| Intergovernmental research organizations (e.g., CERN) | 2.08 | 0.06 | 114 | International | AI/ML researchers |
| 1.35 | 0.07 | 131 | Corporate | AI/ML researchers | |
| 0.58 | 0.06 | 104 | Corporate | AI/ML researchers | |
| Apple | 1.05 | 0.07 | 117 | Corporate | AI/ML researchers |
| Microsoft | 1.43 | 0.07 | 118 | Corporate | AI/ML researchers |
| Amazon | 0.88 | 0.06 | 108 | Corporate | AI/ML researchers |
| OpenAI | 1.50 | 0.08 | 113 | Corporate | AI/ML researchers |
| DeepMind | 1.37 | 0.09 | 99 | Corporate | AI/ML researchers |
| Tencent | 0.69 | 0.06 | 116 | Corporate | AI/ML researchers |
| Baidu | 0.50 | 0.05 | 134 | Corporate | AI/ML researchers |
| Alibaba | 0.57 | 0.05 | 131 | Corporate | AI/ML researchers |
| Non-government scientific organization (e.g., AAAI) | 2.12 | 0.06 | 104 | Other | AI/ML researchers |
| Partnership on AI | 1.89 | 0.06 | 103 | Other | AI/ML researchers |
| Amazon | 1.33 | 0.04 | 685 | Corporate | Public |
| Apple | 1.29 | 0.04 | 697 | Corporate | Public |
| CIA | 1.21 | 0.04 | 730 | National | Public |
| 0.85 | 0.04 | 632 | Corporate | Public | |
| FBI | 1.21 | 0.04 | 656 | National | Public |
| 1.34 | 0.04 | 645 | Corporate | Public | |
| Intergovernmental research organizations (e.g., CERN) | 1.42 | 0.04 | 645 | International | Public |
| Microsoft | 1.40 | 0.04 | 597 | Corporate | Public |
| NATO | 1.17 | 0.03 | 695 | International | Public |
| Non-profit (e.g., OpenAI) | 1.44 | 0.03 | 659 | Other | Public |
| NSA | 1.28 | 0.04 | 710 | National | Public |
| Tech companies | 1.44 | 0.03 | 674 | Corporate | Public |
| US civilian government | 1.16 | 0.03 | 671 | National | Public |
| US military | 1.56 | 0.04 | 638 | National | Public |
| University researchers | 1.56 | 0.03 | 666 | Other | Public |
| Amazon | 1.24 | 0.03 | 784 | Corporate | Public |
| Apple | 1.20 | 0.03 | 775 | Corporate | Public |
| 0.91 | 0.03 | 741 | Corporate | Public | |
| 1.20 | 0.03 | 767 | Corporate | Public | |
| Intergovernmental research organizations (e.g., CERN) | 1.27 | 0.03 | 747 | International | Public |
| International organizations | 1.10 | 0.03 | 827 | International | Public |
| Microsoft | 1.24 | 0.03 | 771 | Corporate | Public |
| Non-government scientific organization (e.g., AAAI) | 1.35 | 0.03 | 792 | Other | Public |
| Partnership on AI | 1.35 | 0.03 | 780 | Other | Public |
| Tech companies | 1.33 | 0.03 | 758 | Corporate | Public |
| US federal government | 1.05 | 0.04 | 743 | National | Public |
| US state governments | 1.05 | 0.03 | 713 | National | Public |
| UN | 1.06 | 0.03 | 802 | International | Public |
| Actor | Mean | SE | N | Undergraduate country | Actor type |
|---|---|---|---|---|---|
| US government | 1.08 | 0.14 | 23 | US | National |
| Chinese government | 0.14 | 0.06 | 27 | US | National |
| Government of the country where they do research | 1.14 | 0.16 | 21 | US | National |
| Military of the country where they do research | 0.85 | 0.17 | 21 | US | National |
| US military | 0.92 | 0.20 | 17 | US | National |
| Chinese military | 0.27 | 0.14 | 24 | US | National |
| UN | 1.73 | 0.21 | 22 | US | International |
| EU | 1.64 | 0.16 | 25 | US | International |
| Intergovernmental research organizations (e.g., CERN) | 2.13 | 0.13 | 25 | US | International |
| 1.41 | 0.12 | 32 | US | Corporate | |
| 0.55 | 0.12 | 23 | US | Corporate | |
| Apple | 1.00 | 0.11 | 31 | US | Corporate |
| Microsoft | 1.38 | 0.13 | 30 | US | Corporate |
| Amazon | 0.90 | 0.15 | 22 | US | Corporate |
| OpenAI | 1.44 | 0.14 | 24 | US | Corporate |
| DeepMind | 1.31 | 0.17 | 27 | US | Corporate |
| Tencent | 0.54 | 0.09 | 23 | US | Corporate |
| Baidu | 0.44 | 0.09 | 32 | US | Corporate |
| Alibaba | 0.41 | 0.08 | 32 | US | Corporate |
| Non-government scientific organization (e.g., AAAI) | 1.92 | 0.15 | 23 | US | Other |
| Partnership on AI | 2.13 | 0.12 | 22 | US | Other |
| US government | 1.00 | 0.19 | 19 | China | National |
| Chinese government | 1.30 | 0.16 | 14 | China | National |
| Government of the country where they do research | 1.36 | 0.21 | 15 | China | National |
| Military of the country where they do research | 0.97 | 0.19 | 19 | China | National |
| US military | 0.56 | 0.19 | 15 | China | National |
| Chinese military | 1.01 | 0.22 | 16 | China | National |
| UN | 1.85 | 0.17 | 19 | China | International |
| EU | 2.06 | 0.14 | 16 | China | International |
| Intergovernmental research organizations (e.g., CERN) | 2.09 | 0.08 | 12 | China | International |
| 1.71 | 0.21 | 17 | China | Corporate | |
| 1.10 | 0.16 | 16 | China | Corporate | |
| Apple | 1.67 | 0.19 | 15 | China | Corporate |
| Microsoft | 1.90 | 0.17 | 16 | China | Corporate |
| Amazon | 1.06 | 0.17 | 16 | China | Corporate |
| OpenAI | 1.81 | 0.17 | 21 | China | Corporate |
| DeepMind | 1.60 | 0.23 | 9 | China | Corporate |
| Tencent | 1.59 | 0.17 | 17 | China | Corporate |
| Baidu | 1.00 | 0.19 | 19 | China | Corporate |
| Alibaba | 1.31 | 0.20 | 18 | China | Corporate |
| Non-government scientific organization (e.g., AAAI) | 2.21 | 0.14 | 15 | China | Other |
| Partnership on AI | 1.80 | 0.14 | 22 | China | Other |
| Actor | Mean | SE | N | Undergraduate region | Actor type |
|---|---|---|---|---|---|
| US government | 0.87 | 0.11 | 33 | Europe | National |
| Chinese government | 0.25 | 0.09 | 31 | Europe | National |
| Government of the country where they do research | 1.64 | 0.16 | 22 | Europe | National |
| Military of the country where they do research | 0.88 | 0.17 | 24 | Europe | National |
| US military | 0.71 | 0.29 | 7 | Europe | National |
| Chinese military | 0.23 | 0.17 | 6 | Europe | National |
| UN | 1.81 | 0.14 | 33 | Europe | International |
| EU | 1.96 | 0.11 | 28 | Europe | International |
| Intergovernmental research organizations (e.g., CERN) | 2.22 | 0.11 | 30 | Europe | International |
| 1.12 | 0.16 | 29 | Europe | Corporate | |
| 0.62 | 0.14 | 22 | Europe | Corporate | |
| Apple | 0.76 | 0.14 | 24 | Europe | Corporate |
| Microsoft | 1.30 | 0.17 | 24 | Europe | Corporate |
| Amazon | 0.94 | 0.11 | 27 | Europe | Corporate |
| OpenAI | 1.36 | 0.16 | 32 | Europe | Corporate |
| DeepMind | 1.47 | 0.16 | 25 | Europe | Corporate |
| Tencent | 0.54 | 0.07 | 30 | Europe | Corporate |
| Baidu | 0.33 | 0.09 | 29 | Europe | Corporate |
| Alibaba | 0.41 | 0.08 | 37 | Europe | Corporate |
| Non-government scientific organization (e.g., AAAI) | 2.23 | 0.13 | 22 | Europe | Other |
| Partnership on AI | 1.80 | 0.14 | 16 | Europe | Other |
| US government | 1.07 | 0.14 | 26 | North America | National |
| Chinese government | 0.17 | 0.07 | 28 | North America | National |
| Government of the country where they do research | 1.17 | 0.14 | 24 | North America | National |
| Military of the country where they do research | 0.83 | 0.16 | 24 | North America | National |
| US military | 0.93 | 0.18 | 19 | North America | National |
| Chinese military | 0.24 | 0.12 | 27 | North America | National |
| UN | 1.68 | 0.19 | 25 | North America | International |
| EU | 1.68 | 0.15 | 28 | North America | International |
| Intergovernmental research organizations (e.g., CERN) | 2.14 | 0.11 | 30 | North America | International |
| 1.43 | 0.12 | 33 | North America | Corporate | |
| 0.60 | 0.12 | 26 | North America | Corporate | |
| Apple | 0.95 | 0.11 | 34 | North America | Corporate |
| Microsoft | 1.36 | 0.12 | 35 | North America | Corporate |
| Amazon | 0.92 | 0.12 | 27 | North America | Corporate |
| OpenAI | 1.44 | 0.14 | 25 | North America | Corporate |
| DeepMind | 1.33 | 0.16 | 28 | North America | Corporate |
| Tencent | 0.52 | 0.08 | 26 | North America | Corporate |
| Baidu | 0.40 | 0.08 | 35 | North America | Corporate |
| Alibaba | 0.40 | 0.08 | 35 | North America | Corporate |
| Non-government scientific organization (e.g., AAAI) | 1.93 | 0.14 | 26 | North America | Other |
| Partnership on AI | 2.13 | 0.11 | 23 | North America | Other |
| US government | 0.99 | 0.14 | 39 | Asia | National |
| Chinese government | 0.61 | 0.12 | 37 | Asia | National |
| Government of the country where they do research | 1.30 | 0.14 | 39 | Asia | National |
| Military of the country where they do research | 0.84 | 0.12 | 41 | Asia | National |
| US military | 0.59 | 0.14 | 26 | Asia | National |
| Chinese military | 0.72 | 0.19 | 23 | Asia | National |
| UN | 1.58 | 0.14 | 42 | Asia | International |
| EU | 2.15 | 0.12 | 34 | Asia | International |
| Intergovernmental research organizations (e.g., CERN) | 1.89 | 0.12 | 33 | Asia | International |
| 1.61 | 0.13 | 43 | Asia | Corporate | |
| 0.70 | 0.11 | 37 | Asia | Corporate | |
| Apple | 1.34 | 0.13 | 39 | Asia | Corporate |
| Microsoft | 1.64 | 0.13 | 38 | Asia | Corporate |
| Amazon | 0.94 | 0.10 | 38 | Asia | Corporate |
| OpenAI | 1.76 | 0.13 | 39 | Asia | Corporate |
| DeepMind | 1.31 | 0.18 | 28 | Asia | Corporate |
| Tencent | 1.04 | 0.13 | 40 | Asia | Corporate |
| Baidu | 0.65 | 0.11 | 46 | Asia | Corporate |
| Alibaba | 0.81 | 0.12 | 42 | Asia | Corporate |
| Non-government scientific organization (e.g., AAAI) | 2.23 | 0.10 | 37 | Asia | Other |
| Partnership on AI | 1.83 | 0.10 | 44 | Asia | Other |
| Actor | Mean | SE | N | Workplace type | Actor type |
|---|---|---|---|---|---|
| US government | 0.96 | 0.08 | 89 | Academic | National |
| Chinese government | 0.34 | 0.07 | 84 | Academic | National |
| Government of the country where they do research | 1.30 | 0.10 | 72 | Academic | National |
| Military of the country where they do research | 0.80 | 0.09 | 74 | Academic | National |
| US military | 0.54 | 0.10 | 39 | Academic | National |
| Chinese military | 0.49 | 0.11 | 49 | Academic | National |
| UN | 1.77 | 0.09 | 92 | Academic | International |
| EU | 2.06 | 0.07 | 88 | Academic | International |
| Intergovernmental research organizations (e.g., CERN) | 2.07 | 0.08 | 82 | Academic | International |
| 1.40 | 0.08 | 97 | Academic | Corporate | |
| 0.56 | 0.07 | 80 | Academic | Corporate | |
| Apple | 1.18 | 0.08 | 82 | Academic | Corporate |
| Microsoft | 1.41 | 0.09 | 89 | Academic | Corporate |
| Amazon | 0.92 | 0.07 | 81 | Academic | Corporate |
| OpenAI | 1.55 | 0.09 | 92 | Academic | Corporate |
| DeepMind | 1.41 | 0.10 | 68 | Academic | Corporate |
| Tencent | 0.73 | 0.07 | 94 | Academic | Corporate |
| Baidu | 0.54 | 0.06 | 99 | Academic | Corporate |
| Alibaba | 0.59 | 0.06 | 98 | Academic | Corporate |
| Non-government scientific organization (e.g., AAAI) | 2.17 | 0.07 | 80 | Academic | Other |
| Partnership on AI | 1.87 | 0.08 | 74 | Academic | Other |
| US government | 0.80 | 0.12 | 26 | Industry | National |
| Chinese government | 0.41 | 0.11 | 33 | Industry | National |
| Government of the country where they do research | 1.12 | 0.14 | 28 | Industry | National |
| Military of the country where they do research | 0.91 | 0.15 | 34 | Industry | National |
| US military | 1.00 | 0.19 | 19 | Industry | National |
| Chinese military | 0.30 | 0.17 | 19 | Industry | National |
| UN | 1.66 | 0.13 | 37 | Industry | International |
| EU | 1.88 | 0.14 | 33 | Industry | International |
| Intergovernmental research organizations (e.g., CERN) | 2.03 | 0.10 | 39 | Industry | International |
| 1.25 | 0.13 | 37 | Industry | Corporate | |
| 0.74 | 0.11 | 29 | Industry | Corporate | |
| Apple | 0.87 | 0.13 | 38 | Industry | Corporate |
| Microsoft | 1.54 | 0.12 | 32 | Industry | Corporate |
| Amazon | 0.63 | 0.09 | 27 | Industry | Corporate |
| OpenAI | 1.21 | 0.18 | 19 | Industry | Corporate |
| DeepMind | 1.39 | 0.16 | 30 | Industry | Corporate |
| Tencent | 0.55 | 0.09 | 24 | Industry | Corporate |
| Baidu | 0.42 | 0.09 | 36 | Industry | Corporate |
| Alibaba | 0.62 | 0.10 | 36 | Industry | Corporate |
| Non-government scientific organization (e.g., AAAI) | 1.77 | 0.12 | 25 | Industry | Other |
| Partnership on AI | 1.93 | 0.09 | 33 | Industry | Other |
| Actor | Mean | SE | N | Country where they do research | Actor type |
| US government | 1.11 | 0.11 | 55 | US | National |
| Chinese government | 0.45 | 0.11 | 45 | US | National |
| US military | 0.73 | 0.10 | 56 | US | National |
| Chinese military | 0.30 | 0.08 | 60 | US | National |
| UN | 1.77 | 0.10 | 52 | US | International |
| EU | 1.91 | 0.10 | 58 | US | International |
| Intergovernmental research organizations (e.g., CERN) | 1.96 | 0.09 | 47 | US | International |
| 1.36 | 0.10 | 62 | US | Corporate | |
| 0.56 | 0.09 | 50 | US | Corporate | |
| Apple | 1.18 | 0.13 | 44 | US | Corporate |
| Microsoft | 1.56 | 0.11 | 63 | US | Corporate |
| Amazon | 0.94 | 0.08 | 52 | US | Corporate |
| OpenAI | 1.59 | 0.12 | 54 | US | Corporate |
| DeepMind | 1.37 | 0.13 | 44 | US | Corporate |
| Tencent | 0.85 | 0.11 | 49 | US | Corporate |
| Baidu | 0.50 | 0.08 | 62 | US | Corporate |
| Alibaba | 0.67 | 0.10 | 61 | US | Corporate |
| Non-government scientific organization (e.g., AAAI) | 2.09 | 0.10 | 50 | US | Other |
| Partnership on AI | 1.86 | 0.09 | 51 | US | Other |
| Coefficient (SE) | |
| (Intercept) | 0.566∗∗∗ |
| (0.054) | |
| Amazon | 0.316∗∗∗ |
| (0.078) | |
| Apple | 0.484∗∗∗ |
| (0.078) | |
| Baidu | 0.061 |
| (0.065) | |
| Chinese government | 0.188 |
| (0.075) | |
| Chinese military | 0.182 |
| (0.102) | |
| DeepMind | 0.805∗∗∗ |
| (0.102) | |
| EU | 1.416∗∗∗ |
| (0.084) | |
| 0.017 | |
| (0.076) | |
| 0.788∗∗∗ | |
| (0.086) | |
| Government of the country where they do research | 0.761∗∗∗ |
| (0.100) | |
| Intergovernmental research organizations (e.g., CERN) | 1.515∗∗∗ |
| (0.084) | |
| Microsoft | 0.868∗∗∗ |
| (0.087) | |
| Military of the country where they do research | 0.266∗ |
| (0.092) | |
| Non-government scientific organization (e.g., AAAI) | 1.551∗∗∗ |
| (0.078) | |
| OpenAI | 0.934∗∗∗ |
| (0.088) | |
| Partnership on AI | 1.329∗∗∗ |
| (0.082) | |
| Tencent | 0.123 |
| (0.064) | |
| U.S. government | 0.372∗∗∗ |
| (0.086) | |
| U.S. military | 0.119 |
| (0.105) | |
| UN | 1.171∗∗∗ |
| (0.092) | |
| N | 2,288 responses, 434 unique respondents |
| F-Statistic | 70.07∗∗∗ (df = 20; 433) |
| ∗p .05; ∗∗p .01; ∗∗∗p .001 | |
| Coefficient (SE) | |
| (Intercept) | 0.765∗∗∗ |
| (0.155) | |
| Gender: male | 0.122 |
| (0.081) | |
| Gender: prefer not to say/NA | 0.033 |
| (0.113) | |
| Place of undergraduate degree: Europe | 0.321∗ |
| (0.095) | |
| Place of undergraduate degree: missing | 0.342∗ |
| (0.103) | |
| Place of undergraduate degree: other | 0.402∗∗∗ |
| (0.087) | |
| Place of undergraduate degree: US | 0.359∗∗∗ |
| (0.083) | |
| Place of work: Europe | 0.046 |
| (0.134) | |
| Place of work: other | 0.054 |
| (0.137) | |
| Place of work: US | 0.005 |
| (0.125) | |
| Job: industry | 0.047 |
| (0.076) | |
| Job: academic | 0.023 |
| (0.079) | |
| N | 2,288 responses, 434 unique respondents |
| F-Statistic | 55.41∗∗∗ (df = 31; 433) |
| ∗p .05; ∗∗p .01; ∗∗∗p .001 | |
| Coefficient (SE) | |
|---|---|
| (Intercept) | 0.457∗∗∗ |
| (0.061) | |
| Western tech companies | 0.707∗∗∗ |
| (0.075) | |
| Place of undergraduate degree: China | 0.831∗∗∗ |
| (0.148) | |
| Western tech companies: Place of undergraduate degree: China | 0.437∗∗ |
| (0.154) | |
| N | 440 responses; 159 unique respondents |
| F-Statistic | 47.00∗∗∗ (df = 3; 158) |
| ∗p .05; ∗∗p .01; ∗∗∗p .001 | |
AI safety
| AI safety familiarity level | Proportion | SE | Frequency |
| Missing | 0.00 | 1 | |
| 0 - Not familiar at all | 0.03 | 0.01 | 8 |
| 1 | 0.25 | 0.03 | 71 |
| 2 | 0.32 | 0.03 | 90 |
| 3 | 0.25 | 0.03 | 72 |
| 4 - Very familiar | 0.15 | 0.02 | 42 |
| Demographic subgroup | Demographic subgroup type | Mean | SE | N |
|---|---|---|---|---|
| US | Undergraduate country | 2.48 | 0.15 | 56 |
| China | Undergraduate country | 1.98 | 0.17 | 42 |
| Europe | Undergraduate region | 2.12 | 0.12 | 69 |
| North America | Undergraduate region | 2.45 | 0.14 | 64 |
| Asia | Undergraduate region | 2.16 | 0.11 | 98 |
| Academic | Workplace type | 2.22 | 0.07 | 217 |
| Industry | Workplace type | 2.31 | 0.11 | 77 |
| AI safety prioritization | Proportion | SE | Frequency |
|---|---|---|---|
| -2: Much less | 0.01 | 0.01 | 4 |
| -1: Less | 0.04 | 0.01 | 11 |
| 0: About the same | 0.24 | 0.03 | 68 |
| 1: More | 0.38 | 0.03 | 109 |
| 2: Much more | 0.30 | 0.03 | 84 |
| Missing | 0.00 | 0.00 | 0 |
| I don’t know | 0.03 | 0.01 | 8 |
| Coefficient (SE) | ||
| (1) | (2) | |
| (Intercept) | 0.709∗∗∗ | 1.157 |
| (0.125) | (0.397) | |
| Familiarity with AI safety | 0.100 | 0.086 |
| (0.049) | (0.047) | |
| Gender: male | 0.484∗ | |
| (0.156) | ||
| Gender: prefer not to say/NA | 0.479 | |
| (0.395) | ||
| Place of undergraduate degree: Europe | 0.134 | |
| (0.218) | ||
| Place of undergraduate degree: missing | 0.206 | |
| (0.224) | ||
| Place of undergraduate degree: other | 0.421 | |
| (0.205) | ||
| Place of undergraduate degree: US | 0.086 | |
| (0.203) | ||
| Place of work: Europe | 0.004 | |
| (0.340) | ||
| Place of work: other | 0.229 | |
| (0.374) | ||
| Place of work: US | 0.066 | |
| (0.335) | ||
| Job: industry | 0.162 | |
| (0.148) | ||
| Job: academic | 0.154 | |
| (0.165) | ||
| N | 284 | 284 |
| F-Statistic | 4.215 (df = 1; 282) | 1.928 (df = 12; 271) |
| ∗p .05; ∗∗p .01; ∗∗∗p .001 | ||
Attitudes toward military applications of AI
| Military application type | Response | Proportion | SE | Frequency |
|---|---|---|---|---|
| Lethal autonomous weapons | : Strongly oppose | 0.58 | 0.03 | 178 |
| Lethal autonomous weapons | : Somewhat oppose | 0.16 | 0.02 | 48 |
| Lethal autonomous weapons | 0: Neither support nor oppose | 0.14 | 0.02 | 44 |
| Lethal autonomous weapons | 1: Somewhat support | 0.07 | 0.01 | 20 |
| Lethal autonomous weapons | 2: Strongly support | 0.01 | 0.00 | 2 |
| Lethal autonomous weapons | Missing | 0.01 | 0.01 | 3 |
| Lethal autonomous weapons | I don’t know | 0.04 | 0.01 | 11 |
| Surveillance | : Strongly oppose | 0.20 | 0.02 | 58 |
| Surveillance | : Somewhat oppose | 0.21 | 0.02 | 60 |
| Surveillance | 0: Neither support nor oppose | 0.26 | 0.03 | 75 |
| Surveillance | 1: Somewhat support | 0.22 | 0.02 | 63 |
| Surveillance | 2: Strongly support | 0.07 | 0.01 | 19 |
| Surveillance | Missing | 0.01 | 0.01 | 3 |
| Surveillance | I don’t know | 0.04 | 0.01 | 11 |
| Logistics | : Strongly oppose | 0.06 | 0.01 | 17 |
| Logistics | : Somewhat oppose | 0.08 | 0.02 | 23 |
| Logistics | 0: Neither support nor oppose | 0.36 | 0.03 | 102 |
| Logistics | 1: Somewhat support | 0.24 | 0.03 | 68 |
| Logistics | 2: Strongly support | 0.20 | 0.02 | 55 |
| Logistics | Missing | 0.00 | 0.00 | 1 |
| Logistics | I don’t know | 0.05 | 0.01 | 15 |
| Military application type | Mean | SE | N | Demographic subgroup | Demographic subgroup type |
| Lethal autonomous weapons | 0.06 | 306 | All respondents | All respondents | |
| Surveillance | 0.07 | 289 | All respondents | All respondents | |
| Logistics | 0.46 | 0.06 | 281 | All respondents | All respondents |
| Lethal autonomous weapons | 0.13 | 65 | US | Undergraduate country | |
| Surveillance | 0.14 | 65 | US | Undergraduate country | |
| Logistics | 0.77 | 0.13 | 68 | US | Undergraduate country |
| Lethal autonomous weapons | 0.19 | 41 | China | Undergraduate country | |
| Surveillance | 0.21 | 0.20 | 43 | China | Undergraduate country |
| Logistics | 0.38 | 0.13 | 40 | China | Undergraduate country |
| Lethal autonomous weapons | 0.09 | 83 | Europe | Undergraduate region | |
| Surveillance | 0.14 | 67 | Europe | Undergraduate region | |
| Logistics | 0.22 | 0.15 | 62 | Europe | Undergraduate region |
| Lethal autonomous weapons | 0.12 | 71 | North America | Undergraduate region | |
| Surveillance | 0.13 | 73 | North America | Undergraduate region | |
| Logistics | 0.71 | 0.12 | 78 | North America | Undergraduate region |
| Lethal autonomous weapons | 0.11 | 101 | Asia | Undergraduate region | |
| Surveillance | 0.13 | 101 | Asia | Undergraduate region | |
| Logistics | 0.53 | 0.09 | 92 | Asia | Undergraduate region |
| Lethal autonomous weapons | 0.06 | 234 | Academic | Workplace type | |
| Surveillance | 0.08 | 216 | Academic | Workplace type | |
| Logistics | 0.48 | 0.07 | 204 | Academic | Workplace type |
| Lethal autonomous weapons | 0.11 | 82 | Industry | Workplace type | |
| Surveillance | 0.14 | 77 | Industry | Workplace type | |
| Logistics | 0.47 | 0.12 | 81 | Industry | Workplace type |
| Military application type | Collective action | Proportion of respondents who oppose others working on the application | Proportion of all respondents who were asked about the application | Number of respondents who oppose others working on the application | Number of respondents asked about the application |
|---|---|---|---|---|---|
| Lethal autonomous weapons | Nothing | 0.01 | — | 225 | 306 |
| Lethal autonomous weapons | Actively avoid working on the project | 0.75 | 0.55 | 225 | 306 |
| Lethal autonomous weapons | Expressing your concern to a superior in your organization involved in the decision | 0.69 | 0.51 | 225 | 306 |
| Lethal autonomous weapons | Sign a petition against the decision | 0.61 | 0.45 | 225 | 306 |
| Lethal autonomous weapons | Participate in a public protest | 0.40 | 0.29 | 225 | 306 |
| Lethal autonomous weapons | Speak out against the decision anonymously to the media or online | 0.34 | 0.25 | 225 | 306 |
| Lethal autonomous weapons | Speak out against the decision publicly to the media or online | 0.34 | 0.25 | 225 | 306 |
| Lethal autonomous weapons | Resign or threaten to resign from your job | 0.42 | 0.31 | 225 | 306 |
| Logistics | Nothing | 0.07 | — | 40 | 281 |
| Logistics | Actively avoid working on the project | 0.72 | 0.10 | 40 | 281 |
| Logistics | Expressing your concern to a superior in your organization involved in the decision | 0.62 | 0.09 | 40 | 281 |
| Logistics | Sign a petition against the decision | 0.52 | 0.07 | 40 | 281 |
| Logistics | Participate in a public protest | 0.22 | 0.03 | 40 | 281 |
| Logistics | Speak out against the decision anonymously to the media or online | 0.25 | 0.04 | 40 | 281 |
| Logistics | Speak out against the decision publicly to the media or online | 0.22 | 0.03 | 40 | 281 |
| Logistics | Resign or threaten to resign from your job | 0.18 | 0.02 | 40 | 281 |
| Surveillance | Nothing | 0.03 | — | 115 | 289 |
| Surveillance | Actively avoid working on the project | 0.74 | 0.29 | 115 | 289 |
| Surveillance | Expressing your concern to a superior in your organization involved in the decision | 0.72 | 0.29 | 115 | 289 |
| Surveillance | Sign a petition against the decision | 0.62 | 0.25 | 115 | 289 |
| Surveillance | Participate in a public protest | 0.34 | 0.13 | 115 | 289 |
| Surveillance | Speak out against the decision anonymously to the media or online | 0.33 | 0.13 | 115 | 289 |
| Surveillance | Speak out against the decision publicly to the media or online | 0.36 | 0.14 | 115 | 289 |
| Surveillance | Resign or threaten to resign from your job | 0.27 | 0.11 | 115 | 289 |
| Response | Proportion | SE | Frequency |
|---|---|---|---|
| : Strongly oppose | 0.03 | 0.01 | 15 |
| : Somewhat oppose | 0.06 | 0.01 | 28 |
| 0: Neither support nor oppose | 0.23 | 0.02 | 102 |
| 1: Somewhat support | 0.21 | 0.02 | 96 |
| 2: Strongly support | 0.38 | 0.02 | 171 |
| Missing | 0.05 | 0.01 | 23 |
| I don’t know | 0.04 | 0.01 | 18 |
| Coefficient (SE) | ||
| (1) | (2) | |
| (Intercept) | 0.388∗∗ | 0.324 |
| (0.108) | (0.393) | |
| Support for researchers working on lethal autonomous weapons | 0.469∗∗∗ | 0.441∗∗∗ |
| (0.067) | (0.070) | |
| Gender: male | 0.030 | |
| (0.185) | ||
| Gender: prefer not to say/NA | 0.428 | |
| (0.472) | ||
| Place of undergraduate degree: Europe | 0.129 | |
| (0.242) | ||
| Place of undergraduate degree: missing | 0.221 | |
| (0.277) | ||
| Place of undergraduate degree: other | 0.246 | |
| (0.241) | ||
| Place of undergraduate degree: US | 0.237 | |
| (0.224) | ||
| Place of work: Europe | 0.736 | |
| (0.451) | ||
| Place of work: missing | 0.393 | |
| (0.647) | ||
| Place of work: other | 0.092 | |
| (0.480) | ||
| Place of work: US | 0.090 | |
| (0.429) | ||
| Job: industry | 0.209 | |
| (0.182) | ||
| Job: academic | 0.186 | |
| (0.179) | ||
| N | 306 | 306 |
| F-Statistic | 49.41∗∗∗ (df = 1; 304) | 10.36∗∗∗ (df = 13; 292) |
| ∗p .05; ∗∗p .01; ∗∗∗p .001 | ||
Publication norms
| Response | Proportion | SE | Frequency |
|---|---|---|---|
| : Strongly disagree | 0.14 | 0.02 | 54 |
| : Somewhat disagree | 0.19 | 0.02 | 72 |
| 1: Somewhat agree | 0.39 | 0.03 | 147 |
| 2: Strongly agree | 0.20 | 0.02 | 76 |
| Missing | 0.00 | 0.00 | 0 |
| I don’t know | 0.06 | 0.01 | 24 |
| Aspect of research | Mean | SE | N | Demographic subgroup | Demographic subgroup type |
|---|---|---|---|---|---|
| High-level description of methods | 4.81 | 0.04 | 172 | All respondents | All |
| Detailed description of methods | 4.52 | 0.06 | 161 | All respondents | All |
| Results | 4.63 | 0.06 | 174 | All respondents | All |
| Code | 3.74 | 0.08 | 143 | All respondents | All |
| Training data | 3.54 | 0.08 | 173 | All respondents | All |
| Trained model | 3.46 | 0.10 | 143 | All respondents | All |
| Algorithm(s) | 4.30 | 0.07 | 153 | All respondents | All |
| High-level description of methods | 4.80 | 0.07 | 42 | US | Undergraduate country |
| Detailed description of methods | 4.46 | 0.12 | 42 | US | Undergraduate country |
| Results | 4.52 | 0.13 | 38 | US | Undergraduate country |
| Code | 3.40 | 0.15 | 35 | US | Undergraduate country |
| Training data | 3.30 | 0.15 | 46 | US | Undergraduate country |
| Trained model | 3.25 | 0.18 | 30 | US | Undergraduate country |
| Algorithm(s) | 4.37 | 0.15 | 31 | US | Undergraduate country |
| High-level description of methods | 4.79 | 0.12 | 19 | China | Undergraduate country |
| Detailed description of methods | 4.38 | 0.19 | 21 | China | Undergraduate country |
| Results | 4.62 | 0.13 | 21 | China | Undergraduate country |
| Code | 3.72 | 0.21 | 25 | China | Undergraduate country |
| Training data | 3.36 | 0.25 | 25 | China | Undergraduate country |
| Trained model | 3.67 | 0.29 | 18 | China | Undergraduate country |
| Algorithm(s) | 4.08 | 0.22 | 24 | China | Undergraduate country |
| High-level description of methods | 4.86 | 0.06 | 42 | Europe | Undergraduate region |
| Detailed description of methods | 4.62 | 0.12 | 37 | Europe | Undergraduate region |
| Results | 4.85 | 0.06 | 53 | Europe | Undergraduate region |
| Code | 3.94 | 0.17 | 33 | Europe | Undergraduate region |
| Training data | 3.67 | 0.17 | 33 | Europe | Undergraduate region |
| Trained model | 3.29 | 0.20 | 41 | Europe | Undergraduate region |
| Algorithm(s) | 4.38 | 0.15 | 34 | Europe | Undergraduate region |
| High-level description of methods | 4.81 | 0.07 | 44 | North America | Undergraduate region |
| Detailed description of methods | 4.52 | 0.11 | 47 | North America | Undergraduate region |
| Results | 4.58 | 0.11 | 44 | North America | Undergraduate region |
| Code | 3.40 | 0.16 | 40 | North America | Undergraduate region |
| Training data | 3.45 | 0.14 | 53 | North America | Undergraduate region |
| Trained model | 3.16 | 0.18 | 34 | North America | Undergraduate region |
| Algorithm(s) | 4.39 | 0.14 | 35 | North America | Undergraduate region |
| High-level description of methods | 4.78 | 0.07 | 55 | Asia | Undergraduate region |
| Detailed description of methods | 4.45 | 0.11 | 51 | Asia | Undergraduate region |
| Results | 4.59 | 0.11 | 51 | Asia | Undergraduate region |
| Code | 3.92 | 0.15 | 50 | Asia | Undergraduate region |
| Training data | 3.61 | 0.15 | 57 | Asia | Undergraduate region |
| Trained model | 4.04 | 0.15 | 45 | Asia | Undergraduate region |
| Algorithm(s) | 4.25 | 0.13 | 51 | Asia | Undergraduate region |
| High-level description of methods | 4.81 | 0.04 | 135 | Academic | Workplace type |
| Detailed description of methods | 4.47 | 0.08 | 115 | Academic | Workplace type |
| Results | 4.63 | 0.07 | 129 | Academic | Workplace type |
| Code | 3.77 | 0.10 | 103 | Academic | Workplace type |
| Training data | 3.60 | 0.09 | 131 | Academic | Workplace type |
| Trained model | 3.54 | 0.12 | 107 | Academic | Workplace type |
| Algorithm(s) | 4.35 | 0.08 | 111 | Academic | Workplace type |
| High-level description of methods | 4.80 | 0.08 | 44 | Industry | Workplace type |
| Detailed description of methods | 4.53 | 0.11 | 51 | Industry | Workplace type |
| Results | 4.65 | 0.11 | 48 | Industry | Workplace type |
| Code | 3.61 | 0.14 | 46 | Industry | Workplace type |
| Training data | 3.28 | 0.14 | 46 | Industry | Workplace type |
| Trained model | 3.05 | 0.20 | 42 | Industry | Workplace type |
| Algorithm(s) | 4.06 | 0.16 | 47 | Industry | Workplace type |
| Coefficient (SE) | |||
| (1) | (2) | (3) | |
| (Intercept) | 0.403∗∗∗ | 0.397∗∗∗ | 0.396∗∗∗ |
| (0.083) | (0.083) | (0.082) | |
| Familiarity with AI safety | 0.153∗∗ | 0.149∗∗∗ | |
| (0.045) | (0.029) | ||
| How much AI safety must be proritized | 0.256∗∗ | 0.253∗∗ | |
| (0.086) | (0.086) | ||
| N | 257 | 257 | 257 |
| F-Statistic | 11.29∗∗ (df = 1; 255) | 8.831∗∗ (df = 1; 255) | 18.48∗∗∗ (df = 2; 254) |
| ∗p .05; ∗∗p .01; ∗∗∗p .001 | |||
| Coefficient (SE) | |||
| (1) | (2) | (3) | |
| (Intercept) | 4.188∗∗∗ | 4.187∗∗∗ | 4.187∗∗∗ |
| (0.043) | (0.043) | (0.043) | |
| Familiarity with AI safety | 0.044 | 0.044 | |
| (0.030) | (0.029) | ||
| How much AI safety must be prioritized | 0.021 | 0.022 | |
| (0.041) | (0.041) | ||
| N | 256 | 256 | 256 |
| F-Statistic | 2.101 | 0.2721 | 1.328 |
| (df = 1; 254) | (df = 1; 254) | (df = 1; 253) | |
| ∗p .05; ∗∗p .01; ∗∗∗p .001 | |||