Slip behavior during pressure driven flow of Laponite suspension
Abstract
We investigate pressure driven pipe flow of Laponite suspension, as a model thixotropic fluid. The tendency of the suspension to age is controlled by addition of sodium chloride salt to vary the ionic strength. We use a syringe pump to prescribe the flow and observe that a steady state flow is obtained. Unusually, the steady state pressure drop required to maintain a constant flow rate decreases with increase in flow rate, in qualitative contrast to the expectation for Poiseuille flow. We demonstrate that experimental results obtained by varying the flow rate, salt concentration and flow geometry (pipe diameter and length) can be collapsed onto a single universal curve, that can be rationalized by invoking slip of the suspension at the tube walls. The Laponite suspension exhibits plug-like flow, yielding at the tube walls. Our results suggest that the slip length varies linearly with the flow rate and inversely with the tube diameter.
I Introduction
The no-slip boundary condition is commonly invoked at liquid-solid interfaces. This dictates that the liquid velocity at the interface is equal to that of the solid. However, depending on the characteristics of the liquid or that of the wall, liquids can slip at the interface. For Newtonian liquids, slip has mostly been attributed to non-wettability of the surface Schnell (1956); Watanabe and nd H. Udagawa (1999); Tretheway and Meinhart (2002); Li et al. (2019); Churaev, Sobolev, and Somov (1984) with a shear dependent slip length obtained theoretically for laminar flows Aghdam and Ricco (2016). For a laminar flow flow through a pipe, slip results in a distinct deviation from Poiseuille flow and, can get further exaggerated with decrease in system size Cheng and Giordano (2002). An elegant theoretical treatment by Lauga and Stone Lauga and Stone (2003) accounts for slip during pressure driven flow through a capillary in terms of an effective slip length that depends on system and material properties. Others have applied a similar methodology to investigate the slip during flow of visco-plastic fluids in various geometries, and have demonstrated a scaling law for the slip velocity expressed in terms of wall shear stress and slip length Kalyon (2005); Kalyon and Malik (2012). The predictions of the velocity profiles incorporating the scaling law, were shown to agree well with experimental measurements Ortega-Avila et al. (2016). In a later experimental study, it was shown that the scaling law holds only when the material has yielded across the entire flowing cross-section but not for co-existing solid-liquid regions or flows below the yield threshold Poumaere et al. (2014). For shear-thinning visco-plastic fluids, wall slip in the regime beyond yielding, was shown to be enhanced compared to that for Newtonian liquids, while the opposite was observed for shear-thickening fluids Haase et al. (2017).
A common feature running across all the studies described above is the time independent nature of the fluid response. However, fluids that exhibit time dependent or thixotropic behavior are not uncommon. For example, crude oil that is pumped over large distances in pipelines comprises a thixotropic paraffin gel Aiyejina et al. (2011). In the human body, biliary sludge comprising bacteria and particulates flows through viscoelastic gastrointestinal channels or through artificial stents van Beerkel et al. (2005); Donelli et al. (2007). The effect of slip on pressure driven flow of thixotropic fluids remains poorly understood Jamali, McKinley, and Armstrong (2017) which makes it that much difficult to recover simple scaling laws characterising the slip behavior. A recent theoretical work showed that while the steady state flow condition for a thixotropic fluid is uniquely determined by the applied stress, the evolution to steady state is determined by the build up and breakage of the fluid microstructure Cunha, de Souza Mendes, and Siqueira (2020).
Here, we experimentally study the pressure driven flow of a model thixotropic fluid through a cylindrical tube to investigate the influence of slip on overall flow. We employ aqueous suspensions of an inorganic synthetic clay, Laponite, as a model thixotropic fluid, whose time dependent response can be controlled by addition of salt. Laponite comprises disk-shaped particles of nm diameter and nm thickness. When Laponite is vigorously stirred into water, clay platelets disperse to form a clear suspension. On ageing, platelet-platelet interactions result in the formation of larger scale microstructure in the dispersion such that it becomes increasingly viscous. At moderate concentrations, of the order of a few percent (by weight), aqueous Laponite dispersions develop a yield stress and exhibit solid-like response. Addition of sodium chloride salt to the aqueous dispersion modifies platelet-platelet electrostatic interactions such that the ageing process is significantly accelerated. Time dependent structure formation and relaxation phenomena in Laponite have been extensively researched in the last few decades Bonn et al. (1999); Knaebel et al. (2000); Bonn et al. (2002); Ruzicka et al. (2010); Ruzicka and Zaccarelli (2011); Jatav and Joshi (2014); Suman and Joshi (2018). Researchers have reported a state diagram that describes the non-equilibrium structure formation in Laponite as a function of clay concentration and ionic strength Ruzicka and Zaccarelli (2011). The precise physical mechanism for self-assembly in Laponite dispersions remains contentious, with arguments for both gel Bonn et al. (1999); Knaebel et al. (2000); Levitz et al. (2000); Bonn et al. (1998); Tanaka, Meunier, and Bonn (2004) and glass Mourchid et al. (1995); Pignon, Piau, and Magnin (1996); Pignon, Magnin, and Piau (1997); Pignon et al. (1997); Kroon, Wegdam, and Sprik (1996); Kroon, Vos, and Wegdam (1998); Avery and Ramsay (1986); Nicolai and Cocard (2000) formation. Our work does not address the question of the underlying structure that determines the rheology of Laponite dispersions. Of interest to us is only that Laponite self assembles in water to form a thixotropic dispersion, and that the paste-like rheology of Laponite dispersions is strongly influenced by the addition of sodium chloride salt.
II Experimental details
II.1 Materials
Laponite was obtained from BYK additives Ltd. UK, and was used as received. Sodium chloride was obtained from Merck Specialities Pvt. Ltd. Mumbai and was used as received. Distilled deionized water (conductivity = Scm) was obtained from Millipore system (Merck Specialities Pvt. Ltd, Mumbai) and was used immediately.
II.2 Methods
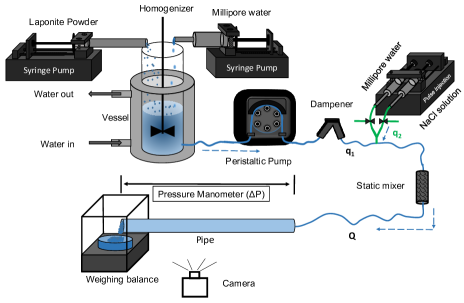
We measured the pressure drop required to flow aqueous Laponite dispersion at a constant flow rate through a tube of length, , and diameter, , as shown in fig. 1. Dry Laponite powder and deionized water (Millipore) were continuously added to a vessel and were subjected to high speed shearing (Ultraturrax homogenizer, IKA). The vessel was kept immersed in a water bath to maintain the temperature of Laponite-water mixture at C throughout the experiments. The outflow rate () from the vessel, as set by the peristaltic pump was the same as the inlet flow rate to the vessel which was set by the syringe pump. This ensured that volume of suspension () in the vessel is maintained constant throughout. The average residence time of the material in the mixer is maintained at min. The high shear mixing protocol ensured that the state of the Laponite dispersion remained constant throughout the duration of the experiment. This was verified by measuring the outflow mass flow rate from the vessel which remained constant in time. To damp out fluctuations due to the peristaltic pump, the suspension is passed through a dampener (see section I in supplementary material). Downstream of the dampener, we introduce a second stream (volumetric flow rate, ) using a needle and mix these streams by passing them through a pinched tube static mixer (see section II in supplementary material). The syringe pump that injects the second stream has two barrels so that it can flow either deionized water, or a salt (NaCl) solution for a fixed duration. After mixing in the static mixer, the suspension is passed through the tube. The tube entrance has a uniformly diverging taper to minimize entrance effects due to change in cross-sectional area when the flow enters the tube. The tube exit is open to atmosphere and we use a pressure gauge just before the tube entrance to measure the pressure drop across the tube length. The total volumetric flow rate () in the system is set by the peristaltic and syringe pumps. The measured outflow mass flow rate from the tube remained constant in time. Experiments are performed for three flow rates (, and cm3/min) and at three salt concentrations (, and mM, after the two streams are mixed). Tubes with different dimensions were used in the experiments: Glass tube (lengths and cm each with an internal diameter of cm and cm) and steel tube (length and cm each with an internal diameter of cm). The Laponite concentration in all experiments was kept unchanged throughout at wt %.
II.3 Pressure drop measurements
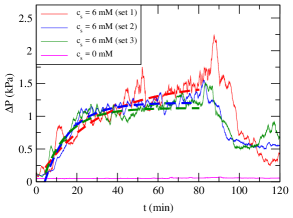
The time variation of the measured pressure difference () across the cylindrical tube during the flow of Laponite suspension (with or without added salt), is shown in fig. 2 for a fixed tube diameter, fixed salt concentration and fixed flow rate. The variation of pressure difference for the Laponite suspension without salt is quite negligible and remains constant throughout at kPa. We refer to this value as the base or reference pressure.
The addition of salt solution pulsed for = 80 mins, however, increases the pressure difference significantly above the base value and achieves a near saturated state (with associated fluctuations). These are shown for three independent runs (red, green and blue solid lines in fig. 2). Presence of high salt concentration in Laponite suspension causes it to age rapidly with an evolving microstructure comprising sample spanning aggregates, thereby increasing the overall viscosity. This increase in the viscosity leads to increased pressure difference above the base value. The near saturated value of the pressure drop reflects a balance in the microstructure of the Laponite suspension, between the salt-induced ageing and flow effects. Following the stoppage of the salt solution pulse after , the pressure difference returns to the base value over time suggesting that the salt has been removed from the tube completely during that time. It can be noted that the timescales leading to the saturated value of pressure drop and while reverting to the base value are not the same. We believe that this difference owes its origin to (i) significant heterogeneity in the microstructures formed within the system and (ii) possibility of traces of microstructures remaining in the tube over much longer time duration while allowing for the flow of Laponite suspension (without salt) associated with pressure drop larger than the base value. Similar qualitative behavior for pressure drop variation is also observed for different tube diameters, lengths, salt concentration and flow rates investigated in this work.
The value of the plateau or the saturated pressure drop () is extracted by fitting the data for the 80 minutes salt solution pulse with an exponential expression of the form . The saturation value () is then obtained as . The fit of this equation to the three independent runs is shown as dashed lines in red, green and blue colour in fig. 2. The parameters , and were simply used to fit the expression to the data and are observed to vary across three independent sets. We note similar time dependence for the pressure difference for all the flow rates, tube diameters and salt concentrations employed. For each case, or independent sets were performed and the data is reported for all the sets in subsequent figures.
III Results and Discussion
In Secs. IIIA and IIIB, we discuss the effect of tube length, flow rate, tube diameter and salt concentration on the observed variations in the saturated value of pressure drop (). We, then, try and show the scaling of all the data in Sec. IIIC based on simple flow modeling and heuristic arguments.
III.1 Effect of tube length and flow rate on saturated pressure drop
The variation of the saturated state pressure drop () with flow rate () for two different tube lengths, at fixed tube diameter ( cm) and salt concentration ( mM) is shown in fig. 3a. For a given flow rate, the pressure drop increases with increase in the tube length. However, the pressure drop per unit length () is nearly independent of tube length as shown in fig. 3b. This suggests that the observed behavior and underlying mechanism is not localised, but it remains the same everywhere along the tube length.
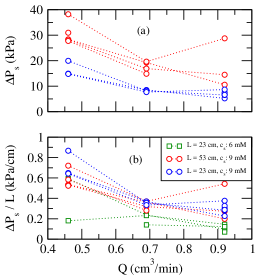
Interestingly, the data in fig. 3b shows that the saturated pressure drops decreases monotonically with increase in the flow rate. Further, this decrease in the pressure drop is more prominent at higher salt concentration. At much higher salt concentration ( mM), rapid increase in viscosity led to intermittent flow causing problems in pressure drop measurements. This behavior of pressure drop is qualitatively opposite to that predicted by the Poiseuille equation. To rationalize this, we consider the possibility that higher shear rates at higher might result in a flow-induced breakdown of Laponite microstructure in the bulk of the suspension. This microstructural change correlates with a decrease in viscosity and therefore a decrease in with increase in . Such a behaviour, akin to a shear thinning fluid, will always yield an increase in the steady (or saturated) state pressure drop with increase in the flow rate in contrast to the observed behavior over here. Further, we anticipate that such flow-induced microstructural breakage will occur locally - thus, an increase in tube length should result in greater microstructural change and lower . In this situation, will not be independent of the tube length, which is inconsistent with the behavior observed in fig. 3b. Therefore, the decrease in with is not a consequence of flow-induced changes in Laponite microstructure in the bulk of the tube. We now consider the possibility that slip of Laponite suspensions at the tube walls reduces the pressure drop. Similar behavior, i.e. increase in the flow rate under constant pressure gradient, been observed previously for pressure-driven flow of Newtonian liquids Cheng and Giordano (2002) and visco-plastic fluids Ortega-Avila et al. (2016).
III.2 Effect of tube diameter and salt concentration on saturated pressure drop
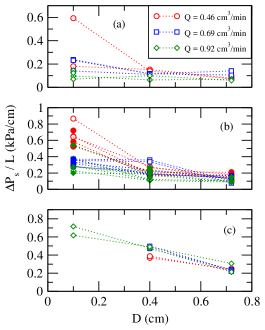
Figure 4 shows the variation of with tube diameter for three different flow rates and three different salt concentrations. The values of decrease with increase in tube diameter at all flow rates and salt concentrations employed. This effect is more pronounced at smaller tube diameters. The inverse dependence is in line with the behavior expected during the Poiseuille flow, i.e. smaller the cross-sectional area available for flow, higher is the pressure drop needed to achieve the same flow rate. Secondly, the magnitude of saturated pressure drop increases significantly with increase in salt concentration. Now, increase in salt concentration significantly accelerates ageing of Laponite suspensions, thereby increasing its effective viscosity Ruzicka and Zaccarelli (2011). Naturally, the pressure drop required to pump the fluid at a constant rate is expected to increase with increase in the effective viscosity, in line with that expected from the Poiseuille flow. The effective viscosity rises rapidly with salt concentration, so that pressure drop measurements could be obtained only at the highest flow rate employed for experiments using the smallest tube diameter ( cm) at the highest salt concentration employed ( 12 mM).
The parametric dependence described above shows distinct dependence of the measured pressure drop on three variables, namely flow rate, tube diameter and salt concentration. The salt content tends to influence the viscosity while the flow cross-section is governed by the tube diameter. However, both these effects seem to occur on the backdrop of flow slippage as evidenced by the observed dependence on employed flow rate. This encourages us to seek a non-linear dependence, akin to a scaling law relating these three variables with the saturated pressure drop. In the following we attempt to obtain a scaling relation from the experimental observations.
III.3 Scaling behavior
The Laponite suspension exhibits significant thixotropy, i.e. its state evolves continuously with waiting time. A steady state is, thus, not achievable in such a system, thereby precluding the existence of a stress constitutive equation comprising a steady shear viscosity. However, the experimental observations exhibit steady (or saturated) state pressure drop following initial transient period (see fig. 2). Given our primary interest in understanding the behavior of steady pressure drop, we assume a unidirectional, steady state flow of Laponite suspension through the tube. Typically, a viscous laponite suspension exhibits a yield stress () and a shear flow post yielding. To simplify the representation of the observed behavior, we consider Bingham fluid like behavior for which the shear stress is expressed as , where is the shear rate, is the shear viscosity. Using these assumptions and following the previous treatment for flow of Newtonian liquids Lauga and Stone (2003) and visco-plastic fluids Kalyon (2005) through a cylindrical tube, the volumetric flow rate can be obtained as
| (1) |
where and is the slip length. The overall form of the Eq. LABEL:eq:flow-rate is consistent with that obtained previously for a visco-plastic fluid Kalyon (2005).

The value of , i.e. the wall shear stress, as measured from the experiments is of the order , similar to the yield stress of Laponite dispersions of comparable concentration and ionic strength Au and Leong (2015); Lin et al. (2019). This implies that the material does not shear anywhere in radial direction and moves as a plug, viz. . This is clearly observed through flow visualization (see section IV in supplementary information and the accompanying movie file). The material yielding is then the primary reason for slip in present system which is consistent with previous reports Poumaere et al. (2014). Based on these arguments, we consider slip as the predominant behavior which, thereby, leads to simplification of eq. (LABEL:eq:flow-rate) as
| (2) |
In this equation, all quantities except , are either known, measured or can be estimated. We infer the behavior of based on our experiments. Using a linear dependence i.e in Eq. 2, we observe that the experimentally obtained inverse relation between and is recovered. We reiterate that the linear dependence of on is invoked to rationalize the data and is not based on any reasoning from the literature. We do note, however, that experiments by Zhu and Granick Zhu and Granick (2001) for Newtonian liquids do show that slip length increases with shear rate. Further, neither can the dependence of slip length on system size be obtained from the literature Watanabe and nd H. Udagawa (1999); Cheng and Giordano (2002); Li et al. (2019). We, thus, consider , where the exact functional dependence on tube diameter is obtained from a fit to the experimental data. Finally, the extensive literature on the effect of ionic strength on Laponite aging indicates that the dependence on salt concentration is highly nonlinear Ruzicka and Zaccarelli (2011); Suman and Joshi (2018); Joshi and Petekidis (2018). Again out of convenience we invoke a non-linear relation where the viscosity varies with the square of salt concentration, i.e. . Using these assumptions, Eq. 2 can be expressed as
| (3) |
The experimental results for all flow rates, tube diameters and salt concentrations studied are shown in fig. 5 (main panel) following Eq. 3. We adjust so as to collapse the data on a universal curve by shifting individual data sets. We observe that shows a power-law dependence on tube diameter () with an exponent as shown in fig 5(inset). Collapse of data from experiments carried over a wide range of parameters, on a master curve is remarkable given the complexity of microstructure formation in thixotropic Laponite suspensions. From a fit to the data, we obtain the relation . Further, our data suggests an empirical correlation for the slip length, given as . Though not identical to our experimental system, we note that the slip length has been theoretically shown to scale as for the flow of water through nanopores Li et al. (2019).
IV Conclusions
In summary, we have investigated the slip behavior for pressure driven flow of a thixotropic material through a cylindrical tube. While the Laponite suspension is thixotropic, we obtain steady state flow behavior over a range of experimental conditions. The steady state is envisaged as a balance between the inherent structure formation of Laponite and possible breakage due to flow. The steady state is represented by near time independent (or saturated) pressure values measured during the flow of suspension through the tube.
Remarkably, the saturated pressure drop shows an inverse relation with the flow rate, in contrast to our expectation based on the Poiseuille relation. These observations can be rationalised by invoking slip of Laponite suspensions at the tube walls. We show that the observed experimental results can be accounted for if a linear dependence is assumed between the slip length and flow rate and the material can be described using Bingham constitutive equation. The observed scaling behavior indicate that the slip length varies linearly with the flow rate and inversely with tube diameter.
It is to be, however, noted that the scaling behavior is obtained purely based on a fit to the data. The assumed variations of the key variables cannot be obtained from the literature and their deduction through independent measurements is not within the scope of this work. The reasonably good scaling behavior suggests that these adhoc assumptions are not without merit. The remarkably simple dependence of the flow behavior of a complex thixotropic material should pave the way for a more involved theoretical treatment of flowing thixotropic materials.
Supplementary Material
Details about the design and characterisation of various flow accessories used in experiments and flow visualisation methodology are provided as supplementary material for ready reference.
Acknowledgements.
AVO gratefully acknowledges the financial support from Science & Engineering Research Board, India (Grant No. SB/S3/CE/017/2015).Data Availability
The data that support the findings of this study are available from the corresponding author upon reasonable request.
References
- Schnell (1956) E. Schnell, “Slippage of water over nonwettable surfaces,” J. Appl. Phys. 27, 1149 (1956).
- Watanabe and nd H. Udagawa (1999) K. Watanabe and Y. U. nd H. Udagawa, “Drag reduction of newtonian fluid in a circular pipe with a higly water-repellent wall,” J. Fluid Mech. 381, 225–238 (1999).
- Tretheway and Meinhart (2002) D. C. Tretheway and C. D. Meinhart, “Apparent fluid slip at hydrophobic microchannel walls,” Phys. Fluids 14, L9 (2002).
- Li et al. (2019) L. Li, Y. Su, H. Wang, G. Sheng, and W. Wang, “A new slip length model for enhanced water flow coupling molecular interaction, pore dimension, wall roughness and temperature,” Adv. Polymer Technol. 2019, 6424012 (2019).
- Churaev, Sobolev, and Somov (1984) N. V. Churaev, V. D. Sobolev, and A. N. Somov, “Slippage of liquids over lyophobic solid surfaces,” J. Coll. Int. Sci. 97, 574 (1984).
- Aghdam and Ricco (2016) S. K. Aghdam and P. Ricco, “Laminar and turbulent flows over hydrophobic surfaces with shear-dependent slip length,” Phys. Fluids 28, 035109 (2016).
- Cheng and Giordano (2002) J. T. Cheng and N. Giordano, “Fluid flow through nanometer-scale channels,” Phys. Rev. E 65, 031206 (2002).
- Lauga and Stone (2003) E. Lauga and H. A. Stone, “Effective slip in pressure-driven stokes flow,” J. Fluid Mech. 489, 55–77 (2003).
- Kalyon (2005) D. K. Kalyon, “Apparent slip and viscoplasticity of concentrated suspensions,” J. Rheol. 49, 621 (2005).
- Kalyon and Malik (2012) D. M. Kalyon and M. Malik, “Axial laminar flow of viscoplastic fluids in a concentric annulus subject to wall slip,” Rheol. Acta 51, 805 (2012).
- Ortega-Avila et al. (2016) J. F. Ortega-Avila, J. Pérez-González, B. M. Marín-Santibáńez, F. Rodríguez-González, S. Aktas, M. Malik, and D. M. Kalyon, “Axial annular flow of a viscoplastic microgel with wall slip,” J. Rheol. 60, 503 (2016).
- Poumaere et al. (2014) A. Poumaere, M. Moyers-González, C. Castelain, and T. Burghelea, “Unsteady laminar flows of a carbopol gel in the presence of wall slip,” J. non-Newt. Fluid Mech. 205, 28 (2014).
- Haase et al. (2017) A. S. Haase, J. A. Wood, L. M. J. Sprakel, and R. G. H. Lammertink, “Inelastic non-newtonian flow over heterogeneously slippery surfaces,” Phys. Rev. E 95, 023105 (2017).
- Aiyejina et al. (2011) A. Aiyejina, D. P. Chakrabarti, A. Pilgrim, and M. K. S. Sastry, “Wax formation in oil pipelines: A critical review,” Int. J. Multi, Flow 37, 671–694 (2011).
- van Beerkel et al. (2005) A. M. van Beerkel, J. van Marle, A. K. Groen, and M. J. Bruno, “Mechanisms of biliary stent clogging,” Endoscopy 37, 729–734 (2005).
- Donelli et al. (2007) G. Donelli, E. Guaglianone, R. D. Rosa, F. Fiocca, and A. Basoli, “Plastic biliary stent occlusion: Factors involved and possible preventiva approaches,” Clinical Med. Res. 5, 53–60 (2007).
- Jamali, McKinley, and Armstrong (2017) S. Jamali, G. H. McKinley, and R. C. Armstrong, “Microstructural rearrangements and their rheological implications in a model thixotropic elastoviscoplastic fluid,” Phys. Rev. Lett. 118, 048003 (2017).
- Cunha, de Souza Mendes, and Siqueira (2020) J. P. Cunha, P. R. de Souza Mendes, and I. R. Siqueira, “Pressure-driven flows of a thixotropic viscoplastic material: Performance of a novel fluidity-based constitutive model,” Phys. Fluids 32, 123104 (2020).
- Bonn et al. (1999) D. Bonn, H. Kellay, H. Tanaka, G. Wegdam, and J. Meunier, “Laponite: What is the difference between a glass and a gel?” Langmuir 15, 7534–7536 (1999).
- Knaebel et al. (2000) A. Knaebel, M. Bellour, J. P. Munch, V. Viasnoff, F. Lequeux, and J. L. Harden, “Aging behavior of laponite clay particle suspensions,” Eur. Phys. Lett. 52, 73 (2000).
- Bonn et al. (2002) D. Bonn, S. Tanase, B. Abou, H. Tanaka, and J. Meunier, “Laponite: Aging and shear rejuvenation of a colloidal glass,” Phys. Rev. Lett. 89, 015701 (2002).
- Ruzicka et al. (2010) B. Ruzicka, L. Zulian, E. Zaccarelli, R. Angelini, M. Sztucki, A. Moussaid, and G. Ruocco, “Competing interactions in arrested states of colloidal clays,” Phys. Rev. Lett. 104, 085701 (2010).
- Ruzicka and Zaccarelli (2011) B. Ruzicka and E. Zaccarelli, “A fresh look at the laponite phase diagram,” Soft Mat. 7, 1268–1286 (2011).
- Jatav and Joshi (2014) S. Jatav and Y. M. Joshi, “Rheological signatures of gelation and effect of shear melting on aging colloidal suspension,” J. Rheol. 58, 1535–1554 (2014).
- Suman and Joshi (2018) K. Suman and Y. M. Joshi, “Microstructure and soft glassy dynamics of aqueous laponite dispersion,” Langmuir 34, 13079–13103 (2018).
- Levitz et al. (2000) P. Levitz, E. Lecolier, A. Mourchid, A. Delville, and S. Lyonnard, “Liquid-solid transition of laponite suspensions at very low ionic strength: Long-range electrostatic stabilisation of anisotropic colloids,” Eur. Phys. Lett. 49, 672 (2000).
- Bonn et al. (1998) D. Bonn, H. Tanaka, G. Wegdam, H. Kellay, and J. Meunier, “Aging of a colloidal “wigner” glass,” Eur. Phys. Lett. 45, 52 (1998).
- Tanaka, Meunier, and Bonn (2004) H. Tanaka, J. Meunier, and D. Bonn, “Nonergodic states of charged colloidal suspensions: Repulsive and attractive glasses and gels,” Phys. Rev. E. 69, 031404 (2004).
- Mourchid et al. (1995) A. Mourchid, A. Delville, J. Lambard, E. Lecolier, and P. Levitz, “Phase diagram of colloidal dispersions of anisotropic charged particles: equilibrium properties, structure, and rheology of laponite suspensions,” Langmuir 11, 1942–1950 (1995).
- Pignon, Piau, and Magnin (1996) F. Pignon, J. M. Piau, and A. Magnin, “Structure and pertinent length scale of a discotic clay gel,” Phys. Rev. Lett. 76, 4857 (1996).
- Pignon, Magnin, and Piau (1997) F. Pignon, A. Magnin, and J. M. Piau, “Butterfly light scattering pattern and rheology of a sheared thixotropic clay gel,” Phys. Rev. Lett. 79, 4689 (1997).
- Pignon et al. (1997) F. Pignon, A. Magnin, J. M. Piau, P. L. B. Cabane, and O. Diat, “Yield stress thixotropic clay suspension: Investigations of structure by light, neutron, and x-ray scattering,” Phys. Rev. E. 56, 3281 (1997).
- Kroon, Wegdam, and Sprik (1996) M. Kroon, G. Wegdam, and R. Sprik, “Dynamic light scattering studies on the sol-gel transition of a suspension of anisotropic colloidal particles,” Phys. Rev. E. 54, 6541 (1996).
- Kroon, Vos, and Wegdam (1998) M. Kroon, W. Vos, and G. Wegdam, “Structure and formation of a gel of colloidal disks,” Phys. Rev. E. 57, 1962 (1998).
- Avery and Ramsay (1986) R. Avery and J. Ramsay, “Colloidal properties of synthetic hectorite clay dispersions: Ii. light and small angle neutron scattering,” J. Colloid Interface Sci. 109, 448–454 (1986).
- Nicolai and Cocard (2000) T. Nicolai and S. Cocard, “Light scattering study of the dispersion of laponite,” Langmuir 16, 8189–8193 (2000).
- Au and Leong (2015) P.-I. Au and Y.-K. Leong, “Surface chemistry and rheology of laponite dispersions - zeta potential, yield stress, ageing, fractal dimension and pyrophosphate,” Appl. Clay Sci. 107, 36–45 (2015).
- Lin et al. (2019) Y. Lin, H. Zhu, W. Wang, J. Chen, N. Phan-Thien, and D. Pan, “Rheological behavior for laponite and bentonite suspensions in shear flow,” AIP Adv. 9, 125233 (2019).
- Zhu and Granick (2001) Y. Zhu and S. Granick, “Rate-dependent slip of newtonian liquid at smooth surfaces,” Phys. Rev. Lett. 87, 096105 (2001).
- Joshi and Petekidis (2018) Y. M. Joshi and G. Petekidis, “Yield stress fluids and ageing,” Rheol. Acta 57, 521–549 (2018).