Submillimetre observations of the two-component magnetic field in M82
Abstract
We observed the starburst galaxy M82 in 850m polarised light with the POL-2 polarimeter on the James Clerk Maxwell Telescope (JCMT). We interpret our observed polarisation geometry as tracing a two-component magnetic field: a poloidal component aligned with the galactic ‘superwind’, extending to a height pc above and below the central bar; and a spiral-arm-aligned, or possibly toroidal, component in the plane of the galaxy, which dominates the 850m polarised light distribution at galactocentric radii kpc. Comparison of our results with recent HAWC+ measurements of the field in the dust entrained by the M82 superwind suggests that the superwind breaks out from the central starburst at pc above the plane of the galaxy.
keywords:
galaxies: individual: M82 – galaxies: magnetic fields – submillimetre: galaxies1 Introduction
The magnetic fields observed in galaxies are thought to arise from the -dynamo effect, in combination with a supernova-driven galactic wind (e.g. Beck et al., 1996). This dynamo results in spiral galaxies typically showing a magnetic field running parallel to their spiral arms, likely wound up over several Gyr (e.g. Jones et al., 2020), while magnetic field transport in galactic winds and outflows is thought to be a key mechanism by which the intergalactic medium is magnetised (e.g. Kronberg et al., 1999). The dynamo mechanism has been shown to persist through periods of starburst activity, and to be enhanced by tidal interactions (Moss et al., 2014).
M82 is a nearby (3.5 Mpc; Jacobs et al. 2009) edge-on starburst galaxy, interacting with its neighbour M81. It has a bipolar ‘superwind’ emanating from its central region (e.g. Shopbell & Bland-Hawthorn, 1998). M82 is classed as irregular, but nonetheless has a disc with a well-identified inclination angle of (Clark et al., 2018), and a 1-kpc-long bar (Telesco et al., 1991) from which weak logarithmic spiral arms emanate (Mayya et al., 2005).
The magnetic field of M82 is expected to consist of both a toroidal disc component and a poloidal wind component (e.g. Jones, 2000). However, the brightness of the outflow-launching galactic nucleus, and the strength of the superwind, has made observing the planar component challenging (Jones et al., 2019).
M82 was first observed in extinction polarisation by Elvius (1962), and was further observed in optical and 1.65m extinction polarisation by Neininger et al. (1990) and Jones (2000) respectively. These latter studies found a near-vertical field geometry in the galactic nucleus, inferred to trace the field in the superwind.
M82 was observed at 850m with SCUPOL on the James Clerk Maxwell Telescope (JCMT) by Greaves et al. (2000), who again found a near-vertical field geometry in the galactic nucleus, but saw a broadly elliptical magnetic field geometry in the outer galaxy, which they interpreted as a magnetic bubble driven by the superwind. These data were reprocessed by Matthews et al. (2009), producing results consistent with those of Greaves et al. (2000), but in which the loop structure is less apparent.
M82 has been observed in radio polarisation (6 – 22 cm) by Adebahr et al. (2017), who found a polarisation geometry consistent with a planar field in the inner part of the galaxy, which they interpret as tracing a field running along the galactic bar.
The magnetic field in M82 has recently been observed with HAWC+ at 53m and 154m (Jones et al., 2019), finding that the near-vertical field geometry in the nucleus to extend into the galactic halo, inconsistent with the magnetic bubble model of Greaves et al. (2000). The magnetic field lines seen by HAWC+ have been inferred to be open – connecting the starburst core to the intergalactic medium, rather than creating a galactic fountain – in a recent preprint (Lopez-Rodriguez et al., 2021).
In this letter we present 850m dust emission polarisation observations of M82 made using the POL-2 polarimeter mounted on the SCUBA-2 camera on the JCMT. Section 2 describes the observations and the data reduction process. Section 3 describes our results. Section 4 compares our observations to previous measurements, and interprets our results. Our conclusions are presented in Section 5.
2 Observations
We observed M82 24 times between 2021 January 03 and 2021 January 29 using the POL-2 polarimeter on the SCUBA-2 camera (Holland et al., 2013) on the JCMT in Band 2 weather () under project code M20BP022. Each observation consisted of a 31-minute POL-2-DAISY scan pattern.
The data were reduced using the 111http://starlink.eao.hawaii.edu/docs/sun258.htx/sun258ss73.html script recently added to the Smurf package in the software suite (Chapin et al., 2013). See Pattle et al. (2021) for a detailed description of the current POL-2 data reduction process. Instrumental polarisation (IP) was corrected for using the ‘August 2019’ IP model222https://www.eaobservatory.org/jcmt/2019/08/new-ip-models-for-pol2-data/. The 850m data were calibrated using a flux conversion factor (FCF) of 3159 mJy arcsec-2 pW-1, the standard SCUBA-2 FCF of 2340 mJy arcsec-2 pW-1 (Dempsey et al., 2013) multiplied by a factor of 1.35 (Friberg et al., 2016).
We binned our output vector catalogue to 8-arcsec (approximately Nyquist-sampled) pixels. The per-pixel RMS noise values in the vector catalogue were then remodelled using the script, which models map variance as the sum of three components, based on exposure time, the presence of bright sources, and residuals. The average RMS noise in Stokes and in the centre of the map on 8-arcsec pixels is 0.0052 mJy arcsec-2 (1.2 mJy beam-1).
The observed polarised intensity is given by
| (1) |
However, this quantity is biased by its defined-positive nature. We debiased PI using the modified asympototic estimator (Plaszczynski et al., 2014; Montier et al., 2015):
| (2) |
where is the weighted mean of the variances and ,
| (3) |
calculated on a pixel-by-pixel basis. Observed polarisation fraction is then given by , and equivalently, debiased polarisation fraction by . In the following analysis, we use rather than except where specifically stated otherwise.
Polarisation angle is given by
| (4) |
Throughout this work we assume that dust grains are aligned with their minor axis parallel to the magnetic field direction (e.g. Andersson et al., 2015), and so that the plane-of-sky magnetic field direction can be inferred by rotating by 90∘. We discuss the validity of this assumption in Section 3.2, below. We note that the polarisation angles which we detect are not true vectors, as they occupy a range in angle . We nonetheless refer to our measurements as vectors for convenience, in keeping with the general convention in the field.
3 Results
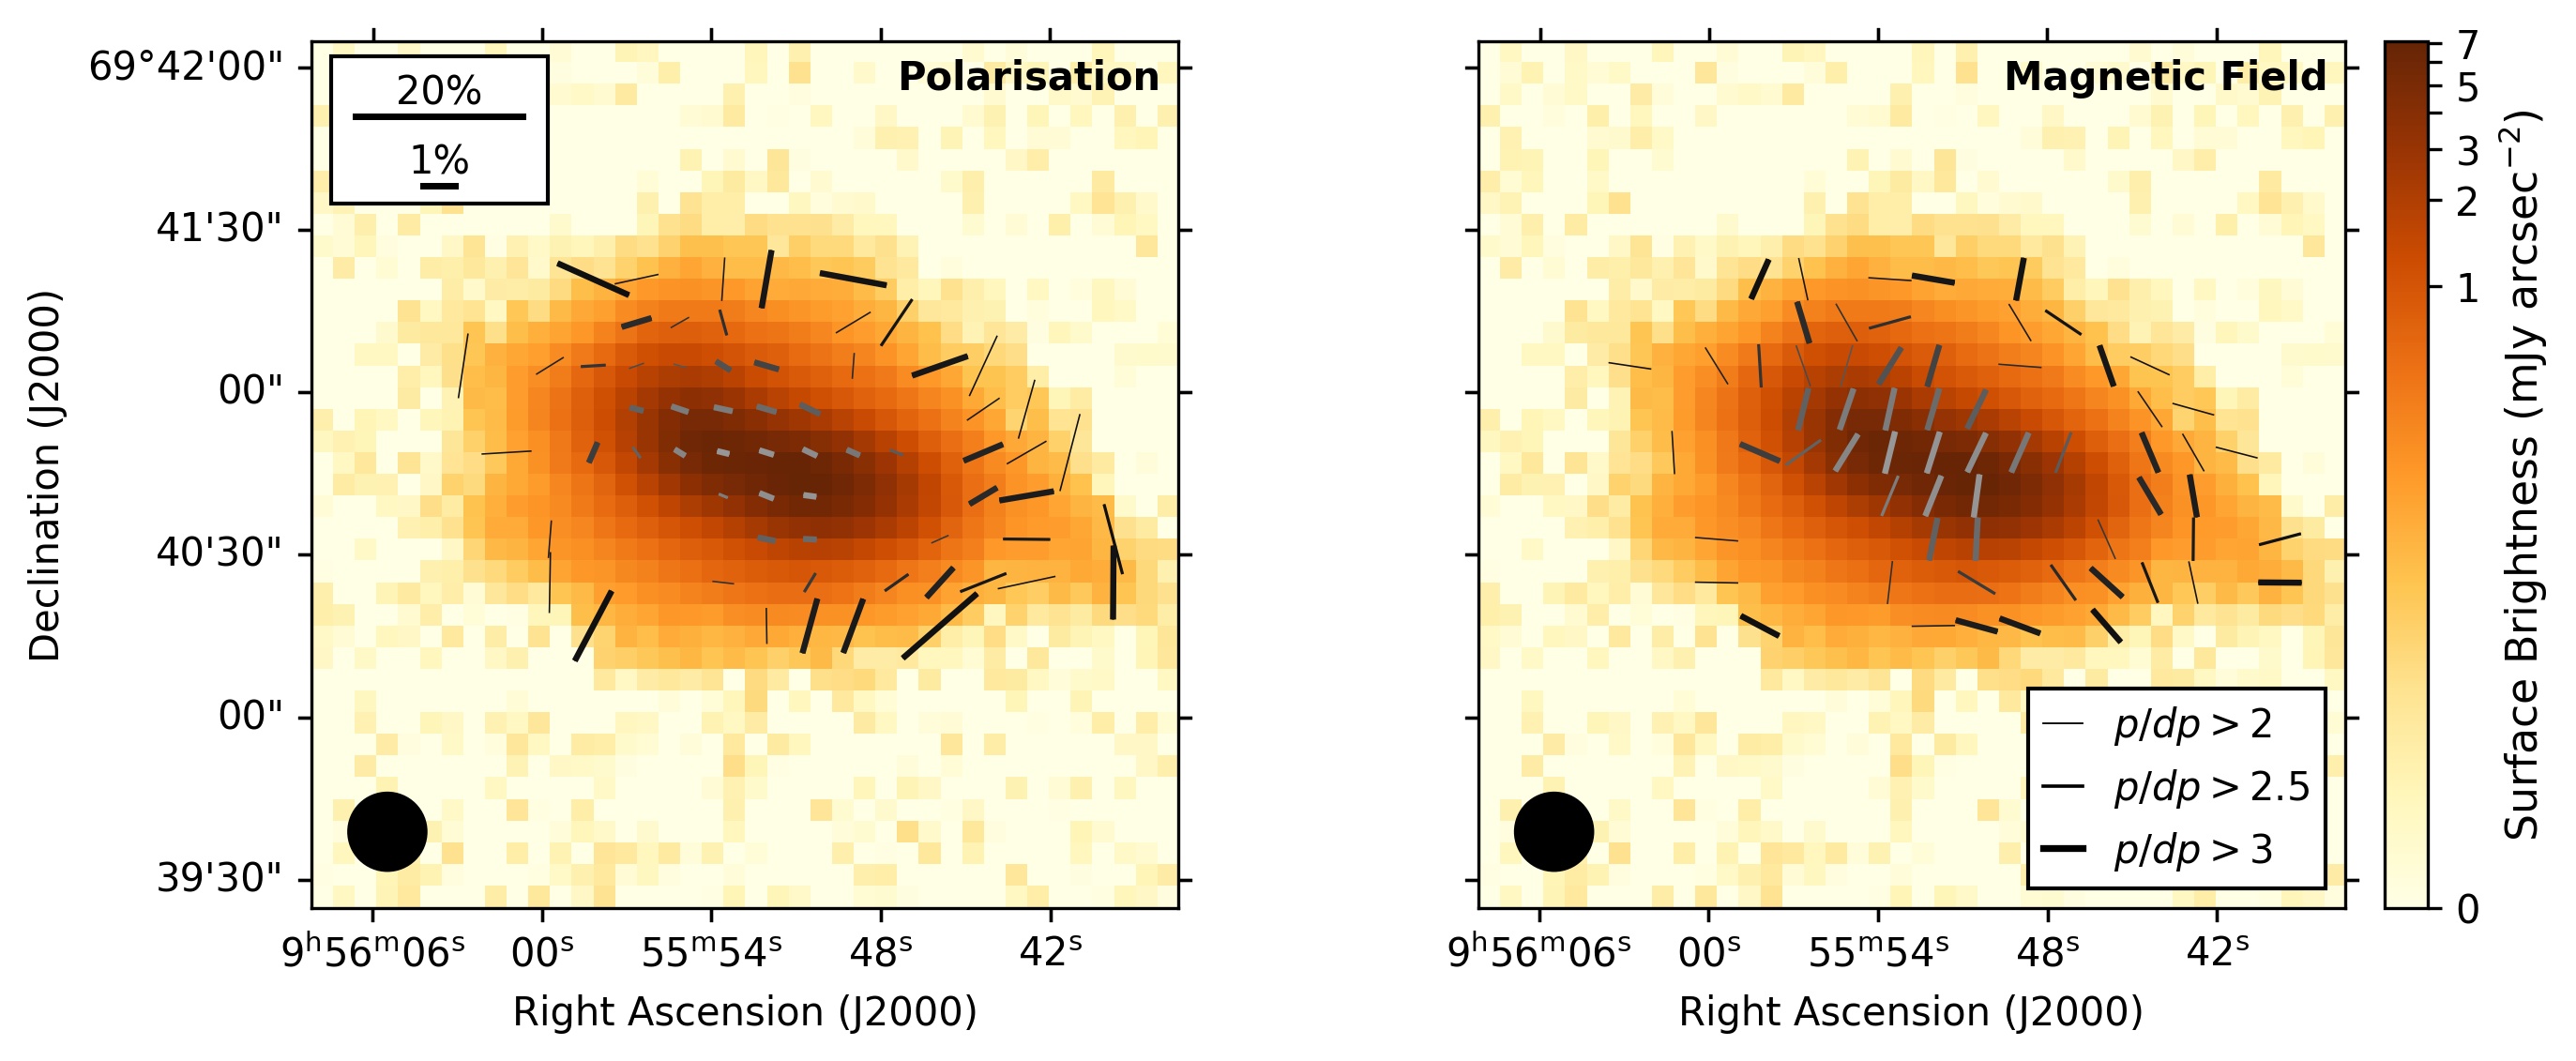
The polarisation vector maps observed with POL-2 are shown in Figure 1. We show all vectors with and . Vector weights in Figure 1 show signal-to-noise ratio in . It can be seen that the position angles of the vectors agree well with those of the vectors, and so we include them in our analysis.
Our results agree well with both the original SCUPOL 850m vector map of Greaves et al. (2000), and the reprocessed map of Matthews et al. (2009). We note that the SCUBA/SCUPOL and SCUBA-2/POL-2 systems have nothing in common apart from the JCMT dish itself. The POL-2 and SCUPOL measurements were made using separate polarimeters, cameras, observing modes and data reduction algorithms, and so are fully independent.
3.1 Magnetic field morphology
We see, broadly, two behaviours: in the galactic centre, the field is perpendicular to the direction of the bar, while in the outer galaxy, the field is parallel to the spiral arm structure.
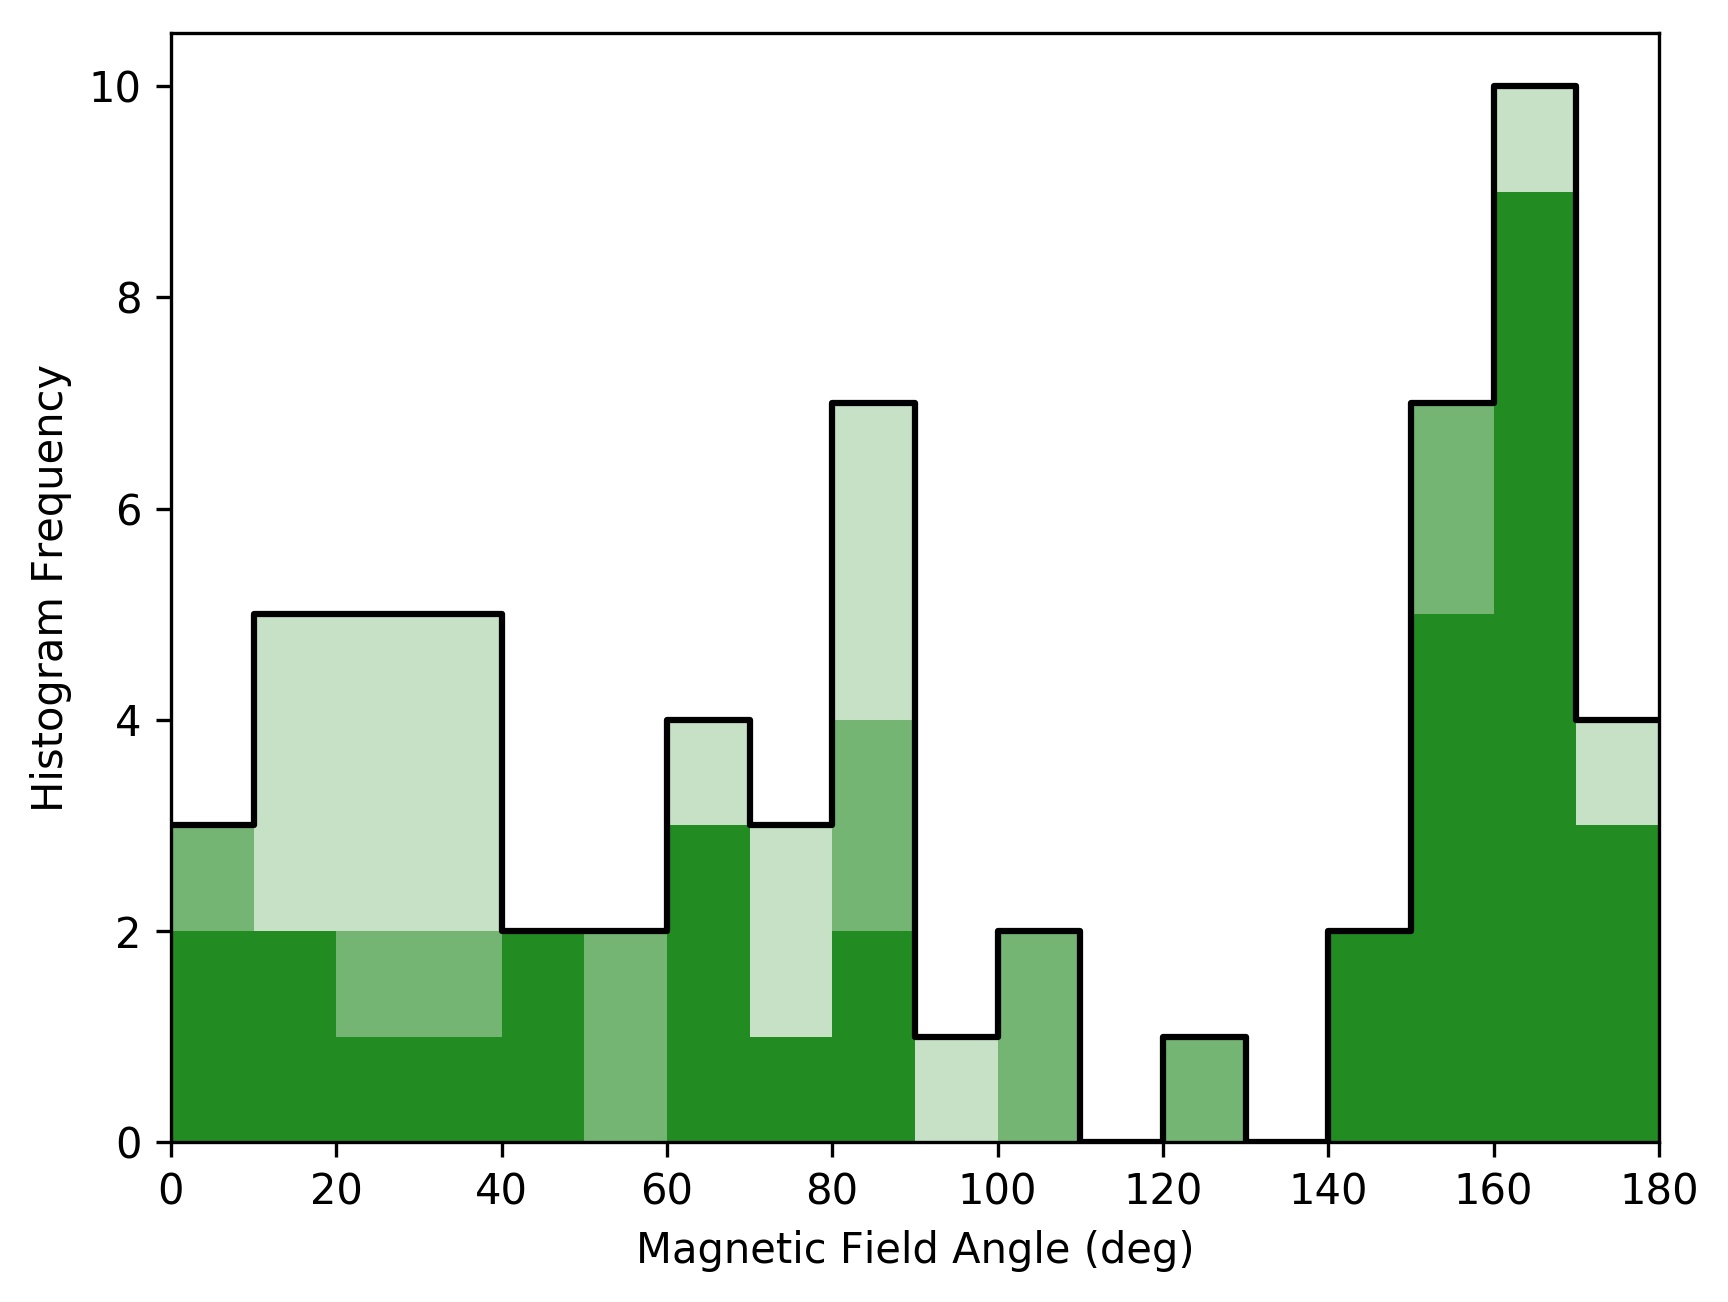
The distribution of magnetic field angles is shown in Figure 2. The field in the galactic centre can be seen as a strong peak at E of N (circular mean value, calculated over vectors where mJy arcsec-2), while the vectors associated with the outer galaxy occupy a broad range of angles, principally but not exclusively in the range E of N.
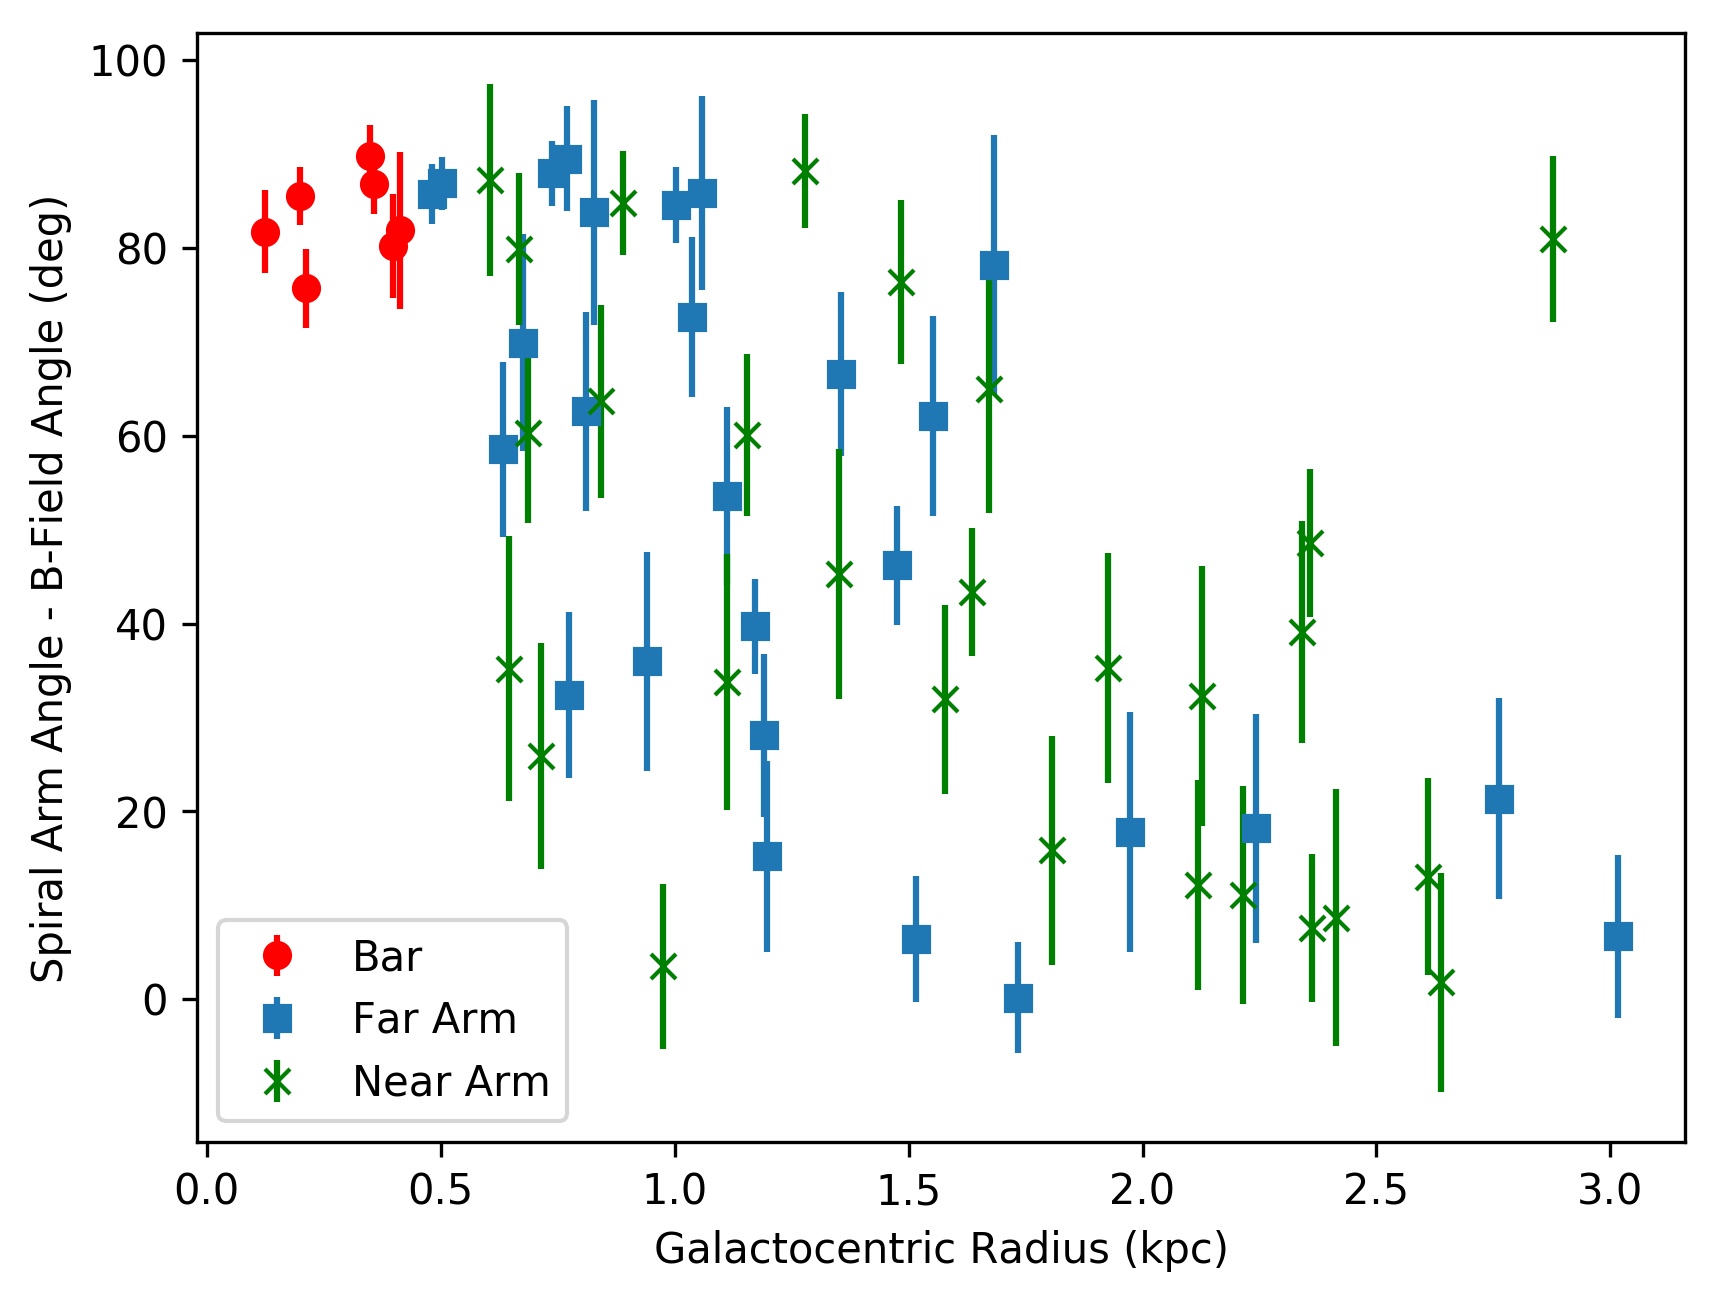
We calculated the implied galactocentric radius of each pixel if it were tracing emission from the plane of the galaxy, assuming an inclination angle of 76.9∘ (Clark et al., 2018). Magnetic field angle as a function of implied galactocentric radius is shown in the central panel of Figure 3, in which the two components of the angle distribution can be seen.
We adopted the spiral arm model of M82 proposed by Mayya et al. (2005), in which an logarithmic spiral arm with a pitch angle of 14∘ extends from each end of the 60′′-long bar, which is offset by 4∘ from the 26∘ position angle of the galaxy (Telesco et al., 1991). These spiral arms are overlaid on our data in the top panel of Figure 3. It can be seen that the poloidal field component extends above and below the bar, but does not extend beyond the ends of the bar in the plane of the galaxy. Elsewhere, the field appears to be broadly toroidal around the galactic centre, or parallel to the spiral arm structure, as discussed below.
The offset between each magnetic field vector and the angle of the spiral arm component to which it is nearest is shown in the lower panel of Figure 3. We can see the transition from a perpendicular, poloidal, field pattern which dominates in the galactic centre to a field approximately parallel to the spiral arms in the outer galaxy. With the exception of one data point at a radius of kpc which is offset from the spiral arm direction by (R.A., Dec.), the spiral-arm-aligned component emanating from the disc appears to dominate over the poloidal component beyond a galactocentric radius kpc. The transition occurs at an 850m flux density mJy arcsec-2, at a plane-of-sky distance above/below the bar. Assuming an inclination of and a distance of 3.5 Mpc, this corresponds to a height above the disc of pc.


3.2 Grain alignment
Observations of polarised dust emission typically show a power-law dependence, , where (Whittet et al., 2008; Jones et al., 2015). A steeper index (higher ) indicates either poorer grain alignment with respect to the magnetic field or more variation of the magnetic field direction along the line of sight (LOS): indicates that grains are consistently aligned throughout the LOS, while implies complete randomisation of either grain alignment or magnetic field direction along the LOS (Pattle et al., 2019).
We measured using the method described by Pattle et al. (2019), in which we assume that the underlying relationship between and can be parameterised as
| (5) |
where is the polarisation fraction at the RMS noise level of the data , and is a power-law index in the range . We fitted the relationship between and observed non-debiased polarisation fraction with the mean of the Ricean distribution of observed values of which would arise from equation 5 in the presence of Gaussian RMS noise in Stokes and :
| (6) |
where is a Laguerre polynomial of order . See Pattle et al. (2019) for a derivation of this result. We restricted our data set to the central 3-arcminute diameter region over which exposure time, and so RMS noise, is approximately constant (Friberg et al., 2016).
The relationship between and in M82 is shown in Figure 4. By fitting Equation 6 to the data, we measure a best-fit index of . This suggests that in our observations of M82, grain alignment remains quite good and that a single average field direction along the LOS dominates the 850m emission at most locations, implying a sharp transition from the poloidal component to the orthogonal toroidal component dominating the emission profile above and below the bar. We see hints of a line of null polarisation at above and below the bar, perhaps delineating the locations where the wind and disc dust components contribute similar amounts of polarised 850m emission.

4 Discussion
We posit that the polarisation geometry observed at 850m can easily be reconciled with observations at other wavelengths if it traces the poloidal magnetic field in the central starburst at small galactocentric radii, and a toroidal/spiral-arm-aligned field in the disc of M82 at large galactocentric radii. In Figure 3 we show that the magnetic field direction transitions from being broadly perpendicular to the bar in the galactic centre to being broadly parallel to the spiral arms at larger galactocentric radii.
Many previous studies have suggested the existence of a two-component magnetic field in M82 (c.f. Jones, 2000, Figure 5). Observations of other spiral galaxies (e.g. M51; Jones et al. 2020) show magnetic fields running parallel to the spiral arms, in keeping with the -dynamo model. We note that at the signal-to-noise ratio that we achieve in the outer parts of M82, it is difficult to definitively distinguish between a field generically toroidal around the galactic centre and one running along the spiral arms. However, both theory and previous observation leads us to expect fields to be parallel to spiral arms where such arms exist (Beck et al., 1996).
HAWC+ 53m and 154m vectors (Jones et al., 2019), are shown in Figure 5. We see good agreement between the POL-2 and HAWC+ results in the centre of the galaxy, with all three wavelengths appearing to trace the poloidal field component. While the HAWC+ 53m measurements do not extend far beyond the central bar, the 154m measurements extend considerably further. The POL-2 850m and HAWC+ 154m results agree at the ends of the bar, where we do not expect the outflow to be launching material. However, the two measurements disagree in the outer galaxy both above and below (particularly above) the galactic plane.
The fact that HAWC+ observations trace the galactic wind indicates that large amounts of dust are entrained in the galactic outflow (Jones et al., 2019). Based on their 53m observations, Jones et al. (2019) infer that the poloidal field geometry extends up to 350 pc above and below the plane, while the outflow itself extends at least 11 kpc from the plane (Devine & Bally, 1999).
We see the poloidal field extending to pc above and below the plane, in very good agreement with the extent over which the HAWC+ 53m emission is observed. However, the 154m-inferred field geometry continues to be poloidal to significantly larger distances above the plane, and the superwind field lines have been extrapolated to extend into the intergalactic medium (Lopez-Rodriguez et al., 2021). This suggests that at 850m, we are observing the poloidal magnetic field in the central starburst region. Beyond this region, our observations trace the magnetic field in the cold, high-column-density dust of the galactic plane, while 154m observations trace hot, low-column-density dust entrained in the superwind, in which the dust mass scale height is kpc (Leroy et al., 2015). The change in behaviour at 350 pc above the plane is consistent with models of M82 that call for the breakout from the starburst region to the beginning of the superwind to take place at around this vertical scale (e.g. Heckman et al., 1990; Martini et al., 2018).

5 Conclusions
We have observed the starburst galaxy M82 in 850m polarised light using the POL-2 polarimeter on the James Clerk Maxwell Telescope (JCMT). Our observations trace a poloidal magnetic field in the M82 central starburst region to heights pc above the plane of the galaxy, but trace a field in the disc parallel to the spiral arms at galactocentric radii kpc, in good agreement with predictions for a starbursting spiral galaxy. We see a significant discrepancy between POL-2 850m and HAWC+ 154m measurements in the outer galaxy, where the HAWC+ measurements trace hot, low-column-density dust entrained by the superwind. Observations across the submillimetre/far-infrared regime are thus necessary to disentangle the multiple magnetic field components of starburst galaxies.
Acknowledgements
We thank Terry J. Jones for providing us with the HAWC+ vector catalogues. The James Clerk Maxwell Telescope is operated by the East Asian Observatory on behalf of The National Astronomical Observatory of Japan; Academia Sinica Institute of Astronomy and Astrophysics; the Korea Astronomy and Space Science Institute; Center for Astronomical Mega-Science (as well as the National Key R&D Program of China with No. 2017YFA0402700). Additional funding support is provided by the Science and Technology Facilities Council of the United Kingdom and participating universities and organisations in the United Kingdom, Canada and Ireland. Additional funds for the construction of SCUBA-2 were provided by the Canada Foundation for Innovation. This research made use of Astropy (Astropy Collaboration et al., 2013, 2018). The authors wish to recognise and acknowledge the very significant cultural role and reverence that the summit of Maunakea has always had within the indigenous Hawaiian community. We are most fortunate to have the opportunity to conduct observations from this mountain.
Data Availability
The reduced data used in this analysis are available at [CADC DOI to be inserted]. The raw data are available in the Canadian Astronomy Data Centre archive under project code M20BP022.
References
- Adebahr et al. (2017) Adebahr B., Krause M., Klein U., Heald G., Dettmar R. J., 2017, A&A, 608, A29
- Andersson et al. (2015) Andersson B. G., Lazarian A., Vaillancourt J. E., 2015, ARA&A, 53, 501
- Astropy Collaboration et al. (2013) Astropy Collaboration et al., 2013, A&A, 558, A33
- Astropy Collaboration et al. (2018) Astropy Collaboration et al., 2018, AJ, 156, 123
- Beck et al. (1996) Beck R., Brandenburg A., Moss D., Shukurov A., Sokoloff D., 1996, ARA&A, 34, 155
- Chapin et al. (2013) Chapin E. L., Berry D. S., Gibb A. G., Jenness T., Scott D., Tilanus R. P. J., Economou F., Holland W. S., 2013, MNRAS, 430, 2545
- Clark et al. (2018) Clark C. J. R., et al., 2018, A&A, 609, A37
- Dempsey et al. (2013) Dempsey J. T., et al., 2013, MNRAS, 430, 2534
- Devine & Bally (1999) Devine D., Bally J., 1999, ApJ, 510, 197
- Elvius (1962) Elvius A., 1962, Lowell Observatory Bulletin, 5, 281
- Friberg et al. (2016) Friberg P., Bastien P., Berry D., Savini G., Graves S. F., Pattle K., 2016, in Holland W. S., Zmuidzinas J., eds, Society of Photo-Optical Instrumentation Engineers (SPIE) Conference Series Vol. 9914, Millimeter, Submillimeter, and Far-Infrared Detectors and Instrumentation for Astronomy VIII. p. 991403, doi:10.1117/12.2231943
- Greaves et al. (2000) Greaves J. S., Holland W. S., Jenness T., Hawarden T. G., 2000, Nature, 404, 732
- Heckman et al. (1990) Heckman T. M., Armus L., Miley G. K., 1990, ApJS, 74, 833
- Holland et al. (2013) Holland W. S., et al., 2013, MNRAS, 430, 2513
- Jacobs et al. (2009) Jacobs B. A., Rizzi L., Tully R. B., Shaya E. J., Makarov D. I., Makarova L., 2009, AJ, 138, 332
- Jones (2000) Jones T. J., 2000, AJ, 120, 2920
- Jones et al. (2015) Jones T. J., Bagley M., Krejny M., Andersson B. G., Bastien P., 2015, AJ, 149, 31
- Jones et al. (2019) Jones T. J., et al., 2019, ApJ, 870, L9
- Jones et al. (2020) Jones T. J., et al., 2020, AJ, 160, 167
- Kronberg et al. (1999) Kronberg P. P., Lesch H., Hopp U., 1999, ApJ, 511, 56
- Leroy et al. (2015) Leroy A. K., et al., 2015, ApJ, 814, 83
- Lopez-Rodriguez et al. (2021) Lopez-Rodriguez E., Guerra J., Asgari-Targhi M., Schmelz J. T., 2021, arXiv e-prints, p. arXiv:2102.03362
- Martini et al. (2018) Martini P., Leroy A. K., Mangum J. G., Bolatto A., Keating K. M., Sandstrom K., Walter F., 2018, ApJ, 856, 61
- Matthews et al. (2009) Matthews B. C., McPhee C. A., Fissel L. M., Curran R. L., 2009, ApJS, 182, 143
- Mayya et al. (2005) Mayya Y. D., Carrasco L., Luna A., 2005, ApJ, 628, L33
- Montier et al. (2015) Montier L., Plaszczynski S., Levrier F., Tristram M., Alina D., Ristorcelli I., Bernard J. P., Guillet V., 2015, A&A, 574, A136
- Moss et al. (2014) Moss D., Sokoloff D., Beck R., Krause M., 2014, A&A, 566, A40
- Neininger et al. (1990) Neininger N., Beck R., Backes F., 1990, in Beck R., Kronberg P. P., Wielebinski R., eds, International Astronomical Union Symposium Proceedings Vol. 140, Galactic and Intergalactic Magnetic Fields. p. 253
- Pattle et al. (2019) Pattle K., et al., 2019, ApJ, 880, 27
- Pattle et al. (2021) Pattle K., et al., 2021, ApJ, 907, 88
- Plaszczynski et al. (2014) Plaszczynski S., Montier L., Levrier F., Tristram M., 2014, MNRAS, 439, 4048
- Shopbell & Bland-Hawthorn (1998) Shopbell P. L., Bland-Hawthorn J., 1998, ApJ, 493, 129
- Telesco et al. (1991) Telesco C. M., Campins H., Joy M., Dietz K., Decher R., 1991, ApJ, 369, 135
- Whittet et al. (2008) Whittet D. C. B., Hough J. H., Lazarian A., Hoang T., 2008, ApJ, 674, 304