Centralities in complex networks
I Glossary
-
Network
A network is a collection of nodes (also called vertices) and edges (also called links) linking pair of nodes. Mathematically, it is represented by a graph where is the set of nodes and is the set of edges. Additional information can be attached to each node or edge, for example edges can have different weights. Edges can be undirected or directed.
-
Adjacency matrix
The adjacency matrix, , of a network is a matrix () with element if there is an edge from node and to node and otherwise. If the network is weighted, where is the weight associated with the edge between nodes and if it exists and otherwise. For undirected network, , i.e. is symmetric.
-
Degree of a node
The degree, , of node in an undirected network is equal to its number of connections, i.e. . For directed network, we differentiate the in-degree, and the out-degree, , i.e. the number of edges in-coming to node and out-coming from node , respectively. In weighted undirected networks, the degree of a node is replaced by its strength, or in-strength and out-strength for weighted directed networks.
-
Walk
A walk is an alternating sequence of vertices and edges in which every vertex is incident to both the edges that come before and after it in the sequence.
-
Path
A path on a graph is a walk in which all vertices and edges are distinct.
-
Connected components
A connected component of an undirected graph is a subgraph of , made of a subset of and all the edges connecting nodes of the subset toghether, where there exist a path between each pair of nodes. In directed graphs, we differentiate strongly-connected components, where there exist a path in both directions between all pairs of nodes, and weakly-connected components, where there exist a path in at least one direction between all pairs of nodes.
II Why study networks?
In network science complex systems are represented as a mathematical graphs consisting of a set of nodes representing the components and a set of edges representing their interactions. The framework of networks has led to significant advances in the understanding of the structure, formation and function of complex systems [1, 2, 3, 4]. Social and biological processes such as the dynamics of epidemics [5], the diffusion of information in social media [6], the interactions between species in ecosystems [7] or the communication between neurons in our brains [8] are all actively studied using dynamical models on complex networks. In all of these systems, the patterns of connections at the individual level play a fundamental role on the global dynamics and finding the most important nodes allows one to better understand and predict their behaviors.
III Definition of the Subject
Real-world complex networks are characterized by a number of structural features differentiating them from regular networks, such as lattices, but also making them different than completely random graphs, such as Erdős-Rényi graphs [1]. The properties that can be found in complex networks include, for example, a modular organization, also called community structure [9], or the so-called small-world effect, i.e. the fact that most pairs of nodes are connected by a very short path compared to the sizes of the networks [10]. A characteristic of real-world complex networks that interests us here and that has been intensively studied is the fact that their degree distributions are usually very heterogeneous [4, 1], indicating that there is usually large differences in the number of connections that nodes have. Many real world networks have been found to have degree distributions resembling power laws and are sometimes referred to as scale-free [11]. Whether these real-world systems are really scale-free and whether their degree distributions are really power laws is still disputed [12]. However, what is undeniable is the fact that many real world networks have degree distributions that are heavy-tailed with a minority of the nodes concentrating the majority of the connections.
In these systems, a small set of essential nodes can shape the collective dynamics of the entire systems. For example, during epidemic outbreaks of infectious diseases, some individuals, known as super-spreaders, infect disproportionately more secondary contacts, as compared to most others [13, 14], keystone species in ecology are responsible for the integrity and stability of ecosystems [15, 16, 17, 18] and specific regions in brain networks are more important than others in the formation of memory [8, 19, 20, 21]. In social networks, a small set of influencers can drive the global dynamics of the system [22] and opinion leaders are capable of influencing the public viewpoint on certain trending topics [23]. An important research effort in network science has therefore been dedicated to the development of methods allowing to find the most important nodes in networks. Intuitively, nodes with a large degree are likely to be more successful to trigger large-scale propagations or to control a large number of nodes. The degree centrality ranks nodes in terms of their degree and allows to identify highly connected hubs present in most real-world complex networks that play an essential role in controlling their dynamics and maintaining their integrity [24, 25, 26]. While the degree centrality is arguably the simplest centrality measure, it only uses local information about each node to rank its centrality and more complex centrality measures have been developed in order to capture the collective network effects impacting the influence of a node. Most centrality measures are based on a notion of distance between nodes or on a way to traverse the network that allows to compute how ”central” a node is compared to other nodes while capturing the heterogeneous structural patterns of complex networks. In the following, we describe centrality measures based on the notions of network traversal they rely on. This short entry aims at being an introduction to this extremely vast topic, with many contributions from several fields, and is by no means an exhaustive review of all the literature about network centralities (see, for example, [27, 28, 29, 30, 31] for more exhaustive reviews).
III.1 Centrality measures based on shortest paths
Closeness centrality [32, 33, 34, 35] and betweenness centrality [27, 36] are two dual measures of centrality initially developed in social sciences to assess the importance in terms of ease of access to others nodes (closeness) and brokering power (betweenness) of individuals in social networks. These centralities have since then been used in many other contexts. They are based on the assumption that information, or influence, propagates between two nodes in the most efficient way, i.e. by following the shortest path between them.
Considering an unweighted and undirected graph , a walk on the graph is an alternating sequence of vertices and edges in which every vertex is incident to both the edges that come before and after it in the sequence. A path on a graph is a walk in which all vertices and edges are distinct. A graph is said to be connected if there exists a path from any node node to any other node in the graph. Considering the distance between two nodes and in a connected undirected and unweighted graph as the number of edges in the shortest path between them, the total distance of vertex is defined as the sum of its distance to all other vertices
which is larger for vertices that are the farther away from other vertices. Therefore, the closeness centrality of a node on a connected and undirected network is usually defined as [32, 33]
| (1) |
The betweenness centrality captures the brokering power of node as the opportunity it has to intercept or influence the communications happening between pairs of other nodes. Let be the number of shortest paths between and and let be the number of shortest paths between and passing by a brokering node . We consider and if . We call the quantity the dependency of a sender and a receiver on a broker [37]. The betweenness centrality in a connected and undirected graph is defined as the sum of dependencies of all communicating pairs on a broker [38]
| (2) |
and can be seen as the overall potential control of on the communications in G.
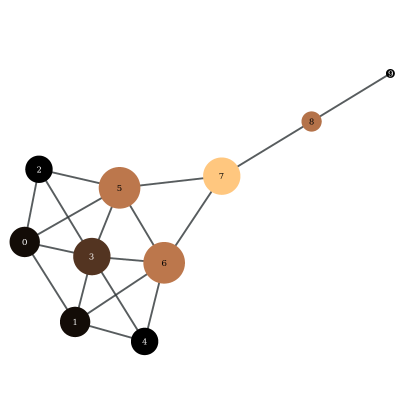
Betweenness and closeness centrality can be seen as being dual to each other conceptually expressing either the independence from the control of others (closeness) or the potential control over others (betweenness) [38, 37]. Indeed, by noting that when considering shortest paths between and with different brokers at a fixed distance from () each shortest path pass through exactly one broker and therefore . This implies that the sum of dependencies between a sender and a receiver taken over of possible brokers is proportional to the distance between and : . This observation allows one to define the closeness centrality as revealing its mathematical duality with betweenness centrality as a different partial sum, over and instead of and , of the dependencies showing its interpretation as a measure of lack of independence on others [37]. Figure 1 shows the kite graph introduced by Krackhardt in 1990 as an illustration of the different ranking obtained by these centrality measures [39].
In directed networks, closeness and betweenness centrality can be generalized by considering the notion of reachability instead of distance. In weighted networks where edge weights typically represent a distance or a lag in the connection between adjacent nodes, the length of a path is usually taken as being the sum of the weights of its edges. We refer the reader to [37] for a discussion about the generalizations of the closeness and betweenness centrality to directed and weighted networks, and to their interpretations in these cases.
Many variants of closeness and betweenness have been developed [40]. The concept of betweenness centrality has also been extended to edges by considering the number of shortest paths containing an edge instead of a node in eq. (2) [40] or, for example, by considering the fraction of minimum spanning trees of a graph that contain a given edge [41]. Versions of the closeness and betweenness centralities based on random walks instead of shortest paths have also been developed [42, 43].
III.2 Centrality measures based on walks
Several widely used centrality measures can be seen as being based on the concept of graph walks. Walks, alternating sequences of vertices and edges in which every vertex is incident to both the edges that come before and after it in the sequence, are useful to count the number of possible ways there is to reach a given node starting from another node. Centrality measures based on walks usually try to find the nodes from which there are the largest number of walks reaching other nodes. For unweighted networks, the number of walks of length existing between two nodes and is given by the element of the power of the adjacency matrix: . The number of walks of length starting from node is then given by or in matrix notation , where is the unit vector. The degree centrality of a node can be expressed as the number of walks of length 1 starting from it:
| (3) |
In order to take into account information about the surrounding of a node in its centrality score, several researchers have developed centrality measures that consider longer walks. The idea being that if a node is close to a node with a high centrality, its centrality should also be high [44, 45]. Starting from an initial guess for the centrality of each node given by the vector (e.g. ), we can propagate this initial centrality through walks of a given length. The centrality vector for walks of length is given by
| (4) |
Writing the initial centrality as a linear combination of the eigenvector of the adjacency matrix, one can see that as the centrality will converge to a vector proportional to the leading eigenvector of , the one corresponding to its largest eigenvalue, and that takes into account global information about the network structure [46]. As is non-negative and if is connected, the Perron-Frobenius theorem ensures that the leading eigenvector is positive and that the associated eigenvalue is positive and simple. The resulting vector is called the eigenvector centrality whose element is defined as
| (5) |
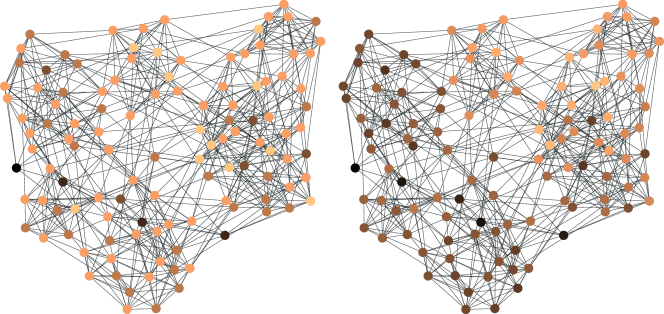
In weighted networks, the eigenvector centrality is propagated along walks on the graph that are weighted by the edge weights. The eigenvector centrality can be computed similarly on directed and undirected networks with the difference that for directed networks, the adjacency matrix is in general asymmetric and has therefore two different sets of left- and right-eigenvectors. Depending on the application, one may prefer to use the largest left-eigenvector or the largest right-eigenvector if one is more interested in nodes having a large number of incoming walks or outgoing walks, respectively. However, other types of centralities are usually preferred for directed networks as the eigenvector centrality of nodes outside of a strongly connected component (a subgraph where there exist a path in both directions between all pairs of nodes) may be equal to zero. In particular, in directed graphs without cycles (closed directed paths), the eigenvector centrality is zero for all nodes. A comparison of the degree centrality with the eigenvector centrality is shown in Fig. 2 for an undirected network of American football teams [47, 48].
The subgraph centrality is based on the idea of counting the number of times that a node takes part in the different connected subgraphs of a network, with smaller subgraphs having higher importance [49]. The subgraphs are identified by counting closed walks of different lengths that start and end on a given node. The subgraph centrality of node is defined as
| (6) |
By noticing that , where denotes the matrix exponential of , the subgraph centrality can be obtained from the spectrum of the adjacency matrix as [49]
| (7) |
where form an orthonormal basis of and are eigenvectors of associated with the eigenvalues . This centrality is more discriminative than the degree, betweenness, closeness or eigenvector centralities and gives a distinctly different ranking of nodes in real-world complex networks [49].
Another centrality measures based on walks that tries to solve the issue of the eigenvector centrality in directed networks is the Katz centrality [44]. The Katz centrality of node is the weighted sum of all walks emanating from , with the count for walks of length weighted by a factor where . In this way the importance of longer walks is diminished compared to shorter walks. The Katz centrality of node can be written as [44]
| (8) |
where the unit shift does not alter the ranking of the nodes and may be seen as arising from a single walk of length zero. In order for the centrality to converge, the factor must be smaller than the reciprocal of the absolute value of the largest eigenvalue of [44, 45, 50]. In this case, we can also note that . Thus, the vector giving the Katz centrality of each node is also solution of the matrix equation which can be rewritten as . The Katz centrality can therefore be computed iteratively in a similar manner than the eigenvector centrality (with eq. (4)) using
| (9) |
A unit value is added at each iteration guaranteeing that the Katz centrality will never be equal to zero, even in directed networks. The factor can also be seen as balancing the importance of the eigenvector term compared to the constant term added at each iteration. In the limit as approaches the reciprocal of the absolute value of the largest eigenvalue of , the Katz centrality approaches the eigenvector centrality on strongly connected graphs [45, 50].
III.3 Centrality measures based on random walks
Random walks on graphs have been extensively studied and have many applications in the study of diffusive processes on networks and for the characterization of the structure of complex networks [58, 59, 60, 61]. A random walk on a graph is defined by the trajectory of a walker that, at each time step, jumps to a neighbors of with equal probability. On an unweighted and undirected network, the transition probability for a walker on node to jump to node is equal to
| (10) |
or in matrix notation , where is the diagonal degree matrix. In directed networks, the degree is replaced by the out-degree and in weighted networks with positive weights, the probability transition is proportional to the weight of edge . Centrality measures based on random walks exploit the fact that, if a centrality value propagates as a random walk, at each iteration, its value is divided across all out-going edges of a node. This is different than for eigenvector and Katz centralities, based on walks, where the centrality tends to concentrate on a few hubs in the network, leaving other nodes almost indistinguishable with very low scores due to the repeated reflection of influence along the mutual connections between hubs during iterations of eqs. (4) & (9) (see Figs. 2 & 3).
The distribution probability of finding a walker at time step on any node of the network can be written as a row-vector with . The evolution of the distribution probability is given by
| (11) |
On connected undirected network, the random walk reaches a stationary distribution satisfying where the probability at each node is proportional to its degree:
| (12) |
On undirected networks, the degree centrality can therefore also be seen as the stationary state of the random walk process. On directed networks, random walks are not guaranteed to converge to a unique stationary state. A stationary distribution only exists on strongly connected components of a directed network [62, 61].
To overcome this issue the PageRank centrality modifies the classical random walk by introducing a ”teleportation” probability, i.e. at each step, the walkers have a given probability to teleport uniformly at random to any other nodes of the network. The update equation for the PageRank probability density is given by [63, 64, 61]
| (13) |
where is a transition matrix constructed from such that when . For ”dangling nodes”, that have no out-going edges (i.e. ), , meaning that a walker on such a node has a uniform probability to jump to any other nodes in the network. On non-dangling nodes, at each step, walkers have a probability to follow an out-going edge and a probability to teleport to any node in the network. This modified random walks is now ergodic also on networks that are not strongly connected and converges to the probability density vector giving the PageRank centrality of node as
| (14) |
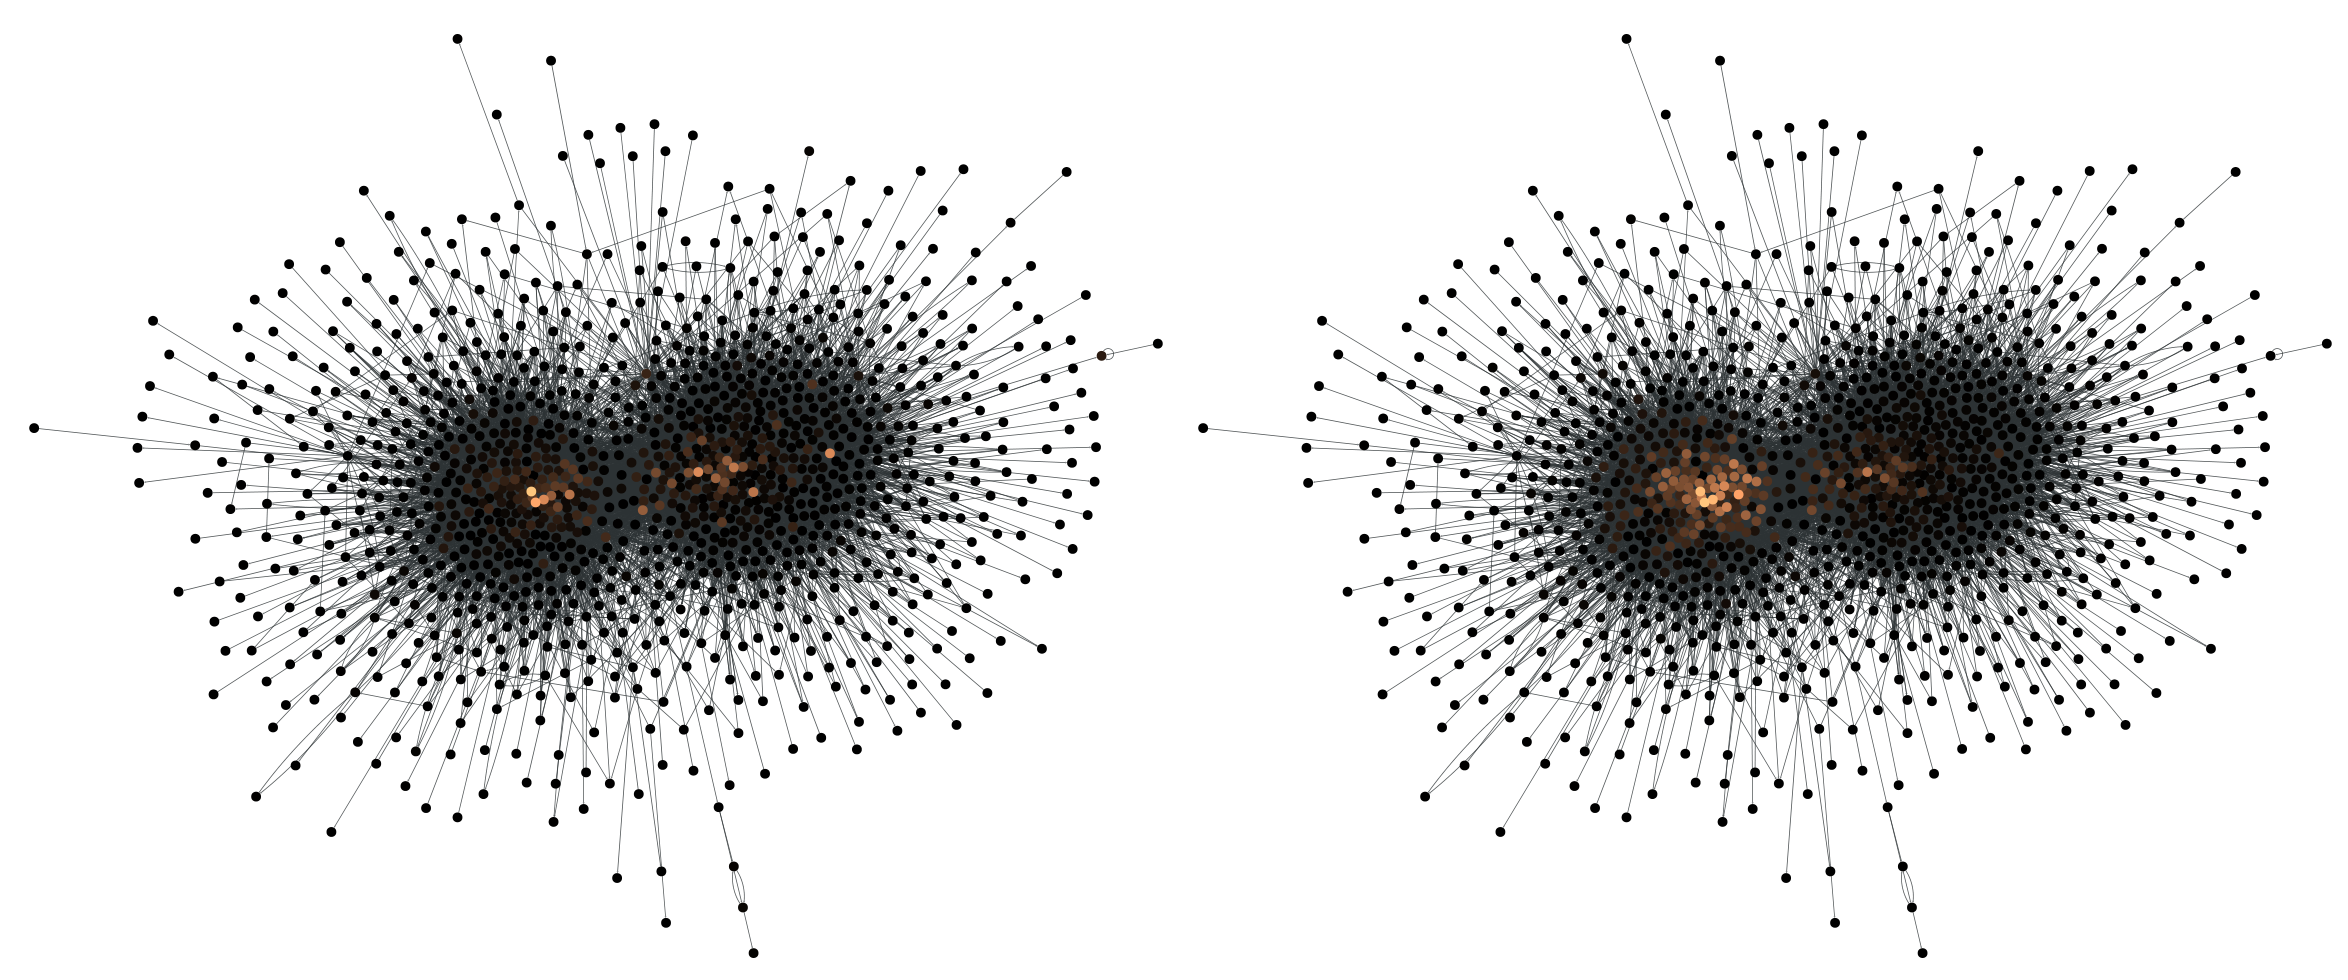
which is equal to the normalized eigenvector corresponding to the largest positive eigenvalue of the so-called Google matrix [65]. PageRank was famously developed for ranking websites for the search engine Google considering a ”random surfer model” navigating through webpages by randomly clicking on hyperlinks [64]. PageRank also found many applications in other aspects, such as ranking scientists and academic papers [66], images [67] and proteins [68]. Figure 3 shows a comparison of the PageRank and Katz centralities on a directed network of hyperlinks between weblogs [69].
The similarities between equations (4) and (11) as well as equations (9) and (13) reveal that the degree and the PageRank centralities can be seen as similar to the eigenvector and Katz centralities, but for random walks instead of regular graph walks. In the case of random walk based centralities, one looks for eigenvectors of transition matrices instead of adjacency matrices.
III.4 Centrality measures based on non-backtracking walks
In order to address the issue of ”localization” of the eigenvector centrality mentioned above, i.e. when most of the weight of centrality vector concentrates around one or a few nodes in the network, several authors have focused on using non-backtracking walks instead of regular or random walks [70, 71, 72]. Non-backtracking walks are graph walks where backtracking steps, i.e. steps where the walk comes back to an immediately preceding node, are not permitted. Using this type of walks can sometimes solve the problem of localization as they decrease reflections between hubs during iterations of the centrality [70]. Non-backtracking walks on unweighted networks are usually described using the matrix where rows and columns correspond to the directed edges of the network (). If the network is undirected, an equivalent directed network is considered by replacing each edge by a pair of directed edges in both directions. Element () of is equal to one only if and , i.e. there is a non-backtracking path of length 2 in the network. More succinctly,
| (15) |
where is the Kronecker delta. The matrix is referred to as the non-backtracking matrix or the Hashimoto matrix [73]. Powers of enumerate non-backtracking walks similarly to powers of the adjacency enumerate walks [72]. The non-backtracking matrix is in general asymmetric with eigenvalues that are in general complex, however, since its entries are non-negatives, by the Perron-Frobenius theorem, its leading eigenvalue, , is real and non-negative, and there exists a corresponding leading eigenvector, , whose elements are also non-negative real numbers. If is connected and not a tree, i.e. it has at least one cycle, is positive [74]. They satisfy the eigenvector equation
| (16) |
and the non-backtracking eigenvector centrality of node is defined by [70]
| (17) |
Finding the leading eigenvector of can however be computationally demanding for large graphs as the size of is usually much larger than the size of . However, the computation can be made much faster by computing directly as the first elements of a matrix called the Ihara-Bass matrix [75].
Non-backtracking walks have also been used to modify other centrality measures, such as the Katz [71], random walk [74] or PageRank [76] centralities.
Research on centrality measures based on non-backtracking walks is very active with recent results showing that they can also suffer from localization issues on some networks [77, 78].
Non-backtracking walks are also used in the problem of influence maximization: finding the minimal set of nodes, the influencers, which, if activated, would cause the spread of information to the whole network, or, if immunized, would prevent the diffusion of a large scale epidemic [79]. Influence maximization can be mapped to the problem of optimal percolation of random networks [80] which consists in identifying the minimal set of nodes whose removal would dismember the network in many disconnected and non-extensive components. The fragmentation of the network is measured by the size of the largest connected component, called the giant component of the network.
The intuition behind the usage of non-backtracking walks in the optimal percolation problem comes from the fact that the giant component is held together by long paths and that powers of the non-backtracking matrix allows to quickly find them. The removal of nodes is represented with the vector where if is removed (influencer) or otherwise. Considering undirected locally tree-like random graphs, a modified non-backtracking matrix is then defined as . Given an initial arbitrary positive vector , repeated iterations with ,
| (18) |
increase the norm of the vector as the influence of nodes on non-backtracking walks of larger and larger length are included. The growth rate of the vector’s norm is determined by the value of the largest eigenvalue, of the modified non-backtracking matrix. As the influencer nodes are removed, the value of decreases until the giant component is reduced to a tree (a graph without cycles) plus only one cycle when =1. The removal of supplementary nodes quickly destroys the giant component and falls to zero [80]. The optimal influence problem can therefore be rephrased as finding the optimal configuration that minimizes the largest eigenvalue of [80], which consists in removing the nodes that are on the most non-backtracking walks in the network and that are keeping the giant component connected. The collective influence [80] of a node, defined as
| (19) |
where is the set of the nodes at a distance from , is a measure of which node to remove in order to produce the largest diminution of the largest eigenvalue of non-backtracking matrix. The ranking of the nodes in term of collective influence is produced by removing the node with the largest CI value, recomputing the CI values of its neighbors and repeating the operation until the giant component of the network disappears. An advantage of CI is that it gives a high rank to seemingly ”weak nodes” with a small number of connections that are in fact surrounded by highly connected nodes and therefore on the path of many non-backtracking walks. The problem of influence maximization in networks is actively researched using many different approaches (see, for example, [81, 82, 83, 84, 85, 86]).
Conclusion and Future Directions
We have seen that there is not a single measure of centrality in networks and that one should carefully choose an appropriate measure depending on the subject of investigation. In practice, centrality measures should be chosen depending on whether the network is directed or not and whether, for example, one is looking for highly connected nodes, nodes with the most brokering power, nodes that share the most influence with each others or the minimal set of nodes that can spread information to the whole network. The differences in ranking obtained from different centrality measures should also be examined in order to better understand the signification of each ranking in a given context.
The research landscape on centrality measures for complex networks is much vaster than what has been presented in this short entry. Research is very active with recent and future directions including, for example, the properties of centrality measures based on non-backtracking walks [78], centralities in signed networks (networks where weights can be positive or negative) [87] and multilayer networks [53, 54, 88, 89]. Research is also active on the development of centralities for specific applications based on network dynamics not necessarily captured by network traversals. Examples include centralities for social networks based on game theoretical concepts [90, 91, 92], centralities for detecting vulnerabilities in power-grids based on networks of oscillators [93, 94, 95] or centralities for identifying key genes in gene regulatory networks based on the propagation of biological signals [96, 97, 98, 99].
Research is also ongoing about the development of centralities in network models that extend the concept of network as an ensemble of static pairwise relations, namely, centralities in temporal networks, i.e. time-evolving networks, [55, 56, 57, 100, 101] and in hypergraphs or simplicial complexes, i.e. generalizations of graphs where an edge can join more than two nodes [51, 102, 52, 103, 104].
References
- Newman [2003] M. E. J. Newman, SIAM Rev. 45, 167 (2003).
- Barrat et al. [2008] A. Barrat, M. Barthelemy, and A. Vespignani, Dynamical processes on complex networks (Cambridge University Press, New York, 2008).
- Boccaletti et al. [2006] S. Boccaletti, V. Latora, Y. Moreno, M. Chavez, and D.-U. Hwang, Phys. Rep. 424, 175 (2006).
- Albert and Barabási [2002] R. Albert and A.-L. Barabási, Rev. Mod. Phys. 74, 47 (2002).
- Pastor-Satorras et al. [2015] R. Pastor-Satorras, C. Castellano, P. Van Mieghem, and A. Vespignani, Rev. Mod. Phys. 87, 925 (2015).
- Zhang et al. [2016] Z.-K. Zhang, C. Liu, X.-X. Zhan, X. Lu, C.-X. Zhang, and Y.-C. Zhang, Phys. Rep. 651, 1 (2016).
- Montoya et al. [2006] J. M. Montoya, S. L. Pimm, and R. V. Solé, Nature 442, 259 (2006).
- Bullmore and Sporns [2009] E. Bullmore and O. Sporns, Nat. Rev. Neurosci. 10, 186 (2009).
- Fortunato [2010] S. Fortunato, Phys. Rep. 486, 75 (2010).
- Watts and Strogatz [1998] D. J. Watts and S. H. Strogatz, Nature 393, 440 (1998).
- Barabási [2009] A.-L. Barabási, science 325, 412 (2009).
- Holme [2019] P. Holme, Nat. Comm. , 8 (2019).
- Kitsak et al. [2010] M. Kitsak, L. K. Gallos, S. Havlin, F. Liljeros, L. Muchnik, H. E. Stanley, and H. A. Makse, Nat. Phys. 6, 888 (2010).
- Stein [2011] R. A. Stein, International Journal of Infectious Diseases 15, e510 (2011).
- May [1972] R. M. May, Nature 238, 413 (1972).
- Scheffer et al. [2012] M. Scheffer, S. R. Carpenter, T. M. Lenton, J. Bascompte, W. Brock, V. Dakos, J. Van de Koppel, I. A. Van de Leemput, S. A. Levin, E. H. Van Nes, et al., Science 338, 344 (2012).
- Mills et al. [1993] L. S. Mills, M. E. Soulé, and D. F. Doak, BioScience 43, 219 (1993).
- Morone et al. [2019] F. Morone, G. Del Ferraro, and H. A. Makse, Nat. Phys. 15, 95 (2019).
- Del Ferraro et al. [2018] G. Del Ferraro, A. Moreno, B. Min, F. Morone, Ú. Pérez-Ramírez, L. Pérez-Cervera, L. C. Parra, A. Holodny, S. Canals, and H. A. Makse, Nat. Comm. 9, 2274 (2018).
- Reis et al. [2014] S. D. Reis, Y. Hu, A. Babino, J. S. Andrade Jr, S. Canals, M. Sigman, and H. A. Makse, Nat. Phys. 10, 762 (2014).
- Zamora-López et al. [2010] G. Zamora-López, C. Zhou, and J. Kurths, Front. Neuroinform. 4, 1 (2010).
- Bovet and Makse [2019] A. Bovet and H. A. Makse, Nat. Comm. 10, 7 (2019).
- Watts and Dodds [2007] D. J. Watts and P. S. Dodds, J. Consumer. Res. 34, 441 (2007).
- Barabási and Albert [1999] A.-L. Barabási and R. Albert, Science 286, 509 (1999).
- Albert et al. [2000] R. Albert, H. Jeong, and A.-L. Barabási, Nature 406, 378 (2000).
- Cohen et al. [2001] R. Cohen, K. Erez, D. Ben-Avraham, and S. Havlin, Phys. Rev. Lett. 86, 3682 (2001).
- Freeman [1978] L. C. Freeman, Soc. Netw. 1, 215 (1978).
- Borgatti [2005] S. P. Borgatti, Soc. Netw. 27, 55 (2005).
- Perra and Fortunato [2008] N. Perra and S. Fortunato, Phys. Rev. E 78, 036107 (2008).
- Landherr et al. [2010] A. Landherr, B. Friedl, and J. Heidemann, Business & Information Systems Engineering 2, 371 (2010).
- Rodrigues [2019] F. A. Rodrigues, in A mathematical modeling approach from nonlinear dynamics to complex systems (Springer, 2019) pp. 177–196.
- Bavelas [1950] A. Bavelas, The journal of the acoustical society of America 22, 725 (1950).
- Beauchamp [1965] M. A. Beauchamp, Behavioral science 10, 161 (1965).
- Sabidussi [1966] G. Sabidussi, Psychometrika 31, 581 (1966).
- Dangalchev [2006] C. Dangalchev, Physica A 365, 556 (2006).
- Friedkin [1991] N. E. Friedkin, Am. J. Sociol. 96, 1478 (1991).
- Brandes et al. [2016] U. Brandes, S. P. Borgatti, and L. C. Freeman, Soc. Netw. 44, 153 (2016).
- Freeman [1980] L. C. Freeman, Quality and Quantity 14, 585 (1980).
- Krackhardt [1990] D. Krackhardt, Administrative science quarterly , 342 (1990).
- Brandes [2008] U. Brandes, Soc. Netw. 30, 136 (2008).
- Teixeira et al. [2015] A. S. Teixeira, P. T. Monteiro, J. A. Carriço, M. Ramirez, and A. P. Francisco, PLoS One 10, e0119315 (2015).
- White and Smyth [2003] S. White and P. Smyth, in Proceedings of the ninth ACM SIGKDD international conference on Knowledge discovery and data mining (2003) pp. 266–275.
- Newman [2005] M. J. Newman, Soc. Netw. 27, 39 (2005).
- Katz [1953] L. Katz, Psychometrika 18, 39 (1953).
- Bonacich [1972] P. Bonacich, J. Math. Sociol. 2, 113 (1972).
- Newman [2010] M. Newman, Networks: An Introduction (OUP Oxford, 2010).
- Girvan and Newman [2002] M. Girvan and M. E. Newman, Proc. Natl. Acad. Sci. U.S.A. 99, 7821 (2002).
- Evans [2010] T. S. Evans, J. Stat. Mech. Theory Exp. 2010, P12037 (2010).
- Estrada and Rodríguez-Velázquez [2005] E. Estrada and J. A. Rodríguez-Velázquez, Phys. Rev. E 71, 056103 (2005).
- Bonacich [1987] P. Bonacich, Am. J. Sociol. 92, 1170 (1987).
- Bonacich et al. [2004] P. Bonacich, A. C. Holdren, and M. Johnston, Soc. Netw. 26, 189 (2004).
- Benson [2019] A. R. Benson, SIAM Journal on Mathematics of Data Science 1, 293 (2019).
- Solá et al. [2013] L. Solá, M. Romance, R. Criado, J. Flores, A. García del Amo, and S. Boccaletti, Chaos 23, 033131 (2013).
- De Domenico et al. [2015] M. De Domenico, A. Solé-Ribalta, E. Omodei, S. Gómez, and A. Arenas, Nature communications 6, 1 (2015).
- Nicosia et al. [2013] V. Nicosia, J. Tang, C. Mascolo, M. Musolesi, G. Russo, and V. Latora, in Temporal networks (Springer, 2013) pp. 15–40.
- Praprotnik and Batagelj [2015] S. Praprotnik and V. Batagelj, Ars Mathematica Contemporanea 11, 11 (2015).
- Taylor et al. [2017] D. Taylor, S. A. Myers, A. Clauset, M. A. Porter, and P. J. Mucha, Multiscale Modeling & Simulation 15, 537 (2017).
- Rosvall and Bergstrom [2008] M. Rosvall and C. T. Bergstrom, Proc. Natl. Acad. Sci. U.S.A. 105, 1118 (2008).
- Delvenne et al. [2010] J. C. Delvenne, S. N. Yaliraki, and M. Barahona, Proc. Natl. Acad. Sci. U.S.A. 107, 12755 (2010).
- Durrett [2010] R. Durrett, Proc. Natl. Acad. Sci. U.S.A. 107, 4491 (2010).
- Masuda et al. [2017] N. Masuda, M. A. Porter, and R. Lambiotte, Phys. Rep. 716-717, 1 (2017).
- Aldous and Fill [2014] D. Aldous and J. Fill, Reversible Markov chains and random walks on graphs, Unfinished monograph (2014).
- Brin and Page [1998] S. Brin and L. Page, Computer Networks and ISDN Systems 30, 107 (1998).
- Page et al. [1999] L. Page, S. Brin, R. Motwani, and T. Winograd, The PageRank citation ranking: Bringing order to the web., Tech. Rep. (Stanford InfoLab, 1999).
- Ermann et al. [2015] L. Ermann, K. M. Frahm, and D. L. Shepelyansky, Rev. Mod. Phys. 87, 1261 (2015).
- Ding et al. [2009] Y. Ding, E. Yan, A. Frazho, and J. Caverlee, J. Assoc. Inf. Sci. Technol. 60, 2229 (2009).
- Jing and Baluja [2008] Y. Jing and S. Baluja, IEEE Trans. Pattern Anal. Mach. Intell. 30, 1877 (2008).
- Iván and Grolmusz [2010] G. Iván and V. Grolmusz, Bioinformatics 27, 405 (2010).
- Adamic and Glance [2005] L. A. Adamic and N. Glance, in Proceedings of the 3rd international workshop on Link discovery (2005) pp. 36–43.
- Martin et al. [2014] T. Martin, X. Zhang, and M. E. J. Newman, Phys. Rev. E 90, 052808 (2014).
- Arrigo et al. [2018] F. Arrigo, P. Grindrod, D. J. Higham, and V. Noferini, J. Complex Netw. 6, 54 (2018).
- Arrigo et al. [2020] F. Arrigo, D. J. Higham, and V. Noferini, Proc. R. Soc. A 476, 20190653 (2020).
- Hashimoto [1989] K.-i. Hashimoto, Adv. Stud. Pure Math. 15, 211 (1989).
- Lin and Zhang [2019] Y. Lin and Z. Zhang, The Computer Journal 62, 63 (2019).
- Krzakala et al. [2013] F. Krzakala, C. Moore, E. Mossel, J. Neeman, A. Sly, L. Zdeborová, and P. Zhang, Proc. Natl. Acad. Sci. U.S.A. 110, 20935 (2013).
- Aleja et al. [2019] D. Aleja, R. Criado, A. J. G. del Amo, Á. Pérez, and M. Romance, Chaos, Solitons & Fractals 126, 283 (2019).
- Barucca et al. [2016] P. Barucca, D. Tantari, and F. Lillo, J. Stat. Mech. Theory Exp. 2016, 023401 (2016).
- Pastor-Satorras and Castellano [2020] R. Pastor-Satorras and C. Castellano, Sci. Rep. 10, 1 (2020).
- Kempe et al. [2003] D. Kempe, J. Kleinberg, and É. Tardos, in Proceedings of the 9th ACM SIGKDD International Conference on Knowledge Discovery and Data Mining (ACM, 2003) pp. 137–146.
- Morone and Makse [2015] F. Morone and H. A. Makse, Nature 524, 65 (2015).
- Braunstein et al. [2016] A. Braunstein, L. Dall’Asta, G. Semerjian, and L. Zdeborová, Proc. Natl. Acad. Sci. USA 113, 12368 (2016).
- Mugisha and Zhou [2016] S. Mugisha and H.-J. Zhou, Phys. Rev. E 94, 012305 (2016).
- Zdeborová et al. [2016] L. Zdeborová, P. Zhang, and H.-J. Zhou, Sci. Rep. 6, 37954 (2016).
- Radicchi and Castellano [2016] F. Radicchi and C. Castellano, Phys. Rev. E 93, 030302 (2016).
- Pan et al. [2016] J. Pan, F. Jiang, and J. Xu, in 2016 IEEE First International Conference on Data Science in Cyberspace (DSC) (IEEE, 2016) pp. 260–267.
- Pei et al. [2020] S. Pei, J. Wang, F. Morone, and H. A. Makse, J. Complex Netw. 8, cnz029 (2020).
- Liu et al. [2020] W.-C. Liu, L.-C. Huang, C. W.-J. Liu, and F. Jordán, Applied Network Science 5, 1 (2020).
- Wang and Zou [2018] D. Wang and X. Zou, Applied Mathematical Modelling 54, 46 (2018).
- Wu et al. [2019] M. Wu, S. He, Y. Zhang, J. Chen, Y. Sun, Y.-Y. Liu, J. Zhang, and H. V. Poor, Proc. Natl. Acad. Sci. U.S.A. 116, 15407 (2019).
- Shapley [1953] L. Shapley, in Contributions to Game Theory, edited by H. Kuhn, A. Tucker, et al. (Princeton Univ. Press, 1953) pp. 307–317.
- Gómez et al. [2003] D. Gómez, E. González-Arangüena, C. Manuel, G. Owen, M. del Pozo, and J. Tejada, Math. Soc. Sci. 46, 27 (2003).
- Michalak et al. [2013] T. P. Michalak, K. V. Aadithya, P. L. Szczepanski, B. Ravindran, and N. R. Jennings, J. Artif. Intell. Res. 46, 607 (2013).
- Gutierrez et al. [2013] F. Gutierrez, E. Barocio, F. Uribe, and P. Zuniga, Discrete Dynamics in Nature and Society 2013 (2013).
- Tyloo et al. [2018] M. Tyloo, T. Coletta, and P. Jacquod, Phys. Rev. Lett. 120, 084101 (2018).
- Tyloo et al. [2019] M. Tyloo, L. Pagnier, and P. Jacquod, Science Advances 5, eaaw8359 (2019).
- Zotenko et al. [2008] E. Zotenko, J. Mestre, D. P. O’Leary, and T. M. Przytycka, PLoS Comput Biol 4, e1000140 (2008).
- Missiuro et al. [2009] P. V. Missiuro, K. Liu, L. Zou, B. C. Ross, G. Zhao, J. S. Liu, and H. Ge, PLoS Comput Biol 5, e1000350 (2009).
- Kim et al. [2011] Y.-A. Kim, S. Wuchty, and T. M. Przytycka, PLoS Comput Biol 7, e1001095 (2011).
- Cowen et al. [2017] L. Cowen, T. Ideker, B. J. Raphael, and R. Sharan, Nature Reviews Genetics 18, 551 (2017).
- Flores and Romance [2018] J. Flores and M. Romance, Journal of Computational and Applied Mathematics 330, 1041 (2018).
- Lv et al. [2019] L. Lv, K. Zhang, T. Zhang, D. Bardou, J. Zhang, and Y. Cai, Physics Letters A 383, 1215 (2019).
- Estrada and Ross [2018] E. Estrada and G. J. Ross, Journal of theoretical biology 438, 46 (2018).
- Aksoy et al. [2020] S. G. Aksoy, C. Joslyn, C. O. Marrero, B. Praggastis, and E. Purvine, EPJ Data Science 9, 16 (2020).
- Serrano and Gómez [2020] D. H. Serrano and D. S. Gómez, Applied Mathematics and Computation 382, 125331 (2020).