First detection of methyl formate in the hot molecular core IRAS 18566+0408
Abstract
The studies of the complex molecular emission lines in the millimeter and submillimeter wavelengths towards the hot molecular cores reveal valuable details about the chemical complexity in the interstellar medium (ISM). We presented the first detection of the rotational emission lines of the complex organic molecule methyl formate (CH3OCHO) towards the hot molecular core region IRAS 18566+0408 using the high-resolution Atacama Large Millimeter/Submillimeter Array (ALMA) band 3 observation. The estimated column density of CH3OCHO using the rotational diagram analysis was (4.10.1)1015 cm-2 with a rotational temperature of 102.81.2 K. The estimated fractional abundance of CH3OCHO relative to hydrogen (H2) towards the IRAS 18566+0408 was 3.9010-9. We noted that the estimated fractional abundance of CH3OCHO is fairly consistent with the simulation value predicted by the three-phase warm-up model from Garrod (2013). We also discussed the possible formation mechanism of CH3OCHO towards the IRAS 18566+0408.
email: arijitmanna@mcconline.org.in
Keywords ISM: individual objects (IRAS 18566+0408) – ISM: abundances – ISM: kinematics and dynamics – stars: formation – astrochemistry
1 Introduction
The study of the hot molecular cores (HMCs), specially in the initial evolution phases, is difficult due to large distances ( 1 kpc), complex cluster environments, and short evolution timescales ( 104 years) (Silva et al., 2017). The HMCs are one of the early stages of star-formation, and they play an important role in the ISM’s chemical complexity (Shimonishi et al., 2021). The HMCs are mainly characterised by their small source size (0.1 pc), high temperature (100 K), and high gas density (n106 cm-3) (van Dishoeck & Blake, 1998). The HMC regions contain high-velocity \ceH2O masers that are located near Ultra-Compact (UC) H II regions (Mehringer et al., 2004). The HMCs are the most chemically rich phase in the ISM and they are characterised by the presence of complex organic molecules like methyl cyanide (\ceCH3CN), methyl isocyanate (\ceCH3NCO), methyl formate (\ceCH3OCHO), methanethiol (\ceCH3SH), dimethyl ether (\ceCH3OCH3), methanol (\ceCH3OH), ethyl cyanide (\ceC2H5CN), vinyl cyanide (\ceC2H3CN), methylamine (\ceCH3NH2), methylene imine (\ceCH2NH), aminoacetonitrile (\ceNH2CH2CN), and cyanamide (\ceNH2CN) etc (Silva et al., 2017; Beuther et al., 2002; Shimonishi et al., 2021; Hofner et al., 2017; Gorai et al., 2021; Ohishi et al., 2019; Manna & Pal, 2022a, b). The phase of HMCs is thought to last about 105 years to 106 years (van Dishoeck & Blake, 1998; Garrod & Herbst, 2006).
The HMC candidate IRAS 18566+0408 (alternatively, G37.55+0.20) was located at a distance of 6.7 kpc (Sridharan et al., 2002). The far-infrared luminosity of IRAS 18566+0408 was 8104 L⊙, which originated from a single compact (5′′) dust continuum source (Silva et al., 2017). The single compact dust continuum emission towards IRAS 18566+0408 indicated the presence of an O8 ZAMS high-mass star (Zhang et al., 2007; Sridharan et al., 2002; Silva et al., 2017). Earlier, Carral et al. (1999) and Araya et al. (2005) detected the first weak radio continuum emission from IRAS 18566+0408 at wavelengths of 2 cm and 3.6 cm with a very low flux density 0.7 mJy, which indicated that this source is in the initial stage of the development of the UC H II region. Recently, Hofner et al. (2017) detected the radio continuum emission from IRAS 18566+0408, which was resolved into 1.3 cm and 6 cm wavelengths, and they claimed that the radio continuum emission is consistent with an ionised jet. The HMC object IRAS 18566+0408 was classified as a massive disk candidate (Zhang, 2005). The emission lines of maser methanol (\ceCH3OH) and water (H2O) at frequencies of 6.7 GHz and 22 GHz were strongly evident towards IRAS 18566+0408 (Beuther et al., 2002). The emission lines of maser formaldehyde (H2CO) at wavelength 6 cm were found from the IRAS 158566+0408 (Araya et al., 2005). The emission lines of ammonia (NH3) with transitions J = 1, 1 and J = 2, 2 were detected by the single-dish radio telescopes towards IRAS 18566+0408 (Miralles et al., 1994; Molinari et al., 1996; Sridharan et al., 2002) and later Zhang et al. (2007) studied details of the emitting region of \ceNH3 towards IRAS 18566+0408 using the VLA.
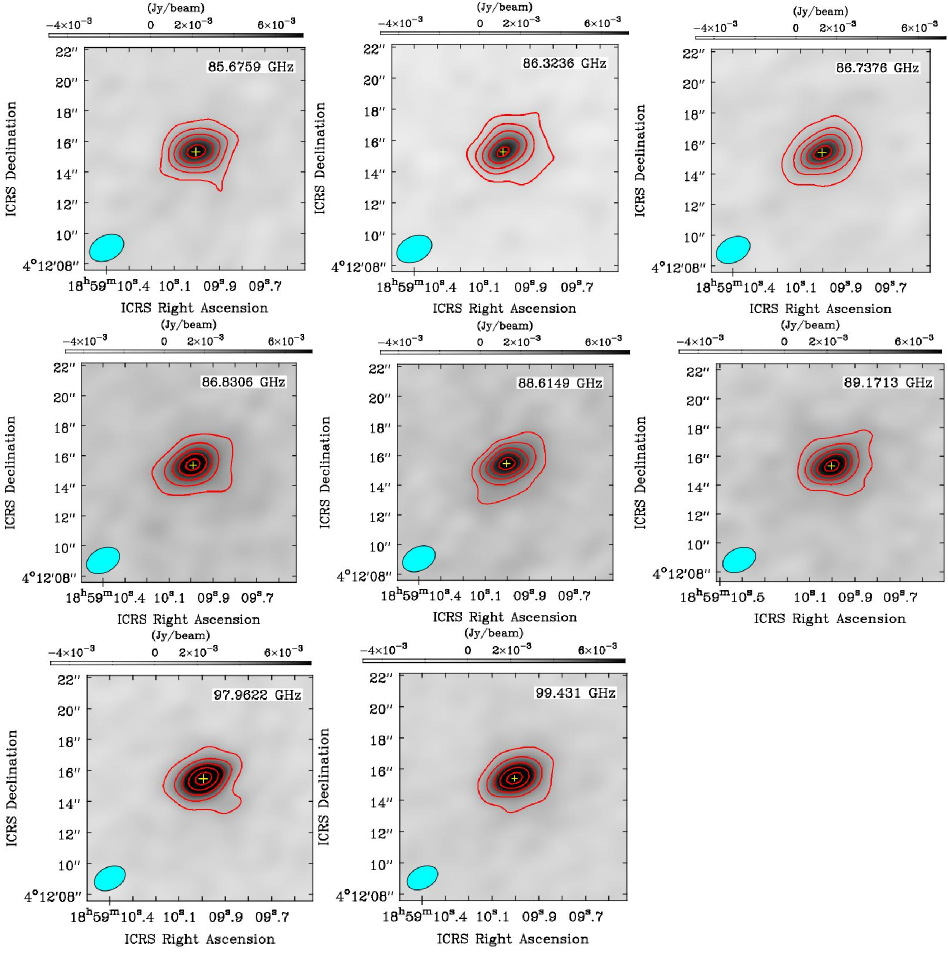
Frequency Integrated flux Peak flux Beam size Position angle RMS (GHz) (mJy) (mJy beam-1) (′′′′) (∘) (Jy beam-1) 85.6759 13.530.66 7.160.24 2.3991.622 –64.029 34.91 86.3236 11.490.94 6.580.36 2.3821.618 –64.527 43.31 86.7376 10.470.53 6.400.22 2.3771.603 –64.119 40.20 86.8305 13.010.89 7.740.35 2.3861.601 –64.750 40.75 88.6148 12.190.94 6.810.35 2.3361.588 –64.442 31.93 89.1716 10.680.52 7.190.23 2.3231.578 –64.442 47.30 97.9621 17.021.10 10.140.45 2.1311.442 –64.997 45.39 99.4310 16.810.99 9.430.38 2.0991.377 –64.329 28.99
| Wavelength | Hydrogen column density | Optical depth |
|---|---|---|
| (mm) | (cm-2) | () |
| 3.499 | 0.00495 | |
| 3.472 | 0.00457 | |
| 3.456 | 0.00445 | |
| 3.452 | 0.00538 | |
| 3.383 | 0.00473 | |
| 3.361 | 0.00501 | |
| 3.060 | 0.00702 | |
| 3.015 | 0.00656 | |
| Average Value | 0.00533 |
In the ISM, the complex organic molecule methyl formate (CH3OCHO) was one of the most abundant organic molecular species, which was specially found in both high-mass and low-mass star formation regions (Brown et al., 1975; Cazaux et al., 2003). The emission lines of CH3OCHO were first detected towards the Sgr B2(N) (Brown et al., 1975). Earlier, many chemical models indicated that the \ceCH3OCHO molecule was formed after the evaporation of the methanol (\ceCH3OH) from the grain mantle towards HMCs (Millar et al., 1991). Garrod et al. (2008) presented the formation mechanism of \ceCH3OCHO in gas-grain interaction, but how to produce \ceCH3OCHO in the ISM using gas-phase reactions is not well understood. The emission lines of \ceCH3OCHO also detected towards another HMC candidate G31.41+0.31 with an estimated column density 3.41018 cm-2 (Isokoski et al., 2013). The emission lines of CH3OCHO were also seen in the low–mass protostar IRAS 16293–2422 (Cazaux et al., 2003). Earlier, Sakai et al. (2006) detected the emission lines of \ceCH3OCHO from NGC 1333 IRAS 4B, and the author claimed these molecules can be used as a tracer of complex biomolecules in the HMC regions. Therefore, \ceCH3OCHO was an important molecule on the grain surfaces of hot corinos and HMCs.
In this article, we presented the first detection of the rotational emission lines of \ceCH3OCHO towards IRAS 18566+0408 using ALMA band 3. This paper is organised as follows. In Section 2, we discussed the observations and data reductions. The result of the detection of \ceCH3OCHO was shown in Section 3. The discussion and summary were presented in Section 4 and 5.
2 Observations and data reduction
The millimeter-wavelength observation of HMC candidate IRAS 18566+0408 was performed with the Atacama Large Millimeter/Submillimeter Array (ALMA) using the band 3 (frequency range 85.64–100.42 GHz) receiver (Project code: 2015.1.00369.S., PI: Rosero, Viviana). The observed phase centre of IRAS 18566+0408 was : 18:59:10.000 and : +04:12:16.000. During the observation, XX, YY, and XY-type signal correlators were used via the integration times of 1360.800 Sec. The observations were made on March 24th, 2016 with a minimum baseline of 41 m and a maximum baseline of 216 m. During the observation, a total of thirty-six antennas were used to study the molecular lines from IRAS 18566+0408. The solar planet Neptune was taken as a flux calibrator, J1924–2914 was taken as a bandpass calibrator, and J1830+0619 was taken as a phase calibrator. The systematic velocity () of IRAS 18566+0408 was 84.5 km s-1 (Silva et al., 2017).
We used the Common Astronomy Software Application (CASA 5.4.1)111https://casa.nrao.edu/ for initial data reduction and spectral imaging with the standard ALMA data reduction pipeline (McMullin et al., 2007). The continuum flux density of the flux calibrator Neptune for each baseline was scaled and matched with the Butler-JPL-Horizons 2012 flux calibrator model with 5% accuracy using the CASA task SETJY (Butler, 2012). Initially, we calibrated the bandpass and flux by flagging the bad data using the CASA pipeline with task hifa_flagdata and hifa_bandpassflag. After the initial data reduction, we split the target data using the task MSTRANSFORM with rest frequency in each spectral window. We used the task UVCONTSUB for the continuum subtraction procedure from the UV plane. After the continuum subtraction, we made the spectral images of IRAS 18566+0408 using the task TCLEAN with the rest frequency of each spectral window. After the creation of the spectral data cubes, we used the task IMPBCOR for the correction of the primary beam pattern in the synthesised images.
3 Results
3.1 Continuum emission towards IRAS 18566+0408
We presented the millimeter wavelength continuum emission images towards IRAS 18566+0408 at frequencies of 85.6759 GHz (3.499 mm), 86.3236 GHz (3.472 mm), 86.7376 GHz (3.456 mm), 86.8305 GHz (3.452 mm), 88.6148 GHz (3.383 mm), 89.1716 GHz (3.361 mm), 97.9621 GHz (3.060 mm), and 99.4310 GHz (3.015 mm) in Figure 1, where the surface brightness colour scale has the unit of Jy beam-1. After generating the continuum emission images, we used the CASA task IMFIT to fit the 2D Gaussian over the continuum images and obtained integrated flux density, peak flux density, synthesised beam size, position angle, and RMS, which are presented in Table. 1. We observed that the continuum image of IRAS 18566+0408 was larger than the synthesised beam size for each image, which indicated that the millimeter wavelength continuum emission was resolved between the wavelength 3.015 mm–3.499 mm.
3.2 Estimation of hydrogen column density () and optical depth () towards IRAS 18566+0408
For optically thin dust continuum emission, the flux density (Sν) can be expressed as,
| (1) |
where, indicated the optical depth, is the dust temperature, presented the Planck function at dust temperature (Whittet, 1992), and was the solid angle of the synthesised beam. The equation of optical depth can be written as,
| (2) |
where, presented the mass density of dust, was the mass absorption coefficient, and indicated the path length. The mass density of the dust can be expressed in terms of the dust-to-gas mass ratio (),
| (3) |
where, indicated the mean atomic mass per hydrogen, is the mass density of hydrogen, is the mass of hydrogen, and is the column density of hydrogen. We used dust temperature = 170 K (Hofner et al., 2017), , and (Cox & Pilachowski, 2000). The estimated peak flux density of the dust continuum of the IRAS 18566+0408 at different frequencies is presented in Table. 1. From equations 1, 2, and 3, the column density of molecular hydrogen can be expressed as,
| (4) |
During the estimation of the mass absorption coefficient (), we adopted the formula (Motogi et al., 2019), where indicated the emissivity of the dust grains at a gas density of , which covered by a thin ice mantle at 230 GHz. We used the dust spectral index 1.3 (Zhang et al., 2007; Silva et al., 2017). Using the adopted mass absorption coefficient formula, we obtained the value is 0.249, 0.251, 0.253, 0.254, 0.260, 0.262, 0.296, and 0.302 for the frequencies 85.6759 GHz, 86.3236 GHz, 86.7376 GHz, 86.8305 GHz, 88.6148 GHz, 89.1716 GHz, 97.9621 GHz, and 99.4310 GHz respectively. We estimated the column density of hydrogen for the eight frequency regions towards IRAS 18566+0408 which was presented in Table. 2. We take the average value to determine the resultant hydrogen column density towards IRAS 18566+0408. The obtained column density of hydrogen towards IRAS 18566+0408 was 1.051024 cm-2, which was estimated by taking the average of these eight continuum values. After the estimation of the hydrogen column density, we also estimated the value of optical depth () using the following equation,
| (5) |
where, indicated the brightness temperature and is the dust temperature of IRAS 18566+0408. During the estimation of the brightness temperature, we used the Rayleigh-Jeans approximation, 1 Jy beam 118 K. The estimated dust optical depth of eight individual frequency regions was presented in Table. 2. The average dust optical depth is estimated to be 0.00533. The estimated dust optical depth indicated that the HMC candidate IRAS 18566+0408 is optically thin between the frequency range of 85.64–100.42 GHz.
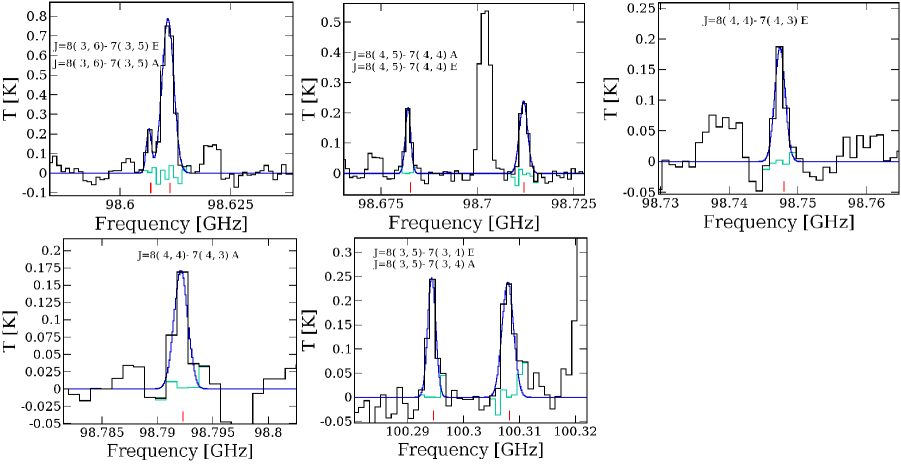
Species Frequency Transition Peak intensity S FWHM VLSR Remark [GHz] [–] [K] [s-1] [K] [Debye2] [km s-1] [km s-1] [K km s-1] CH3OCHO 98.6069 8(3,6)–7(3,5)E 27.26 1.2010-5 0.211 18.246 5.2300.31 84.500.25 1.2870.32 Non blended CH3OCHO 98.6112 8(3,6)–7(3,5)A 27.24 1.2010-5 0.748 18.273 7.6650.69 84.150.31 7.3340.96 Blended with \ceC2H5CN CH3OCHO 98.6826 8(4,5)–7(4,4)A 31.89 1.0510-5 0.212 15.966 7.6581.23 84.210.55 1.3580.29 Blended with \ceNCCONH2 CH3OCHO 98.7120 8(4,5)–7(4,4)E 31.90 1.0210-5 0.227 15.436 7.6280.75 84.380.92 1.2560.39 Blended with \ceNCCONH2 CH3OCHO 98.7479 8(4,4)–7(4,3)E 31.91 1.0210-5 0.187 15.440 6.6820.98 84.180.86 1.2870.21 Non blended CH3OCHO 98.7923 8(4,4)–7(4,3)A 31.89 1.0510-5 0.171 15.963 7.2891.28 84.260.68 2.3610.82 Non blended CH3OCHO 100.2946 8(3,5)–7(3,4)E 27.41 1.2610-5 0.245 18.259 6.2890.98 84.300.86 8.1721.83 Non blended CH3OCHO 100.3082 8(3,5)–7(3,4)A 27.40 1.2610-5 0.239 18.283 6.3250.82 84.310.96 8.3721.98 Non blended
3.3 Line emission towards IRAS 18566+0408
We extracted the millimeter wavelength spectra of IRAS 18566+0408 to create a diameter circular region centred at RA (J2000) = (18h59m09s.92), Dec (J2000) = (4∘12′15′′.58). After the extraction of the millimeter wavelength spectra, we used the CASSIS222http://cassis.irap.omp.eu/?page=cassis (Vastel et al., 2015) for the identification of the molecular emission lines towards IRAS 18566+0408 using the Cologne Database for Molecular Spectroscopy (CDMS)333https://cdms.astro.uni-koeln.de/cgi-bin/cdmssearch (Müller et al., 2005) or Jet Propulsion Laboratory (JPL)444https://spec.jpl.nasa.gov/ (Pickett et al., 1998) spectroscopic molecular databases. After the spectral analysis using the Line Analysis module in CASSIS, we detected rotational emission lines of \ceCH3OCHO towards the IRAS 18566+0408 between the frequency ranges of 85.64–100.42 GHz with a spectral resolution of 1128.91 kHz. We identified a total of eight strong rotational transition lines of \ceCH3OCHO towards IRAS 18566+0408. There were no missing transition lines of \ceCH3OCHO within the observed frequency range.
After the identification of emission lines of \ceCH3OCHO from the millimeter spectra of IRAS 18566+0408, we fitted the Gaussian model over the observed spectra of \ceCH3OCHO using the line analysis module in CASSIS. We estimated the Full-Width Half Maximum (FWHM), quantum numbers (–), upper state energy (), Einstein coefficients (), peak intensity and integrated intensity () after fitting a Gaussian model over the observed spectra of \ceCH3OCHO. The summary of the detected transitions of \ceCH3OCHO and Gaussian fitting parameters of \ceCH3OCHO was presented in Table 3 and the observed spectra of \ceCH3OCHO with Gaussian fitting were shown in Figure 2. In the case of \ceCH3OCHO, the torsional substates are noticed due to the internal rotation of the methyl group. So, we observed the A and E sub-states of \ceCH3OCHO. We carefully checked for the possible line contamination in the spectral profiles of \ceCH3OCHO with nearby molecular transitions during the spectral analysis using the line analysis module in CASSIS. We observed that J = 8(3,6)–7(3,5)A, J = 8(4,5)–7(4,4)A, and J = 8(4,5)–7(4,4)E transition lines of \ceCH3OCHO blended with \ceC2H5CN and \ceNCCONH2 respectively. The J = 8(4,4)–7(4,3)A transition line of \ceCH3OCHO does not have a proper Gaussian shape due to lower spectral resolution, but this transition is not blended with other nearby molecular transitions.
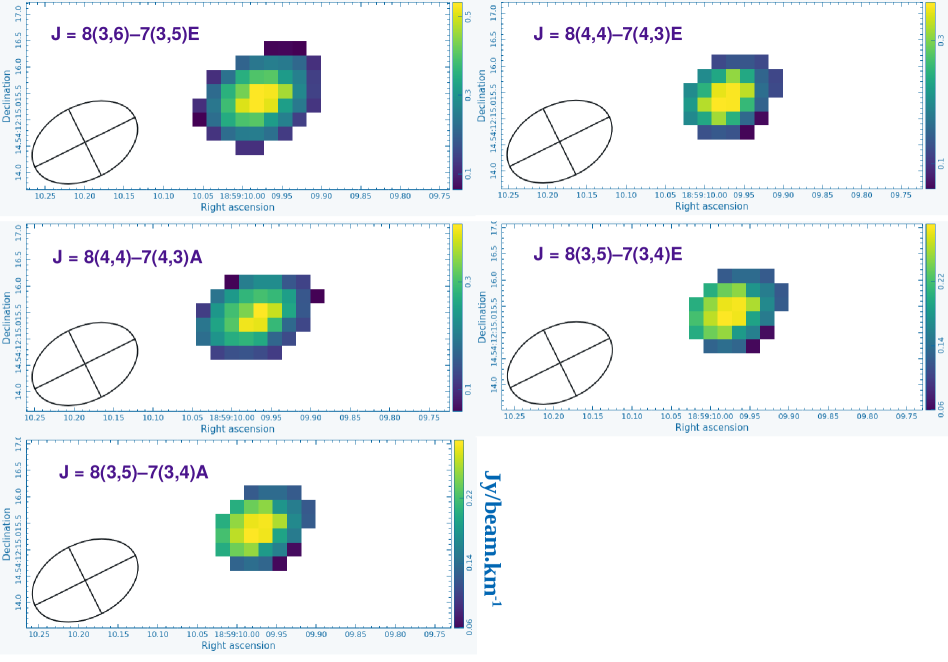
| Molecule | Transition | Emitting region |
|---|---|---|
| [–] | [′′] | |
| \ceCH3OCHO | 8(3,6)–7(3,5)E | 1.129 |
| 8(4,4)–7(4,3)E | 1.120 | |
| 8(4,4)–7(4,3)A | 1.213 | |
| 8(3,5)–7(3,4)E | 1.135 | |
| 8(3,5)–7(3,4)A | 1.133 |
3.4 Spatial distribution of \ceCH3OCHO towards IRAS 18566+0408
We created the integrated emission map of \ceCH3OCHO using the task IMMOMENTS in CASA. The integrated emission maps were created by integrating the spectral data cubes in the velocity range where the emission lines of \ceCH3OCHO were detected. We created the emission map only for the unblended transition lines of \ceCH3OCHO. The integrated emission map was shown in Figure 3, which was created using the Cube Analysis and Rendering Tool for Astronomy (CARTA)555https://carta.readthedocs.io/en/latest/introduction.html software package (Comrie et al., 2021). The resultant emission map indicated that the emission lines of \ceCH3OCHO arise from the warm inner region of IRAS 18566+0408. After the generation of the emission map, we fitted a 2D Gaussian over the integrated map using CASA task IMFIT. The deconvolved beam size of the emitting region was calculated from the following equation
| (6) |
where indicated the diameter of the circle whose area was enclosing line peak and indicated the half-power width of the synthesised beam (Manna & Pal, 2022a, b). The estimated emitting region of unblended transitions of \ceCH3OCHO is presented in Table 4. The emitting region of \ceCH3OCHO varies between 1.120′′–1.213′′. We noticed that the emitting region of \ceCH3OCHO is smaller than the synthesised beam size, which indicates all transitions of \ceCH3OCHO were not spatially resolved.
3.5 Rotational diagram analysis
We have detected the multiple hyperfine transitions of \ceCH3OCHO with different upper-state energies (). So, we used the rotational diagram method to obtain the column density () in cm-2 and rotational temperature () in K of detected emission lines of \ceCH3OCHO towards IRAS 18566+0408. We used the rotational diagram method because we assumed that the observed molecular emission lines were optically thin and that they were populated in Local Thermodynamic Equilibrium (LTE) conditions. The assumption of LTE condition was reasonable towards the IRAS 18566+0408 due to very high gas density (2.6107 cm-3 in the inner regions of hot core (Silva et al., 2017)). We observed the last four unblended transitions of \ceCH3OCHO, i.e., J = 8(4,4)–7(4,3)E ( = 31.91 K), J = 8(4,4)–7(4,3)A ( = 31.89 K), J = 8(3,5)–7(3,4)E ( = 27.41 K), and J = 8(3,5)–7(3,4)A ( = 27.40 K) consist of two close pairs in the upper state energy () levels. These four transitions exist in the same J group but they are separated by two rotational sub-states, A and E, which occur due to internal molecular rotation of the methyl (\ceCH3) group (Sakai et al., 2015). The line intensities of the A and E sublevels of \ceCH3OCHO are nearly similar (Sakai et al., 2015). The rotational diagram and LTE modelling do not affect the types of \ceCH3OCHO transitions. The column density of optically thin molecular emission lines can be expressed as (Goldsmith & Langer, 1999),
| (7) |
where, presented the degeneracy of the upper state energy (), is the Boltzmann constant, indicated the integrated intensity of the detected emission lines, is the electric dipole moment, is the strength of the transition lines, and is the rest frequency of observed molecules. Under the LTE conditions, the column density of the detected molecules can be expressed as,
| (8) |
where, is the rotational temperature, is the partition function at extracted rotational temperature, and is the upper state energy of the observed molecules. Equation 8 can be rearranged as,
| (9) |
| Simulated Valuesa | Observed Valuesb | |||
| Species | Fast | Medium | Slow | IRAS 18566+0408 |
| Abundance T (K) | Abundance T (K) | Abundance T (K) | Abundance T (K) | |
| \ceCH3OCHO | 120 | 111 | 103 | 102.8 |
Notes: a – Values taken from Table 8 of Garrod (2013);
b – this work.
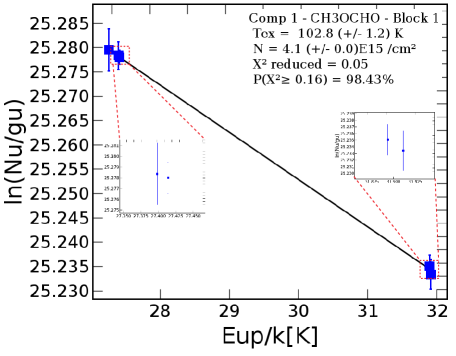
Equation 9 demonstrated the linear relationship between the and /gu). The column density and rotational temperature can be estimated by fitting a straight line to the values of /gu) which is plotted as a function of . The value of is estimated from equation 7. For the rotational diagram analysis, we extracted the line parameters like FWHM, upper state energy (), line intensity, and integrated intensity () using a Gaussian fitting over the observed spectra of \ceCH3OCHO which was presented in Table 3. During the rotational diagram analysis, we used only unblended transitions of the detected species. The computed rotational diagram of \ceCH3OCHO was shown in Figure 4. In the rotational diagram, the vertical blue error bars were the absolute uncertainty of ), and it was generated from the error of the observed , which was measured using the fitting of Gaussian model over observed transitions of \ceCH3OCHO. Using the rotational diagram analysis, we found the column density of \ceCH3OCHO was (4.10.1)1015 cm-2 with rotational temperature 102.81.2 K. The estimated rotational temperatures of \ceCH3OCHO are similar to the typical hot core temperature since the temperature of the hot core is above 100 K (van Dishoeck & Blake, 1998). After the estimation of the column density, we estimated the fractional abundance of \ceCH3OCHO which was 3.9010-9. The fractional abundance of \ceCH3OCHO was estimated with respect to \ceH2, where the column density of \ceH2 towards IRAS 18566+0408 was 1.051024 cm-2 (see Section. 3.2).
4 Discussion
Here, we presented a comparison between observational results and existing astrochemical simulations of \ceCH3OCHO. We followed the three-phase warm-up model of Garrod (2013) to compare the observational and simulation results. Garrod (2013) considered an isothermal collapse phase, which was followed by a static warm-up phase. In the first phase, the number density increased from = 3103 to 107 cm-3 under the free-fall collapse, and the dust temperature was reduced to 8 K from 16 K. In the second phase, the density remained fixed at 107 cm-3 where the dust temperature fluctuated from 8 K to 400 K. The temperature of IRAS 18566+0408 was 170 K, which is a typical hot core temperature, and the number density () of this source is 2.6107 cm-3 (Hofner et al., 2017; Silva et al., 2017). Thus, the hot core model of Garrod (2013) is suitable for understanding the chemical evolution towards the IRAS 18566+0408. Garrod (2013) used the fast, medium, and slow warm-up models based on different time scales. The time scale of the fast warm-up model is more suitable for studying the chemical evolution of HMC regions (Gorai et al., 2021). In Table 5, we compare the observed fractional abundance of \ceCH3OCHO with the simulated abundance results of Garrod (2013) and we noticed that the slow warm-up model of Garrod (2013) satisfied our estimated abundance of \ceCH3OCHO towards IRAS 18566+0408. Garrod (2013) estimated that the abundance of \ceCH3OCHO towards the HMCs environment is 3.110-9 with temperature 103 K under the slow warm-up conditions and we estimated the abundance of \ceCH3OCHO towards HMC object IRAS 18566+0408 was 3.9010-9 with temperature 102.8 K, which indicated a good agreement between the simulation and observational results.
In the ISM, the \ceCH3OCHO molecule can be efficiently created on the surface of dust grains via the reaction between methoxy radical (\ceCH3O) and formyl radical (HCO) (HCO+\ceCH3O\ceCH3OCHO). This reaction is the main formation route in the three-phase warm-up chemical model by Garrod (2013). The chemical simulation between \ceCH3O and HCO shows that these radicals are mobile around 30–40 K and the reaction is efficient for the formation of \ceCH3OCHO in the HMCs (Garrod, 2013). According to the simulation of Figure 1 in Garrod (2013), it is clear that the gas phase \ceCH3OCHO in the HMC region mainly comes from the ice phase. Our estimated abundance of \ceCH3OCHO (3.9010-9) towards IRAS 18566+0408 is similar to the simulated abundance of \ceCH3OCHO (3.9110-9) under the slow warm-up model of Garrod (2013), which indicated that \ceCH3O and HCO are responsible for the production of \ceCH3OCHO on the surface of dust grains in IRAS 18566+0408. The slow-warm phase of \ceCH3OCHO indicated that a significant amount of \ceCH3OCHO is destroyed due to the evaporation of the methanol (\ceCH3OH) in the hot core region of IRAS 18566+0408.
5 Summary
In this article, we presented the detection of complex biomolecule \ceCH3OCHO at millimeter wavelengths towards the HMC candidate IRAS 18566+0408 using the ALMA. The main results are as follows.
We reported the first detection of the rotational emission lines of \ceCH3OCHO towards the HMC region IRAS 18566+0408 using ALMA band 3 between the frequency range of 85.64–100.42 GHz.
From the dust continuum emission, the estimated column density of hydrogen () was 1.051024 cm-2. We also estimated that the dust optical depth was 0.00533, which indicated IRAS 18566+0408 is optically thin between the frequency range of 85.64–100.42 GHz.
The estimated column density of \ceCH3OCHO towards IRAS 18566+0408 was (4.10.1)1015 cm-2 with rotational temperature 102.81.2 K. The estimated fractional abundance of \ceCH3OCHO towards IRAS 18566+0408 with respect to \ceH2 is 3.9010-9. Our estimated rotational temperature indicated that the emission lines of \ceCH3OCHO arise from the warm inner region of IRAS 18566+0408 because the temperature of the hot core, in general, is above 100 K.
We compared our estimated abundance of \ceCH3OCHO with the three-phase warm-up model of Garrod (2013). After the comparison, we noticed that the slow warm-up model of Garrod (2013) satisfied the abundance of \ceCH3OCHO towards IRAS 18566+0408.
After the successful detection of \ceCH3OCHO towards IRAS 18566+0408, a broader study was needed to search for other molecular lines in the other frequency bands of ALMA to understand the chemical complexity in this HMC.
Acknowledgments
We thank the anonymous referee for the helpful comments that improved the manuscript. This paper makes use of the following ALMA data: ADS /JAO.ALMA#2015.1.00369.S (PI: Rosero, Viviana). ALMA is a partnership of ESO (representing its member states), NSF (USA), and NINS (Japan), together with NRC (Canada), MOST and ASIAA (Taiwan), and KASI (Republic of Korea), in co-operation with the Republic of Chile. The Joint ALMA Observatory is operated by ESO, AUI/NRAO, and NAOJ.
Data availability
The data that support the plots within this paper and other findings of this study are available from the corresponding author upon reasonable request. The raw ALMA data are publicly available at https://almascience.nao.ac.jp/asax/ (project id: 2015.1.00369.S).
Funding
No funds or grants were received during the preparation of this manuscript.
Conflicts of interest
The authors declare no conflict of interest.
Author Contributions
S.P. conceptualize the project. A.M. analysed the ALMA data and identify the emission lines of methyl formate (\ceCH3OCHO) from HMC candidate IRAS 18566+0408. A.M analyses the rotational diagram to derive the column density and rotational temperature of \ceCH3OCHO. A.M. and S.P. wrote the main manuscript text. All authors reviewed the manuscript.
References
- Araya et al. (2005) Araya, E., Hofner, P., Kurtz, S., et al. 2005, ApJ, 618, 339
- Balucani et al. (2015) Balucani N., Ceccarelli C., Taquet V. 2015, MNRAS, 449, L16
- Butler (2012) Butler B. 2012, ALMA Memo Series, NRAO
- Bonfand et al. (2019) Bonfand, M., Belloche, A., Garrod, R.T., et al. 2019, A&A, 628, A27
- Brown et al. (1975) Brown, R.D., Crofts, J.G., Godfrey, P. D., et al. 1975, ApJ, 197, L29
- Beuther et al. (2002) Beuther H., Schilke P., Sridharan T. K., et al. 2002, A&A, 383, 892
- Comrie et al. (2021) Comrie, A., Wang, K.-S., Ford, P., et al. 2021, CARTA: The Cube Analysis and Rendering Tool for Astronomy, 1.3.0, Zenodo
- Cazaux et al. (2003) Cazaux, S., Tielens, A. G. G. M., Ceccarelli, C., et al. 2003, A&A, 593, L51
- Carral et al. (1999) Carral, P., Kurtz, S., Rodriguez, L. F., et al. 1999, RMxAA, 35, 97
- Cox & Pilachowski (2000) Cox, A. N., & Pilachowski, C. A. 2000, Physics Today, 53, 77
- Garrod & Herbst (2006) Garrod, R. T., & Herbst, E. 2006, A&A, 457, 927
- Garrod et al. (2008) Garrod, R. T., Weaver, S. L. W., & Herbst, E. 2008, ApJ, 682, 283
- Garrod (2013) Garrod R. T. 2013, ApJS, 765, 60
- Goldsmith & Langer (1999) Goldsmith, P. F., & Langer, W. D. 1999, ApJ, 517, 209
- Gorai et al. (2021) Gorai, P., Das, A., Shimonishi, T., et al. 2021, ApJ, 907, 108.
- Hofner et al. (2017) Hofner P., Cesaroni R., Kurtz S., et al. 2017, ApJ 843 99
- Isokoski et al. (2013) Isokoski K., Bottinelli S., & van Dishoeck E. F. 2013, A&A, 554, A100
- Manna & Pal (2022a) Manna, A. & Pal, S., 2022, Life Sciences in Space Research, 34, 9
- Manna & Pal (2022b) Manna, A. & Pal, S., 2022, Journal of Astrophysics and Astronomy, 43, 83
- Mehringer et al. (2004) Mehringer, D. M., Pearson, J. C., Keene, J., & Phillips, T. G. 2004, ApJ, 608,306-313
- Motogi et al. (2019) Motogi, K., Hirota, T., Machida, M. N., et al. 2019, ApJL, 877, L25
- Molinari et al. (1996) Molinari S., Brand J., Cesaroni R., & Palla, F., 1996, A&A, 308, 573
- Miralles et al. (1994) Miralles M. P., Rodriguez L. F., & Scalise, E. 1994, ApJS, 92, 173
- McMullin et al. (2007) McMullin, J. P., Waters, B., Schiebel, D., et al. 2007, San Francisco, CA: ASP, 127
- Millar et al. (1991) Millar, T. J., Herbst, E., & Charnley, S. B. 1991, ApJ, 369, 147
- Müller et al. (2005) Müller, H. S. P., SchlMder, F., Stutzki, J. & Winnewisser, G. 2005, Journal of Molecular Structure, 742, 215–227
- Ohishi et al. (2019) Ohishi, M., Suzuki, T., Hirota, T., Saito, M. & Kaifu, N. 2019, PASJ, 71
- Pickett et al. (1998) Pickett, H. M., Poynter, R. L., Cohen, E. A., et al. 1998, Journal of Quantitative Spectroscopy and Radiative Transfer, 60, 883
- Silva et al. (2017) Silva A., Zhang Q., Sanhueza P., et al. 2017, ApJ, 847, 1538
- Sridharan et al. (2002) Sridharan T. K., Beuther H., Schilke P., et al. 2002, ApJ, 566, 931
- Shimonishi et al. (2021) Shimonishi, T., Izumi, N., Furuya, K., & Yasui, C., 2021, ApJ, 2, 206
- Sakai et al. (2015) Sakai, Y., Kobayashi, K., & Hirota, T. 2015, ApJ, 803, 97
- Sakai et al. (2006) Sakai, N., Sakai, T., Yamamoto, S. 2006, PASJ, 58, L15
- van Dishoeck & Blake (1998) van Dishoeck E. F., & Blake G. A. 1998, Annu Rev Astron Astrophys, 36, 317
- Vastel et al. (2015) Vastel, C., Bottinelli, S., Caux, E., et al. 2015, Proceedings of the Annual meeting of the French Society of Astronomy and Astrophysics, 313-316
- Whittet (1992) Whittet, D. C. B. 1992, Journal of the British Astronomical Association, 102, 230
- Zhang (2005) Zhang Q., 2005, in Massive Star Birth: A Crossroads of Astrophysics, ed. R. Cesaroni et al. (Cambridge: Cambridge Univ. Press), 135
- Zhang et al. (2007) Zhang Q., Sridharan T. K., Hunter T. R., et al., 2007, A&A, 470, 269