The color dipole model bounds with the gluon-gluon recombination correction

G.R.Boroun grboroun@gmail.com; boroun@razi.ac.ir    B.Rezaei brezaei@razi.ac.ir Physics Department, Razi University, Kermanshah 67149, Iran
Abstract

We present nonlinear (NL) and higher twist (HT) corrections to the color dipole model (CDM) bounds at low values of x𝑥x and Q2superscript𝑄2Q^{2} using the parameterization method. Consistency between the bounds at this region describe that a transition from the linear to the nonlinear behavior is dependence on the behavior of the gluon distribution function. The parameters in the color dipole model are comparable with the color dipole bounds at low values of Q2superscript𝑄2Q^{2}. Consequently, the obtained reduced cross sections at low and moderate Q2superscript𝑄2Q^{2} values due to the NL+HT effects show a good agreement with the H1 data.

****
pacs:
***
preprint: APS/123-QED

.1 1. Introduction

The starting points on the color dipole model were given by Sakurai and Schildknecht in 1972 [1] and has been expanded so far by some authors in Refs.[2,3,4]. The modern picture of the deep inelastic scattering (DIS) at low x𝑥x is described as the color dipole picture (CDP). In this picture the virtual photon fluctuates into the qq¯𝑞¯𝑞q\overline{q} pair which this pair interaction with the gluon field in the nucleon as a gauge-invariant color-dipole interaction. Due to the interaction of the gluon fields with the qq¯𝑞¯𝑞q\overline{q} dipole, the dipole cross section, σ(qq¯)L,TJ=1psubscript𝜎subscriptsuperscript𝑞¯𝑞𝐽1𝐿𝑇𝑝\sigma_{(q\overline{q})^{J=1}_{L,T}p}, is described at the color transparency and saturation limits. The W2superscript𝑊2W^{2}-dependent scale Λsat2(W2)superscriptsubscriptΛ𝑠𝑎𝑡2superscript𝑊2\Lambda_{sat}^{2}(W^{2}) separates the two regions. The color transparency of the dipole cross section according to the region of Q2Λsat2(W2)much-greater-thansuperscript𝑄2superscriptsubscriptΛ𝑠𝑎𝑡2superscript𝑊2Q^{2}{\gg}\Lambda_{sat}^{2}(W^{2}) and the saturation according to the region of Q2Λsat2(W2)much-less-thansuperscript𝑄2superscriptsubscriptΛ𝑠𝑎𝑡2superscript𝑊2Q^{2}{\ll}\Lambda_{sat}^{2}(W^{2}) respectively. Indeed the (Q2,W2)superscript𝑄2superscript𝑊2(Q^{2},W^{2}) plane of the CDP indicates that the line η(W2,Q2)=1𝜂superscript𝑊2superscript𝑄21\eta(W^{2},Q^{2})=1 subdivides the (Q2,W2)superscript𝑄2superscript𝑊2(Q^{2},W^{2}) plane into the saturation region of η(W2,Q2)<1𝜂superscript𝑊2superscript𝑄21\eta(W^{2},Q^{2})<1 and the color transparency region of η(W2,Q2)>1𝜂superscript𝑊2superscript𝑄21\eta(W^{2},Q^{2})>1. η(W2,Q2)𝜂superscript𝑊2superscript𝑄2\eta(W^{2},Q^{2}) denotes the low-x𝑥x scaling variable, η(W2,Q2)=Q2+m02Λsat2(W2)𝜂superscript𝑊2superscript𝑄2superscript𝑄2subscriptsuperscript𝑚20superscriptsubscriptΛ𝑠𝑎𝑡2superscript𝑊2\eta(W^{2},Q^{2})=\frac{Q^{2}+m^{2}_{0}}{\Lambda_{sat}^{2}(W^{2})} which Λsat2(W2)superscriptsubscriptΛ𝑠𝑎𝑡2superscript𝑊2\Lambda_{sat}^{2}(W^{2}) being the saturation scale and m020.15GeV2similar-to-or-equalssuperscriptsubscript𝑚020.15superscriptGeV2m_{0}^{2}{\simeq}0.15~{}\mathrm{GeV}^{2}. At low-x𝑥x scaling, the total photoabsorption cross section σγp(W2,Q2)=σγp(η(W2,Q2))subscript𝜎superscript𝛾𝑝superscript𝑊2superscript𝑄2subscript𝜎superscript𝛾𝑝𝜂superscript𝑊2superscript𝑄2\sigma_{\gamma^{*}p}(W^{2},Q^{2})=\sigma_{\gamma^{*}p}(\eta(W^{2},Q^{2})) is described as log(1/η(W2,Q2))1𝜂superscript𝑊2superscript𝑄2\log(1/\eta(W^{2},Q^{2})) for η(W2,Q2)<1𝜂superscript𝑊2superscript𝑄21\eta(W^{2},Q^{2})<1 and as 1/η(W2,Q2)1𝜂superscript𝑊2superscript𝑄21/\eta(W^{2},Q^{2}) for η(W2,Q2)1much-greater-than𝜂superscript𝑊2superscript𝑄21\eta(W^{2},Q^{2}){\gg}1. At large Q2Λsat2(W2)much-greater-thansuperscript𝑄2superscriptsubscriptΛ𝑠𝑎𝑡2superscript𝑊2Q^{2}{\gg}\Lambda_{sat}^{2}(W^{2}), the longitudinal-to-transverse ratio of the photoabsorption cross sections σγLp(W2,Q2)subscript𝜎subscriptsuperscript𝛾𝐿𝑝superscript𝑊2superscript𝑄2\sigma_{\gamma^{*}_{L}p}(W^{2},Q^{2}) and σγTp(W2,Q2)subscript𝜎subscriptsuperscript𝛾𝑇𝑝superscript𝑊2superscript𝑄2\sigma_{\gamma^{*}_{T}p}(W^{2},Q^{2}) reads as

R(W2,Q2)=σγLp(W2,Q2)σγTp(W2,Q2)=12ρ.𝑅superscript𝑊2superscript𝑄2subscript𝜎subscriptsuperscript𝛾𝐿𝑝superscript𝑊2superscript𝑄2subscript𝜎subscriptsuperscript𝛾𝑇𝑝superscript𝑊2superscript𝑄212𝜌\displaystyle R(W^{2},Q^{2})=\frac{\sigma_{\gamma^{*}_{L}p}(W^{2},Q^{2})}{\sigma_{\gamma^{*}_{T}p}(W^{2},Q^{2})}=\frac{1}{2\rho}. (1)

In terms of the proton structure functions, the ratio of the structure functions becomes

FL(W2,Q2)F2(W2,Q2)=11+2ρ.subscript𝐹𝐿superscript𝑊2superscript𝑄2subscript𝐹2superscript𝑊2superscript𝑄2112𝜌\displaystyle\frac{F_{L}(W^{2},Q^{2})}{F_{2}(W^{2},Q^{2})}=\frac{1}{1+2\rho}. (2)

The parameter ρ𝜌\rho is associated with the enhanced transverse size of qq¯𝑞¯𝑞q\overline{q} fluctuations in the CDM. This parameter is originating from transverse, γTqq¯subscriptsuperscript𝛾𝑇𝑞¯𝑞\gamma^{*}_{T}{\rightarrow}q\overline{q}, and longitudinal, γLqq¯subscriptsuperscript𝛾𝐿𝑞¯𝑞\gamma^{*}_{L}{\rightarrow}q\overline{q}, photons. Indeed the ρ𝜌\rho parameter describes the ratio of the average transverse momenta ρ=<k2>L<k2>T𝜌subscriptexpectationsubscriptsuperscript𝑘2bottom𝐿subscriptexpectationsubscriptsuperscript𝑘2bottom𝑇\rho=\frac{<\overrightarrow{k}^{2}_{\bot}>_{L}}{<\overrightarrow{k}^{2}_{\bot}>_{T}}. It can also be related to the ratio of the effective transverse sizes of the (qq¯)L,TJ=1subscriptsuperscript𝑞¯𝑞𝐽1𝐿𝑇(q\overline{q})^{J=1}_{L,T} states as <r2>L<r2>T=1ρsubscriptexpectationsubscriptsuperscript𝑟2bottom𝐿subscriptexpectationsubscriptsuperscript𝑟2bottom𝑇1𝜌\frac{<\overrightarrow{r}^{2}_{\bot}>_{L}}{<\overrightarrow{r}^{2}_{\bot}>_{T}}=\frac{1}{\rho}. The ρ𝜌\rho parameter is assumed to be proportional to the singlet structure and gluon distribution functions in the large-Q2superscript𝑄2Q^{2} limit [5]

ρ(x,Q2)=3π8αs(Q2)F2s(x,Q2)G(x,Q2)12,𝜌𝑥superscript𝑄23𝜋8subscript𝛼𝑠superscript𝑄2superscriptsubscript𝐹2𝑠𝑥superscript𝑄2𝐺𝑥superscript𝑄212\displaystyle\rho(x,Q^{2})=\frac{3\pi}{8\alpha_{s}(Q^{2})}\frac{F_{2}^{s}(x,Q^{2})}{G(x,Q^{2})}-\frac{1}{2}, (3)

where F2s(x,Q2)=xΣ(x,Q2)superscriptsubscript𝐹2𝑠𝑥superscript𝑄2𝑥Σ𝑥superscript𝑄2F_{2}^{s}(x,Q^{2})=x\Sigma(x,Q^{2}) and G(x,Q2)=xg(x,Q2)𝐺𝑥superscript𝑄2𝑥𝑔𝑥superscript𝑄2G(x,Q^{2})=xg(x,Q^{2}).
In this paper we want to show that the behavior of the CDM bounds at low and moderate Q2superscript𝑄2Q^{2} values are depends on the gluon density behavior. In this case the bounds are obtained via the nonlinear-DGLAP (Dokshitzer-Gribov-Lipatov-Altarelli-Parisi) evolution. Studies along this line not only confirm HERA investigations but also provide crucial benchmarks for further investigations of the high-energy limit of QCD at the Electron-Ion Collider (EIC) [6] and the large Hadron Electron Collider (LHeC) [7,8]. The kinematic extension of the LHeC will allow us to examine the non-linear dynamics at low x𝑥x. The non-linear region is approached when the reaction is mediated by multi-gluon exchange. Indeed the growth of the gluon density is slowed down at very small x𝑥x by gluon -gluon recombination process. The kinematic coverage of the NC epsuperscript𝑒𝑝e^{-}p scattering pseudodata at the LHeC which indicate the nonlinear dynamics are defined in the region x<0.01𝑥0.01x<0.01 and Q2<700GeV2superscript𝑄2700superscriptGeV2Q^{2}<700~{}\mathrm{GeV}^{2} [9,10]. At small x𝑥x the effect of ln(1/x)proportional-toabsent1𝑥\varpropto{\ln(1/x)} terms on the linear evolution equations increases. So nonlinear interactions must be applied. Indeed we need reliable LHeC predictions to understand the low x𝑥x physics [11]. Since non-linear dynamics are known to become sizable only at small-x𝑥x, so the non-linear contribution to the evolution equation [12] leads to an equation of the form

2xg(x,Q2)ln(1/x)lnQ2=α¯sxg(x,Q2)916α¯s2π2[xg(x,Q2)]22Q2,superscript2𝑥𝑔𝑥superscript𝑄21𝑥superscript𝑄2subscript¯𝛼𝑠𝑥𝑔𝑥superscript𝑄2916superscriptsubscript¯𝛼𝑠2superscript𝜋2superscriptdelimited-[]𝑥𝑔𝑥superscript𝑄22superscript2superscript𝑄2\displaystyle\frac{\partial^{2}xg(x,Q^{2})}{\partial{\ln}(1/x)\partial{\ln}Q^{2}}=\overline{\alpha}_{s}xg(x,Q^{2})-\frac{9}{16}\overline{\alpha}_{s}^{2}\pi^{2}\frac{[xg(x,Q^{2})]^{2}}{\mathcal{R}^{2}Q^{2}}, (4)

where α¯sαsCA/πsubscript¯𝛼𝑠subscript𝛼𝑠subscript𝐶𝐴𝜋\overline{\alpha}_{s}{\equiv}{\alpha}_{s}C_{A}/\pi and the parameter \mathcal{R} controls the strength of the nonlinearity. The second nonlinear term in (4) is responsible for gluon recombination. This term arises from perturbative QCD diagrams which couple four gluons to two gluons. So that two gluon ladders recombine into a single gluon ladder. It leads to saturation of the gluon density at low Q2superscript𝑄2Q^{2} with decreasing x𝑥x [13]. The gluon recombination is as important as gluon splitting which in analysis some groups such as MRST2001 [14] and CETQ6M [15] in NLO analysis considered. This implies that towards small values of x𝑥x and Q2superscript𝑄2Q^{2}, the problem of negative gluon distribution in these groups appears. Other non-linear equations such as Modified-DGLAP (Md-DGLAP) [16], Balitsky-Kovchegov (BK) [17] and Jalilian-Marian-McLerran-Weigert-Leonidov-Kovner (JIMWLK) [18] equations have been derived and considered in the last years. Some another models, such as the impact-parameter dependent saturation model (IP-Sat) [9] , developed a dipole model for DESY HERA which incorporates the impact parameter distribution of the proton. It is a simple dipole model that incorporates key features of the physics of gluon saturation. This model for the dipole amplitude contains an eikonalized gluon distribution which satisfies DGLAP evolution while explicitly maintaining unitarity [19]. In Ref.[20] the nonlinear evolution equation for dipole density have been developed. The deeply inelastic scattering at very high energies in the saturation regime considered.
The unitarity problem is discussed in Ref.[21] with respect to photoabsorption cross sections. The unitarity relation entails the nonlinearity of the observed DIS structure functions in terms of the impulse approximation (IA) parton densities. The expectation value of the interaction cross sections of the multiparton Fock states of the virtual photon over the wave functions is considered in [21]. The unitarized total cross sections σ(x,ρ)𝜎𝑥𝜌\sigma(x,\rho) reads

σ(x,ρ)σ0(x,ρ)atη(x,ρ)1similar-to-or-equals𝜎𝑥𝜌subscript𝜎0𝑥𝜌at𝜂𝑥𝜌much-less-than1\sigma(x,\rho)\simeq\sigma_{0}(x,\rho)~{}\mathrm{at}~{}\eta(x,\rho)\ll 1

where the quantity η(x,ρ)𝜂𝑥𝜌\eta(x,\rho) controls the effect of the unitarization and ρ𝜌\rho is the transverse size of the qq¯𝑞¯𝑞q\overline{q} pair. At η(x,ρ)1much-greater-than𝜂𝑥𝜌1\eta(x,\rho)\gg 1 the unitarization suppresses the cross section as σ(x,ρ)σ0(x,ρ)much-less-than𝜎𝑥𝜌subscript𝜎0𝑥𝜌\sigma(x,\rho)\ll\sigma_{0}(x,\rho) where σ0(x,ρ)subscript𝜎0𝑥𝜌\sigma_{0}(x,\rho) is the interaction cross section for the qq¯𝑞¯𝑞q\overline{q} color dipole of size ρ𝜌\rho. The effects of the qq¯g𝑞¯𝑞𝑔q\overline{q}g Fock state is deriving term of the triple-pomeron mass spectrum. The shadowing term in the unitarized structure function is dominated by the triple-pomeron term, which is approximately independent of the flavor and Q2superscript𝑄2Q^{2} variables. Indeed the unitarity (shadowing) correction is a nonlinear functional of the DGLAP cross section. Also the unitarity correction can be related to the cross section of the forward diffractive dissociation of the virtual photons (DDIS) γ+pX+psuperscript𝛾𝑝𝑋𝑝\gamma^{\ast}+p{\rightarrow}X+p where X=qq¯𝑋𝑞¯𝑞X=q\overline{q}. The conventional description of DDIS is based on the leading twist DGLAP evolution equations which characterize the QCD hard scale dependence of the diffractive parton distribution functions (DPDFs) [22]. The effects of pomeron loops and running coupling on the cross sections for inclusive γhsuperscript𝛾\gamma^{\ast}h and on diffractive deep inelastic scattering are investigated in Ref.[23]. In Ref.[24] DDIS provides a basis for the definition of the Weizsa¨¨a\mathrm{\ddot{a}}cker-Williams (WW) nuclear gluon structure function. Also the initial conditions at low x𝑥x DIS off nucleons and nuclei for QCD evolution that satisfy unitarity are described. The nonlinear effects can be tested at a superior statistical accuracy attainable at EIC.
This paper is organized as follows. In the next section the theoretical formalism is presented, including the nonlinear evolution and the color dipole parameters. In section 3, we present a detailed numerical analysis and our main results. We then confront these results with the CDM bounds at low values of Q2superscript𝑄2Q^{2}. In the last section we summarize our main conclusions and remarks.

.2 2. Theoretical formalism

In the CDM the ρ𝜌\rho parameter is dependent on the proton structure function F2(x,Q2)subscript𝐹2𝑥superscript𝑄2F_{2}(x,Q^{2}) and the gluon distribution function G(x,Q2)𝐺𝑥superscript𝑄2G(x,Q^{2}) as reads

ρ(x,Q2)=27π20αs(Q2)F2(x,Q2)G(x,Q2)12.𝜌𝑥superscript𝑄227𝜋20subscript𝛼𝑠superscript𝑄2subscript𝐹2𝑥superscript𝑄2𝐺𝑥superscript𝑄212\displaystyle\rho(x,Q^{2})=\frac{27\pi}{20\alpha_{s}(Q^{2})}\frac{F_{2}(x,Q^{2})}{G(x,Q^{2})}-\frac{1}{2}. (5)

An analytical expression for F2(x,Q2)subscript𝐹2𝑥superscript𝑄2F_{2}(x,Q^{2}) has suggested which describes fairly well the available experimental data on the reduced cross section [25]. This parameterization provides reliable structure function F2(x,Q2)subscript𝐹2𝑥superscript𝑄2F_{2}(x,Q^{2}) according to HERA data at low x𝑥x in a wide range of the momentum transfer (1GeV2<Q2<3000GeV2)1superscriptGeV2superscript𝑄23000superscriptGeV2(1~{}\mathrm{GeV}^{2}<Q^{2}<3000~{}\mathrm{GeV}^{2}) as

F2(x,Q2)subscript𝐹2𝑥superscript𝑄2\displaystyle F_{2}(x,Q^{2}) =\displaystyle= D(Q2)(1x)nm=02Am(Q2)Lm,𝐷superscript𝑄2superscript1𝑥𝑛superscriptsubscript𝑚02subscript𝐴𝑚superscript𝑄2superscript𝐿𝑚\displaystyle D(Q^{2})(1-x)^{n}\sum_{m=0}^{2}A_{m}(Q^{2})L^{m}, (6)

and can be applied as well in analyses of ultra-high energy processes with cosmic neutrinos. In a new method, the linear behavior of the gluon density in the CDM parameters is investigated in Ref.[26]. Now we consider the non-linear behavior of the gluon density for the CDM bounds. The nonlinear effects of the gluon-gluon fusion due to the high gluon density at small x𝑥x is considered in Gribov-Levin-Ryskin-Mueller-Qiu (GLR-MQ) [12]. Some studies of the GLR-MQ equation in the framework of the extracting the gluon distribution function have been discussed considerably over the past years [27-33]. The GLR-MQ equation can be written in standard form [34]

G(x,Q2)lnQ2𝐺𝑥superscript𝑄2superscript𝑄2\displaystyle\frac{\partial{G(x,Q^{2})}}{\partial{\ln}Q^{2}} =\displaystyle= G(x,Q2)lnQ2|DGLAPevaluated-at𝐺𝑥superscript𝑄2superscript𝑄2𝐷𝐺𝐿𝐴𝑃\displaystyle\frac{\partial{G(x,Q^{2})}}{\partial{\ln}Q^{2}}|_{DGLAP} (7)
8116αs2(Q2)2Q2χ1dzzG2(xz,Q2),8116subscriptsuperscript𝛼2𝑠superscript𝑄2superscript2superscript𝑄2superscriptsubscript𝜒1𝑑𝑧𝑧superscript𝐺2𝑥𝑧superscript𝑄2\displaystyle-\frac{81}{16}\frac{\alpha^{2}_{s}(Q^{2})}{\mathcal{R}^{2}Q^{2}}\int_{\chi}^{1}\frac{dz}{z}G^{2}(\frac{x}{z},Q^{2}),

where χ=xx0𝜒𝑥subscript𝑥0\chi=\frac{x}{x_{0}} and x0subscript𝑥0x_{0} is the boundary condition that the gluon distribution joints smoothly onto the linear region. The correlation length \mathcal{R} determines the size of the nonlinear terms. This value depends on how the gluon ladders are coupled to the nucleon or on how the gluons are distributed within the nucleon. The \mathcal{R} is approximately equal to 5GeV1similar-to-or-equalsabsent5superscriptGeV1\simeq 5~{}\mathrm{GeV}^{-1} if the gluons are populated across the proton and it is equal to 2GeV1similar-to-or-equalsabsent2superscriptGeV1\simeq 2~{}\mathrm{GeV}^{-1} if the gluons have hotspot like structure. By solving GLR-MQ (Eq.7), we obtain an expression for the nonlinear gluon distribution function (i.e., GNL(x,Q2)superscript𝐺𝑁𝐿𝑥superscript𝑄2G^{NL}(x,Q^{2}) ) as

GNL(x,Q2)superscript𝐺NL𝑥superscript𝑄2\displaystyle G^{\mathrm{NL}}(x,Q^{2}) =\displaystyle= GNL(x,Q02)+G(x,Q2)G(x,Q02)superscript𝐺NL𝑥superscriptsubscript𝑄02𝐺𝑥superscript𝑄2𝐺𝑥superscriptsubscript𝑄02\displaystyle G^{\mathrm{NL}}(x,Q_{0}^{2})+G(x,Q^{2})-G(x,Q_{0}^{2})
Q02Q28116αs2(Q2)2Q2χ1dzzG2(xz,Q2)dlnQ2superscriptsubscriptsuperscriptsubscript𝑄02superscript𝑄28116subscriptsuperscript𝛼2𝑠superscript𝑄2superscript2superscript𝑄2superscriptsubscript𝜒1𝑑𝑧𝑧superscript𝐺2𝑥𝑧superscript𝑄2𝑑superscript𝑄2\displaystyle-\int_{Q_{0}^{2}}^{Q^{2}}\frac{81}{16}\frac{\alpha^{2}_{s}(Q^{2})}{\mathcal{R}^{2}Q^{2}}\int_{\chi}^{1}\frac{dz}{z}G^{2}(\frac{x}{z},Q^{2})d{\ln}Q^{2}

We note that at xx0(=102)𝑥annotatedsubscript𝑥0absentsuperscript102x{\geq}x_{0}(=10^{-2}) the linear and nonlinear gluon distribution behaviors are equal. At Q02superscriptsubscript𝑄02Q_{0}^{2} the low x𝑥x behavior of the nonlinear gluon distribution is assumed to be [35]

GNL(x,Q02)superscript𝐺NL𝑥superscriptsubscript𝑄02\displaystyle G^{\mathrm{NL}}(x,Q_{0}^{2}) =\displaystyle= G(x,Q02){1+27παs(Q02)162Q02θ(x0x)\displaystyle G(x,Q_{0}^{2})\{1+\frac{27\pi{\alpha_{s}(Q_{0}^{2})}}{16\mathcal{R}^{2}Q_{0}^{2}}\theta(x_{0}-x) (9)
×[G(x,Q02)G(x0,Q02)]}1.\displaystyle{\times}[G(x,Q_{0}^{2})-G(x_{0},Q_{0}^{2})]\}^{-1}.

Substituting Eqs.(6) and (8) in Eq.(5) the nonlinear behavior of the ρ𝜌\rho parameter becomes

ρNL(x,Q2)=27π20αs(Q2)F2(x,Q2)(i.e.,Eq.(6))GNL(x,Q2)(i.e.,Eq.8)12\displaystyle\rho^{\mathrm{NL}}(x,Q^{2})=\frac{27\pi}{20\alpha_{s}(Q^{2})}\frac{F_{2}(x,Q^{2})(i.e.,Eq.(6))}{G^{\mathrm{NL}}(x,Q^{2})(i.e.,Eq.8)}-\frac{1}{2} (10)

Next we define the nonlinear behavior of the longitudinal-to-transverse cross sections and the structure functions by the following forms respectively

RNL(W2,Q2)=12ρNL(W2,Q2),superscript𝑅NLsuperscript𝑊2superscript𝑄212superscript𝜌NLsuperscript𝑊2superscript𝑄2\displaystyle R^{\mathrm{NL}}(W^{2},Q^{2})=\frac{1}{2\rho^{\mathrm{NL}}(W^{2},Q^{2})}, (11)

and

FL/2NL(W2,Q2)FL(W2,Q2)F2(W2,Q2)=11+2ρNL(W2,Q2)superscriptsubscript𝐹𝐿2NLsuperscript𝑊2superscript𝑄2subscript𝐹𝐿superscript𝑊2superscript𝑄2subscript𝐹2superscript𝑊2superscript𝑄2112superscript𝜌NLsuperscript𝑊2superscript𝑄2\displaystyle F_{L/2}^{\mathrm{NL}}(W^{2},Q^{2}){\equiv}\frac{F_{L}(W^{2},Q^{2})}{F_{2}(W^{2},Q^{2})}=\frac{1}{1+2\rho^{\mathrm{NL}}(W^{2},Q^{2})} (12)

If we rewrite the reduced cross section in terms of the nonlinear behavior of the ratio of the structure functions, then the nonlinear behavior of the reduced cross section at low Q2superscript𝑄2Q^{2} reads

σrNL(W2,Q2)superscriptsubscript𝜎𝑟NLsuperscript𝑊2superscript𝑄2\displaystyle\sigma_{r}^{\mathrm{NL}}(W^{2},Q^{2}) =\displaystyle= F2(W2,Q2)[1y21+(1y)2\displaystyle F_{2}(W^{2},Q^{2})[1-\frac{y^{2}}{1+(1-y)^{2}} (13)
×11+2ρNL(W2,Q2)].\displaystyle{\times}\frac{1}{1+2\rho^{\mathrm{NL}}(W^{2},Q^{2})}].

Here W2sysimilar-to-or-equalssuperscript𝑊2𝑠𝑦W^{2}{\simeq}sy which the inelasticity y𝑦y is related to Q2superscript𝑄2Q^{2}, x𝑥x and the center-of-mass energy squared, s=4EeEp𝑠4subscript𝐸𝑒subscript𝐸𝑝s=4E_{e}E_{p}, by y=Q2/sx𝑦superscript𝑄2𝑠𝑥y=Q^{2}/sx.
In the following we consider the deeply inelastic structure functions at low Q2superscript𝑄2Q^{2} using the higher-twist (HT) corrections in QCD. Using this effect in the parameterization of the proton structure function is expected to provide better results for the reduced cross section than the experimental data. The higher-twist corrections arise from the struck proton,s interaction with target remnants where reflecting confinement [36-40]. The phenomenological power correction to the structure function from the HT corrections is considered by the following form

F2HT(x,Q2)=F2Parameterization(x,Q2)(1+CHT(x)Q2)superscriptsubscript𝐹2HT𝑥superscript𝑄2superscriptsubscript𝐹2Parameterization𝑥superscript𝑄21subscript𝐶𝐻𝑇𝑥superscript𝑄2\displaystyle F_{2}^{\mathrm{HT}}(x,Q^{2})=F_{2}^{\mathrm{Parameterization}}(x,Q^{2})(1+\frac{C_{HT}(x)}{Q^{2}}) (14)

which the coefficient function CHT(x)subscript𝐶𝐻𝑇𝑥C_{HT}(x) is determined from fit to the data. In some references [37-41] this quantity is set to be an free parameter as CHT=0.12±0.07GeV2subscript𝐶𝐻𝑇plus-or-minus0.120.07superscriptGeV2C_{HT}=0.12~{}\pm~{}0.07~{}\mathrm{GeV}^{2} and in others [42,43] it depends on x𝑥x as

CHT(x)=h0(h2(x)xh1+γ).subscript𝐶𝐻𝑇𝑥subscript0subscript2𝑥superscript𝑥subscript1𝛾\displaystyle C_{HT}(x)=h_{0}(h_{2}(x)x^{h_{1}}+\gamma).

In Refs.[42,43] this fit parameterization is obtained from the QCD analysis with the HT corrections included.
Therefore it is clear from Eqs.(13) and (14) that at low Q2superscript𝑄2Q^{2}, we can add the HT corrections and our solution takes the form

σrNL+HT(W2,Q2)superscriptsubscript𝜎𝑟NLHTsuperscript𝑊2superscript𝑄2\displaystyle\sigma_{r}^{\mathrm{NL+HT}}(W^{2},Q^{2}) =\displaystyle= F2HT(W2,Q2)[1y21+(1y)2\displaystyle F_{2}^{\mathrm{HT}}(W^{2},Q^{2})[1-\frac{y^{2}}{1+(1-y)^{2}} (15)
×11+2ρNL+HT(W2,Q2)],\displaystyle{\times}\frac{1}{1+2\rho^{\mathrm{NL+HT}}(W^{2},Q^{2})}],

with

ρNL+HT(x,Q2)=27π20αs(Q2)F2HT(x,Q2)GNL(x,Q2)12.superscript𝜌NLHT𝑥superscript𝑄227𝜋20subscript𝛼𝑠superscript𝑄2superscriptsubscript𝐹2HT𝑥superscript𝑄2superscript𝐺NL𝑥superscript𝑄212\displaystyle\rho^{\mathrm{NL+HT}}(x,Q^{2})=\frac{27\pi}{20\alpha_{s}(Q^{2})}\frac{F_{2}^{\mathrm{HT}}(x,Q^{2})}{G^{\mathrm{NL}}(x,Q^{2})}-\frac{1}{2}. (16)

.3 3. Results and discussions

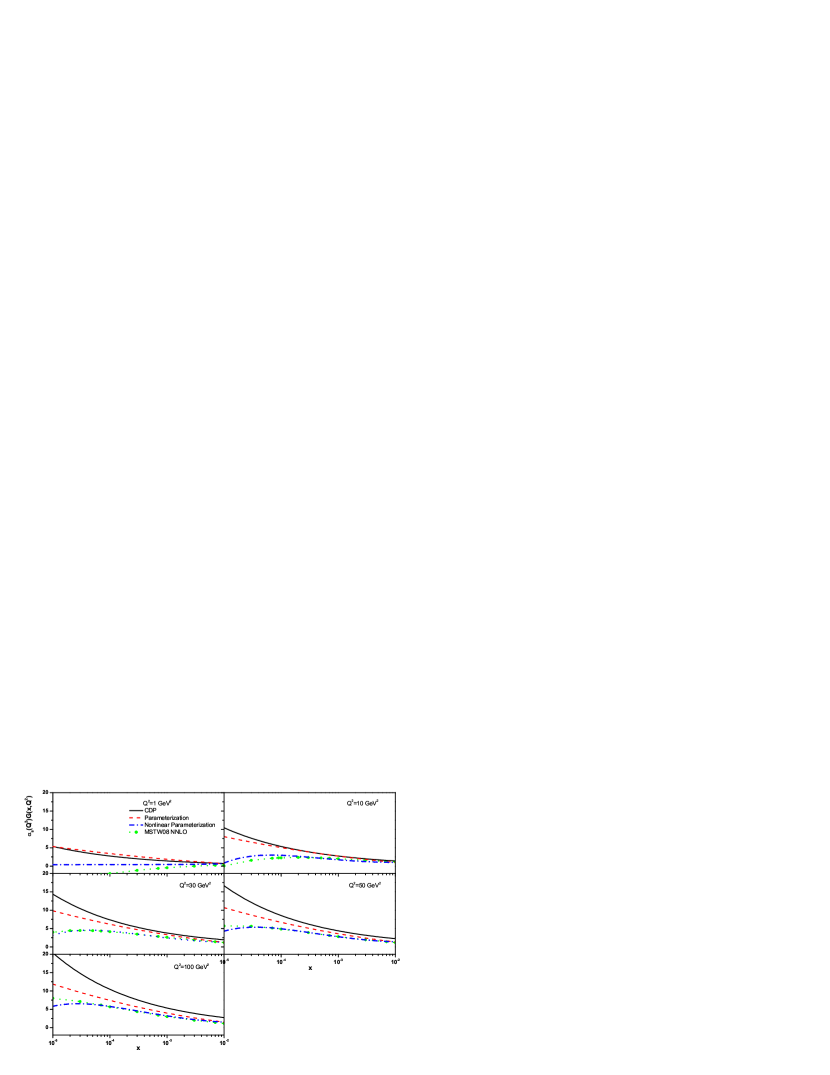
In this paper, we obtain the nonlinear gluon distribution function solving the GLR-MQ evolution equation for gluon density. The analysis is performed in the range 105x102superscript105𝑥superscript10210^{-5}{\leq}x{\leq}10^{-2} and 1Q2100GeV21superscript𝑄2100superscriptGeV21{\leq}Q^{2}{\leq}100~{}\mathrm{GeV}^{2}. The computed results of nonlinear gluon distribution function are compared with the CDP model [5] (Kuroda and Schildknecht, Phys.Rev.D85, 094001(2011)) and the parameterization model [25] in Fig.1. According to Fig.7 in Ref.[5] (Kuroda and Schildknecht, Phys.Rev.D85, 094001(2011)), there is a considerable agreement to the results from the CETQ [44] and MSTW [45] collaborations. The nonlinear gluon distribution behavior is comparable with MSTW08 NNLO [46] at Q2>1GeV2superscript𝑄21superscriptGeV2Q^{2}>1~{}\mathrm{GeV}^{2}.
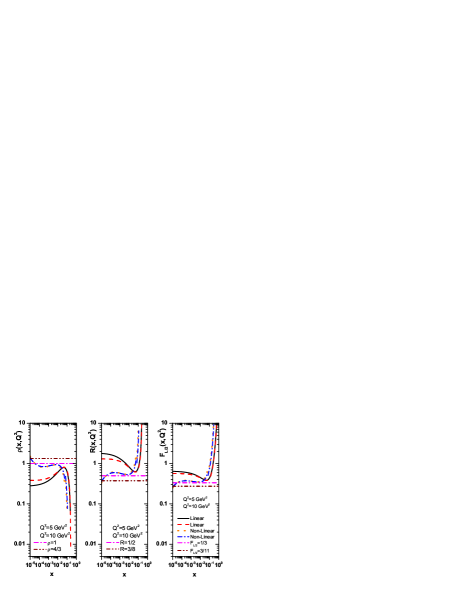
In the following, the parameters and bounds with respect to the nonlinear gluon distribution behavior can be examined. With the obtained ρ𝜌\rho parameter, we calculate the ratio of structure functions and also the reduced cross sections with respect to the nonlinear and higher twist corrections. These functions are obtained at low x𝑥x and Q2superscript𝑄2Q^{2} values by taking an appropriate input parton distribution. In Fig.2, the parameters ρ𝜌\rho, R𝑅R and FL/2subscript𝐹𝐿2F_{L/2} are obtained with respect to the nonlinear behavior of the gluon distribution function. In the following we have investigated the effect of nonlinearity in our results in the hot-spot point. The value of this parameter is defined to be R=2GeV1𝑅2superscriptGeV1R=2~{}\mathrm{GeV}^{-1} in this work. In Fig.2 we shown that the nonlinear results are much closer to the color dipole bounds than the linear ones. The comparison is for Q2=5GeV2superscript𝑄25superscriptGeV2Q^{2}=5~{}\mathrm{GeV}^{2} and Q2=10GeV2superscript𝑄210superscriptGeV2Q^{2}=10~{}\mathrm{GeV}^{2}. The fluctuations corresponding to the parameters (i.e., ρ𝜌\rho, R𝑅R and FL/2subscript𝐹𝐿2F_{L/2}) in comparison with constant CDM bounds are due to the parameterization of the 
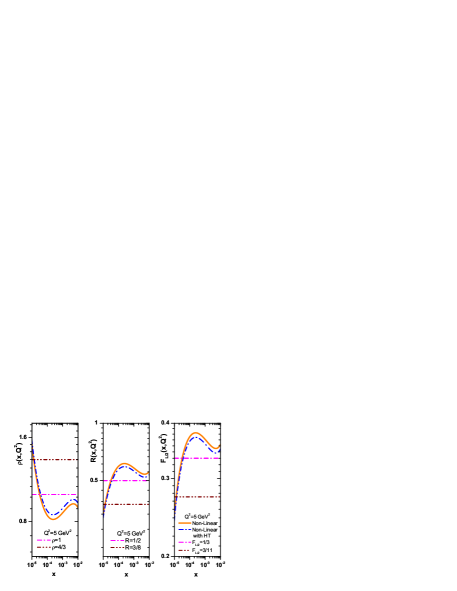
PDFs. By adding the effect of the HT corrections on the parameters, we showed that the results have a behavior comparable to the CDM bounds. In Fig.3, a comparison for Q2=5GeV2superscript𝑄25superscriptGeV2Q^{2}=5~{}\mathrm{GeV}^{2} has been made between the nonlinear and nonlinear+higer twist (NL+HT) corrections to the parameters. In the following we will apply these corrections (i.e., NL+HT) to all results. As can be observe in Fig.4, the ratio of the structure functions are comparable to the H1 data [47] and CDM bounds [3,4,48] not only at large Q2superscript𝑄2Q^{2} but also at low Q2superscript𝑄2Q^{2} values. Indeed, the transition from the linear to nonlinear is done due to the nonlinear corrections to the gluon distribution function. Compared to other results and models, we see that the ratio FL/F2subscript𝐹𝐿subscript𝐹2F_{L}/F_{2} is in fact comparable to the results of others [10,49] and experimental data. This comparison is very good at low and high-Q2superscript𝑄2Q^{2} values, even compared to other models such as Golec-Biernat-Wu¨¨u\mathrm{\ddot{u}}sthoff (GBW)[10] and Iancu-Itakura-Munier (IIM) [49] parameterizations. The nonlinear 
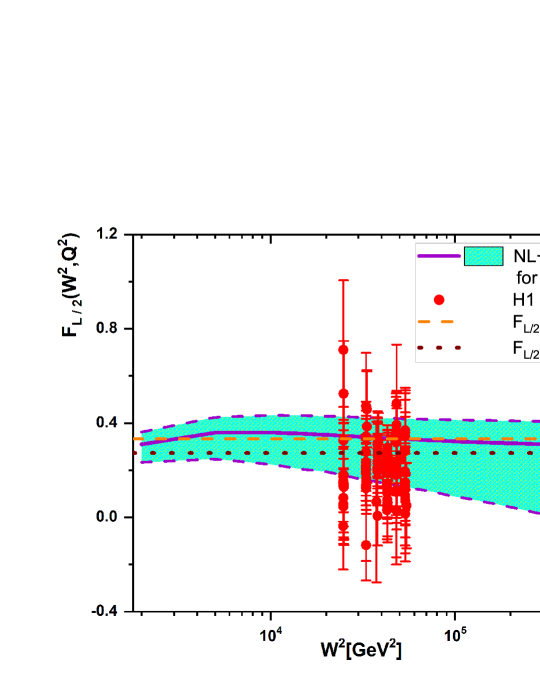
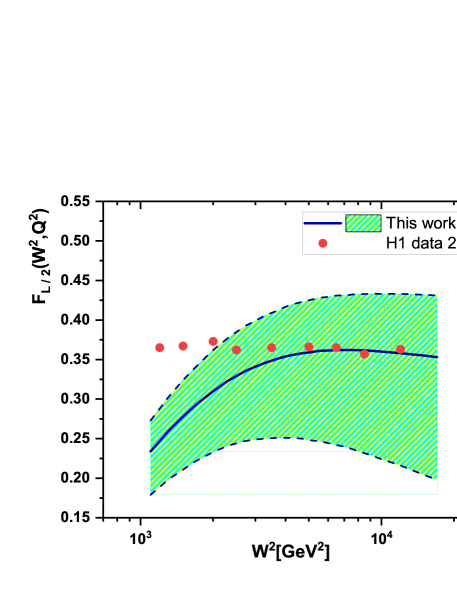
behavior of the ratio of structure functions at low Q2superscript𝑄2Q^{2} in Fig.5 is observable in comparison with the H1 data [41]. In Fig.5, data collected in the region of low momentum transfers, 0.2GeV2Q212GeV20.2superscriptGeV2superscript𝑄212superscriptGeV20.2~{}\mathrm{GeV}^{2}{\leq}Q^{2}{\leq}12~{}\mathrm{GeV}^{2}, and low Bjorken x𝑥x, 106x0.02less-than-or-similar-tosuperscript106𝑥less-than-or-similar-to0.0210^{-6}{\lesssim}~{}x~{}{\lesssim}0.02 with center-of-mass energy s=319GeV𝑠319GeV\sqrt{s}=319~{}\mathrm{GeV}. In Ref.[41] the structure functions of F2subscript𝐹2F_{2} and FLsubscript𝐹𝐿F_{L} collected without the total errors. Tables 17 and 18 in this reference shown that FLthsubscriptsuperscript𝐹𝑡𝐿F^{th}_{L} represents the structure function FLsubscript𝐹𝐿F_{L} used for the center-of-mass energy (CME) correction and to calculate the structure function F2subscript𝐹2F_{2}. Therefore we compared our results at x=0.001𝑥0.001x{=}0.001 in a wide range of W2superscript𝑊2W^{2} between 103GeV2superscript103superscriptGeV210^{3}~{}\mathrm{GeV}^{2} and 104GeV2superscript104superscriptGeV210^{4}~{}\mathrm{GeV}^{2} with the ratio of structure functions (i.e., H1 2009 [41]) without the total uncertainties in Fig.5.
In the following we use the NL+HT behavior of the ratio FL/F2subscript𝐹𝐿subscript𝐹2F_{L}/F_{2} to calculate the reduced cross section. In Ref.[41] the H1 collaboration reported the DIS cross sections at low Q2superscript𝑄2Q^{2}. The DIS data collected based on the SVX, NVX-BST and NVX-S9 analysis [41]. We use the SVX data at Q2=2GeV2superscript𝑄22superscriptGeV2Q^{2}=2~{}\mathrm{GeV}^{2}, the NVX-BST and NVX-S9 data at Q2=5GeV2superscript𝑄25superscriptGeV2Q^{2}=5~{}\mathrm{GeV}^{2} and the NVX-BST data at Q2=12GeV2superscript𝑄212superscriptGeV2Q^{2}=12~{}\mathrm{GeV}^{2}. The cross section data due to the NL+HT effects at three values of Q2superscript𝑄2Q^{2} are given in Table I, and compared with the H1 data [41] measured from the SVX and NVX data. Here we discuss the χ2superscript𝜒2\chi^{2} method for comparison according to the number of points at any Q2superscript𝑄2Q^{2} values. The χ2superscript𝜒2\chi^{2} can be defined as

χ2=iNdata(Xdata,iXmethod,i)2/(δXi)2,superscript𝜒2superscriptsubscript𝑖subscript𝑁datasuperscriptsubscript𝑋data𝑖subscript𝑋method𝑖2superscript𝛿subscript𝑋𝑖2\displaystyle\chi^{2}=\Huge{\sum_{i}^{N_{\mathrm{data}}}}(X_{\mathrm{data},i}-X_{\mathrm{method},i})^{2}/(\delta{X}_{i})^{2}, (17)

where i𝑖i runs all the data points, δXi𝛿subscript𝑋𝑖\delta{X}_{i} can be the total experimental uncertainties. The χ2/Ndatasuperscript𝜒2subscript𝑁𝑑𝑎𝑡𝑎\chi^{2}/N_{data} can quantify the agreement between the data and our predictions. The χ2/Ndatasuperscript𝜒2subscript𝑁𝑑𝑎𝑡𝑎\chi^{2}/N_{data} computed at different values of Q2superscript𝑄2Q^{2} is in 
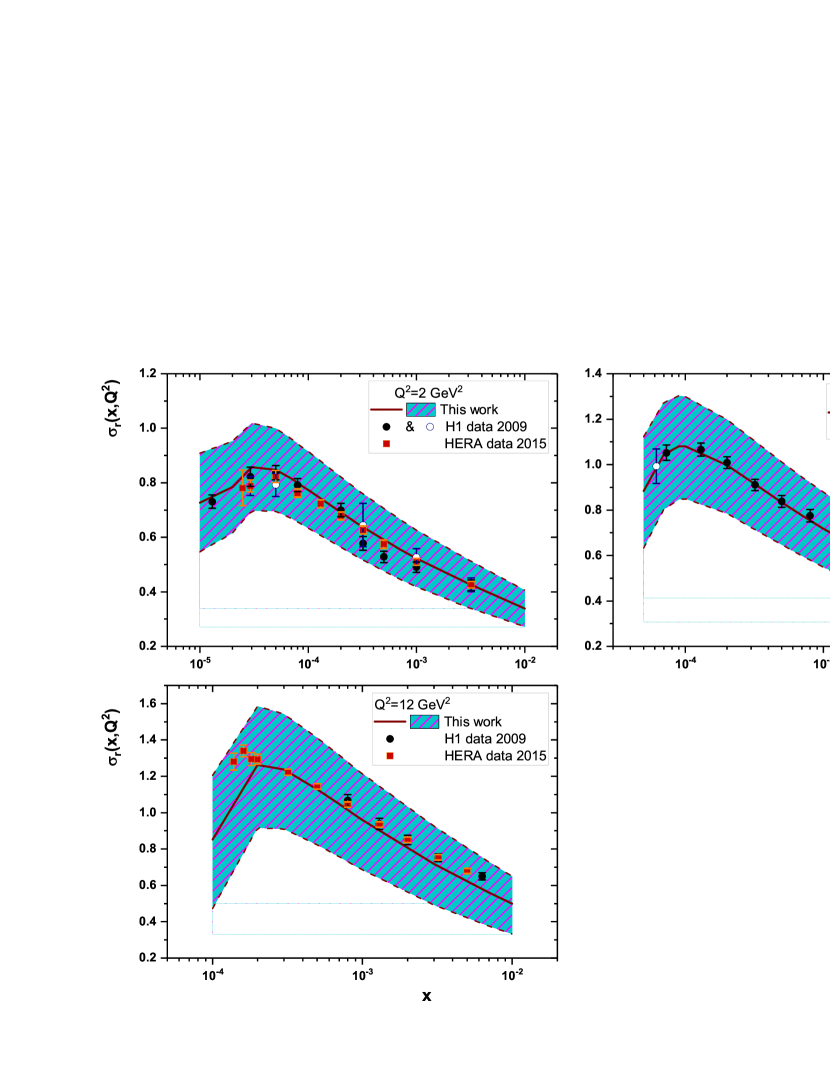
Table II. The results are plotted in Fig.6. In this figure, together with the H1 data [41], we plot the x𝑥x dependence of the reduced cross section σr(x,Q2)subscript𝜎𝑟𝑥superscript𝑄2\sigma_{r}(x,Q^{2}) computed with respect to the nonlinear and higher-twist effects for fixed values of Q2superscript𝑄2Q^{2}. The error bands are in accordance with the statistical errors of the parameterization of F2subscript𝐹2F_{2} and the errors bares are quoted in %percent\% relative to σrsubscript𝜎𝑟\sigma_{r}. The agreement of these results with the H1 data are excellent for x<0.01𝑥0.01x<0.01. We also compare these results with the HERA data [50] (which combines H1 and ZEUS data) in Fig.6 at Q2superscript𝑄2Q^{2} values of 222 and 12GeV212superscriptGeV212~{}\mathrm{GeV}^{2}. This includes data taken with proton beam energies of Ep=920GeVsubscript𝐸𝑝920GeVE_{p}=920~{}\mathrm{GeV} corresponding to the center-of-mass energy s=318GeV𝑠318GeV\sqrt{s}=318~{}\mathrm{GeV}. Therefore, the results of the current paper in the region of smallest x𝑥x and Q2superscript𝑄2Q^{2} studies can confirm the nonlinear corrections to the small-x𝑥x gluon distributions for transition.

.4 4. Summary

In conclusion, we have studied the effects of adding the nonlinear corrections to the gluon density for transition from the linear to the nonlinear regions. We use the parameterization of F2(x,Q2)subscript𝐹2𝑥superscript𝑄2F_{2}(x,Q^{2}) as a baseline. This analysis is also enriched with the higher twist (HT) contributions to the proton structure function at small values of Q2superscript𝑄2Q^{2}. The nonlinear and higher twist corrections to the ratio of structure functions and also to the reduced cross sections are considered. Comparing these parameters with the CDM bounds indicate that the NL+HT effects are enriched the behavior at low Q2superscript𝑄2Q^{2}. The transition of the ratio FL/2subscript𝐹𝐿2F_{L/2} from the linear to the nonlinear behavior is considered and shown that it is in good agreement with the CDM bounds non only at high-Q2superscript𝑄2Q^{2} but also at low-Q2superscript𝑄2Q^{2} values. Comparison of the reduced cross sections with respect to the nonlinear and higher twist corrections with HERA data at low and moderate Q2superscript𝑄2Q^{2} values shows that this transition has been done with good accuracy in comparison with the HERA data.

.5 ACKNOWLEDGMENTS

Authors are grateful the Razi University for financial support of this project. G.R.Boroun is especially grateful to D.Schildknecht for carefully reading the manuscript and fruitful discussions.

I References

1. J.J.Sakurai and D.Schildknecht, Phys.Lett.B40, 121(1972); B.Gorczyca and D.Schildknecht, Phys.Lett.B47, 71(1973).
2. N.N.Nikolaev and B.G.Zakharov, Z.Phys.C49, 607(1991); Z.Phys.C53, 331(1992); A.H.Mueller, Nucl.Phys.B415, 373(1994); K.Golec-Biernat and M.Wu¨¨u\mathrm{\ddot{u}}sthoff, Phys.Rev.D59, 014017(1998); H.Kowalski, L.Motyka and G.Watt, Phys.Rev.D74, 074016(2006); B.Sambasivam, T.Toll and T.Ullrich; Phys.Lett.B803, 135277(2020); G.M.Peccini, F.Kopp, M.V.T.Machado and D.A.Fagundes, Phys.Rev.D101, 074042 (2020).
3. M.Kuroda and D.Schildknecht, Phys.Lett. B618, 84(2005); M.Kuroda and D.Schildknecht, Phys.Rev. D96, 094013(2017); D.Schildknecht, B.Surrow and M.Tentynkov, Eur.Phys.J.C20, 77(2001); M.Kuroda and D.Schildknecht, International Journal of Modern Physics A31, No. 30, 1650157 (2016).
4. D.Schildknecht, Nuclear Physics B Proceedings Supplement 146, 211 (2005) ; Nuclear Physics B Proceedings Supplement 00, 1 (2012); F.Schrempp and A.Utermann, Acta Phys.Polon.B33, 3633(2002).
5. M.Kuroda and D.Schildknecht, Phys.Lett. B670, 129(2008); M.Kuroda and D.Schildknecht, Phys.Rev.D85, 094001(2011).
6. D.Boer et al., arXiv: [nucl-th]1108.1713.
7. J.Abelleira Fernandez et al., [LHeC Study Group Collaboration], J.Phys.G39, 075001(2012); A. Abada et al., [FCC Study Group Collaboration], Eur.Phys.J.C79, 474(2019).
8. P.Agostini et al. [LHeC Collaboration and FCC-he Study Group ], CERN-ACC-Note-2020-0002, arXiv:2007.14491 [hep-ex] (2020).
9. H.Kowalski and D.Teaney, Phys.Rev.D68, 114005(2003); G.Watt and H.Kowalski, Phys.Rev.D78, 014016(2008).
10. J.Bartels, K.Golec-Biernat and H.Kowalski, Phys.Rev.D66, 014001(2002); K.Golec-Biernat and M.Wu¨¨u\mathrm{\ddot{u}}sthoff, Phys.Rev.D60, 114023(1999); K.Golec-Biernat and S.Sapeta, J.High Energ.Phys.03, 102(2018).
11. M.Klein, arXiv [hep-ph]:1802.04317; M.Klein, Ann.Phys.528, 138(2016); N.Armesto et al., Phys.Rev.D100, 074022(2019).
12. L.V.Gribov, E.M.Levin and M.G.Ryskin, Phys.Rept.100, 1(1983); A.H.Mueller and J.w.Qiu, Nucl.Phys.B268, 427(1986).
13. M.R.Pelicer et al., Eur.Phys.J.C79, 9(2019).
14. A.D.Martin, R.G.Roberts, W.J.Stirling and R.S.Thorne, Eur.Phys.J.C23, 73(2002); Phys.Lett.B531, 216(2002).
15. J.Pumplin et al., J.High Energ.Phys.07, 012(2002).
16. W.Zhu, J.Ruan, J.Yang and Z.Shen, Phys.rev.D68, 094015(2003).
17. I.Balitsky, Nucl.Phys.B463, 99(1996); Y.V.Kovchegov, phys.Rev.D60, 034008(1999).
18. J.Jalilian-Marian, A.Kovner, a.Leonidov and H.Weigert, Nucl.Phys.B504, 415(1997); Phys.Rev.D59, 014014(1998); E.Iancu, A.Leonidov and L.D.McLerran, Nucl.Phys.A692, 583(2001); Nucl.Phys.A703, 489(2002).
19. A.H.Rezaeian et al., Phys.Rev.D87, 034002(2013).
20. I.I.Balitsky and A.V.Belitsky, Nucl.Phys.B629, 290(2002).
21. V. Barone et al., Phys.Lett.B326, 161(1994).
22. M. Sadzikowski, L. Motyka and W. Slominski, arXiv [hep-ph]:1206.1732 (2012).
23. M.B.Gay Ducati, E.G.de Oliveira and J.T.de Santana Amaral, arXiv [hep-ph]:1209.5354 (2012).
24. I.P.Ivanov et al., XXXII International Symposium on Multiparticle Dynamics, pp. 169-176 (2003); K.Tywoniuk, Journal of Physics: Conference Series270, 012054 (2011).
25. M. M. Block, L. Durand and P. Ha, Phys. Rev.D89, no. 9, 094027 (2014).
26. G.R. Boroun, arXiv:2102.04867 (2021).
27. M.Devee and J.K.Sarma, Eur.Phys.J.C74, 2751(2014); Nucl.Phys.B885, 571(2014); P.Phukan, M.Lalung and J.K.Sarma, Nucl.Phys.A968, 275(2017); M.Lalung, P.Phukan and J.K.Sarma, Nucl.Phys.A 992, 121615(2019); M.Devee, arXiv:1808.00899 [hep-ph] (2018); P.Gilvana and S.K.Werner, arXiv:1804.10659 [hep-ph] (2018).
28. G.R.Boroun, Eur.Phys.J.A42, 251(2009).
29. G.R.Boroun, Phys.Rev.C97, 015206(2018).
30. B.Rezaei and G.R.Boroun, Phys.Rev.C101, 045202(2020).
31. B.Rezaei and G.R.Boroun, Eur.Phys.J.A56, 262(2020).
32. G.R.Boroun and S.Zarrin, Eur.Phys.J.Plus128, 119(2013).
33. G.R.Boroun and B.Rezaei, Nucl.Phys.A1006, 122062 (2021).
34. K.Prytz, Eur.Phys.J.C22, 317(2001); K.J.Eskola et al., Nucl.Phys.B660, 211(2003); M.A Kimber, J.Kwiecinski and A.D.Martin, Phys.Lett.B508, 58(2001).
35. A.D.Martin et al., Phys.Rev.D47, 867(1993); J.Kwiecinski, A.D.Martin and P.J.Sutton, Phys.Rev.D44, 2640(1991); A.J.Askew, J.Kwiecinski, A.D.Martin and P.J.Sutton, Phys.Rev.D47, 3775(1993).
36. B.Badelek et al., J.Phys.G22, 815(1996); S. Catani and F. Hautmann, Nucl.Phys.B427, 475(1994); J.Blumlein and H.Bottcher, arXiv[hep-ph]:0807.0248(2008).
37. A.M.Cooper-Sarkar et al., arXiv:1605.08577v1 [hep-ph] 27 May 2016.
38. I.Abt et.al., Phys.Rev.D94, 034032(2016).
39. G.R.Boroun and B.Rezaei, Phys.Lett.B816, 136274 (2021).
40. G.R.Boroun and B.Rezaei, Nucl.Phys.A990, 244(2019).
41. F.D. Aaron et al. [H1 Collaboration], Eur.Phys.J. C63, 625(2009).
42. H.Khanpour, A.Mirjalili and S.Atashbar Tehrani, Phys.Rev.C95, 035201 (2017).
43. H.Khanpour, Phys.Rev.D99, 054007(2019).
44. J. Pumplin et al., [CTEQ Collaboration] JHEP0207, 012(2002).
45. A.D. Martin et al., Eur. Phys. J. C18, 117(2000).
46. A.D. Martin et al., Eur. Phys. J. C63, 189(2009).
47. V.Andreev et al. [H1 Collaboration], Eur.Phys.J.C74, 2814(2014).
48. C.Ewerz, A.von Manteuffel and O.Nachtmann, JHEP03, 102(2010); D.Britzger et al., Phys.Rev.D100, 114007 (2019); C.Ewerz, A. von Manteuffel and O.Nachtmann, Phys.Rev.D77, 074022(2008); C.Ewerz and O.Nachtmann, Phys.Lett.B648, 279 (2007).
49. E.Iancu,K.Itakura and S.Munier, Phys.Lett.B590, 199(2004); M.Niedziela and M.Praszalowicz, Acta Physica Polonica B46, 2018(2015).
50. H.Abramowicz et al., [H1 and ZEUS Collaborations], Eur.Phys.J.C75, 580(2015).

Refer to caption
Figure 1: The nonlinear gluon distribution function at R=2GeV1𝑅2superscriptGeV1R=2~{}\mathrm{GeV}^{-1} compared with the gluon distributions from the CDP model [5] (Kuroda and Schildknecht, Phys.Rev.D85, 094001(2011)), the parameterization model [25] and MSTW08 NNLO [46].
Refer to caption
Figure 2: Results of the parameters (a):ρ(x,Q2),(b):R(x,Q2):𝑎𝜌𝑥superscript𝑄2𝑏:𝑅𝑥superscript𝑄2(a):~{}\rho(x,Q^{2}),~{}(b):~{}R(x,Q^{2}) and (c):FL/2(x,Q2):𝑐subscript𝐹𝐿2𝑥superscript𝑄2(c):~{}F_{L/2}(x,Q^{2}) obtained from the linear and nonlinear corrections at fixed Q2superscript𝑄2Q^{2} values (Q2=5GeV2superscript𝑄25superscriptGeV2Q^{2}=5~{}\mathrm{GeV}^{2},Black-linear and Orange-nonlinear; Q2=10GeV2superscript𝑄210superscriptGeV2Q^{2}=10~{}\mathrm{GeV}^{2},Red-linear and Blue-nonlinear ) respectively. The parameters compared with the CDP bounds in (a)::𝑎absent(a): ρ=1𝜌1\rho=1 and 4/3434/3, in (b)::𝑏absent(b): R=1/2𝑅12R=1/2 and 3/8383/8 and in (c)::𝑐absent(c): FL/2=1/3subscript𝐹𝐿213F_{L/2}=1/3 and 3/113113/11 respectively.
Refer to caption
Figure 3: Comparison of the nonlinear behavior of the parameters (a):ρ(x,Q2),(b):R(x,Q2):𝑎𝜌𝑥superscript𝑄2𝑏:𝑅𝑥superscript𝑄2(a):~{}\rho(x,Q^{2}),~{}(b):~{}R(x,Q^{2}) and (c):FL/2(x,Q2):𝑐subscript𝐹𝐿2𝑥superscript𝑄2(c):~{}F_{L/2}(x,Q^{2}) with the higher-twist corrections at Q2=5GeV2superscript𝑄25superscriptGeV2Q^{2}=5~{}\mathrm{GeV}^{2}. The parameters compared with the CDP bounds in (a)::𝑎absent(a): ρ=1𝜌1\rho=1 and 4/3434/3, in (b)::𝑏absent(b): R=1/2𝑅12R=1/2 and 3/8383/8 and in (c)::𝑐absent(c): FL/2=1/3subscript𝐹𝐿213F_{L/2}=1/3 and 3/113113/11 respectively.
Refer to caption
Figure 4: The ratio of the longitudinal to transversal structure functions calculated due to the nonlinear and higher twist effects at fixed value of the Bjorken variable x=0.001𝑥0.001x=0.001. Experimental data are from the H1 Collaboration as accompanied with total errors [47]. The obtained values compared with the CDP bounds [3,4,48] FL/2=1/3subscript𝐹𝐿213F_{L/2}=1/3 and 3/113113/11. The error bands are due to the effective parameters in the parameterization of F2(x,Q2)subscript𝐹2𝑥superscript𝑄2F_{2}(x,Q^{2}) [25] and also the HT coefficient errors [36-40,42,43].
Refer to caption
Figure 5: Continue Fig.3 in the low Q2superscript𝑄2Q^{2} values. The ratio of the longitudinal to transversal structure functions calculated due to the nonlinear and higher twist effects at fixed value of the Bjorken variable x=0.001𝑥0.001x=0.001. Data are from the H1 Collaboration [41] without the total uncertainties at low Q2superscript𝑄2Q^{2}. The error bands are due to the effective parameters in the parameterization of F2(x,Q2)subscript𝐹2𝑥superscript𝑄2F_{2}(x,Q^{2}) [25] and also the HT coefficient errors [36-40,42,43].
Refer to caption
Figure 6: Reduced cross section σrNL+HTsubscriptsuperscript𝜎𝑁𝐿𝐻𝑇𝑟\sigma^{NL+HT}_{r} from the nonlinear behavior of the gluon distribution and the higher twist corrections to the proton structure function at low x𝑥x and Q2superscript𝑄2Q^{2} compared to the reduced cross section σrsubscript𝜎𝑟\sigma_{r} from the combined low Q2superscript𝑄2Q^{2} data [41] and also HERA combined data [50]. H1 data accompanied with total errors. H1 data represented for Q2=2GeV2superscript𝑄22superscriptGeV2Q^{2}=2~{}\mathrm{GeV}^{2} as the closed circles are SVX data, and the open circles are NVX-BST data, for Q2=5GeV2superscript𝑄25superscriptGeV2Q^{2}=5~{}\mathrm{GeV}^{2} the closed circles are NVX-BST data and the open circles are NVX-S9 data, and also for Q2=12GeV2superscript𝑄212superscriptGeV2Q^{2}=12~{}\mathrm{GeV}^{2} the closed circles are NVX-BST data [41]. The error bands are due to the effective parameters in the parameterization of F2(x,Q2)subscript𝐹2𝑥superscript𝑄2F_{2}(x,Q^{2}) [25] and also the HT coefficient errors [36-40,42,43]. This comparison with HERA combined data [50] at Q2=2superscript𝑄22Q^{2}=2 and 12GeV212superscriptGeV212~{}\mathrm{GeV}^{2} is defined.
Table 1: The reduced cross section σrsubscript𝜎𝑟\sigma_{r} determined based on the nonlinear and higher twist effects in Q2superscript𝑄2Q^{2} values 222, 555 and 12GeV212superscriptGeV212~{}\mathrm{GeV}^{2} at x<0.01𝑥0.01x<0.01. These results accompanied with the uncertainties due to the coefficient functions errors [25] and compared with the H1 data [41] as the uncertainties are quoted in %percent\% relative to σrsubscript𝜎𝑟\sigma_{r}.
Q2(GeV2)superscript𝑄2superscriptGeV2Q^{2}(\mathrm{GeV}^{2}) x𝑥x H1dataH1data\mathrm{H1}~{}\mathrm{data} σr±δ%plus-or-minussubscript𝜎𝑟percent𝛿\sigma_{r}{\pm}\delta\% σr±δplus-or-minussubscript𝜎𝑟𝛿\sigma_{r}{\pm}\delta
2 2.470E-5 NVXS9dataNVXS9data\mathrm{NVX-S9}~{}\mathrm{data} 0.756±9.23%plus-or-minus0.756percent9.230.756{\pm}9.23\% 0.8330.164+0.165subscriptsuperscript0.8330.1650.1640.833^{+0.165}_{-0.164}
2 2.928E-5 SVXdataSVXdata\mathrm{SVX}~{}\mathrm{data} 0.822±4.28%plus-or-minus0.822percent4.280.822{\pm}4.28\% 0.8550.161+0.161subscriptsuperscript0.8550.1610.1610.855^{+0.161}_{-0.161}
2 2.928E-5 NVXBSTdataNVXBSTdata\mathrm{NVX-BST}~{}\mathrm{data} 0.788±4.45%plus-or-minus0.788percent4.450.788{\pm}4.45\% 0.8550.161+0.161subscriptsuperscript0.8550.1610.1610.855^{+0.161}_{-0.161}
2 5.000E-5 SVXdataSVXdata\mathrm{SVX}~{}\mathrm{data} 0.837±3.10%plus-or-minus0.837percent3.100.837{\pm}3.10\% 0.8470.151+0.152subscriptsuperscript0.8470.1520.1510.847^{+0.152}_{-0.151}
2 5.000E-5 NVXBSTdataNVXBSTdata\mathrm{NVX-BST}~{}\mathrm{data} 0.792±5.31%plus-or-minus0.792percent5.310.792{\pm}5.31\% 0.8470.151+0.152subscriptsuperscript0.8470.1520.1510.847^{+0.152}_{-0.151}
2 8.000E-5 SVXdataSVXdata\mathrm{SVX}~{}\mathrm{data} 0.791±3.03%plus-or-minus0.791percent3.030.791{\pm}3.03\% 0.8000.143+0.144subscriptsuperscript0.8000.1440.1430.800^{+0.144}_{-0.143}
2 1.300E-4 SVXdataSVXdata\mathrm{SVX}~{}\mathrm{data} 0.731±3.28%plus-or-minus0.731percent3.280.731{\pm}3.28\% 0.7420.135+0.136subscriptsuperscript0.7420.1360.1350.742^{+0.136}_{-0.135}
2 2.000E-4 SVXdataSVXdata\mathrm{SVX}~{}\mathrm{data} 0.700±3.58%plus-or-minus0.700percent3.580.700{\pm}3.58\% 0.6910.129+0.129subscriptsuperscript0.6910.1290.1290.691^{+0.129}_{-0.129}
2 3.200E-4 SVXdataSVXdata\mathrm{SVX}~{}\mathrm{data} 0.578±4.39%plus-or-minus0.578percent4.390.578{\pm}4.39\% 0.6370.121+0.121subscriptsuperscript0.6370.1210.1210.637^{+0.121}_{-0.121}
2 3.200E-4 NVXBSTdataNVXBSTdata\mathrm{NVX-BST}~{}\mathrm{data} 0.645±12.2%plus-or-minus0.645percent12.20.645{\pm}12.2\% 0.6370.121+0.121subscriptsuperscript0.6370.1210.1210.637^{+0.121}_{-0.121}
2 5.000E-4 SVXdataSVXdata\mathrm{SVX}~{}\mathrm{data} 0.528±3.95%plus-or-minus0.528percent3.950.528{\pm}3.95\% 0.5900.115+0.116subscriptsuperscript0.5900.1160.1150.590^{+0.116}_{-0.115}
2 1.000E-3 SVXdataSVXdata\mathrm{SVX}~{}\mathrm{data} 0.490±3.79%plus-or-minus0.490percent3.790.490{\pm}3.79\% 0.5230.104+0.104subscriptsuperscript0.5230.1040.1040.523^{+0.104}_{-0.104}
2 1.000E-3 NVXBSTdataNVXBSTdata\mathrm{NVX-BST}~{}\mathrm{data} 0.527±5.93%plus-or-minus0.527percent5.930.527{\pm}5.93\% 0.5230.104+0.104subscriptsuperscript0.5230.1040.1040.523^{+0.104}_{-0.104}
2 3.200E-3 SVXdataSVXdata\mathrm{SVX}~{}\mathrm{data} 0.424±4.65%plus-or-minus0.424percent4.650.424{\pm}4.65\% 0.4250.087+0.087subscriptsuperscript0.4250.0870.0870.425^{+0.087}_{-0.087}
2 3.200E-3 NVXBSTdataNVXBSTdata\mathrm{NVX-BST}~{}\mathrm{data} 0.426±5.80%plus-or-minus0.426percent5.800.426{\pm}5.80\% 0.4250.087+0.087subscriptsuperscript0.4250.0870.0870.425^{+0.087}_{-0.087}
5 6.176E-5 NVXS9dataNVXS9data\mathrm{NVX-S9}~{}\mathrm{data} 0.933±7.70%plus-or-minus0.933percent7.700.933{\pm}7.70\% 1.0020.244+0.233subscriptsuperscript1.0020.2330.2441.002^{+0.233}_{-0.244}
5 7.320E-5 NVXBSTdataNVXBSTdata\mathrm{NVX-BST}~{}\mathrm{data} 1.052±3.26%plus-or-minus1.052percent3.261.052{\pm}3.26\% 1.0550.240+0.228subscriptsuperscript1.0550.2280.2401.055^{+0.228}_{-0.240}
5 1.300E-4 NVXBSTdataNVXBSTdata\mathrm{NVX-BST}~{}\mathrm{data} 1.066±2.72%plus-or-minus1.066percent2.721.066{\pm}2.72\% 1.0620.223+0.212subscriptsuperscript1.0620.2120.2231.062^{+0.212}_{-0.223}
5 2.000E-4 NVXBSTdataNVXBSTdata\mathrm{NVX-BST}~{}\mathrm{data} 1.009±2.62%plus-or-minus1.009percent2.621.009{\pm}2.62\% 0.9970.212+0.201subscriptsuperscript0.9970.2010.2120.997^{+0.201}_{-0.212}
5 3.200E-4 NVXBSTdataNVXBSTdata\mathrm{NVX-BST}~{}\mathrm{data} 0.911±2.79%plus-or-minus0.911percent2.790.911{\pm}2.79\% 0.9130.199+0.190subscriptsuperscript0.9130.1900.1990.913^{+0.190}_{-0.199}
5 5.000E-4 NVXBSTdataNVXBSTdata\mathrm{NVX-BST}~{}\mathrm{data} 0.838±3.11%plus-or-minus0.838percent3.110.838{\pm}3.11\% 0.8340.187+0.178subscriptsuperscript0.8340.1780.1870.834^{+0.178}_{-0.187}
5 8.000E-4 NVXBSTdataNVXBSTdata\mathrm{NVX-BST}~{}\mathrm{data} 0.775±3.50%plus-or-minus0.775percent3.500.775{\pm}3.50\% 0.7540.175+0.166subscriptsuperscript0.7540.1660.1750.754^{+0.166}_{-0.175}
5 1.300E-3 NVXBSTdataNVXBSTdata\mathrm{NVX-BST}~{}\mathrm{data} 0.686±2.91%plus-or-minus0.686percent2.910.686{\pm}2.91\% 0.6770.162+0.154subscriptsuperscript0.6770.1540.1620.677^{+0.154}_{-0.162}
5 2.000E-3 NVXBSTdataNVXBSTdata\mathrm{NVX-BST}~{}\mathrm{data} 0.636±2.84%plus-or-minus0.636percent2.840.636{\pm}2.84\% 0.6150.151+0.143subscriptsuperscript0.6150.1430.1510.615^{+0.143}_{-0.151}
5 3.980E-3 NVXBSTdataNVXBSTdata\mathrm{NVX-BST}~{}\mathrm{data} 0.569±3.18%plus-or-minus0.569percent3.180.569{\pm}3.18\% 0.5230.133+0.125subscriptsuperscript0.5230.1250.1330.523^{+0.125}_{-0.133}
12 8.000E-4 NVXBSTdataNVXBSTdata\mathrm{NVX-BST}~{}\mathrm{data} 1.067±3.05%plus-or-minus1.067percent3.051.067{\pm}3.05\% 1.0140.284+0.263subscriptsuperscript1.0140.2630.2841.014^{+0.263}_{-0.284}
12 1.300E-3 NVXBSTdataNVXBSTdata\mathrm{NVX-BST}~{}\mathrm{data} 0.938±3.31%plus-or-minus0.938percent3.310.938{\pm}3.31\% 0.8980.262+0.243subscriptsuperscript0.8980.2430.2620.898^{+0.243}_{-0.262}
12 2.000E-3 NVXBSTdataNVXBSTdata\mathrm{NVX-BST}~{}\mathrm{data} 0.850±3.00%plus-or-minus0.850percent3.000.850{\pm}3.00\% 0.8020.243+0.224subscriptsuperscript0.8020.2240.2430.802^{+0.224}_{-0.243}
12 3.200E-3 NVXBSTdataNVXBSTdata\mathrm{NVX-BST}~{}\mathrm{data} 0.752±2.98%plus-or-minus0.752percent2.980.752{\pm}2.98\% 0.7050.222+0.205subscriptsuperscript0.7050.2050.2220.705^{+0.205}_{-0.222}
12 6.310E-3 NVXBSTdataNVXBSTdata\mathrm{NVX-BST}~{}\mathrm{data} 0.650±2.89%plus-or-minus0.650percent2.890.650{\pm}2.89\% 0.5780.190+0.174subscriptsuperscript0.5780.1740.1900.578^{+0.174}_{-0.190}
Table 2: The values of χ2/Nsuperscript𝜒2𝑁\chi^{2}/N for the computed σrsubscript𝜎𝑟\sigma_{r} to the H1 data [41] in the small and moderate-Q2superscript𝑄2Q^{2} regions for x<0.01𝑥0.01x<0.01 are determined. Also the number of data points in each case is mentioned.
Q2(GeV2)superscript𝑄2superscriptGeV2Q^{2}(\mathrm{GeV}^{2}) H1dataH1data\mathrm{H1}~{}\mathrm{data} N χ2/Nsuperscript𝜒2𝑁\chi^{2}/N
NVXS9dataNVXS9data\mathrm{NVX-S9}~{}\mathrm{data}
2 NVXBSTdataNVXBSTdata\mathrm{NVX-BST}~{}\mathrm{data} 15 1.696
SVXdataSVXdata\mathrm{SVX}~{}\mathrm{data}
NVXS9dataNVXS9data\mathrm{NVX-S9}~{}\mathrm{data}
5 NVXBSTdataNVXBSTdata\mathrm{NVX-BST}~{}\mathrm{data} 10 1.021
12 NVXBSTdataNVXBSTdata\mathrm{NVX-BST}~{}\mathrm{data} 5 5.315