Active nematic defects and epithelial morphogenesis
Abstract
Inspired by recent experiments that highlight the role of nematic defects in the morphogenesis of epithelial tissues, we develop a minimal framework to study the dynamics of an active curved surface driven by its nematic texture. Allowing the surface to evolve via relaxational dynamics leads to a theory linking nematic defect dynamics, cellular division rates and Gaussian curvature. Regions of large positive (negative) curvature and positive (negative) growth are colocalized with the presence of positive (negative) defects. Applying this framework to the dynamics of cultured murine neural progenitor cells (NPCs) in an ex-vivo setting, we find that cells accumulate at positive defects and are depleted at negative defects. In contrast, applying this to the dynamics of a basal marine invertebrate Hydra in an in-vivo setting, we show that activity stabilizes a bound defect state by creating an incipient tentacle, while a bound defect state surrounded by two defects can create a stationary ring configuration of tentacles, consistent with observations.
Morphogenesis, the origin of self-organized form in biology, results from the complex interplay of mechanical and biochemical processes [1, 2]. To understand the dynamics of development, we need to complement our knowledge of the molecular constituents that unify many developmental programs across species with effective, coarse-grained theories that couple flows, forces, and self-regulation to generate shape and link them to testable experimental predictions [3, 4, 5, 6]. At the cellular level, there are four geometric fields– cell number, size, shape, and position–that vary in space and time that together are responsible for generating shape. In plant tissues, where cells do not change their relative positions, there has been much progress in linking molecular and cellular processes to tissue formation [7, 8]. In animal epithelial tissues, the ability to tag and track thousands of cells in space and time [9, 10, 11] allow us to begin answering similar questions linking cellular processes to tissue shape [12, 13, 14]. A particularly intriguing question in epithelial morphogenesis of nematically ordered cells is the role of topological defects in guiding or controlling morphogenesis, as has been uncovered in a few different systems, such as cell extrusion [15, 16], layer formation [17], and the body shape of basal marine invertebrates such as Hydra [18]. Here, we attempt to address the question of a minimal theory that focuses on the relaxational dynamics of the intrinsic geometry of active epithelial surfaces, complementing work on evolving passive surfaces that has focused on/included allowing the induced geometry to relax e.g. [19, 20, 21], see [22] for a recent review. In particular, we focus on the role of topological defects in determining how the intrinsic geometry of surfaces changes (Fig. 1), inspired by the observations in two different epithelial systems: cultured murine neural progenitor cells (NPCs) [16] which show the onset of bulges/pits or sites of cellular apoptosis as a function of defect type, and Hydra [18] which shows a correlation between the sign of the local Gaussian curvature and the sign of the defect, as well as correlations between the formation of tentacles and the presence of bound arrays of defects.
We model epithelial layers using the theory of active nematics, which consist of head-tail symmetric, elongated units that consume energy to move and do work on their surroundings, while still tending to align, locally generating nematic (apolar) order [23, 24, 25]. Like their passive counterparts, active nematics exhibit singular distortions, i.e. topological defects which interrupt the nematic order (see Topological defects of the SI for a brief review of nematic topological defects).
A minimal model that couples the relevant degrees of freedom in an active system must allow for spatio-temporal variations in the two-dimensional nematic tensor , a velocity field determined by an activity parameter which we will denote by and which is controlled by the local nematic field, and the intrinsic 2D metric (which can be deduced from tissue geometry), in addition to the extrinsic geometry of the sheet. For simplicity, here we will assume that the extrinsic geometry is harnessed to the intrinsic geometry, and further assume that the dynamics of the other fields are controlled by the gradient descent associated with variations in the free energy along with active flow dynamics. There are two main contributions to the free energy that we consider: (i) a contribution due to the nematic tensor , where is the magnitude of the nematic order, and is the local director field (ii) a contribution purely due to the metric , so that the total free energy is the sum of contributions from the nematic field as well as from the intrinsic metric, with .
For the nematic order parameter, the two-dimensional Landau-de Gennes free energy [27], , in its covariant form can be written as
| (1) |
where is the metric and is the covariant derivative associated with it. Here is the elasticity in the single-elastic Frank constant approximation, and the last term governs the isotropic-nematic transition, with controlling the microscopic nematic correlation length.111One can also add to , where is the scalar curvature. This term will be generated depending on the choice of the two Frank constants in the non-flat geometry, and for simplicity, we will ignore it for now.
Inspired by the gradient dynamics of Ricci flow [28], we can write the free energy due to variations in the metric as
| (2) |
where , with being a scalar field, is an elastic constant penalizing changes in the Gauss curvature , and is the term accounting for growth which we can use to enforce the condition that the surface area does not change.
Then the dynamics of the nematic and metric fields associated with gradient descent and advection by a non-equilibrium flow yields
| (3) | ||||
| (4) |
with the vorticity, and and are the viscous coefficients for the dynamics of and , respectively, with units of radians2/time.
Closure of the system (3)-(4) requires an equation for the active velocity field generated by the active stress , which we assume is proportional to , that is, [29, 23]. Here has units of energy density, with () corresponding to contractile (extensile) activity. In the overdamped, biologically relevant limit, assuming that flow arises due to the balance of active forces with the substrate friction , we write
| (5) |
with being what we refer to as the activity. Equations (3)-(5) are a closed set of nonlinear partial differential equations that dictate the evolution of the nematic field and the intrinsic geometry as a function of the activity , when complemented by appropriate initial and boundary conditions. We note that our theory is related to but simpler than recent phase field models for active deformable shells [30, 31] that account for both the induced and the intrinsic geometry of the manifolds.
To make progress in a minimal setting for epithelial morphogenesis, we choose 2D isothermal (conformal) complex coordinates and such that [32]
| (6) |
and assume that the metric remains diagonal in these coordinates for all time. Furthermore, since the nematic tensor is a traceless real bivector, we can write its components , , and , with , and . In these coordinates, and take the form
| (7) | ||||
| (8) |
where and , is defined in terms of the metric, the covariant derivatives used are and , and the scalar curvature . We note that the asymmetry in the appearance of between and is the underlying reason behind asymmetry in cell growth near defects: cells accumulate at positive defects and deplete at negative defects.222Here we have added a term to , which is equivalent to adding a term to .
In terms of the eight independent parameters: , , , , , , , and the system size , we can define a number of natural length and time scales: the nematic coherence length , which is proportional to the defect core radius, the geometric coherence length , and the nematic response to curvature length ; and the relaxation times of and , and . This leads to the following dimensionless quantities: , the ratio of coherence lengths for the nematic field and intrinsic geometry ( because extrinsic geometry variations occur on scales large compared to the nematic defect core size); ( because we assume that the long wavelength extrinsic geometry relaxes slowly compared to the local nematic order); , the ratio of the two different types of nematic elastic deformations (); and , the ratio of passive to active stresses, which can be large or small.
Before moving towards understanding the role of active defects in driving the intrinsic geometry of the surface, we first consider a passive nematic, when , so that the dynamics for and in isothermal conformal coordinates can be written as
| (9) | ||||
| (10) |
where the new covariant derivative terms are and .
In the neighborhood of defects, we denote and as the local geometry and nematic field, respectively. If we start with a flat configuration, with , Eq. (10) describing the evolution of in the neighborhood of a defect simplifies to
| (11) | ||||
| (12) |
Now noting that and that in the vicinity of the positive (negative) defect core () leads to
| (13) |
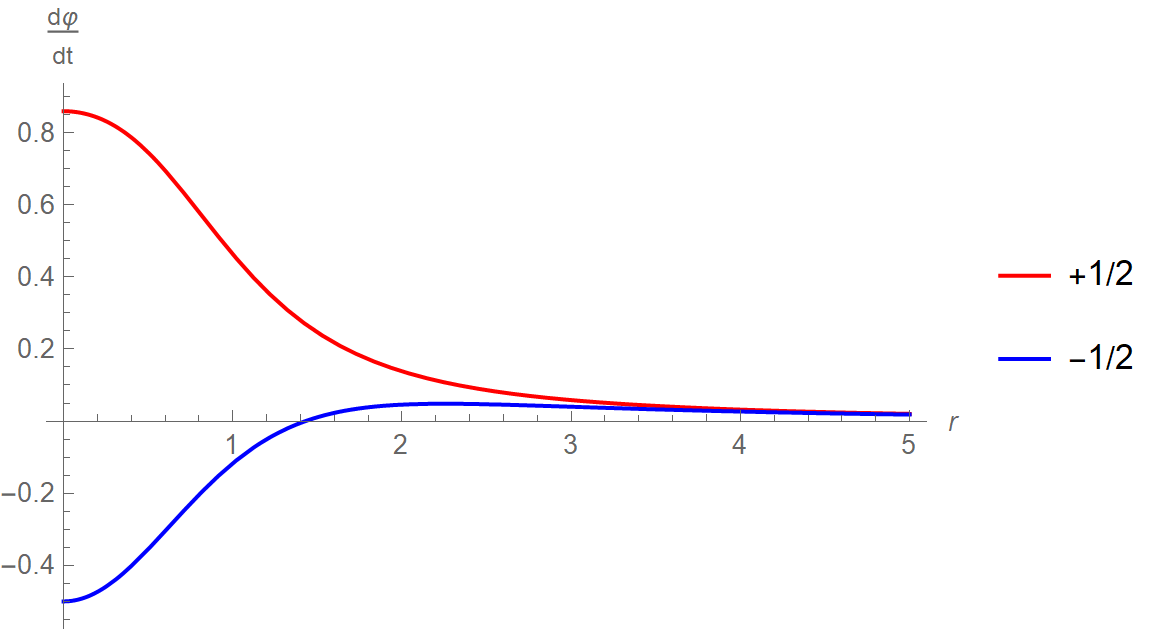
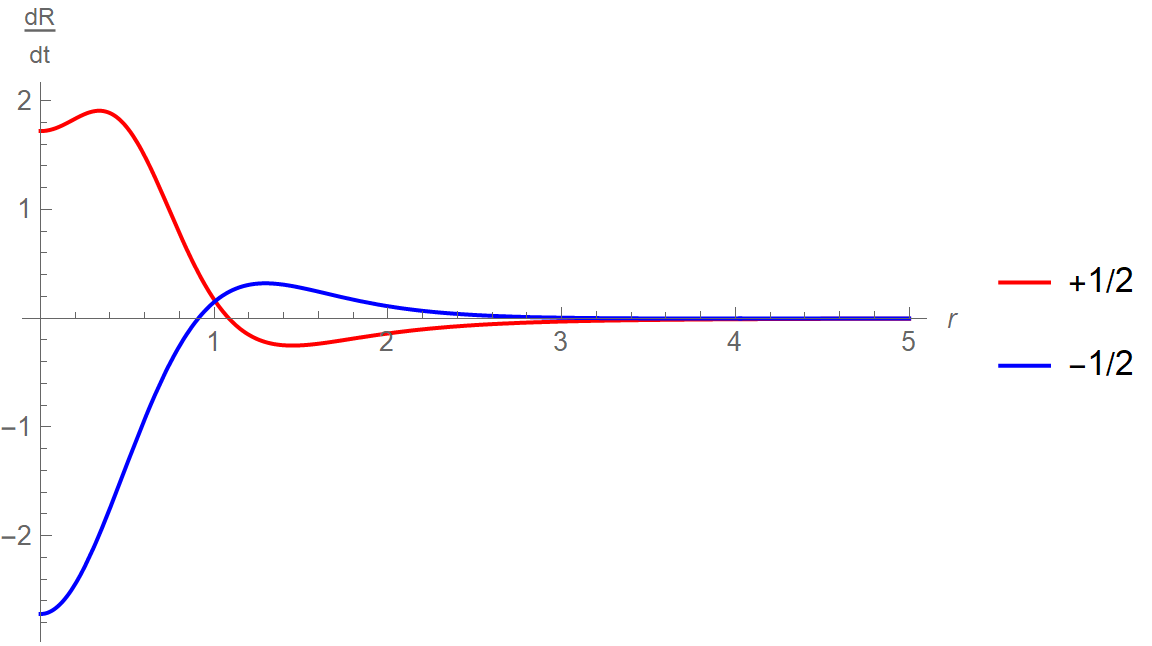
In the absence of net surface growth, this implies that will increase at a defect and decrease near a defect. Interpreting as the log of the cell density (since the Gauss curvature ), we expect the cell density to increase (decrease) at plus (minus) defects, which means we can interpret as cells accumulating (depleting) at the defects.
In Fig. 2, we compare this result with observations from two different experiments. In the top panel is the initial profile of at from our analysis, showing the dynamic asymmetry between a plus and minus defect, which is consistent with the experimental observations of cell density in the vicinity of defects in murine neural progenitor epithelia [16]. In the bottom panel, we show that this asymmetry in the shape in the neighborhood of defects is reflected in the Gauss curvature of the surface which is positive (negative) near a plus (minus) defect, consistent with independent observations in a different experiment [18]. This correlation between the charge of the defects and the sign of the curvature is a consequence of the relaxational dynamics of the metric even in an active nematic, and as we will see later remains valid even at later (late) times. See Role of activity for flat configuration of SI for the effect of activity.


We now turn to consider the effect of activity, i.e. , and rewrite the coupled equations (9)-(10) in complex coordinates with and , where in the over-damped limit, and . The main effect of the active contribution to the initial dynamics of is that unlike the passive contribution, it is anisotropic, with vanishing average (details in Role of activity for flat configuration of SI).
To solve these equations and follow the nematic field and the intrinsic geometry, we use a finite-difference scheme with periodic boundary conditions to simulate a ring-like structure seen in Hydra (see Numerical methods of SI for details). We find that an initial state, defined by a flat geometry and defect configuration of a single defect in the center and two defects on the edges, using the ansatz from [33], settles into a stationary defect configuration of a ring of equally spaced defects (bound state of two defects) separated by pairs of defects in a cylindrical geometry (see Fig. 3(a)), similar to that observed in [18]. Activity plays a key role in stabilizing this configuration, and in particular, the bound state is a result of balance of Coulombic repulsion force between the defects and motility (see Topological Defects of the SI for details). Indeed, the larger the activity parameter for the extensile case , the tighter is the bound defect. Moreover, the curvature is positive near a plus defect, and negative near a minus defect, as can be seen in Fig. 3(b). Plotting the profiles of and along the vertical -axis, we find that the peak in near the origin indicates outward bulging of the geometry. Moreover, the profile of which is dictated by the nematic coherence length is much narrower than the width of along the -axis, which is expected given that the geometric coherence length is larger than the nematic coherence length, i.e. and similar to what was observed experimentally in [16] and in numerical simulations of phase field models e.g. [31].
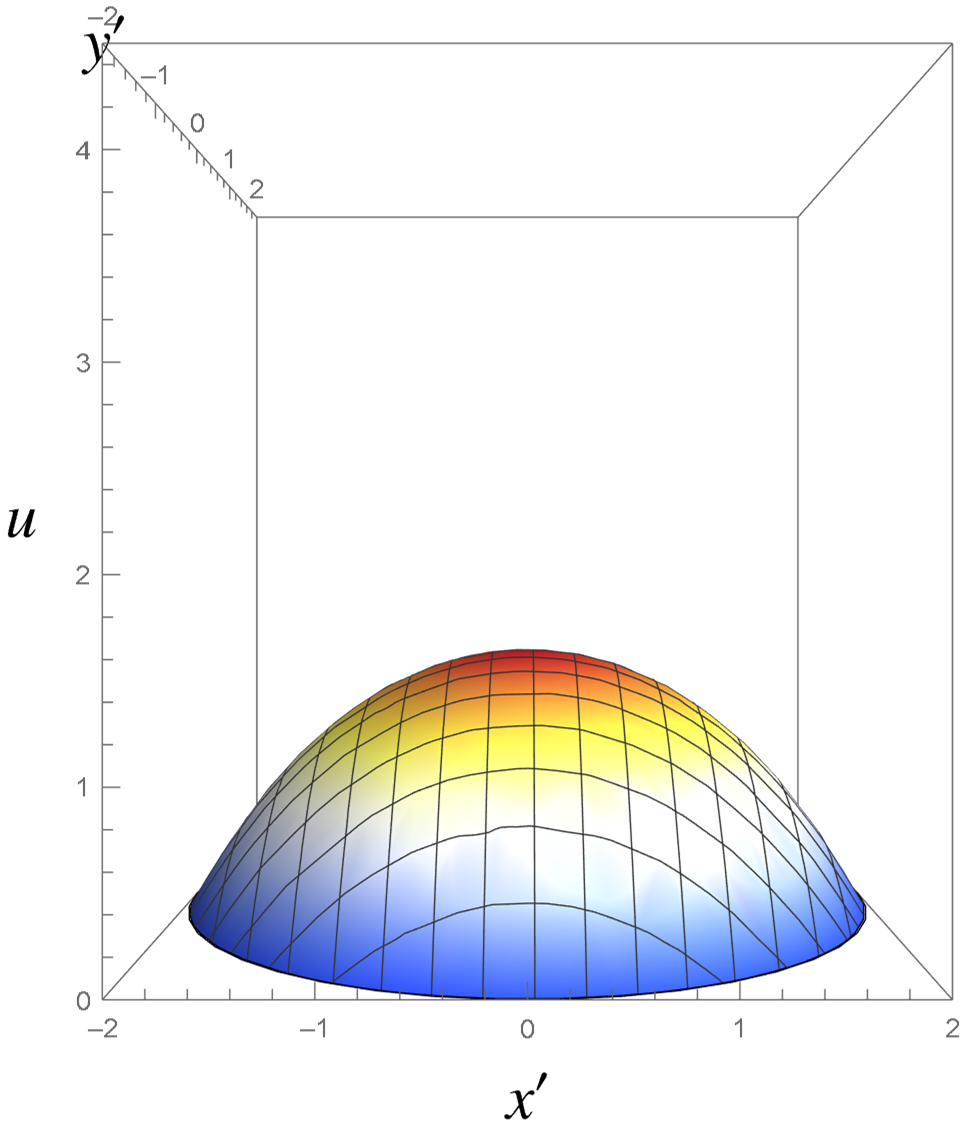
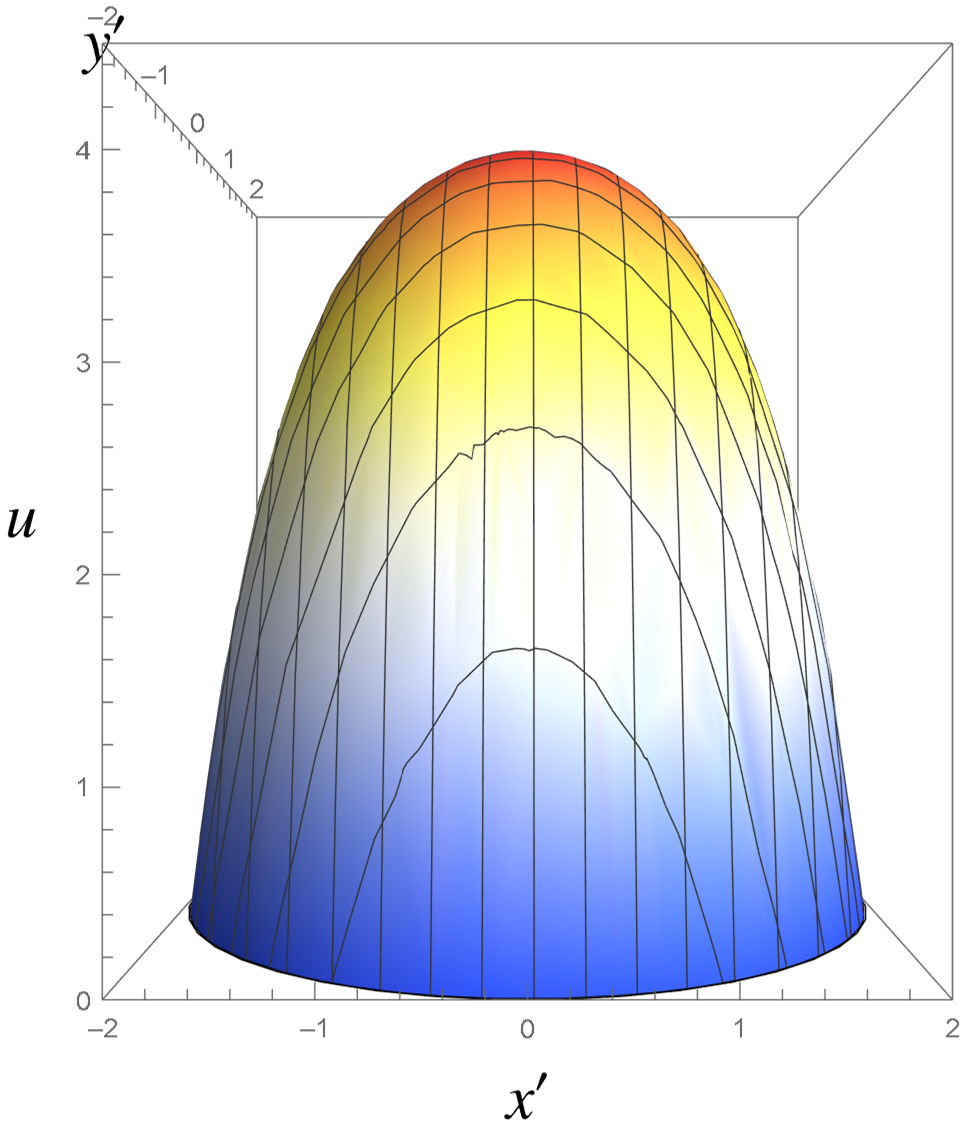
To ground these results, we turn to observations of epithelial morphogenesis in Hydra, a small, fresh-water basal marine invertebrate that has been a model organism for studying the dynamics of body shaping [34, 35, 18]. The tubular body of the organism consists of a bilayer of epithelial cells which contains parallel, condensed supracellular actin fibers, which align parallel to the body axis in the outer (ectoderm) layer and perpendicular to the body axis in the inner (endoderm) layer [36]. A variable number of tentacles form a ring around the body, near the head, and form when a single defect is surrounded by a pair of defects [18], with the sign of the curvature is correlated with the sign of the defect, consistent with our results summarized in Fig. 3. Indeed, a qualitative rendering of the shape associated with the presence of these bound defect states shown in Fig. 4(a) provides a simple projective view of the body plan in the neighborhood of the ring of tentacles.
But what is the actual shape of the epithelium in three dimensions? We note that knowing the intrinsic geometry does not always allow us to deduce the extrinsic geometry, but it is possible to get an approximation by numerically solving the two-dimensional Monge-Ampère equation (details in Algorithm for finding embedding of SI). This allows us to estimate the local shape of the active surface shown in Fig. 4(b),(c) near a defect. Furthermore, we see that at early times the time evolution of the height follows the scaling law , which can be analytically derived by using Eq. (11) (see Algorithm for finding embedding of SI for details).
Our minimal framework coupling the dynamics of an active nematic field on a curved surface to the intrinsic geometry of the surface via relaxational dynamics has focused on the interplay between geometry and nematic defects and leads to three simple conclusions: (i) the sign of the curvature is correlated with the sign of the defect, (ii) cells accumulate and form mounds at positive defects and are depleted at negative defects, and (iii) a stationary ring configuration of equally spaced defects separated by pairs of defects can form. These results are consistent with experimental observations in different systems such as neural progenitor cells in-vitro and Hydra morphogenesis in-vivo. A more complete description must include a complete characterization of the dynamics of embedding and the possible time-dependence of isothermal coordinates, as well as feedback on activity of the form , potential directions for future work. We note that a recent preprint [37] submitted after the first version of the current paper was submitted has begun to address some closely-related questions.
Acknowledgements.
We thank Xianfeng David Gu and Shing-Tung Yau for valuable discussions on reconstructing the embedding from the intrinsic metric. We have also benefited from discussions with Suraj Shankar, and members of M. Cristina Marchetti’s and Mark Bowick’s groups. The work of LM is partially supported by the NSF Simons Center for Mathematical and Statistical Analysis of Biology Award No. 1764269.References
- Thompson [1917] D. W. Thompson, On Growth and Form (Cambridge Univ. Press, 1917).
- Barresi and Gilbert [2020] M. J. F. Barresi and S. F. Gilbert, Developmental biology, 12th ed. (Sinauer Associates, 2020).
- Heisenberg and Bellaïche [2013] C.-P. Heisenberg and Y. Bellaïche, Forces in tissue morphogenesis and patterning, Cell 153, 948 (2013).
- Lecuit and Mahadevan [2017] T. Lecuit and L. Mahadevan, Morphogenesis one century after on growth and form, Development 144, 4197 (2017).
- Gross et al. [2017] P. Gross, K. V. Kumar, and S. W. Grill, How active mechanics and regulatory biochemistry combine to form patterns in development, Annual Review of Biophysics 46, 337 (2017), pMID: 28532214.
- Collinet and Lecuit [2021] C. Collinet and T. Lecuit, Programmed and self-organized flow of information during morphogenesis, Nature Reviews Molecular Cell Biology 22, 245 (2021).
- Meyerowitz [1997] E. M. Meyerowitz, Genetic control of cell division patterns in developing plants, Cell 88, 299 (1997).
- Coen et al. [2017] E. Coen, R. Kennaway, and C. Whitewoods, On genes and form, Development 144, 4203 (2017).
- Bosveld et al. [2012] F. Bosveld, I. Bonnet, B. Guirao, S. Tlili, Z. Wang, A. Petitalot, R. Marchand, P.-L. Bardet, P. Marcq, F. Graner, and Y. Bellaïche, Mechanical control of morphogenesis by fat/dachsous/four-jointed planar cell polarity pathway, Science 336, 724 (2012).
- Tomer et al. [2012] R. Tomer, K. Khairy, F. Amat, and P. J. Keller, Quantitative high-speed imaging of entire developing embryos with simultaneous multiview light-sheet microscopy, Nature Methods 9, 755 (2012).
- Krzic et al. [2012] U. Krzic, S. Gunther, T. E. Saunders, S. J. Streichan, and L. Hufnagel, Multiview light-sheet microscope for rapid in toto imaging, Nature Methods 9, 730 (2012).
- Farhadifar et al. [2007] R. Farhadifar, J.-C. Röper, B. Aigouy, S. Eaton, and F. Jülicher, The influence of cell mechanics, cell-cell interactions, and proliferation on epithelial packing, Current Biology 17, 2095 (2007).
- Heer and Martin [2017] N. C. Heer and A. C. Martin, Tension, contraction and tissue morphogenesis, Development 144, 4249 (2017).
- Irvine and Shraiman [2017] K. D. Irvine and B. I. Shraiman, Mechanical control of growth: ideas, facts and challenges, Development 144, 4238 (2017).
- Saw et al. [2017] T. B. Saw, A. Doostmohammadi, V. Nier, L. Kocgozlu, S. Thampi, Y. Toyama, P. Marcq, C. T. Lim, J. M. Yeomans, and B. Ladoux, Topological defects in epithelia govern cell death and extrusion, Nature 544, 212 (2017).
- Kawaguchi et al. [2017] K. Kawaguchi, R. Kageyama, and M. Sano, Topological defects control collective dynamics in neural progenitor cell cultures, Nature 545, 327 (2017).
- Copenhagen et al. [2021] K. Copenhagen, R. Alert, N. S. Wingreen, and J. W. Shaevitz, Topological defects promote layer formation in Myxococcus xanthus colonies, Nature Physics 17, 211 (2021).
- Maroudas-Sacks et al. [2020] Y. Maroudas-Sacks, L. Garion, L. Shani-Zerbib, A. Livshits, E. Braun, and K. Keren, Topological defects in the nematic order of actin fibres as organization centres of hydra morphogenesis, Nature Physics 10.1038/s41567-020-01083-1 (2020).
- Lubensky and Prost [1992] T. C. Lubensky and J. Prost, Orientational order and vesicle shape, Journal de Physique II 2, 371 (1992).
- Seung and Nelson [1988] H. S. Seung and D. R. Nelson, Defects in flexible membranes with crystalline order, Phys. Rev. A 38, 1005 (1988).
- Frank and Kardar [2008] J. R. Frank and M. Kardar, Defects in nematic membranes can buckle into pseudospheres, Phys. Rev. E 77, 041705 (2008).
- Al-Izzi and Morris [2021] S. C. Al-Izzi and R. G. Morris, Active flows and deformable surfaces in development (2021), arXiv:2103.12264 [physics.bio-ph] .
- Marchetti et al. [2013] M. C. Marchetti, J.-F. Joanny, S. Ramaswamy, T. B. Liverpool, J. Prost, M. Rao, and R. A. Simha, Hydrodynamics of soft active matter, Reviews of Modern Physics 85, 1143 (2013).
- Doostmohammadi et al. [2018] A. Doostmohammadi, J. Ignés-Mullol, J. M. Yeomans, and F. Sagués, Active nematics, Nature communications 9, 3246 (2018).
- Shankar et al. [2020] S. Shankar, A. Souslov, M. J. Bowick, M. C. Marchetti, and V. Vitelli, Topological active matter (2020), arXiv:2010.00364 [cond-mat.soft] .
- Drew [2018] D. J. Drew, Hydra (YPM IZ 091796), Digital Image: Yale Peabody Museum of Natural History (2018).
- de Gennes and Prost [1993] P. G. de Gennes and J. Prost, The physics of liquid crystals (Clarendon Press, Oxford, 1993).
- Hamilton [1982] R. S. Hamilton, Three-manifolds with positive ricci curvature, J. Differential Geom. 17, 255 (1982).
- Aditi Simha and Ramaswamy [2002] R. Aditi Simha and S. Ramaswamy, Hydrodynamic fluctuations and instabilities in ordered suspensions of self-propelled particles, Phys. Rev. Lett. 89, 058101 (2002).
- Mietke et al. [2019] A. Mietke, F. Jülicher, and I. F. Sbalzarini, Self-organized shape dynamics of active surfaces, Proceedings of the National Academy of Sciences 116, 29 (2019).
- Metselaar et al. [2019] L. Metselaar, J. M. Yeomans, and A. Doostmohammadi, Topology and morphology of self-deforming active shells, Physical review letters 123, 208001 (2019).
- David [2004] F. David, Geometry and field theory of random surfaces and membranes, in Statistical Mechanics of Membranes and Surfaces, edited by D. Nelson, T. Piran, and S. Weinberg (World Scientific, 2004) 2nd ed., Chap. 7, pp. 149–209.
- Vafa et al. [2020] F. Vafa, M. J. Bowick, M. C. Marchetti, and B. I. Shraiman, Multi-defect dynamics in active nematics (2020), arXiv:2007.02947 [cond-mat.soft] .
- Galliot [2012] B. Galliot, Hydra, a fruitful model system for 270 years, The International Journal of Developmental Biology 56, 411–423 (2012).
- Braun and Keren [2018] E. Braun and K. Keren, Hydra regeneration: Closing the loop with mechanical processes in morphogenesis, BioEssays 40, 1700204 (2018).
- Aufschnaiter et al. [2017] R. Aufschnaiter, R. Wedlich-Söldner, X. Zhang, and B. Hobmayer, Apical and basal epitheliomuscular f-actin dynamics during hydra bud evagination, Biology Open 6, 1137 (2017).
- Hoffmann et al. [2021] L. A. Hoffmann, L. N. Carenza, J. Eckert, and L. Giomi, Defect-mediated morphogenesis (2021), arXiv:2105.15200 [cond-mat.soft] .
- Narayan et al. [2007] V. Narayan, S. Ramaswamy, and N. Menon, Long-lived giant number fluctuations in a swarming granular nematic, Science 317, 105 (2007).
- Sanchez et al. [2012] T. Sanchez, D. T. Chen, S. J. DeCamp, M. Heymann, and Z. Dogic, Spontaneous motion in hierarchically assembled active matter, Nature 491, 431 (2012).
- Giomi et al. [2013] L. Giomi, M. J. Bowick, X. Ma, and M. C. Marchetti, Defect annihilation and proliferation in active nematics, Physical review letters 110, 228101 (2013).
- Pismen [2013] L. Pismen, Dynamics of defects in an active nematic layer, Physical Review E 88, 050502 (2013).
- Shankar et al. [2018] S. Shankar, S. Ramaswamy, M. C. Marchetti, and M. J. Bowick, Defect unbinding in active nematics, Physical review letters 121, 108002 (2018).
- Thijssen and Doostmohammadi [2020] K. Thijssen and A. Doostmohammadi, Binding self-propelled topological defects in active turbulence, Phys. Rev. Research 2, 042008 (2020).
- Vafa [2020] F. Vafa, Defect dynamics in active polar fluids vs. active nematics (2020), arXiv:2009.10723 [cond-mat.soft] .
- Benamou, Jean-David et al. [2010] Benamou, Jean-David, Froese, Brittany D., and Oberman, Adam M., Two numerical methods for the elliptic monge-ampère equation, ESAIM: M2AN 44, 737 (2010).
- Gu et al. [2013] X. Gu, F. Luo, J. Sun, and S. T. Yau, Variational principles for minkowski type problems, discrete optimal transport, and discrete monge-ampere equations (2013), arXiv:1302.5472 [math.GT] .
- Cui et al. [2019] L. Cui, X. Qi, C. Wen, N. Lei, X. Li, M. Zhang, and X. Gu, Spherical optimal transportation, Computer-Aided Design 115, 181 (2019).
- Gu [2020] X. D. Gu, Geometric optimal transportation (2020), accessed on 04.13.2021.
- Gu [2021] X. D. Gu, Spherical optimal transportation (2021), accessed on 04.13.2021.
Supplementary Material
Appendix A Elementary topological defects and their bound states
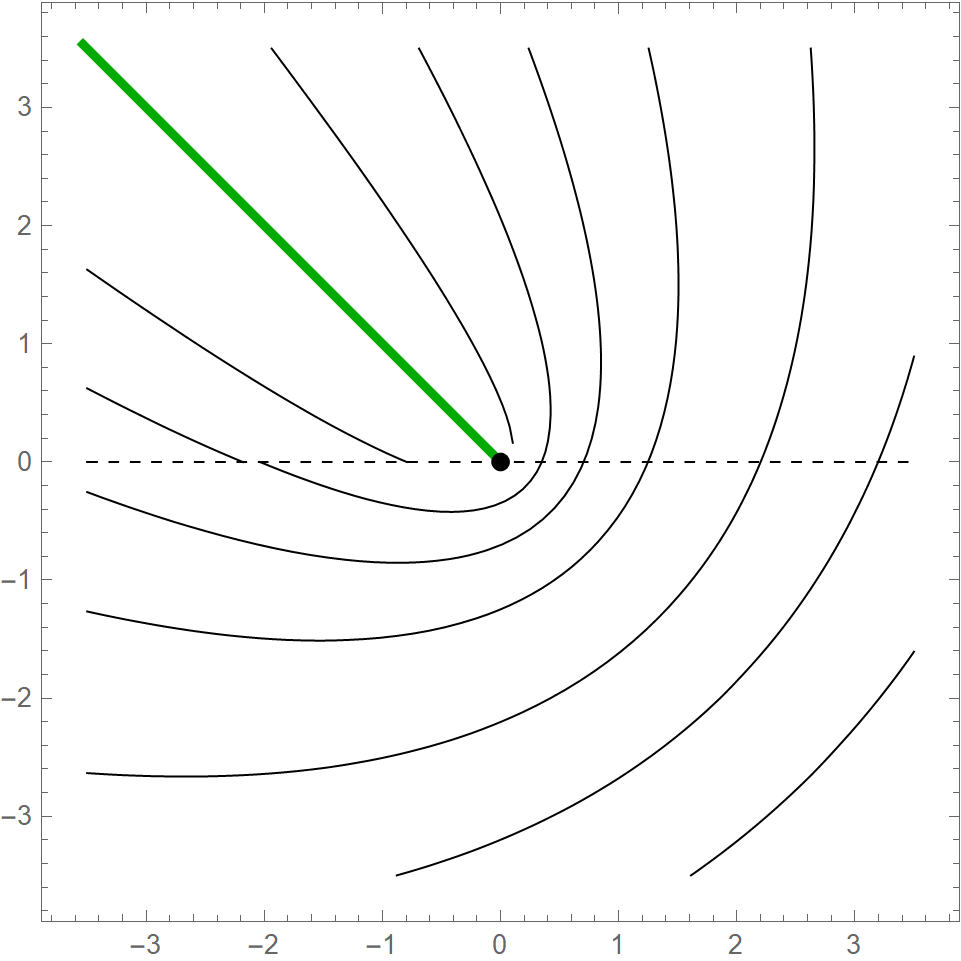
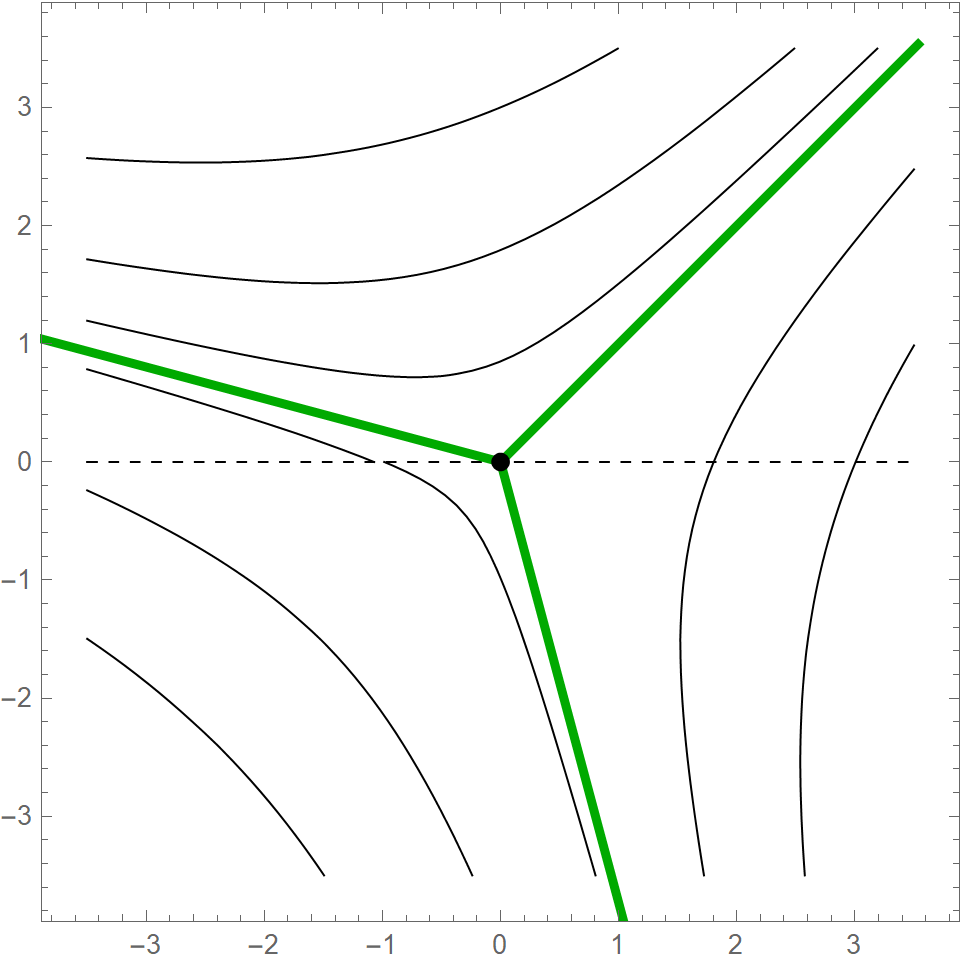
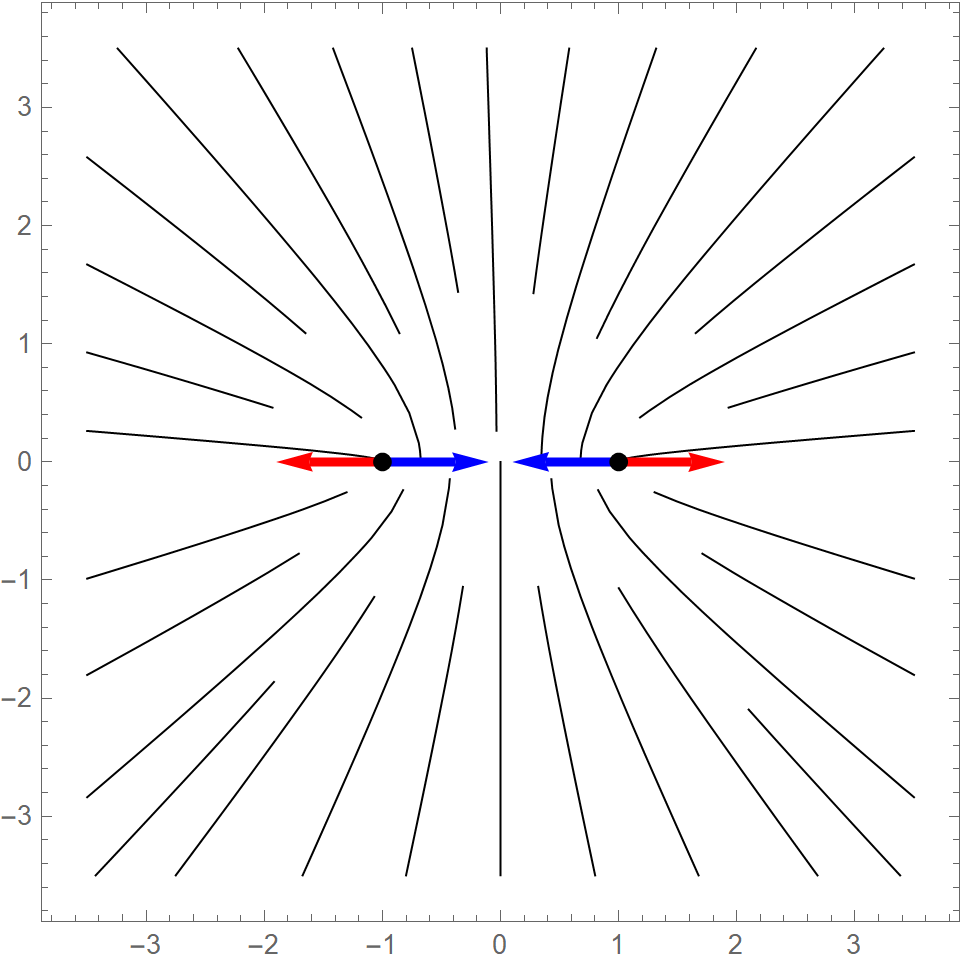
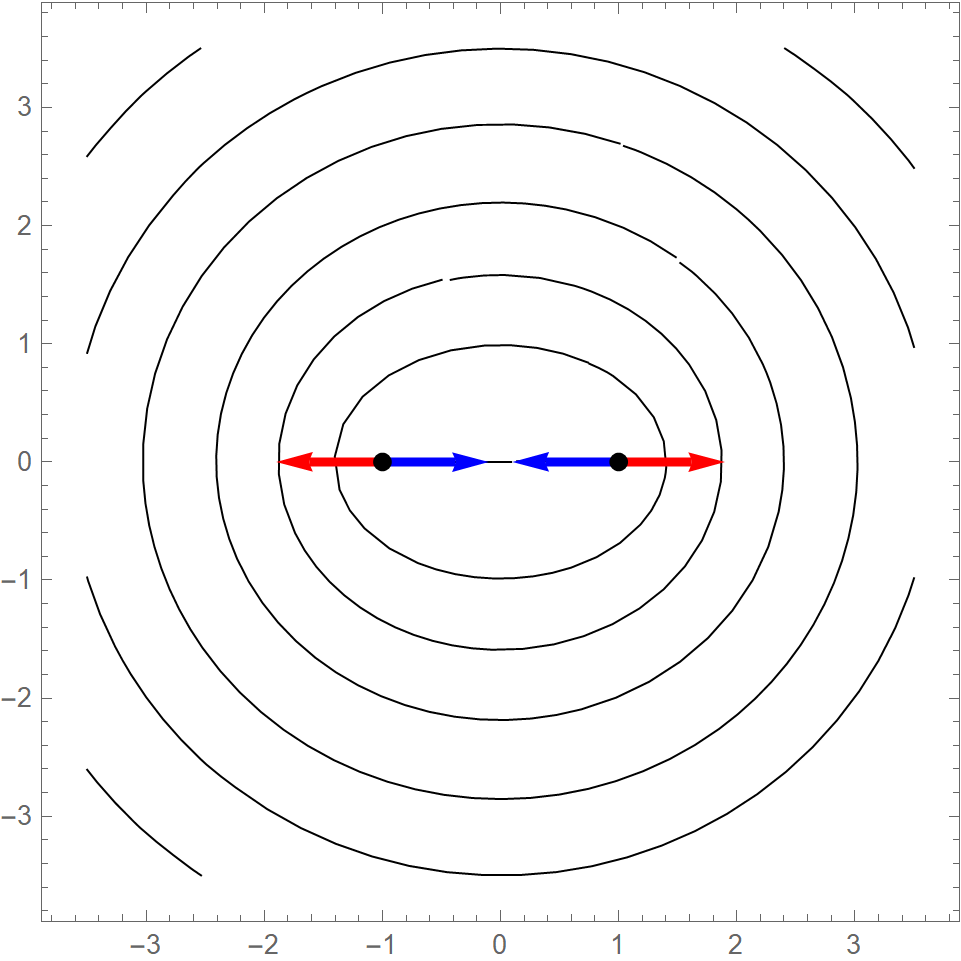
The elementary topological defects for a nematic are defects (see Fig. S1). An important distinction between the two is that activity renders a defect motile and capable of self-propulsion along its axis, whereas due to its three-fold symmetry, a defect remains stationary [38, 39, 40, 41]. Extensile (contractile) activity drives the defect to move towards (away from) the head of the comet. Activity can induce a bound defect state of two defects, when the Coulomb repulsion balances the self-propulsion of the defects; depending on the sign of the activity or equivalently, the orientation of the defects [42, 43, 44], one then gets either aster or vortex bound states (see Fig. S1).333There are other forces, such as collective defect drag and activity-induced pair-wise interactions, but we neglect these forces since they are subleading [33].
Appendix B Role of activity for flat configuration
Here we will show the the effect of activity on the initial growth, starting from a flat configuration . We have
| (S.1) |
so the extra contribution to the RHS of is -2. In terms of ,
| (S.2) |
Substituting into Eq. S(2) where is the polar angle leads to
| (S.3) |
In other words, for the active contribution, unlike the passive contribution, the growth is anisotropic and grows maximally along symmetry axes and least in the opposite directions. Also we want to note that for , the active contribution for a defect is always the same sign as the activity, whereas for a defect, it’s the opposite sign. Also in particular, taking the difference between the contributions for and defects leads to
| (S.4) |
which for is negative for and positive in the limit .
Appendix C Numerical methods
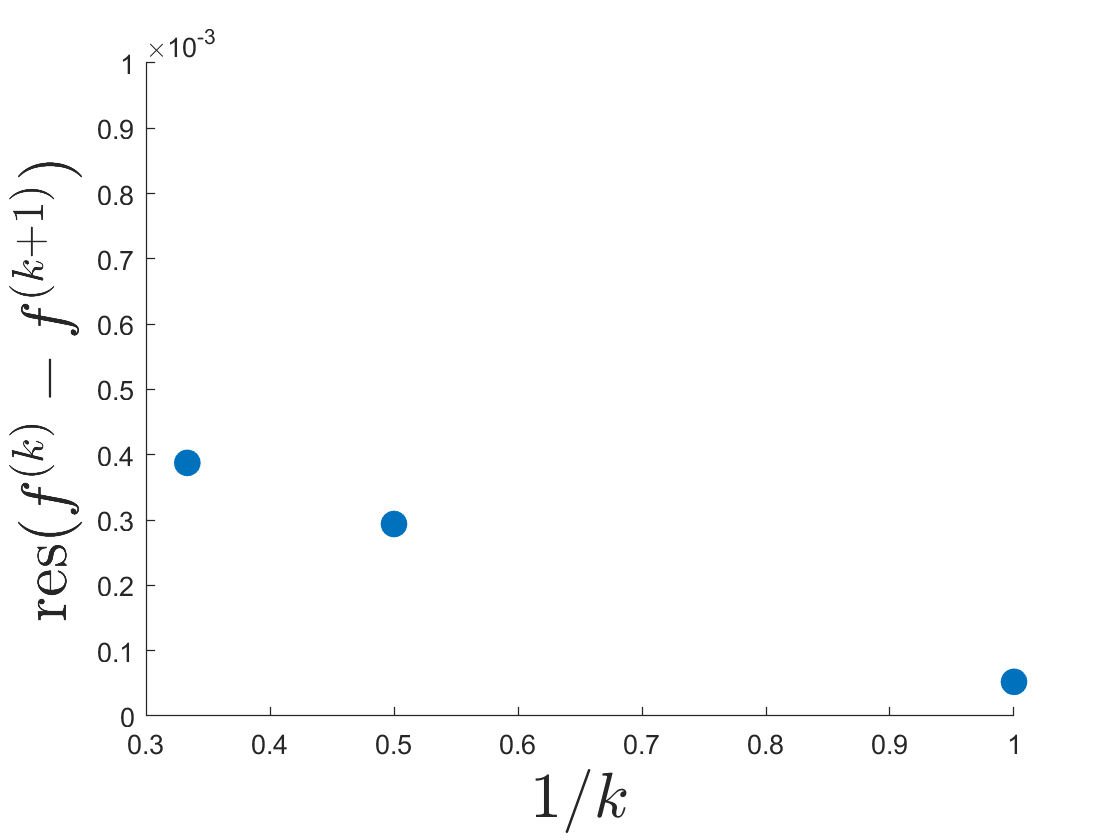
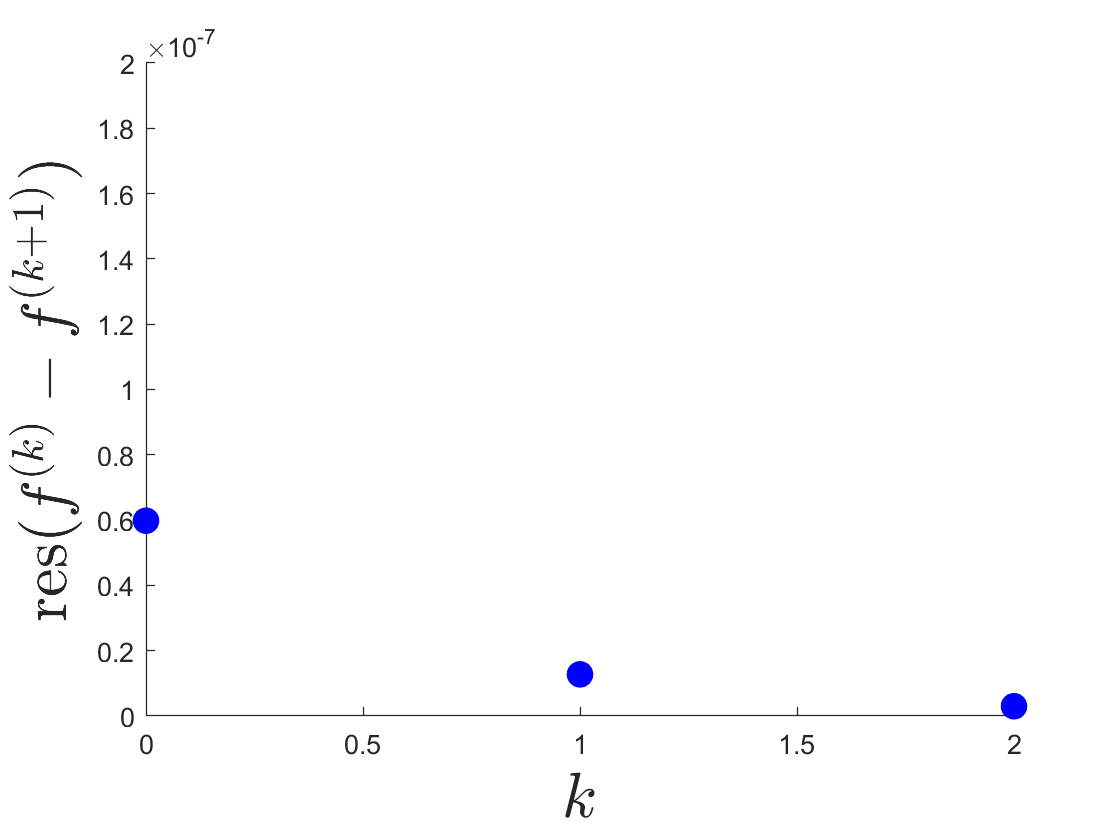
We simulated equations (9)-(10) (with the substitution ) with a custom code written in Matlab. Our domain of size with periodic boundary conditions is represented by a grid of size with spatial discretization . Spatial derivatives are evaluated using second-order central difference scheme. The initial condition is flat geometry () and defect configuration of a single defect in the center (which due to periodic boundary condition forces the appearance of two defects), using the ansatz from [33]. The equations are time-integrated using a forward Euler finite-difference method with time-step , for a total number of 80,000 iterations (until convergence to stationary solution). Convergence checks for the spatial and temporal resolution are in Fig. S2.
We then extracted the final data (restricted to a region of size where the curvature is strictly positive) and after smoothing it via Mathematica’s GaussianFilter function with standard deviation , we used Mathematica’s NDSolve function to numerically solve and thus find the embedding (plots in Fig. 5 of the main text) according to the iterative algorithm described in the next section.
Appendix D Algorithm for finding embedding
To determine the extrinsic geometry from the intrinsic geometry, we can make some progress by noting that if is the Monge representation of the surface in 3D, the Gauss curvature is given by
| (S.5) |
In terms of , noting that allows us to determine for positive by an iterative procedure444We would like to thank Xianfeng David Gu for explaining this method., (see [45, 46, 47] and references therein, and [48] and [49] are accompanying open source codes for the latter two references), where
| (S.6) |
Expressing as , where is our initial seed for the iterative procedure, and is a small correction, with chosen so that at the peak, we can determine for representative times, as shown in Fig. 5. For our data, we did three such iterations.
Appendix E Dynamics of bud growth
We now present a heuristic argument for the dynamics of budding. From Eq. (11), at the center of the defect,
| (S.7) |
and so by taking the Laplacian,
| (S.8) |
so that
| (S.9) |
Combining this with the fact that at the center of a defect core, , where is the separation between neighboring positive and negative defects, leads to
| (S.10) |
Since the nematic order is a fast variable, we can assume it settles before the (slower) geometric relaxation. The leftover dynamics is due to the diffusive nature of the Ricci flow (essentially the heat equation), leading to , where . Similarly, this leads to .
These asymptotics are consistent with the fit we found from our simulations in Fig. 5,
| (S.11) |
if we take and .
We thus see that the relative size of the tentacle to the average tentacle separation is
| (S.12) |
so that a tentacle can grow in two different ways for fixed tentacle separation (): by decreasing either the nematic () or geometric () coherence length.