Pion decay model of TIBET-AS PeV gamma-ray signal
Abstract
Tibet-AS collaboration has recently reported a measurement of diffuse -ray flux from the outer Galactic disk in the energy range reaching PeV. We complement this measurement with the Fermi/LAT measurement of the diffuse flux from the same sky region and study the pion decay model of the combined Fermi/LATTibet-AS spectrum. We find that within such a model the average cosmic ray spectrum in the outer Galactic disk has the same characteristic features as the local cosmic ray spectrum. In particular, it experiences a hardening at several hundred GV rigidity and a knee feature in the PV rigidity range. The slope of the average cosmic ray spectrum above the break is close to the locally observed slope of the helium spectrum , but is harder than the slope of the local proton spectrum in the same rigidity range. Although the combination of Fermi/LAT and Tibet-AS data points to the presence of the knee in the average cosmic ray spectrum, the quality of the data is not yet sufficient for the study of knee shape and cosmic ray composition.
I Introduction
Tibet-AS collaboration has recently reported a measurement of diffuse -ray flux from the outer Galactic Plane up to the PeV energy range Amenomori et al. (2021). This measurement possibly provides information about cosmic rays with energies above PeV residing in the interstellar medium across the Milky Way disk. In this sense it potentially carries information complementary to that obtained using the local measurements of the cosmic ray flux at the location of the Earth.
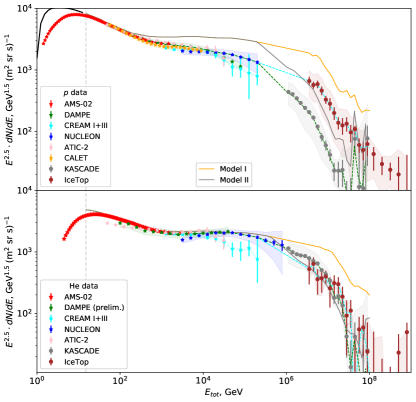
The local cosmic ray spectrum measurements from GeV to multi-PeV energy range obtained by AMS-02 Aguilar et al. (2020), CREAM Yoon et al. (2017), ATIC-2 Panov et al. (2009), DAMPE An et al. (2019); Alemanno et al. (2021), CALET Adriani et al. (2019), NUCLEON Grebenyuk et al. (2019), IceTop Aartsen et al. (2019a), KASCADE Apel et al. (2013) reveal a range of puzzling properties of the spectrum. Overall, the spectra of different components of cosmic ray flux are broken powerlaws (here we use conventional symbol for the total energy of the particle) in the energy range much below the knee at PeV Antoni et al. (2005); Amenomori et al. (2008); Abbasi et al. (2018). The spectra of different nuclei all exhibit a hardening break at several hundred GV rigidity Adriani et al. (2011). The slope of the proton spectrum is changing from down to Adriani et al. (2011, 2019) while the slope of the helium spectrum is hardening to Grebenyuk et al. (2019), see Fig. 1.
The difference in the slopes of different flux components is puzzling. Cosmic ray acceleration and propagation models typically evoke physical processes that universally scale with particle rigidity. Changes in the spectra of different nuclei are expected to be the same if the spectra are expressed as functions of rigidity. It is not clear if the hardening in cosmic ray spectrum and difference of slopes of proton and helium (and other primary cosmic ray nuclei) spectra are a local cosmic ray feature or they are a generic properties of the Galactic cosmic ray spectrum.
Equally uncertain is the origin of the knee of the cosmic ray spectrum (see Kachelriess and Semikoz (2019) for a recent review). It can correspond to the highest energy of cosmic rays produced by Galactic sources Stanev et al. (1993, 1993) or to the break in the cosmic ray spectrum of those sources Drury et al. (2003); Cardillo et al. (2015) or it can occur at the energy at which particle Larmor radius is comparable to the correlation length of Galactic magnetic field in ”escape” model Syrovatskii (1971); Giacinti et al. (2014, 2015). The energy of the knee and the details of the spectral changes at the knee might also be different across the Galaxy if the knee is locally dominated by one or few sources Erlykin and Wolfendale (2001); Bouyahiaoui et al. (2019). This possibility is natural in the anisotropic diffusion model which brings phenomenological diffusion models in agreement with the realistic scale magnetic field of Galaxy Giacinti et al. (2018).
Measurements of the energies of the knees of different flux components disagree with each other. KASCADE experiment using QGSJET-II-02 model has found the proton knee at the energy about PeV, while the knee in the helium spectrum is at PeV, so that the two knees occur at the same rigidity Apel et al. (2013). ARGO-YBJ measurements suggest that the proton knee is at lower energy PeV Bartoli et al. (2015). To the contrary, IceTop experiment using Sibyll 2.1 model finds the knees of the proton and helium spectra at approximately the same energy PeV Aartsen et al. (2019a). Since all-particle spectrum is the same in all experiments, the origin of these discrepancies is in large systematic uncertainty of composition reconstruction in data analysis of different experiments, both in extraction of many nuclei groups from the data and in dependence of results on hadronic interaction models (see Lipari and Vernetto (2020) for an overview).
Diffuse -ray flux measurements from the Galactic disk region provide a possibility to constrain the properties of the average cosmic ray spectrum in the disk Neronov et al. (2012); Neronov and Malyshev (2015); Yang et al. (2016); Neronov et al. (2017); Neronov and Semikoz (2020a). In general, the diffuse -ray flux is composed of several components, including Bremsstrahlung and inverse Compton emission from cosmic ray electrons and neutral pion decay emission from interactions of cosmic ray protons and nuclei with interstellar medium Ackermann et al. (2012); Acero et al. (2016); Lipari and Vernetto (2018). However, the pion decay component is strongly boosted, compared to the electron component of the -ray flux, in the densest part of the Galactic disk (a region of about pc around the Galactic Plane) Lipari and Vernetto (2018). This suggests that the spectral template of the pion decay emission component can be isolated by subtracting the diffuse flux at Galactic latitude above certain Galactic latitude cut (e.g. ) from the flux measurements below this cut. In this way, the -ray flux components sensitive to the density of the interstellar medium (Bremsstrahlung and pion decay) would be boosted compared to the inverse Compton component Neronov and Malyshev (2015).
Such an approach has been chosen in Tibet-AS data analysis Amenomori et al. (2021), in which the sky region has been chosen as ”background estimate” region and the region at has been considered as the ”signal” region.
In what follows we implement the approach of Tibet-AS data analysis for the analysis of Fermi/LAT data, to complement Tibet-AS measurements with lower energy data points. In this way we obtain the spectral template for the pion decay Bremsstrahlung emission from the outer Galactic Plane (Galactic longitude range ). We model the resulting diffuse -ray spectrum in a broad GeV-PeV energy range using a ”minimal” pion-decay-only model, to get a first idea on possible range of properties of the average cosmic ray spectrum in the outer Galactic disk.
II Fermi/LAT data analysis
Our analysis of Fermi/LAT data adopts the same approach as Tibet-AS data analysis Amenomori et al. (2021). We consider diffuse flux from the sky region , . To get rid of the isolated source flux, we remove photons from within circles of the radius around sources from the 4th Fermi/LAT catalog (option 1) or around the sources from TeVCat online catalog of TeV -ray sources (option 2). We use Pass 8 Fermi/LAT dataset spanning 12 years (2008–2020), the SOURCEVETO event selection. To calculate the diffuse source flux we collect events in square boxes of filling the region of interest. In each box and each energy bin, we calculate the exposure using the gtmktime-gtexposure Fermi Science Tools routine combination111https://fermi.gsfc.nasa.gov/ssc/data/analysis/software/.
Following the approach of Tibet-ASAmenomori et al. (2021), we use photon counts in the sky region to estimate the ”background” counts in each energy bin and each box. As discussed in the Introduction, this ”background” flux in fact contains the diffuse emission flux at higher Galactic latitude, which has higher inverse Compton flux component. In this way, the analysis ”boosts” the pion decay and Bremsstrahlung components and suppresses the inverse Compton component.
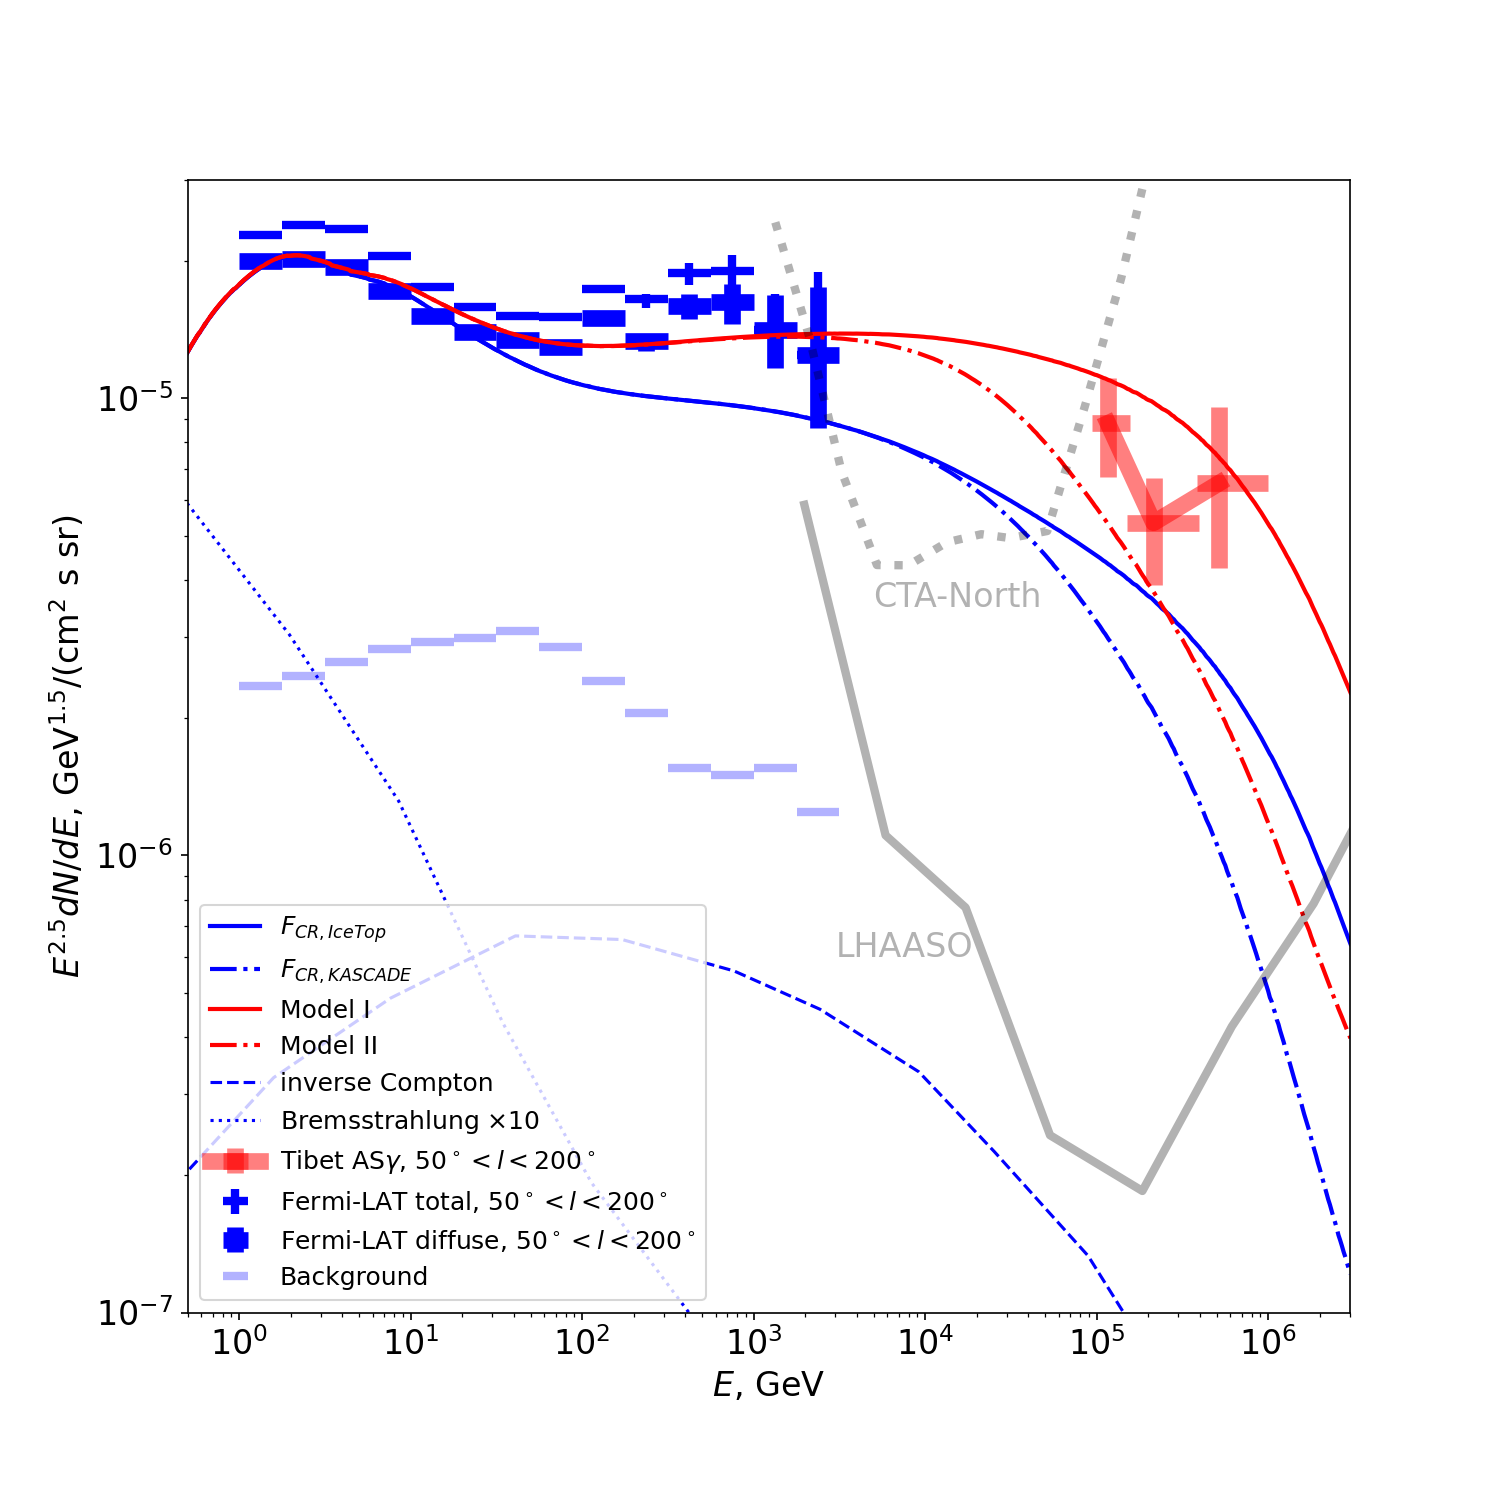
The resulting -ray spectrum is shown in Fig. 2. Pale blue data points show the total flux measurement (or, more precisely, a slight under-estimate of the total flux, related to the specific background estimation procedure Neronov and Semikoz (2020)). Full blue data points show the diffuse emission spectrum after subtraction of the isolated source contribution using Option 1. Subtraction using Option 2 gives a similar result. The spectrum exhibits a noticeable hardening above approximately 30 GeV energy. In this energy range the spectrum is consistent with a power-law with the slope , as clear from the plot representation in Fig. 2 in which the spectrum appears as a horizontal line. One can also notice that the Tibet-AS measurements in the same representation fall below the extrapolation of the power-law to the PeV band.
III Modelling
The simplest model of the combined Fermi/LAT and Tibet-AS diffuse -ray flux spectrum shown in Fig. 2 is that of -ray emission from neutral pion decays. As it is discussed above, the spectral extraction method used by Tibet-AS and implemented in our analysis for Fermi/LAT data boosts the pion decay component with respect to the inverse Compton flux component that might also contribute to the flux. However, already the non-boosted pion decay component is expected to largely dominate the inverse Compton component for the flux from the direction of the outer Galactic Plane Ackermann et al. (2012); Lipari and Vernetto (2018). The Bremsstrahlung component gives only a minor contribution to the flux and only in the GeV energy range and can also be neglected in the first approximation Ackermann et al. (2012). This is illustrated by the blue lines in Fig. 2, where we plot the pion decay, inverse Compton and Bremsstrahlung spectra corresponding to the local interstellar medium emissivity from Ref. Lipari and Vernetto (2018). The Solar system is located in the outer Galactic disk and the local emissivity can be considered representative for the emissivity across the outer Galactic disk. If the pion decay spectrum normalisation is fixed to match the Fermi/LAT data, the inverse Compton contribution to the flux is expected to be at a several percent level in the energy range of interest.
To model the pion decay flux from different cosmic ray nuclei we use AAfrag package Kachelrieß et al. (2019) based on the QGSJET-II-04m model. We combine AAfrag calculations in the energy range above 15 GeV with low energy parameterisations of Kamae et al. 2006 Kamae et al. (2006) to obtain the -ray spectrum for the full range of cosmic ray energies (the boundary between two models is shown with dashed gray line in Fig. 1). In our calculations we propose that the interstellar medium consists of 91% of hydrogen and 9% of helium. AAFrag package allows to calculate differential cross-section of -ray production separately for different cosmic-ray species while in the model of Kamae et al. 2006 only interactions are considered. To account for pHe, Hep and HeHe interactions at low energies, we calculated and applied an additional nuclear factor of 1.4 to the results of -ray production using Kamae et al. code for primary energy from the threshold energy to 15 GeV.
For our reference model we take local measurements of cosmic ray flux (proton and helium component measurements and our interpolation are summarized in Fig. 1). We complement the local flux measurements with a model of Local Interstellar spectrum (LIS) below 40 GeV to take into account the solar modulation effect Vos and Potgieter (2015). This model explains also the Voyager experimental data Stone et al. (2013).
It is important to notice that the local cosmic ray flux component measurements suffer from systematic uncertainties both in the energy range between the sub-TeV break and the knee and in the knee energy range (see Fig. 1). The discrepancy in the measurements of different experiments reaches a factor of 2 in the 100 TeV range (it is accounted within either systematic or statistical uncertainty, depending on experiment). In the knee energy range, even though the total flux measurements of different experiments agree with each other, measurements of the spectra of different nuclei are inconsistent. This is illustrated in the top panel of Fig. 1 in which one can see that KASCADE and IceTop measurements of the proton knee are inconsistent with each other.
Assuming that measurements of all experiments agree at approximately TeV energy (see Fig. 1), a factor-of-two difference in measurements of different experiments at 100 TeV corresponds to a uncertainty of the slope of the spectra of cosmic ray protons and nuclei in the 1–100 TeV energy range.
These uncertainties of the local cosmic ray spectrum measurements propagate into uncertainties of the pion decay -ray flux model. One of these uncertainties, of the energy of the proton knee, is illustrated in the model curves in Fig. 2. In this figure, the two dashed lines show models based on the local proton knee spectra from KASCADE and IceTop. One can clearly see that the two -ray flux models strongly differ exactly in the energy range of Tibet-AS. This indicates that the energy range covered by Tibet-AS (and LHAASO) is crucially important for exploration of the nature of the knee with -ray data.
Both models, based on KASCADE and IceTop measurements, under-predict the -ray flux, compared to the Tibet-AS measurement. However, as it is discussed above, the measurements of the local cosmic ray flux in the TeV-PeV range suffer from systematic uncertainties. The estimate of the pion decay flux in the PeV range vary depending on assumptions about the energy of the proton (and other nuclei) knee and on the slope of the spectra of cosmic ray flux components in 1–100 TeV range. It is thus worth exploring what kind of modifications of the cosmic ray spectral components can make the pion decay model consistent with the data.
All the cosmic ray nuclei spectra have a break at several hundred GV rigidity. The simplest possibility (theoretically motivated) is that the slopes of the average cosmic ray nuclei spectra above the break are the same. We consider this possibility by modifying the slope of the proton spectrum by above a break at 100 GeV, by multiplying the proton flux by a broken powerlaw
| (1) |
After such a modification, the proton spectral models in the 1–100 TeV range match the shape of the helium spectrum, while the KASCADE and IceTop proton knees bracket the errorbars of the helium knee measurements with both KASCADE and IceTop, see Fig. 1. We call Model I the ”hardened” proton spectrum with the knee shape based on KASCADE data and Model II the model in which the knee shape is based on the IceTop data.
This modification of the proton spectrum increases the strength of the break in the -ray spectrum at approximately 1–30 GeV energy and makes the pion decay spectrum in the energy range above 30 GeV consistent with Fermi/LAT measurements (see Fig. 2). The model solid lines in Fig. 2 show the pion decay flux in the modified proton spectrum model for the two knee models based on KASCADE and IceTop data.
One can see that after such minor modification, the model -ray spectra for both KASCADE-based and IceTop-based composition models provide a satisfactory description of the joint Fermi/LAT Tibet-AS -ray spectrum.
IV Discussion
The analysis presented above allows us to formulate a hypothesis that the average cosmic ray proton and helium spectra in the outer Galactic disk have identical shape in the TV-PV rigidity range, with the average proton spectrum being somewhat harder than the locally measured proton spectrum, but consistent with local helium spectrum. Within such a hypothesis, the spectrum of diffuse -ray emission from the dense part of the Galactic disk in the longitude range is well described by the pion decay model over the entire GeV-PeV range covered by Fermi/LAT and Tibet-AS.
An attractive property of this hypothesis is that the identical shapes of the proton and helium spectra are expected on theoretical grounds. Both the acceleration and propagation physical mechanisms are typically sensitive for particle rigidity and hence the spectra of different cosmic ray nuclei coming from certain source type are expected to be identical as a function of rigidity.
Indication of harder average slope of the cosmic ray spectrum with the slope in the Galactic disk have been previously found in Fermi/LAT data Neronov and Malyshev (2015); Yang et al. (2016); Acero et al. (2016); Gaggero et al. (2015). The results presented here reveal additional evidence for this possibility and add new details. Fits to the spectra of diffuse -ray emission from the inner Galactic disk indicate that in this part of the Galaxy the data are consistent with the cosmic ray spectrum slope all over the GV-PV energy range. This is not the case locally and it seems to be not the case for the cosmic ray spectrum in the outer Galactic disk. Instead, in the outer Galactic disk the cosmic ray spectrum hardens to the 2.5 slope only above several hundred GV rigidity.
The slope of the TV-PV cosmic ray spectrum is consistent with the model in which cosmic rays are accelerated by their sources with e.g. spectrum produced by shock acceleration and propagate in Galactic magnetic field with Kolmogorov turbulence, which will soften spectrum to . The spectral break at several hundred GV rigidity can be explained by several mechanisms: cosmic-ray induced turbulence Blasi et al. (2012); Aloisio and Blasi (2013), two-component halo model Tomassetti (2015) or by two or more source populations model Zatsepin and Sokolskaya (2006); Thoudam and Hörandel (2012). The discrepancy between locally measured and the average cosmic ray proton spectrum with the slope at TeV can be a local feature. This feature arises in anisotropic diffusion scenario Giacinti et al. (2018) in which small number of sources dominate the local cosmic ray flux in multi-TV range Kachelrieß et al. (2018); Bouyahiaoui et al. (2019, 2020).
Better information on variations of the spectrum of cosmic rays across the Galactic disk can be obtained with higher statistics measurements of the variations of the spectrum of diffuse emission from the Galactic disk as a function of Galactic longitude. Closing the gap in the measurements in 3–100 TeV energy range would also provide better quality measurement of the slope of the average cosmic ray spectrum in TV-PV rigidity range. This will be possible with the next generation -ray telescopes CTA and LHAASO. Fig. 2 shows the sensitivities of CTA-North Neronov and Semikoz (2020b) and LHAASO Neronov and Semikoz (2020a) to the diffuse -ray flux from the Galactic Plane. CTA-North will be able to close the 3–100 TeV gap and provide better separation between the truly diffuse and isolated source contributions to the -ray flux in the part of the Galactic Plane covered by Tibet-AS measurement. LHAASO will provide high-statistics measurements all the way up to the PeV range. This will allow to constrain the shape of the cosmic ray spectrum at the knee and to distinguish between different theoretical models of the knee: maximum energy of Galactic sources, influence of a single source, change of propagation regime.
If the diffuse -ray emission is produced by the pion decays, it is accompanied by the neutrino flux. The Tibet-AS measurement of the diffuse flux from the outer Galactic Plane is comparable to the IceCube measurement of the sky-average astrophysical neutrino flux Aartsen et al. (2013). This suggests that the neutrino counterpart of the Tibet-AS -ray flux measurement should be detectable with deeper IceCube exposure (currently a p-value is found for a specific template of the all-Galactic emission that includes the Galactic Plane Aartsen et al. (2019b)) and with Baikal-GVD Avrorin et al. (2020) and KM3Net Adrián-Martínez et al. (2016) neutrino telescopes. This makes the pion decay model of the diffuse -ray flux from the sky region , readily falsifiable.
After publication of Tibet-AS analysis Amenomori et al. (2021) several publications appeared which suggested possible hadronic Dzhatdoev (2021); Qiao et al. (2021); Liu and Wang (2021) or leptonic Fang and Murase (2021) contributions to Tibet-AS data. Main difference of our analysis from other approaches is that we consider constraints imposed by the Fermi/LAT data up to TeV energies and concentrate on the conservative pion-decay dominated model of emission from the Galactic disk.
V Acknowledgments
Work of A.N. and D.S. was supported in part by the Ministry of science and higher education of Russian Federation under the contract 075-15-2020-778 in the framework of the Large scientific projects program within the national project ”Science”.
References
- Amenomori et al. (2021) M. Amenomori, Y. W. Bao, X. J. Bi, D. Chen, T. L. Chen, W. Y. Chen, X. Chen, Y. Chen, Cirennima, S. W. Cui, et al., Physical Review Letters 126, 141101 (2021).
- Aguilar et al. (2020) M. Aguilar, L. Ali Cavasonza, G. Ambrosi, L. Arruda, N. Attig, F. Barao, L. Barrin, A. Bartoloni, S. Başeğmez-du Pree, J. Bates, et al., Physics Reports 894, 1 (2020).
- Yoon et al. (2017) Y. S. Yoon, T. Anderson, A. Barrau, N. B. Conklin, S. Coutu, L. Derome, J. H. Han, J. A. Jeon, K. C. Kim, M. H. Kim, et al., The Astrophysical Journal 839, 5 (2017), eprint 1704.02512.
- Panov et al. (2009) A. D. Panov, J. H. Adams, H. S. Ahn, G. L. Bashinzhagyan, J. W. Watts, J. P. Wefel, J. Wu, O. Ganel, T. G. Guzik, V. I. Zatsepin, et al., Bulletin of the Russian Academy of Sciences: Physics 73, 564 (2009).
- An et al. (2019) Q. An, R. Asfandiyarov, P. Azzarello, P. Bernardini, X. J. Bi, M. S. Cai, J. Chang, D. Y. Chen, H. F. Chen, J. L. Chen, et al., Science Advances 5, eaax3793 (2019).
- Alemanno et al. (2021) F. Alemanno, Q. An, P. Azzarello, F. C. T. Barbato, P. Bernardini, X. J. Bi, M. S. Cai, E. Catanzani, J. Chang, D. Y. Chen, et al., Physical Review Letters 126, 201102 (2021), eprint 2105.09073.
- Adriani et al. (2019) O. Adriani et al. (CALET), Phys. Rev. Lett. 122, 181102 (2019), eprint 1905.04229.
- Grebenyuk et al. (2019) V. Grebenyuk, D. Karmanov, I. Kovalev, I. Kudryashov, A. Kurganov, A. Panov, D. Podorozhny, A. Tkachenko, L. Tkachev, A. Turundaevskiy, et al., Advances in Space Research 64, 2546 (2019).
- Aartsen et al. (2019a) M. G. Aartsen, M. Ackermann, J. Adams, J. A. Aguilar, M. Ahlers, M. Ahrens, C. Alispach, K. Andeen, T. Anderson, I. Ansseau, et al., Physical Review D 100, 82002 (2019a), eprint 1906.04317.
- Apel et al. (2013) W. D. Apel, J. C. Arteaga-Velázquez, K. Bekk, M. Bertaina, J. Blümer, H. Bozdog, I. M. Brancus, E. Cantoni, A. Chiavassa, F. Cossavella, et al., Astroparticle Physics 47, 54 (2013), eprint 1308.2098.
- Antoni et al. (2005) T. Antoni et al. (KASCADE), Astropart. Phys. 24, 1 (2005), eprint astro-ph/0505413.
- Amenomori et al. (2008) M. Amenomori et al. (TIBET III), Astrophys. J. 678, 1165 (2008), eprint 0801.1803.
- Abbasi et al. (2018) R. U. Abbasi et al. (Telescope Array), Astrophys. J. 865, 74 (2018), eprint 1803.01288.
- Adriani et al. (2011) O. Adriani, G. C. Barbarino, G. A. Bazilevskaya, R. Bellotti, M. Boezio, E. A. Bogomolov, L. Bonechi, M. Bongi, V. Bonvicini, S. Borisov, et al., Science 332, 69 (2011), eprint 1103.4055.
- Kachelriess and Semikoz (2019) M. Kachelriess and D. V. Semikoz, Prog. Part. Nucl. Phys. 109, 103710 (2019), eprint 1904.08160.
- Stanev et al. (1993) T. Stanev, P. L. Biermann, and T. K. Gaisser, A&A 274, 902 (1993), eprint astro-ph/9303006.
- Stanev et al. (1993) T. Stanev, P. L. Biermann, and T. K. Gaisser, Astron. Astrophys. 274, 902 (1993), eprint astro-ph/9303006.
- Drury et al. (2003) L. O. Drury, E. van der Swaluw, and O. Carroll (2003), eprint astro-ph/0309820.
- Cardillo et al. (2015) M. Cardillo, E. Amato, and P. Blasi, Astropart. Phys. 69, 1 (2015), eprint 1503.03001.
- Syrovatskii (1971) S. I. Syrovatskii, Comments on Astrophysics and Space Physics 3, 155 (1971).
- Giacinti et al. (2014) G. Giacinti, M. Kachelrieß, and D. V. Semikoz, Phys. Rev. D 90, 041302(R) (2014), eprint 1403.3380.
- Giacinti et al. (2015) G. Giacinti, M. Kachelrieß, and D. V. Semikoz, Phys. Rev. D 91, 083009 (2015), eprint 1502.01608.
- Erlykin and Wolfendale (2001) A. D. Erlykin and A. W. Wolfendale, Journal of Physics G Nuclear Physics 27, 959 (2001).
- Bouyahiaoui et al. (2019) M. Bouyahiaoui, M. Kachelriess, and D. V. Semikoz, JCAP 01, 046 (2019), eprint 1812.03522.
- Giacinti et al. (2018) G. Giacinti, M. Kachelriess, and D. V. Semikoz, JCAP 07, 051 (2018), eprint 1710.08205.
- Bartoli et al. (2015) B. Bartoli, P. Bernardini, X. J. Bi, Z. Cao, S. Catalanotti, S. Z. Chen, T. L. Chen, S. W. Cui, B. Z. Dai, A. D’Amone, et al., Phys. Rev. D 92, 092005 (2015), eprint 1502.03164.
- Lipari and Vernetto (2020) P. Lipari and S. Vernetto, Astropart. Phys. 120, 102441 (2020), eprint 1911.01311.
- Neronov et al. (2012) A. Neronov, D. V. Semikoz, and A. M. Taylor, Phys. Rev. Lett. 108, 051105 (2012), eprint 1112.5541.
- Neronov and Malyshev (2015) A. Neronov and D. Malyshev, arXiv e-prints arXiv:1505.07601 (2015), eprint 1505.07601.
- Yang et al. (2016) R. Yang, F. Aharonian, and C. Evoli, Phys. Rev. D 93, 123007 (2016), eprint 1602.04710.
- Neronov et al. (2017) A. Neronov, D. Malyshev, and D. V. Semikoz, A&A 606, A22 (2017), eprint 1705.02200.
- Neronov and Semikoz (2020a) A. Neronov and D. Semikoz, Phys. Rev. D 102, 043025 (2020a), eprint 2001.11881.
- Ackermann et al. (2012) M. Ackermann, M. Ajello, W. B. Atwood, L. Baldini, J. Ballet, G. Barbiellini, D. Bastieri, K. Bechtol, R. Bellazzini, B. Berenji, et al., Astrophys. J. 750, 3 (2012), eprint 1202.4039.
- Acero et al. (2016) F. Acero, M. Ackermann, M. Ajello, A. Albert, L. Baldini, J. Ballet, G. Barbiellini, D. Bastieri, R. Bellazzini, E. Bissaldi, et al., Ap.J.Supp. 223, 26 (2016), eprint 1602.07246.
- Lipari and Vernetto (2018) P. Lipari and S. Vernetto, Phys. Rev. D 98, 043003 (2018), eprint 1804.10116.
- Neronov and Semikoz (2020b) A. Neronov and D. Semikoz, Astron. Astrophys. 637, A44 (2020b), eprint 2001.00922.
- Neronov and Semikoz (2020) A. Neronov and D. Semikoz, A&A 633, A94 (2020), eprint 1907.06061.
- Kachelrieß et al. (2019) M. Kachelrieß, I. V. Moskalenko, and S. Ostapchenko, Computer Physics Communications 245, 106846 (2019), eprint 1904.05129.
- Kamae et al. (2006) T. Kamae, N. Karlsson, T. Mizuno, T. Abe, and T. Koi, The Astrophysical Journal 647, 692 (2006), eprint 0605581.
- Vos and Potgieter (2015) E. E. Vos and M. S. Potgieter, The Astrophysical Journal 815, 119 (2015).
- Stone et al. (2013) E. C. Stone, A. C. Cummings, F. B. McDonald, B. C. Heikkila, N. Lal, and W. R. Webber, Science 341, 150 (2013).
- Gaggero et al. (2015) D. Gaggero, D. Grasso, A. Marinelli, A. Urbano, and M. Valli, Ap.J.Lett. 815, L25 (2015), eprint 1504.00227.
- Blasi et al. (2012) P. Blasi, E. Amato, and P. D. Serpico, Phys. Rev. Lett. 109, 061101 (2012), eprint 1207.3706.
- Aloisio and Blasi (2013) R. Aloisio and P. Blasi, JCAP 07, 001 (2013), eprint 1306.2018.
- Tomassetti (2015) N. Tomassetti, Phys. Rev. D 92, 081301(R) (2015), eprint 1509.05775.
- Zatsepin and Sokolskaya (2006) V. I. Zatsepin and N. V. Sokolskaya, Astron. Astrophys. 458, 1 (2006), eprint astro-ph/0601475.
- Thoudam and Hörandel (2012) S. Thoudam and J. R. Hörandel, Monthly Notices of the Royal Astronomical Society 421, 1209–1214 (2012), ISSN 0035-8711, URL http://dx.doi.org/10.1111/j.1365-2966.2011.20385.x.
- Kachelrieß et al. (2018) M. Kachelrieß, A. Neronov, and D. V. Semikoz, Phys. Rev. D 97, 063011 (2018), eprint 1710.02321.
- Bouyahiaoui et al. (2020) M. Bouyahiaoui, M. Kachelrieß, and D. V. Semikoz, Phys. Rev. D 101, 123023 (2020), eprint 2001.00768.
- Aartsen et al. (2013) M. G. Aartsen et al. (IceCube), Science 342, 1242856 (2013), eprint 1311.5238.
- Aartsen et al. (2019b) M. G. Aartsen, M. Ackermann, J. Adams, J. A. Aguilar, M. Ahlers, M. Ahrens, C. Alispach, K. Andeen, T. Anderson, I. Ansseau, et al., The Astrophysical Journal 886, 12 (2019b), URL https://doi.org/10.3847/1538-4357/ab4ae2.
- Avrorin et al. (2020) A. V. Avrorin, A. D. Avrorin, V. M. Aynutdinov, R. Bannasch, Z. Bardacova, I. A. Belolaptikov, V. B. Brudanin, N. M. Budnev, A. R. Gafarov, K. V. Golubkov, et al., Physics of Atomic Nuclei 83, 916 (2020).
- Adrián-Martínez et al. (2016) S. Adrián-Martínez, M. Ageron, F. Aharonian, S. Aiello, A. Albert, F. Ameli, E. Anassontzis, M. Andre, G. Androulakis, M. Anghinolfi, et al., Journal of Physics G: Nuclear and Particle Physics 43, 084001 (2016), URL https://doi.org/10.1088/0954-3899/43/8/084001.
- Dzhatdoev (2021) T. A. Dzhatdoev (2021), eprint 2104.02838.
- Qiao et al. (2021) B.-Q. Qiao, W. Liu, M.-J. Zhao, X.-J. Bi, and Y.-Q. Guo (2021), eprint 2104.03729.
- Liu and Wang (2021) R.-Y. Liu and X.-Y. Wang (2021), eprint 2104.05609.
- Fang and Murase (2021) K. Fang and K. Murase (2021), eprint 2104.09491.