Université de Toulouse, UPS, 31062 Toulouse, France
11email: justin.loye@irit.fr
22institutetext: Laboratoire de Physique Théorique, Université de Toulouse, CNRS, UPS, 31062 Toulouse, France
22email: dima@irsamc.ups-tlse.fr
33institutetext: Institut de Recherche en Informatique de Toulouse,
Université de Toulouse, Toulouse INP, 31071 Toulouse, France
33email: katia.jaffresrunser@irit.fr
Post-Brexit power of European Union
from the world trade network analysis
Abstract
We develop the Google matrix analysis of the multiproduct world trade network obtained from the UN COMTRADE database in recent years. The comparison is done between this new approach and the usual Import-Export description of this world trade network. The Google matrix analysis takes into account the multiplicity of trade transactions thus highlighting in a better way the world influence of specific countries and products. It shows that after Brexit, the European Union of 27 countries has the leading position in the world trade network ranking, being ahead of USA and China. Our approach determines also a sensitivity of trade country balance to specific products showing the dominant role of machinery and mineral fuels in multiproduct exchanges. It also underlines the growing influence of Asian countries.
Keywords:
International trade Google matrix Complex networks.1 Introduction
The European Union (EU) is now composed from 27 countries and is considered as a major world leading power [1]. January 2021 has seen Brexit officially taking place, triggering the withdrawal of the United Kingdom (UK) from EU [2]. This event has important political, economical and social effects. Here we project and study its consequences from the view point of international trade between world countries. Our analysis is based on the UN COMTRADE database [3] for the multiproduct trade between world countries in recent years. From this database we construct the world trade network (WTN) and evaluate the influence and trade power of specific countries using the Google matrix analysis of the WTN. We consider 27 EU countries as a single trade player having the trade exchange between EU and other countries. Our approach uses the Google matrix tools and algorithms developed for the WTN [4, 5, 6, 7] and other complex directed networks [8, 9]. The efficiency of the Google matrix and PageRank algorithms is well known from the World Wide Web network analysis [10, 11].
Our study shows that the Google matrix approach (GMA) allows to characterize in a more profound manner the trade power of countries compared to the usual method relying on import and export analysis (IEA) between countries. GMA’s deeper analysis power originates in the fact that it accounts for the multiplicity of transactions between countries while IEA only takes into account the effect of one step (direct link or relation) transactions. In this paper, we show that the world trade network analysis with GMA identifies EU as the first trade player in the world, well ahead of USA and China.
This paper is structured in the following way. Section 2 introduces first the UN COMTRADE dataset, and then gives a primer on the tools related to Google matrix analysis such as the trade balance metric and the REGOMAX algorithm. In Section 3, the central results of this papers are presented, which are discussed in 4.
2 Data sets, algorithms and methods
We use the UN COMTRADE data [3] for years 2012, 2014, 2016 and 2018 to construct the trade flows of the multiproduct WTN following the procedure detailed in [5, 6]. This paper gives the results for year 2018 only, others are to be found at [12]. Each year is presented by a money matrix, , giving the export flow of product from country to country (transactions are expressed in USD of current year). The data set is given by countries and territories (27 EU countries are considered as one country) and principal type of products (see the lists in [4, 6]). These 10 products are: Food and live animals (0); Beverages and tobacco (1); Crude materials, inedible, except fuels (2); Mineral fuels etc (3); Animal and vegetable oils and fats (4); Chemicals and related products, n.e.s. (5); Basic manufactures (6); Machinery, transport equipment (7); Miscellaneous manufactured articles (8); Goods not classified elsewhere (9) (product index is given in brackets). They belong to the Standard International Trade Classification (SITC Rev. 1) Thus the total Google matrix size is given by all system nodes including countries and products.
The Google matrix of direct trade flows is constructed in a standard way described in detail at [5, 6]: monetary trade flows from a node to node are normalized to unity for each column thus given the matrix of Markov transitions for trade, the columns of dangling nodes with zero transactions are replaced by a column with all elements being . The weight of each product is taken into account via a certain personalized vector taking into account the weight of each product in the global trade volume. We use the damping factor . The Google matrix is where are components of positive column vectors called personalization vectors which take into account the weight of each product in the global trade (). We also construct the matrix for the inverted trade flows.
The stationary probability distribution described by is given by the PageRank vector with maximal eigenvalue : [8, 10, 11]. In a similar way, for the inverted flow, described by , we have the CheiRank vector , being the eigenvector of . PageRank and CheiRank indexes are obtained from monotonic ordering of probabilities of PageRank vector and of CheiRank vector as and with . The sums over all products gives the PageRank and CheiRank probabilities of a given country as and (and in a similar way product probabilities ) [5, 6]. Thus with these probabilities we obtain the related indexes . We also define from import and export trade volume the probabilities , , , , , and corresponding indexes , , , , , (these import and export probabilities are normalized to unity by the total import and export volumes, see details in [5, 6]). It is useful to note that qualitatively PageRank probability is proportional to the volume of ingoing trade flow and CheiRank respectively to outgoing flow. Thus, we can approximately consider that the high import gives a high PageRank probability and a high export a high CheiRank probability.
As in [5, 6], we define the trade balance of a given country with PageRank and CheiRank probabilities given by . Also we have from ImportRank and ExportRank probabilities as . The sensitivity of trade balance to the price of energy or machinery can be obtained from the change of corresponding money volume flow related to SITC Rev.1 code (mineral fuels) or (machinery) by multiplying it by , renormalizing column to unity and computing all rank probabilities and the derivatives .
We also use the REGOMAX algorithm [9, 6] to construct the reduced Google matrix for a selected subset of WTN nodes . This algorithm takes into accounts all transitions of direct and indirect pathways happening in the full Google matrix between nodes of interest. We use this matrix to construct a reduced network of most strong transitions (“network of friends”) between a selection of nodes representing countries and products.
Even if Brexit enter into play in 2021, we use UN COMTRADE data of previous years to make a projecting analysis of present and future power of EU composed of 27 countries.
Finally we note that GMA allows to obtain interesting results for various types of directed networks including Wikipedia [13, 14] and protein-protein interaction [15, 16] networks.
| Rank | PageRank | CheiRank | ImportRank | ExportRank |
|---|---|---|---|---|
| 1 | EU | EU | EU | China |
| 2 | USA | China | USA | EU |
| 3 | China | USA | China | USA |
| 4 | United Kingdom | Japan | Japan | Japan |
| 5 | India | Repub Korea | United Kingdom | Repub Korea |
| 6 | U Arab Emirates | India | Repub Korea | Russia |
| 7 | Japan | Russia | India | United Kingdom |
| 8 | Mexico | U Arab Emirates | Canada | Mexico |
| 9 | Repub Korea | Singapore | Mexico | Canada |
| 10 | Canada | United Kingdom | Singapore | Singapore |
| 11 | Singapore | South Africa | Switzerland | Switzerland |
| 12 | Switzerland | Thailand | U Arab Emirates | India |
| 13 | Turkey | Malaysia | Russia | Malaysia |
| 14 | Russia | Canada | Thailand | Australia |
| 15 | Australia | Mexico | Viet Nam | U Arab Emirates |
| 16 | South Africa | Turkey | Australia | Thailand |
| 17 | Thailand | Australia | Turkey | Saudi Arabia |
| 18 | Brazil | Switzerland | Malaysia | Viet Nam |
| 19 | Saudi Arabia | Brazil | Indonesia | Brazil |
| 20 | Malaysia | Saudi Arabia | Brazil | Indonesia |
3 Results
3.1 CheiRank and PageRank of countries
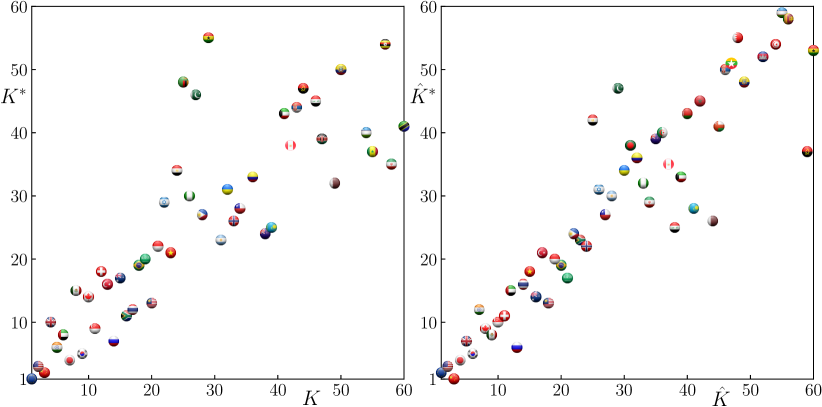
The positions of countries on the PageRank-CheiRank and ImportRank-ExportRank planes are shown in Fig. 1 and in Table 1. These results show a significant difference between these two types of ranking. Indeed, EU takes the top PageRank-CheiRank position while with Export-Import Ranking it has only , with USA at and China at . Thus EU takes the leading positions in the GMA frame which takes into account the muliplicity of trade transactions and characterizes the robust features of EU trade relations. Also GMA shows that UK position is significantly weakened compared to IEA description (thus UK moves from in IEA to in GMA). From this data, we see also examples of other countries that significantly improve there rank positions in GMA frame compared to IEA: India (, , , ), United Arab Emirates (, , , ), South Africa (, , , ). We attribute this to well developed, deep and broad trade network of these countries which are well captured by GMA in contrast to IEA. Indeed, IEA only measures the volume of direct trade exchanges, while GMA characterises the multiplicity of trade chains in the world.
3.2 Trade balance and its sensitivity to product prices
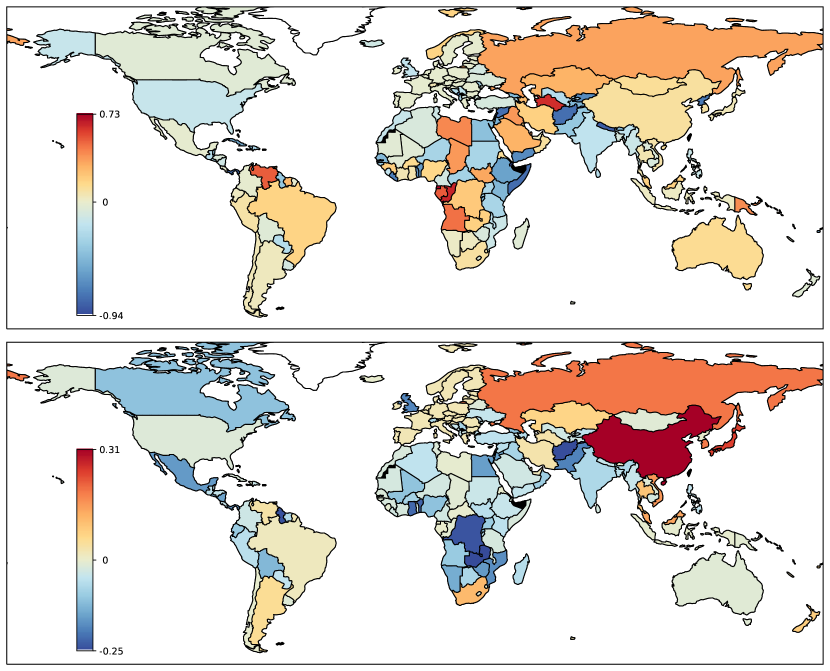
The trade balance of countries in IEA and GMA frames is shown in Fig. 2. The countries with 3 strongest positive balance are: Equatorial Guinea (), Congo (), Turkmenistan () in IEA and China (), Japan (), Russia () in GMA. We see that IEA marks top countries which have no significant world power while GMA marks countries with real significant world influence. For EU and UK we have respectively (EU) and (UK) in IEA; GMA. Thus the UK trade balance is significantly reduced in GMA corresponding to a loss of network trade influence of UK in agreement with data of Fig. 1 and Table 1. (We note that the balance variation bounds in GMA are smaller compared to IEA; we attribute this to the fact of multiplicity of transactions in GMA that smooth various fluctuations which are more typical for IEA).
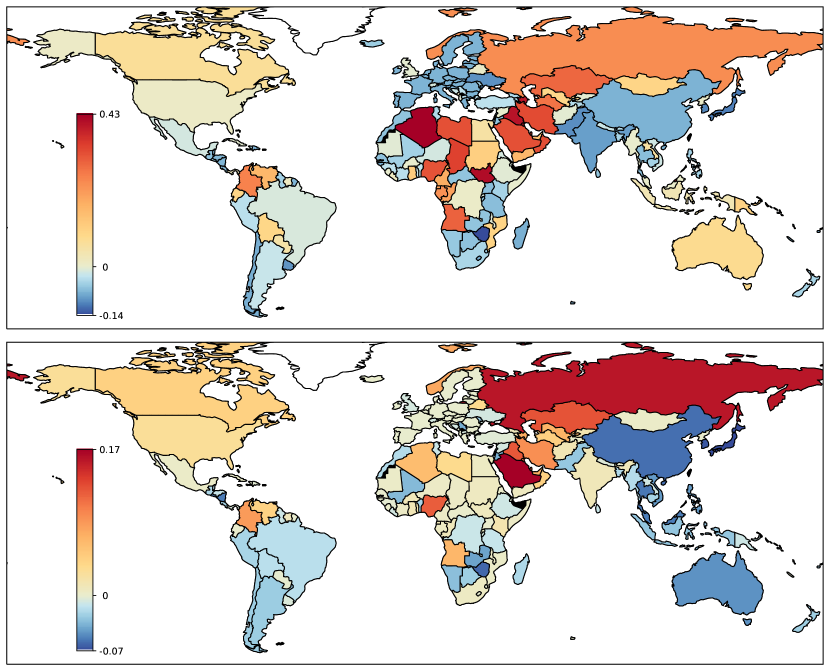
The balance sensitivity to product (mineral fuels (with strong petroleum and gas contribution)) is shown in Fig. 3. The top 3 strongest positive sensitivities are found for Algeria (0.431), Brunei (0.415), South Sudan (0.411) in IEA and Saudi Arabia (0.174), Russia (0.161), Kazakhstan (0.126) in GMA. The results of GMA are rather natural since Saudi Arabia, Russia and Kazakhstan are central petroleum producers. It is worth noting that GMA ranks Iraq at the 4th position. The 3 strongest negative sensitivities are Zimbabwe (-0.137), Nauru (-0.131), Japan (-0.106), in IEA and Japan (-0.066), Korea (-0.062), Zimbabwe (-0.058), in GMA. For China, India we have values being respectively: -0.073, -0.086 in IEA and -0.056, 0.010 in GMA. This shows that the trade network of India is more stable to price variations of product . These results demonstrate that GMA selects more globally influential countries.
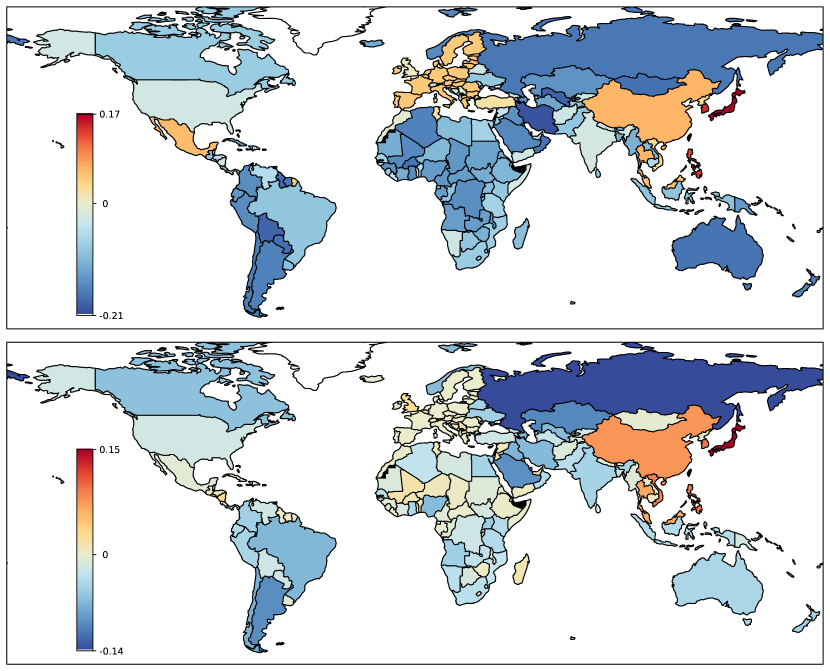
The balance sensitivity to product (machinery) is shown in Fig. 4. Here the top 3 strongest positive sensitivities are found in both IEA and GMA for Japan (respectively 0.167, 0.151), Repub. Korea (0.143, 0.097), Philippines (0.130, 0.091). The 3 strongest negative sensitivities are Brunei (-0.210), Iran (-0.202), Uzbekistan (-0.190) in IEA and Russia (-0.138), Kazakhstan (-0.102), Argentina (-0.097) in GMA. Thus we again see that GMA selects more globally influential countries. The sensitivity values for EU, UK, China, Russia, USA are: EU (0.048), UK (0.006), China (0.065), Russia (-0.170), USA (-0.027) in IEA; EU (0.000), UK (0.024), China (0.077), Russia (-0.138), USA (-0.018) in GMA. Latter GMA results show that even if machinery product () is very important for EU the network power of trade with this product becomes dominated by Asian countries Japan, Repub. Korea, China, Philippines; in this aspect the position of UK is slightly better than EU.
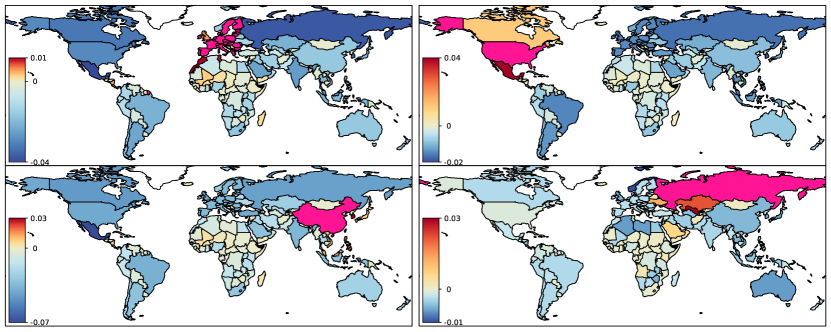
In Figs. 3 and 4, we have considered the sensitivity of country balance to a global price of a specific product (mineral fuel or machinery ). In contrast, with GMA, we can also obtain the sensitivity of country balance to the price of products originating from a specific country. Such results are shown in Fig. 5. They show that machinery () of EU gives a significant positive balance sensitivity for UK and negative for Russia. This indicates a strong dependence of Russia from EU machinery. Machinery of USA gives strong positive effect for Mexico and Canada with a negative effect for EU, Russia, Brazil, Argentina. Machinery of China gives positive sensitivity for Asian countries (Repub. Korea, Japan, Philippines) and significant negative effect for Mexico. Mineral fuels () of Russia gives positive effect for Kazakhstan, Uzbekistan, Ukraine (former USSR republics) and negative effect for competing petroleum and gas producers Norway and Algeria.
3.3 Network structure of trade from reduced Google matrix
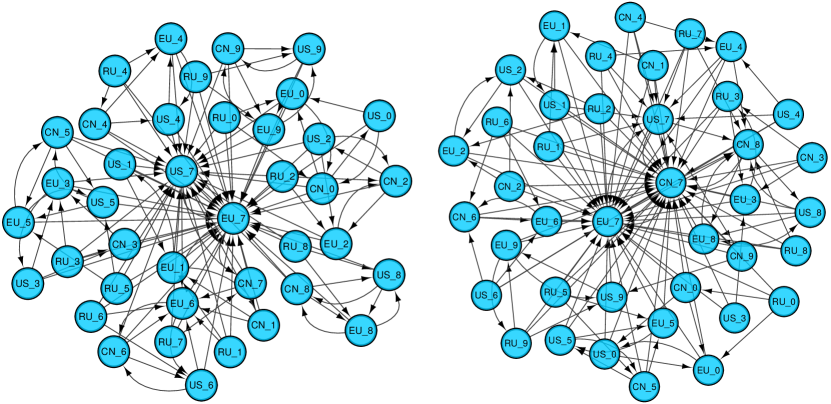
The network structure for 40 nodes of 10 products of EU, USA, China and Russia is shown in Fig. 6. It is obtained from the reduced Google matrix of nodes of global WTN network with nodes on the basis of REGOMAX algorithm which takes into account all pathways between nodes via the global network of nodes. The networks are shown for the direct ( matrix) and inverted ( matrix) trade flows. For each node we show only 4 strongest outgoing links (trade matrix elements) that heuristically can be considered as the four “best friends”. The resulting network structure clearly shows the central dominant role of machinery product. For ingoing flows (import direction) of the central dominance of machinery for USA and EU is directly visible while for outgoing flows (export direction), machinery of EU and China dominate exports.
It is interesting to note that the network influence of EU with 27 countries is somewhat similar to the one constituted by a kernel of 9 dominant EU countries (KEU9) (being Austria, Belgium, France, Germany, Italy, Luxembourg, Netherlands, Portugal, Spain) discussed in [7]. This shows the leading role played by these KEU9 countries in the world trade influence of EU.
Finally we note that additional data with figures and tables is available at [12].
4 Discussion
We presented the Google matrix analysis of multiproduct WTN obtained from UN COMTRADE database in recent years. In contrast to the legacy Import-Export characterization of trade, this new approach captures multiplicity of trade transactions between world countries and highlights in a better way the global significance and influence of trade relations between specific countries and products. The Google matrix analysis clearly shows that the dominant position in WTN is taken by the EU of 27 countries despite the leave of UK after Brexit. This result demonstrates the robust structure of worldwide EU trade. It is in contrast with the usual Import-Export analysis in which USA and China are considered as main players. We also see that machinery and mineral fuels products play a dominant role in the international trade. The Google matrix analysis stresses the growing dominance of machinery products of Asian countries (China, Japan, Republic of Korea).
We hope that the further development of Google matrix analysis of world trade will bring new insights in this complex system of world economy.
Acknowledgments: We thank Leonardo Ermann for useful discussions. This research has been partially supported through the grant NANOX ANR-17-EURE-0009 (project MTDINA) in the frame of the Programme des Investissements d’Avenir, France and in part by APR 2019 call of University of Toulouse and by Region Occitanie (project GoIA). We thank UN COMTRADE for providing us a friendly access to their detailed database.
References
- [1] European Union, https://europa.eu/european-union/about-eu/figures/economy˙en#trade (Accessed February (2021)).
- [2] Brexit, https://en.wikipedia.org/wiki/Brexit (Accessed February (2021)).
- [3] UN Comtrade database, https://comtrade.un.org/ (Accessed February (2021)).
- [4] Ermann L. and Shepelyansky D.L.: Google matrix of the world trade network, Acta Physica Polonica A 120, A158 (2011).
- [5] Ermann L. and Shepelyansky D.L.: Google matrix analysis of the multiproduct world trade network, Eur. Phys. J. B 88, 84 (2015).
- [6] Coquide C., Ermann L., Lages J. and Shepelyansky D.L.: Influence of petroleum and gas trade on EU economies from the reduced Google matrix analysis of UN COMTRADE data, Eur. Phys. J. B 92, 171 (2019).
- [7] Loye J., Ermann L. and Shepelyansky D.L.: World impact of kernel European Union 9 countries from Google matrix analysis of the world trade network, arXiv:2010.10962[cs.SI] (2020).
- [8] Ermann L., Frahm K.M. and Shepelyansky D.L.: Google matrix analysis of directed networks, Rev. Mod. Phys. 87, 1261 (2015).
- [9] Frahm K.M., Jaffres-Runser K. and Shepelyansky D.L.: Wikipedia mining of hidden links between political leaders, Eur. Phys. J. B 89, 269 (2016).
- [10] Brin S. and Page L.: The anatomy of a large-scale hypertextual Web search engine, Computer Networks and ISDN Systems 30, 107 (1998).
- [11] Langville A.M. and Meyer C.D.: Google’s PageRank and beyond: the science of search engine rankings, Princeton University Press, Princeton (2006).
- [12] Post-Brexit trade power of EU, https://www.quantware.ups-tlse.fr/QWLIB/euwtn (Accessed February (2021)).
- [13] Frahm K.M., El Zant S., Jaffres-Runser K. and Shepelyansky D.L.: Multi-cultural Wikipedia mining of geopolitics interactions leveraging reduced Google matrix analysis, Phys. Lett. A 381, 2677 (2017).
- [14] Coquide C. and Lewoniewski W.: Novel version of PageRank, CheiRank and 2DRank for Wikipedia in multilingual network using social impact, In: Abramowicz W., Klein G. (eds) Business Information Systems BIS, Lecture Notes in Business Information Processing 389, 319 (2020).
- [15] Lages J., Shepelyansky D.L. and Zinovyev A.: Inferring hidden causal relations between pathway members using reduced Google matrix of directed biological networks, PLoS ONE 13(1), e0190812 (2018).
- [16] Frahm K.M. and Shepelyansky D.L.: Google matrix analysis of bi-functional SIGNOR network of protein-protein interactions, Physica A 559, 125019 (2020).