20(1,1) A version of this manuscript is under review and consideration for publication
Bird-Area Water-Bodies Dataset (BAWD) and Predictive AI Model for Avian Botulism Outbreak (AVI-BoT)
Abstract
Avian botulism is a paralytic bacterial disease in birds often leading to high fatality. In-vitro diagnostic techniques such as Mouse Bioassay, ELISA, PCR are usually non-preventive, post-mortem in nature, and require invasive sample collection from affected sites or dead birds. In this study, we build a first-ever multi-spectral, remote-sensing imagery based global Bird-Area Water-bodies Dataset (BAWD) (i.e. fused satellite images of warm-water lakes/marshy-lands or similar water-body sites that are important for avian fauna) backed by on-ground reporting evidence of outbreaks. BAWD consists of 16 topographically diverse global sites monitored over a time-span of 4 years (2016-2021). We propose a first-ever Artificial Intelligence based (AI) model to predict potential outbreak of Avian botulism called AVI-BoT (Aerosol Visible, Infra-red (NIR/SWIR) and Bands of Thermal). We also train and investigate a simpler (5-band) Causative-Factor model (based on prominent physiological factors reported in literature) to predict Avian botulism. AVI-BoT demonstrates a training accuracy of 0.96 and validation accuracy of 0.989 on BAWD, far superior in comparison to our model based on causative factors. We also perform an ablation study and perform a detailed feature-space analysis. We further analyze three test case study locations - Lower Klamath National Wildlife Refuge and Langvlei and Rondevlei lakes where an outbreak had occurred, and Pong Dam where an outbreak had not occurred and confirm predictions with on-ground reportings. The proposed technique presents a scale-able, low-cost, non-invasive methodology for continuous monitoring of bird-habitats against botulism outbreaks with the potential of saving valuable fauna lives.
1 Introduction
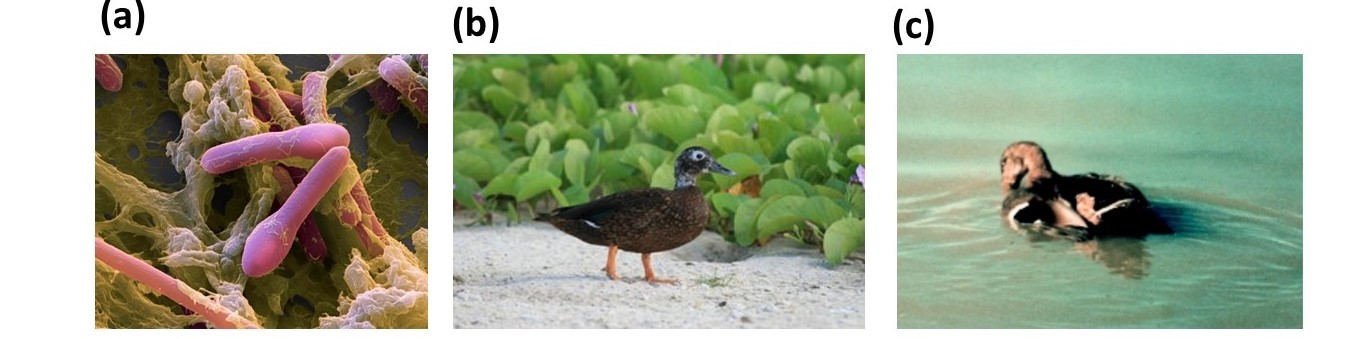
Avian botulism is a paralytic disease that fatally affects birds. It is caused by a bacterium, Clostridium botulinum, which produces a Botulinum neurotoxin, ingestion of which often leads to death in birds (Fig. 1). Botulism spores (resting stage of the bacteria) can persist in the soil and aquatic sediments of water bodies for decades before it enters the food webs of birds. Organisms like- algae, plants and invertebrates act as biotic reservoir for the disease and further fishes are known carriers of botulism spores1. Once the spores enter the food webs of birds, avian botulism spreads in a self-perpetuating manner via the maggot cycle. Maggots which feed on the dead birds, acquire the bacteria and are likely to be eaten by carnivorous birds. The carnivorous birds that die because of the bacteria present in maggots are then fed by other maggots and this way, the cycle continues. Avian botulism is prevalent all over the world, with higher prevalence over North American wetlands. In the previous century the disease has caused an estimated average death of about 644,000 birds per reported outbreak year in U.S.A. and Canada 2 alone. Some physiological conditions for the bacterium to develop are: low-oxygen, eutrophic zones, higher water temperatures, shallow stagnant water 3. Such non-exhaustive list of causative factors leading to Avian botulism outbreak is one of the key areas of current research 4. Some of the recent outbreaks in England (2018), Wales (2018) 3, Lower Klamath National Wildlife Refuge (2020) 5 resulted in bird casualty as high as 40,000.
Some of the widely known techniques to confirm the outbreak of Avian botulism are culture techniques 6, assay test for presence of toxin 7, PCR test 8 (See Table 1). Most of these techniques rely on actual ground level sample collection which is challenging due to the requirement of physical access. Further, all the aforementioned techniques are usually used as post-mortem tests 9, that is, used for detection of conditions only after clinical symptoms or deaths start getting reported from the location. Moreover, in some cases, post-mortem tests may be inconclusive and need to be backed by further laboratory confirmation which adds to the delay 9. This often leads governments and conservationists with little time for quick relief operations to save precious and endangered fauna.
In order to overcome some limitations of the clinical diagnostic methods, we present in this study a first-ever Bird-Area Water-Bodies Dataset (BAWD) (i.e. fused satellite images of warm-water lakes/marshy-land etc or similar water-body sites that are important for avian fauna) built from publicly available open-source satellite imagery. Our hand-annotated dataset consists of multi-spectral satellite images, covering a total ground area of 1039 sq. km, from two open source satellite projects (Sentinel and Landsat), covering 16 topographically diverse global bird-area water bodies from 4 continents, where locations are monitored over a time-span of 4 years (2016-2021). BAWD includes complete mapping between location scenes and ground-truth labels, backed by reporting of outbreaks.
Further, we propose a multi-spectral earth observation supervised CNN based detection model called AVI-BoT (Aerosol Visible Infra-red (both NIR and SWIR) - Bands of Thermal) to predict potential outbreak of Avian botulism. AVI-BoT takes fused multi-spectral satellite images as an input and generates a spatial prediction map depicting probability of an outbreak to occur. Satellite images in BAWD are composed of 10 remote sensing bands which capture the physio-chemical botulinum-promoting parameters such as pH, salinity, temperature among many others. We also train and investigate a simpler (5-band) Causative-Factor model (based on prominent physiological factors reported in literature as conducive for outbreak) to predict Avian botulism outbreak.
Paper Objective of Study Locations Covered Underlying Methodology Key Contribution 12 Detection 2 locations Mouse BioAssay (Clinical, Bio-chemical) Identification of the neurotoxin produced by Clostridium botulinum using mouse bioassay technique 7; 13 Detection - ELISA (Clinical, Bio-chemical) Identification of the neurotoxin produced by Clostridium botulinum using microplates 8 Detection - PCR (Clinical, Bio-chemical) Reviews PCR-based assay along with primers, sensitivity 14 Detection - Pre-PCR (Clinical, Bio-chemical) Optimized pre-PCR processing by proposing the use of liver This work Detection, Prediction of potential outbreaks 16 locations, 4 continents Salinity, Temperature, pH, Organic Matter (Earth observation based Computational-Deep Learning Network) Proposed use of AVI-BoT Model using temporal multispectral remote sensing data of 10-100m resolution from Sentinel 2 and Landsat 8
Further, three test locations at Lower Klamath National Wildlife Refuge (U.S.A., October 2020), Langvlei and Rondevlei Lakes (South Africa, January, February, May 2017) and Pong Dam (India, January 2021) are investigated using AVI-BoT. At the two former positive locations, AVI-BoT provides accurate forecasting of the outbreak, validated using field reporting and correctly predicts the latter location to be negative. We then carry out temporal analysis for Lower Klamath National Wildlife Refuge to investigate the formation of Avian botulism conducive conditions which exacerbated and resulted in mass die-offs. We also validate the predictions on Langvlei and Rondevlei Lakes with the on-ground actual reporting of bird mortality from a study conducted in 2017.
To take a closer look at the evolution of the feature representations learnt by AVI-BoT, we additionally train four direct spectral models: ((i) Aerosol, (ii) Visible (3-bands), (iii) IR (3-bands), and (iv) Thermal (3-bands)).
2 Methods
2.1 Bird-Area Water-Bodies Dataset (BAWD)
A multi-spectral spatio-temporal dataset spanning across 16 topographically diverse global locations (13 training and 3 test) comprising a total of 446 satellite images (429 training and 17 test images) of water bodies (rivers, lakes, ponds and wetlands) which are bird habitats, was built and manually annotated for this study (see Fig. 2). Fig. 2 (c) shows the spatial variability of the dataset. The images have been generated from Sentinel EO browser15. Among the 10 bands, 7 bands are raw spectral bands taken from Sentinel 2A after L2A processing. L2A processing takes as input L1C processed image which is radio-metrically and geometrically corrected (including orthorectification and spatial registration) and performs atmospheric corrections 16. The remaining 3 bands are thermal bands which have been taken from Landsat 8 or Sentinel 3. Sentinel-3 data was used wherever Landsat-8 data was cloudy or not available for dates of interest. Landsat 8 is preferred for thermal maps owing to its superior spatial resolution over Sentinel 3.
For building a robust model capable of predicting Avian botulism outbreak near/in water-bodies across seasonal variability, we collected positive and negative data spanning over a time-period of 3 years. Positive-labels denote conditions where Avian botulism exist while negative-labels denote non-existent botulism conditions. Positive labels were created on the basis of confirmed ground reports for the outbreak at any of the sites. The temporal spread of each positive label was adjusted over a span of three months (one month before and after) with respect to the ground reporting date of the outbreak since the conditions do not change overnight.
For samples labelled as negative, the locations are predominantly chosen from the list of Important Bird Areas (IBA) designated by BirdLife International 17. In some cases, confirmed news reportings stating a corrective action taken by the local authorities are also used for negative samples. Corrective actions include draining or flooding the wetland to change the environmental conditions sufficiently to stop the production of toxin by Clostridium botulinum. Three complex locations which have transitioned between ’outbreak’ and ’no outbreak’ have also been factored in the BAWD training dataset to account for complex cases. Table 2 details the locations and the dates for which the samples are collected along with ground reporting evidence for labelling the sample-type (i.e. positive or negative).
Positive Data Location Period of data collection Number of images Reported positive in: Bromley Oxidation Pond (New Zealand) Dec’17 - Mar’18 5 18 Firth of Thames (New Zealand) Dec’19 - Feb’20 99 19 Kaitaia (New Zealand) Jan’19 - Mar’19 7 20 Western Springs (New Zealand) Jan’18 - Feb’18 1 21 Kapiti Coast (New Zealand) Dec’17 - Mar’18 7 22 Lake Buloke (Australia) Jan’17 - Mar’17 6 23 North Canterbury (New Zealand) Jan’18 - Apr’18 18 24 Radipole Lake (United Kingdom) Aug’19 - Sept’19 30 25 Negative Data Location Period of data collection Number of images Reported negative in: Firth of Thames (New Zealand) June’17 ; Aug’18 ; June’19 - Aug’19 51 26 Lake Balaton (Hungary) Aug’18 - Sept’18 ; July’19 - Sept’19 62 1; 27 Lange Lacke (Austria) Dec’16 - Feb’17 ; July’17-Sept’17 24 28 Smith and Bybee (U.S.A.) Feb’18 -Mar’18 ;Feb’19 - Apr’19 26 29 San Carlos Reservoir (U.S.A.) Jan’19 - Dec’19 17 30 Radipole Lake (United Kingdom) Jan’18 - May’18; July’18 - Dec’18 12 31 North Canterbury (New Zealand) Jan’17-Feb’17; May’17; July’17; Oct’17-Dec’17 10 32 Lake Pakowki (Canada) Apr’18-Aug’18; Oct’18-Nov’18; Apr’19-Aug’19 54 33
2.2 CNN Training Methodology
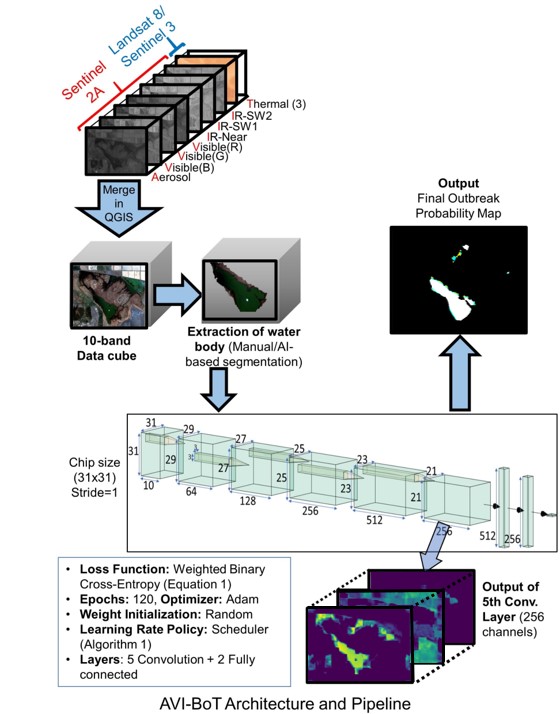
Each of the 10 bands (Table 3) is merged using QGIS34, and water area is extracted for each test case manually. The merge operation is carried out such that, the lowest resolution among the Sentinel 2A constituent bands is assigned to the output merged file. As shown in Table 3, Aerosol band (B01) has the lowest resolution among the Sentinel 2A bands, that is 60 m and it is assigned to the artificially synthesised data point. Further, water extraction can also be carried out by an automated deep-learning based segmentation network like UNet 35. Selective bands from this artificial data point serve as the input to the CNN in the various experiments.
Sensor Band Description Wavelength (m) Resolution (m) Parameters Dependence S2 1 Coastal/Aerosol 0.443 60 pH level, Redox potential, Presence of microbes & Water constituents 36; 37 S2 2 Blue 0.490 10 Chlorophyll concentration level, DOM, Salinity level 37; 38; 39 S2 3 Green 0.560 10 pH level, Chlorophyll concentration level, DOM, Salinity level 36; 37; 38; 39 S2 4 Red 0.665 10 pH level, Chlorophyll concentration level, Redox potential 36; 37; 40 S2 8a Vegetation Red Edge 0.865 20 pH level, Vegetation & Organic Matter 40 S2 11 SWIR 1.610 20 Dissolved Oxygen level, Vegetation & Organic Matter 37; 36 S2 12 SWIR 2.190 20 Vegetation & Organic Matter L8/S3 R Temperature⋆ - 100/1k Surface temperature 41 L8/S3 G Temperature⋆ - 100/1k Surface temperature 41 L8/S3 B Temperature⋆ - 100/1k Surface temperature 41
-
Causative Factors based model consists of 5 bands- algebraically calculated: (i) Salinity (ii) DOM and raw spectral bands (iii)-(v) Thermal bands
All models trained in this study use a binary classification deep CNN with AlexNet 42 as the base architecture. It comprises of 5 convolutional layers followed by 2 fully connected layers. For the purpose of training, each image in the dataset is divided into 31x31 chips. We get 942 chips from positive images and 2064 chips from negative images in the dataset. To account for the mismatch in number of positive and negative samples, higher weight is given to positive samples than negative samples in the loss function (shown in Eq.1).
| (1) |
Where:
: Weighted Binary Cross Entropy Loss per pixel
: True label for a pixel
: Predicted label for a pixel
: Weight assigned to positive training data
: Weight assigned to negative training data
Since the proportion of chips labelled as positive:negative is , thus the mismatch is accounted for by assigning and .
Further, the chips obtained are divided into 10:1 train : validation sets. The training parameters chosen are shown in Fig. 3.
The output of the network is a probability value that indicates the likelihood for occurrence of Avian botulism outbreak (ranging from 0 to 1). The output probability value for a chip is assigned to the center pixel of the chip. At the time of prediction, we divide an entire image of test location into 31x31 chips with stride size 1. Thus, the entire image is scanned and each pixel is assigned a probability. During the inference, care has been taken to extract the water mask manually using QGIS. As there is no one index that can be used to denote the presence of water especially in complex locations with presence of biomass in water body, we have used Normalized Difference Water Index (NDWI) as a guide to draw the manual mask. The NDWI map is calculated by Sentinel EO browser using the equation shown below:
| (2) |
where Band3 and Band8 are the respective bands captured by the Sentinel 2 satellite. Band3 corresponds to the Green Band and has a central wavelength of 0.56 m and Band8 corresponds to NIR band and has a central wavelength of 0.842 m. Sentinel EO browser considers a value of NDWI greater than 0.5 as a water body.
2.2.1 Causative Factors based Model
In this model, we combine the most crucial causative factors responsible for the outbreak in literature 44 i.e. salinity, temperature and dissolved organic matter (DOM). Equivalent band representations for the same are calculated as shown below:
Where Band2 and Band3 refer to Sentinel Bands as defined in Table 3.
2.2.2 AVI-BoT Model
Post exploration of the causative factors based model, we fuse multi-spectral bands from two different satellites to capture the impact of multiple relevant physio-chemical parameters listed in Table 3. Hence, we propose a multi-spectral earth observation based supervised CNN detection model called AVI-BoT (Aerosol Visible Infra-red (both NIR and SWIR) - Bands of Thermal) to predict potential outbreak of Avian botulism. While maintaining the tradeoff between the model size and useful features, the 10 constituent bands are carefully chosen to represent each of the wavelength bands (A,V,I,T) to remove redundancy while keeping the model size bounded. The bands - Aerosol (B01), Visible (B02-B04), NIR (B08a)-SWIR (B11,B12), Thermal (Heat maps) - capture physical, chemical and biological parameters where each of these respective ‘causative factors’ would contribute towards the decision of a potential ‘outbreak’ or ‘no-outbreak’. Fig. 3 depicts the methodology to synthesise the fused input for AVI-BoT Model and to generate a prediction on any test location.
3 Results
3.1 CNN Model Bench-marking
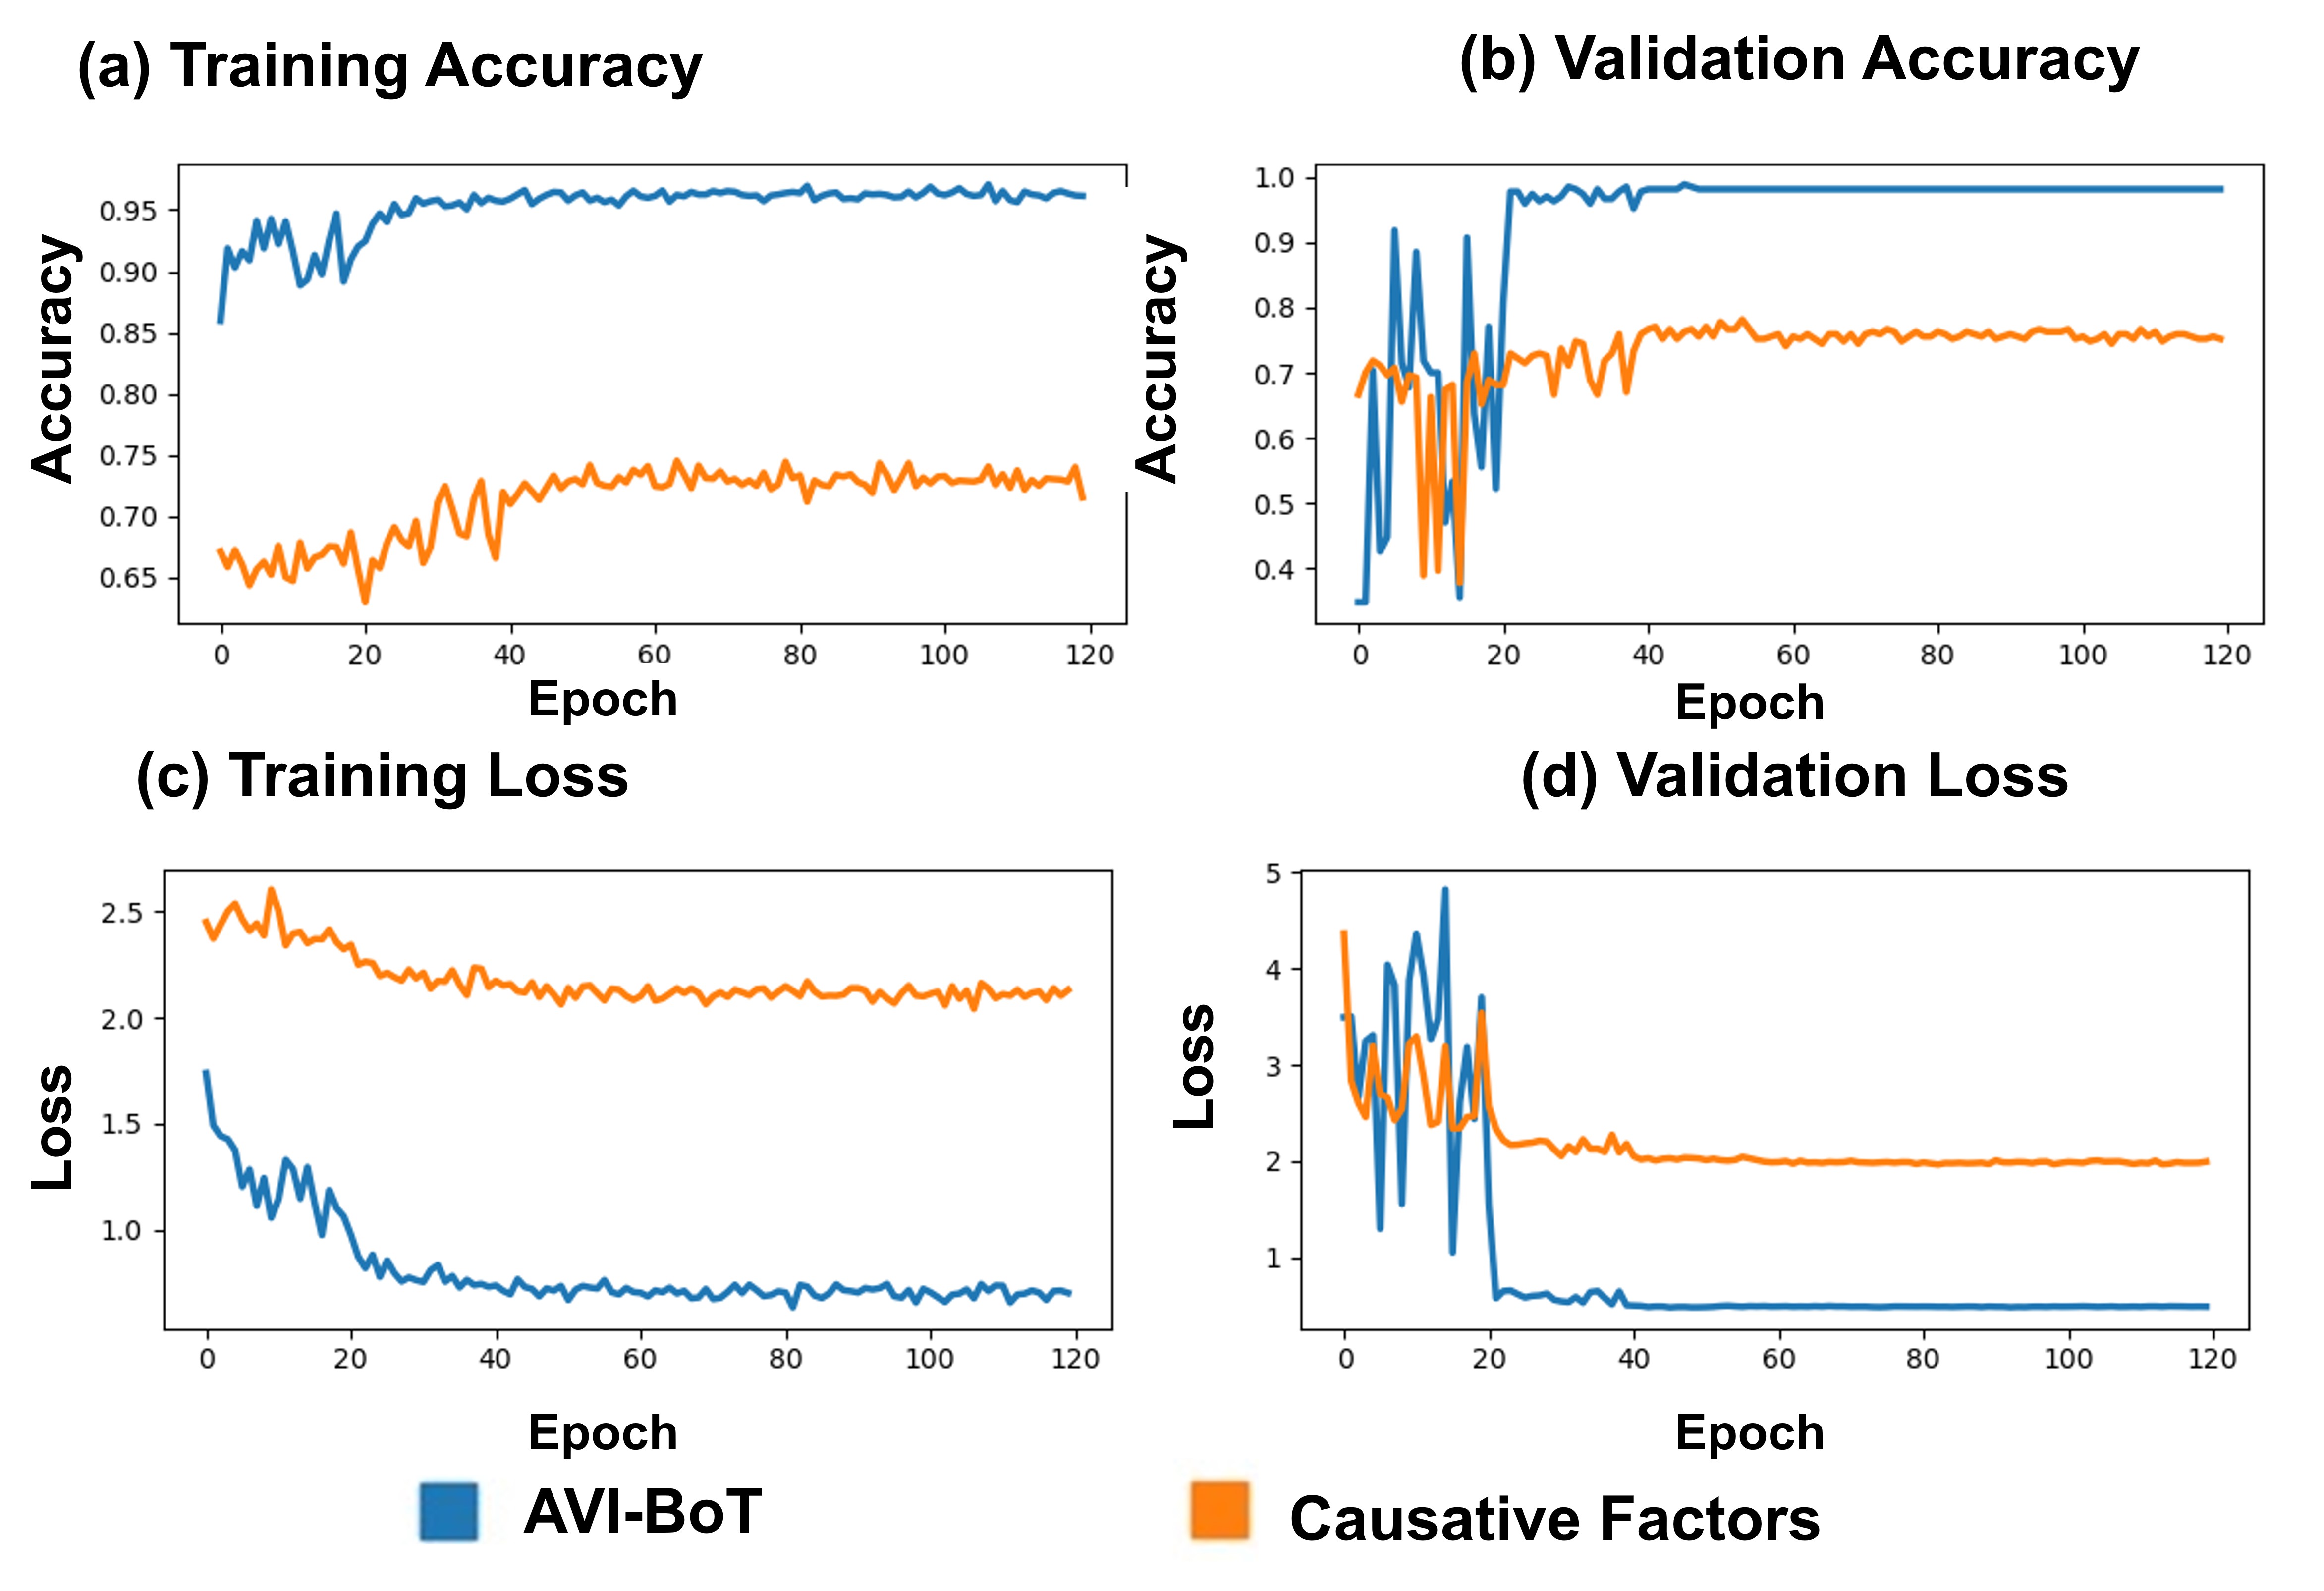
Fig. 4 shows the accuracy and loss plots for training and validation for the two proposed models: (i) Causative Factors based model (5-bands) and (ii) AVI-BoT model (10-bands). The Causative factors model based on factors inspired from literature shows inferior training and validation accuracy compared to AVI-BoT model, thereby necessitating the inclusion of multiple diverse spectral features (detailed in Table 3). The 10-band AVI-BoT model (which is a combination of aerosol, visible-spectra, NIR-SWIR, and thermal bands) capably combines all hypothesized factors in the feature representation and achieves a training accuracy of 0.96 and a validation accuracy of 0.989.
3.2 Test Case-Studies
To test the capability of the proposed AVI-BoT model, we analyzed three test locations. These locations include a variety of avian botulism situations - both positive and negative - to perform robust testing of the AVI-BoT model, as two of these locations show high incidence of Avian Botulism and the third was speculated to be a case of Avian Botulism before the final diagnosis came to be Avian Flu. The complexity of these locations arose from the dynamic and evolving on-ground situation, unexpectedly worsening within a matter of days, affecting a large number of birds before authorities could take action. It is noteworthy that in both the positive cases, none of the on-ground apparatus had reported even an inclination towards an impending outbreak. These test case-studies include:
3.2.1 Test Case Study I - Lower Klamath National Wildlife Refuge, USA
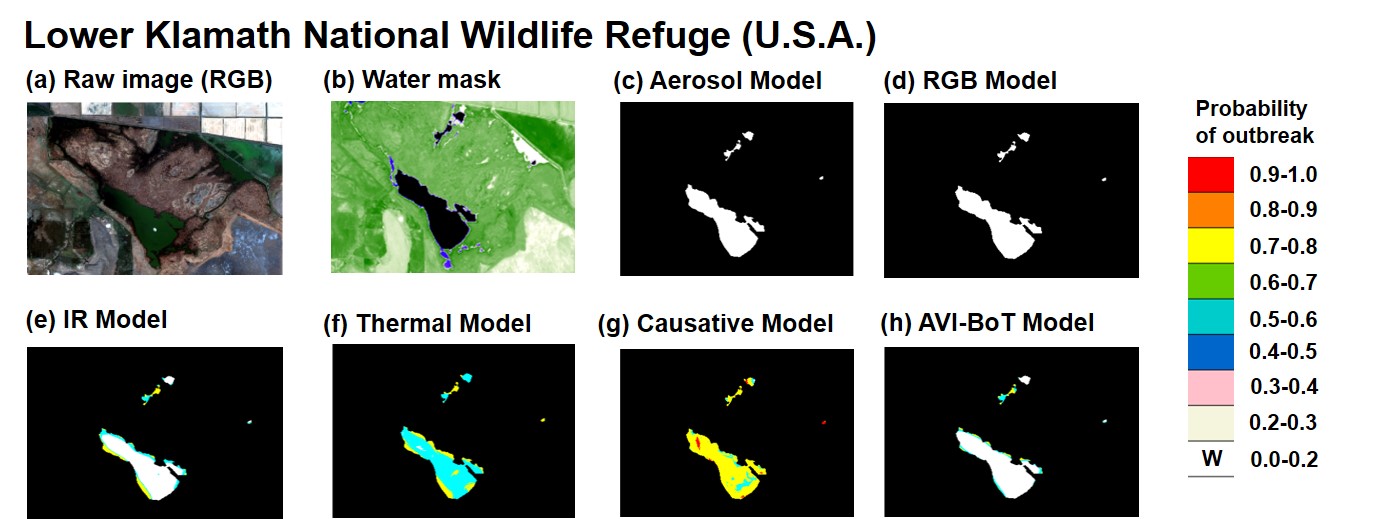
Lower Klamath National Wildlife Refuge (U.S.A.) witnessed an outbreak in October 2020 5. For this case study, we have conducted tests on Sheepy Lake, which forms a portion of the Lower Klamath National Wildlife Refuge. Fig. 5 (b) shows the water mask used for prediction in confirmation with NDWI mask. Aerosol model (Fig. 5 (c)) and Visible model (Fig. 5 (d)) do not yield a positive prediction while Thermal model (Fig. 5 (f)) and Causative Factors based model (Fig. 5 (g)) predict a blanket positive prediction. Only IR Model (Fig. 5 (e)) and AVI-BoT model (Fig. 5 (h)) predict the outbreak with spatial granularity. Another important point to note in Fig. 5(h) is that the AVI-BoT model predicts higher possibility of outbreak at the shoreline than at the center of the water body. This is in conformity with 47 stating that Avian botulism is a water’s edge disease, meaning that rarely are sick avi-fauna found away from the vegetation at the edge of the water or the original water’s edge.
For further analysis, we generated all year-round prediction maps using the proposed AVI-BoT model for 2019 shown in Table 4. Some key observations from this case study are:
-
1.
The winter months (December-March) are marked by low prevalence of Avian botulism outbreaks. (Table 4-(a), (b), (c), (l))
-
2.
As temperature begins to increase, the conditions turn conducive for the bacteria to develop, as evident from the increase in area with (probability 0.5) between April-June 2019. (Table 4 (d), (e), (f))
-
3.
During fall migration of birds (August-November), there exist news reporting 48 of avian botulism outbreak especially increasing in September 2019. The reason for this not showing up very effectively in the outbreak maps can be our reliance on NDWI maps since the water body could be having high levels of biomass which would result in shrinkage of ’water’ area as per NDWI map and consequently the AVI-BoT prediction maps would not generate prediction on the masked area. (Table 4 (h)-(i)).
- 4.
AVI-BoT generated Prediction Map
(a) 13 Jan ![[Uncaptioned image]](/html/2105.00924/assets/avibot/klamath/pred_13jan.png) (b) 19 Feb
(b) 19 Feb ![[Uncaptioned image]](/html/2105.00924/assets/avibot/klamath/pred_19feb.png) (c) 14 Mar
(c) 14 Mar ![[Uncaptioned image]](/html/2105.00924/assets/avibot/klamath/pred_14mar.png) (d) 18 Apr
(d) 18 Apr ![[Uncaptioned image]](/html/2105.00924/assets/avibot/klamath/pred_18apr.png) (e) 10 May
(e) 10 May ![[Uncaptioned image]](/html/2105.00924/assets/avibot/klamath/pred_10may.png) (f) 12 Jun
(f) 12 Jun ![[Uncaptioned image]](/html/2105.00924/assets/avibot/klamath/pred_12jun.png)
![[Uncaptioned image]](/html/2105.00924/assets/avibot/legend1.jpg) AVI-BoT Predicted Outbreak Probability
Low
Low
Low
Low-Moderate
Moderate-High
Moderate
Temp[Max,Min](C) Rainfall(mm)50
[5.9,-4.3]
92.7
[1.0,-8.1]
168.4
[7.6,-4.9]
55.4
[12.5,-0.1]
95.0
[16.8,2.1]
57.4
[22.6,4.4]
7.4
Possible hypothesis, qualitative analysis
No outbreak in winter months
No outbreak in winter months
No outbreak even with onset of summer
Temp. begins to rise, conditions may become favourable
Temp. further increases and with less inflow of fresh water, conditions remain favourable;
No cases reported
Conditions improve compared to May
AVI-BoT generated Prediction Map
(g) 19 Jul
AVI-BoT Predicted Outbreak Probability
Low
Low
Low
Low-Moderate
Moderate-High
Moderate
Temp[Max,Min](C) Rainfall(mm)50
[5.9,-4.3]
92.7
[1.0,-8.1]
168.4
[7.6,-4.9]
55.4
[12.5,-0.1]
95.0
[16.8,2.1]
57.4
[22.6,4.4]
7.4
Possible hypothesis, qualitative analysis
No outbreak in winter months
No outbreak in winter months
No outbreak even with onset of summer
Temp. begins to rise, conditions may become favourable
Temp. further increases and with less inflow of fresh water, conditions remain favourable;
No cases reported
Conditions improve compared to May
AVI-BoT generated Prediction Map
(g) 19 Jul ![[Uncaptioned image]](/html/2105.00924/assets/avibot/klamath/pred_19july.png) (h) 16 Aug
(h) 16 Aug ![[Uncaptioned image]](/html/2105.00924/assets/avibot/klamath/pred_16aug.png) (i) 12 Sep
(i) 12 Sep ![[Uncaptioned image]](/html/2105.00924/assets/avibot/klamath/pred_12sept.png) (j) 22 Oct
(j) 22 Oct ![[Uncaptioned image]](/html/2105.00924/assets/avibot/klamath/pred_22oct.png) (k) 11 Nov
(k) 11 Nov ![[Uncaptioned image]](/html/2105.00924/assets/avibot/klamath/pred_11nov.png) (l) 24 Dec
(l) 24 Dec ![[Uncaptioned image]](/html/2105.00924/assets/avibot/klamath/pred_24dec.png) AVI-BoT Predicted Outbreak Probability
Low-Moderate
Low
Low-Moderate
Low
Low-Moderate
Low
Temp[Max,Min](C) Rainfall(mm)50
[26.1,7.0]
1.0
[27.3,8.2]
18.5
[19.2,3.4]
64.5
[13.0,-2.8]
22.9
[11.1,-2.6]
26.9
[3.8,-4.5]
82.8
Possible hypothesis, qualitative analysis
Area with blue prediction (probability between 0.5 and 0.6) decrease
Increased rain may have eased conditions or presence of biomass could have shrunk NDWI,thus prediction may not be high
Presence of biomass could have shrunk NDWI map,thus prediction may not be high. Cases reported 48
Water release 49 may have led to low outbreak prediction
Water release 49 may have led to low outbreak prediction
Negligible water mask created as per NDWI map
AVI-BoT Predicted Outbreak Probability
Low-Moderate
Low
Low-Moderate
Low
Low-Moderate
Low
Temp[Max,Min](C) Rainfall(mm)50
[26.1,7.0]
1.0
[27.3,8.2]
18.5
[19.2,3.4]
64.5
[13.0,-2.8]
22.9
[11.1,-2.6]
26.9
[3.8,-4.5]
82.8
Possible hypothesis, qualitative analysis
Area with blue prediction (probability between 0.5 and 0.6) decrease
Increased rain may have eased conditions or presence of biomass could have shrunk NDWI,thus prediction may not be high
Presence of biomass could have shrunk NDWI map,thus prediction may not be high. Cases reported 48
Water release 49 may have led to low outbreak prediction
Water release 49 may have led to low outbreak prediction
Negligible water mask created as per NDWI map
Exhaustive temporal-analysis as shown can help monitor contributory factors round-the-year and timely issue a pre-emptive warning, thereby helping authorities to act and save migratory birds in large numbers.
3.2.2 Test Case Study II - Pong Dam, India
Pong Dam (Himachal Pradesh, India) saw massive bird deaths in January 2021 with a count of nearly 5000 per month which was contained in early February 2021 45. The reason for this massive die-off was earlier speculated to be Avian Botulism but was later confirmed to be Avian Flu. For this case study, this sample is hence treated as ’negative’.
3.2.3 Test Case Study III - Langvlei and Rondevlei lakes, South Africa
Langvlei and Rondevlei lakes (South Africa) are two wilderness lakes in vicinity of each other documented to show Avian Botulism related deaths since 2015 46. For this case-study, we rely on 46 to provide us with actual on-ground lake-wise and month-wise mortality as well as information about physiological parameters. Due to limitation over data overlapping with the paper 46, we use data samples over three months in 2017 - January, February and May.
The trends deduced from the paper 46 discussed below are confirmed with predictions from the trained models (Fig. 7) as:
-
1.
The paper documents a mortality only for Langvlei lake in the first five months of 2017 and zero mortality for Rondevlei lake. This is confirmed by the AVI-BoT model predictions as the outbreak probability for Langvlei lake by AVI-BoT model is higher than Rondevlei lake (Fig. 7 (a),(b)). It may be noted that the prediction by AVI-BoT over Langvlei lake is itself not a very highly positive prediction which may be attributed to the low mortality (less than 50) over Langvlei lake in 2017 compared to other years.
- 2.
-
3.
The paper documents decreasing mortality from January to May 2017 which is also evident from the decreasing area of high probability of outbreak (probability 0.5) from Fig. 7 (a) - (c).
-
4.
The paper documents physiological parameters like Temperature, Salinity, Dissolved Oxygen for the two lakes across the time period. Since these parameters themselves have been used to build the Causative Factors model, the predictions by Causative Factors model for the 3 data samples are compared with AVI-BoT Model. For the period of January-May 2017, the temperature increases, salinity decreases, and dissolved oxygen increases. While these physiological parameters vehemently support the on-ground trend of mortality reduction, the Causative Factors based Model is completely inaccurate over Rondevlei lake showing a positive prediction despite having a negative label, and gives an all-encompassing positive prediction over Langvlei lake which increases (area with probability between 0.7 and 0.8) between Fig. 7 (a) to (b), which is contrary to the on-ground mortality reduction which is documented.
-
5.
The paper documents a very low mortality in May 2017, which can also be seen as the Fig. 7 (c) shows a negative prediction by both Causative Factors model and AVI-BoT model.
4 Analysis
The proposed AVI-BoT model outperforms the proposed literature-inspired Causative Factors model with a significantly higher accuracy. It uses Aerosol band to capture the constituents of shallow water, Visible band is the abstraction of salinity and organic matter, Infra-Red bands capture other crucial factors like pH, and Thermal bands are a direct input for temperature. Thereby, covering all relevant physical, chemical and biological parameters/features through learning fused multi-spectral satellite data.
To better understand AVI-BoT’s learning of feature-space representations, we examine the progression of features learnt by AVI-BoT through successive convolution layers. These visualizations (see Fig. 8 (a)) have been generated using Lower Klamath National Wildlife Refuge (U.S.A.) as sample inference data point for 9th October 2020. Analysis shown in Fig. 8 (a) helps us to understand the gradual progression of learning the feature space through Conv1 to Conv5 layers. To understand the learning at each convolutional layer, we have hand-picked the most useful feature representations and their representations are explained below (see Fig. 8 (a)).
-
1.
Fig. 8 (a) Conv1 Layer - learns basic object separation. (a), (b) shows that it is responsible for learning basic background and foreground. (c) It further learns how to distinguish between various objects on a scene, (d) some feature maps get activated on solitary objects, (e) it begins to distinguish between objects which belong to the same class (eg. water).
-
2.
Fig. 8 (a) Conv2 Layer - learns more defined tasks like edge detection. Both (a), (b) show that the layer begins to learn edge detection as can be seen over the edges of the lake. While (d) shows strong activation by the water area in a single feature layer, (c), (e) show that the layer begins to learn gradation within the water area in the lake.
-
3.
Fig. 8 (a) Conv3 Layer - begins to apply the edge detection and gradation within the water body area. Both (a), (b) show defined response by different feature layers over edges of the lake, and various water areas. Both (c) and (d) show how the network learns to fine-tune features when going deeper by narrowing down the area by which it is activated. (e) gives an idea of how the network differentiates between the characteristics shown by various regions of the water body.
-
4.
Fig. 8 (a) Conv4 Layer - specializes on the gradation and picks up various areas within the water body with defining unique characteristics. (a) shows a certain water area with a very defined characteristic which the network learns to pick up which is even seen in Conv5 Layer (a) - this major unique characteristic picked up by AVI-BoT Conv4 and Conv5 Layer translates to the final prediction map output and can be said to be a very defining feature map layer for AVI-BoT Model. (b), (c), (d) show the various water body areas that the AVI-BoT model sees as distinct from each other while looking similar in many other dimensions like (Aerosol, Visible, Infra-Red, Temperature) as will be seen below. (e) shows a feature map with many such areas superimposed.
-
5.
Fig. 8 (a) Conv5 Layer - fine-tunes over Conv4 layer output to give very defined and precise activations by the various regions within the water body as can be seen from (a) - (e). This unique feature space seen by AVI-BoT is a crucial determinant of the final prediction map.
To further examine the learnt feature space, we delve into a deeper feature analysis and additionally train four direct spectral models ((i) Aerosol, (ii) Visible (3-bands), (iii) IR (3-bands), (iv) Thermal (3-bands)). We compare the features learnt by each of the direct spectral models and try to interpret/hypothesize their contribution in the learnt feature space of AVI-BoT. The following observations can be drawn from Fig. 8 (b):
-
1.
Aerosol model’s feature maps have almost uniform activations over the entire surface of the lake. This can be a reason of poor performance when compared to other models despite capturing water constituents well.
-
2.
Visible model’s feature maps too have almost uniform activations which can be a reason for the incorrect predictions for Lower Klamath National Wildlife Refuge.
-
3.
Thermal model activations have more gradation as compared to Aerosol and Visible model which is also evident from Thermal model atleast giving a correct prediction in two test case-studies (Lower Klamath National Wildlife Refuge and Pong Dam). This is despite having low spatial resolution (100 m/1000 m) as well as near-uniform temperature in areas in vicinity.
-
4.
IR model have high gradation activation maps with activation on the shoreline as can be seen from (4,5,6), (76,77,78), (85,86,87). This can attributed to the IR bands capturing pH levels, vegetation and organic matter very well.
-
5.
The AVI-BoT model has a strong spatial activation map where various regions activate distinct feature channels as can be seen from the AVI-BoT Column where each feature map corresponds to a different region of the water body.
-
6.
The AVI-BoT model feature maps, to some extent, can be seen as made up of contributions from each of the (Aerosol, Visible, Infra-Red, Thermal) feature maps. Eg. the activation observed at the shore of the lake for AVI-BoT model is dependent majorly on the IR model.
-
7.
The lower right portion of lake in AVI-BoT model’s feature map can be seen as determined from both Thermal and Visible feature maps (4,5,6).
-
8.
Temperature seems to be have dominant role in the shallow region like upper region of the bigger water body (eg. Thermal feature map of (85,86,87) contributes to the AVI-BoT model feature map of (241,242,243)).
-
9.
From all the feature maps, it is evident that AVI-BoT model captures features of the water body in a unique hyperplane which leads to differentiation of water body and capturing of areas which are not traditionally distinguished in the (A,V,I,T) feature maps. Each feature map of AVI-BoT can be seen to capture a unique area within the water body. And areas such as marked in green in (205,206,207) are instrumental in determining outbreak probability as this is the main area in Fig. 5 (h) predicted to have high outbreak probability.
Fig. 9 shows the accuracy and loss plots for training and validation for the four direct models compared with AVI-BoT model. All models lag far behind the AVI-BoT model, with IR model being the second best in performance. This is also validated by the IR column in Fig. 8 (b) contributing nearly the highest influence in activating the network to yield a prediction.
From the test-case studies - Lower Klamath National Wildlife Refuge (Fig. 5) and Pong Dam (Fig. 6), it is evident that Aerosol model and RGB Model give inaccurate predictions which can be expected as it can be the result of a biased prediction relying solely on the water texture (aerosol) or optical features (visible). Thermal Model, despite accurately giving a positive/negative result shows it’s high susceptibility to slight variations, and as it is just one of the factors leading to Avian botulism, hence a model solely reliant on temperature will not be the optimal solution. The IR model too is not accurate despite high influence on feature maps and being second best in performance after AVI-BoT because even though it yields a correct prediction for Lower Klamath National Wildlife Refuge with a moderate prediction over the shoreline, it gives an inaccurate result for Pong Dam.
A correct comparison of Causative Factors based model and AVI-BoT model can be made only after accounting for the third case study - Langvlei and Rondevlei lakes (Fig. 7) in addition to the first two case studies. While Causative Factors based model can be considered to declare true negatives in very clear situations (such as Pong Dam where avian botulism was not at all present, or 05 May 2017 sample of Langvlei and Rondevlei lake), it suffers on two counts - failing to accurately predict for a complex case like Rondevlei lake (January and February 2017 samples) and giving an overwhelmingly positive blanket prediction over the entire lake. On the other hand, all three case-studies show that AVI-BoT not only gives an accurate prediction of positive or negative but also preserves spatial information which is useful for conservation and prevention efforts. Future studies which document on-ground physiological parameters with actual clinical diagnosis can help fine-tune the prediction of AVI-BoT for getting higher spatial accuracy. Further, reliable water segmentation techniques for complex cases such as presence of biomass in water and standardized definition such as NDWI or moisture index can be used to generate training samples which can help remove any land areas that may creep in otherwise due to being close to shoreline or the water body being very small in size.
5 Conclusion
This interdisciplinary study presents the intersection of - wildlife conservation, satellite based remote-sensing technology and advanced computational techniques driven by AI and deep learning. We build a Bird-Area Water Bodies Dataset (BAWD) of multi-spectral satellite images of bird-habitats covering 16 topographically diverse global locations over the period 2016-2021, with ground-truth labels backed by on-ground reportings confirming the outbreak occurrence. We further present AVI-BoT, an intelligent AI model with validation accuracy of 0.989, to forecast Avian botulism outbreaks. We also validate our technique on three test case study locations. The proposed model generates spatial decision output map that is closely aligned with actual on-ground clinical diagnosis based reports. We also perform an ablation study to examine the evolution of the feature space. Proposed predictive methodology provides an efficient and scalable first-of-its-kind monitoring technique which can be used to pre-emptively protect the migratory fauna and interdependent food webs.
References
- 1 Espelund, M. & Klaveness, D. Botulism outbreaks in natural environments – an update. Frontiers in microbiology 5, 287 (2014).
- 2 Friend, M. & Franson, J. Field manual of wildlife diseases: General field procedures and diseases of birds. U.S. Geological Survey (1999). URL https://pubs.er.usgs.gov/publication/itr19990001.
- 3 Avian botulism – a recurring paralytic disease of wild uk waterbirds. Veterinary Record 185, 261–262 (2019). URL https://veterinaryrecord.bmj.com/content/185/9/261. https://veterinaryrecord.bmj.com/content/185/9/261.full.pdf.
- 4 Anza, I. et al. Eutrophication and bacterial pathogens as risk factors for avian botulism outbreaks in wetlands receiving effluents from urban wastewater treatment plants. Applied and Environmental Microbiology 80, 4251–4259 (2014).
- 5 Hertel, M. Avian botulism kills 40,000 birds at national wildlife refuge. The Revelator (2020). URL https://therevelator.org/avian-botulism-klamath/.
- 6 Le Gratiet, T. et al. Development of an innovative and quick method for the isolation of clostridium botulinum strains involved in avian botulism outbreaks. Toxins 12, 42 (2020).
- 7 Rocke, T. E., Smith, S. R. & Nashold, S. W. Preliminary evaluation of a simple in vitro test for the diagnosis of type c botulism in wild birds. Journal of wildlife diseases 34, 744–751 (1998).
- 8 Chellapandi, P. & Prisilla, A. Pcr-based molecular diagnosis of botulism (types c and d) outbreaks in aquatic birds. Annals of Microbiology 68, 835–849 (2018).
- 9 Anniballi, F. et al. Management of animal botulism outbreaks: from clinical suspicion to practical countermeasures to prevent or minimize outbreaks. Biosecurity and bioterrorism: biodefense strategy, practice, and science 11, S191–S199 (2013).
- 10 Woudstra, C. Clostridium botulinum, from toxin and flagellin genotyping to Whole Genome Sequencing: An insight into the genetic diversity of human and animal botulism associated Clostridia. Ph.D. thesis (2016).
- 11 Survey, U. G. Avian botulism. https://www.usgs.gov/centers/nwhc/science/avian-botulism. Accessed: 2021-01-03.
- 12 Hedeland, M. et al. Confirmation of botulism in birds and cattle by the mouse bioassay and endopep-ms. Journal of medical microbiology 60, 1299–1305 (2011).
- 13 Thomas, R. Detection of clostridium botulinum types c and d toxin by elisa. Australian Veterinary Journal 68, 111–113 (1991).
- 14 Le Maréchal, C. et al. Development and validation of a new reliable method for the diagnosis of avian botulism. Plos one 12, e0169640 (2017).
- 15 Sentinel-hub. https://apps.sentinel-hub.com/eo-browser/. Sinergise Ltd.
- 16 Gascon, F. et al. Copernicus sentinel-2a calibration and products validation status. Remote Sensing 9, 584 (2017).
- 17 DONALD, P. F. et al. Important bird and biodiversity areas (ibas): the development and characteristics of a global inventory of key sites for biodiversity. Bird Conservation International 29, 177–198 (2019).
- 18 Birds die in suspected avian botulism outbreak. Newsline, Christchurch City Council (2018). URL https://newsline.ccc.govt.nz/news/story/birds-die-in-suspected-avian-botulism-outbreak.
- 19 Tantau, K. Avian botulism outbreak killing hundreds of birds around firth of thames. Stuff (2020). URL https://www.stuff.co.nz/environment/119389949/avian-botulism-outbreak-killing-hundreds-of-birds-around-firth-of-thames.
- 20 Avian botulism from sewage pond kills 600 birds. Radio New Zealand (2019). URL https://www.rnz.co.nz/news/national/382315/avian-botulism-from-sewage-pond-kills-600-birds.
- 21 Owen, C. Botulism outbreak in auckland parks killing hundreds of ducks. stuff (2018). URL https://www.stuff.co.nz/environment/101002041/botulism-outbreak-in-auckland-parks-killing-hundreds-of-ducks.
- 22 Fallon, V. Mass bird deaths at kapiti coast lake blamed on avian botulism. Stuff (2018). URL https://www.stuff.co.nz/environment/101619817/mass-bird-deaths-at-kpiti-coast-lagoon-blamed-on-avian-botulism.
- 23 Segal, Y. Cases of avian botulism found in victoria. Agriculture Victoria (2017). URL https://agriculture.vic.gov.au/support-and-resources/newsletters/vetwatch-newsletter/vetwatch-october-2017/cases-of-avian-botulism-found-in-victoria.
- 24 Harris, D. Outbreak kills 1000 water birds at canterbury wastewater plants. Stuff (2018). URL https://www.stuff.co.nz/environment/101747128/outbreak-kills-1000-water-birds-at-canterbury-wastewater-plants.
- 25 Cutler, A. Gulls across weymouth and portland found dead from disease. Dorset Echo (2019). URL https://www.dorsetecho.co.uk/news/17871936.gulls-across-weymouth-portland-found-dead-disease/.
- 26 Birdlife international (2020) important bird areas factsheet: Firth of thames. downloaded from http://www.birdlife.org on 04/12/2020. BirdLife International URL http://datazone.birdlife.org/site/factsheet/firth-of-thames-iba-new-zealand.
- 27 Birdlife international (2020) important bird areas factsheet: Lake balaton. downloaded from http://www.birdlife.org on 04/12/2020. BirdLife International URL http://datazone.birdlife.org/site/factsheet/lake-balaton-iba-hungary.
- 28 Birdlife international (2020) important bird areas factsheet: Southern seewinkel and zitzmannsdorfer wiesen. downloaded from http://www.birdlife.org on 04/12/2020. BirdLife International URL http://datazone.birdlife.org/site/factsheet/neusiedler-see-iba-austria.
- 29 Notice of a type ix decision on a proposal in your neighborhood, case file number: Lu 17-162183 cn. City of Portland, Bureau of Development Services, Oregon Land Use Services URL https://www.portlandoregon.gov/bds/article/651613.
- 30 San carlos apache tribe vs usa order. District Court, Arizona (2003). URL https://www.narf.org/nill/bulletins/federal/documents/san_carlos.html.
- 31 Birdlife international (2020) important bird areas factsheet: Weymouth wetlands. downloaded from http://www.birdlife.org on 04/12/2020. BirdLife International URL http://datazone.birdlife.org/index.php/site/factsheet/20838.
- 32 Birdlife international (2020) important bird areas factsheet: Canterbury (offshore). downloaded from http://www.birdlife.org on 04/12/2020. BirdLife International URL http://datazone.birdlife.org/site/factsheet/canterbury-(offshore)-iba-new-zealand.
- 33 Birdlife international (2020) important bird areas factsheet: Pakowki lake. downloaded from http://www.birdlife.org on 04/12/2020. BirdLife International URL BirdLifeInternational(2020)ImportantBirdAreasfactsheet:PakowkiLake.Downloadedfromhttp://www.birdlife.orgon04/12/2020.
- 34 QGIS Development Team. QGIS Geographic Information System. Open Source Geospatial Foundation (2009). URL http://qgis.osgeo.org.
- 35 Ronneberger, O., Fischer, P. & Brox, T. U-net: Convolutional networks for biomedical image segmentation. In Lecture Notes in Computer Science, 234–241 (Springer International Publishing, 2015). URL https://doi.org/10.1007%2F978-3-319-24574-4_28.
- 36 Karaoui, I. et al. Evaluating the potential of sentinel-2 satellite images for water quality characterization of artificial reservoirs: The bin el ouidane reservoir case study (morocco). Meteorology Hydrology and Water Management. Research and Operational Applications 7, 31–39 (2019).
- 37 Pizani, F. M., Maillard, P., Ferreira, A. F. & de Amorim, C. C. Estimation of water quality in a reservoir from sentinel-2 msi and landsat-8 oli sensors. ISPRS Annals of Photogrammetry, Remote Sensing & Spatial Information Sciences 5 (2020).
- 38 Kutser, T. et al. Using satellite remote sensing to estimate the colored dissolved organic matter absorption coefficient in lakes. Ecosystems 8, 709–720 (2005).
- 39 Sun, D. et al. Remote sensing estimation of sea surface salinity from goci measurements in the southern yellow sea. Remote Sensing 11, 775 (2019).
- 40 Torres-Bejarano, F., Arteaga-Hernández, F., Rodríguez-Ibarra, D., Mejía-Ávila, D. & González-Márquez, L. Water quality assessment in a wetland complex using sentinel 2 satellite images. International Journal of Environmental Science and Technology 1–12 (2020).
- 41 Lafrancois, B., Riley, S., Blehert, D. & Ballmann, A. Links between type e botulism outbreaks, lake levels, and surface water temperatures in lake michigan, 1963–2008. Journal of Great Lakes Research 37, 86–91 (2011).
- 42 Krizhevsky, A., Sutskever, I. & Hinton, G. E. Imagenet classification with deep convolutional neural networks. Communications of the ACM 60, 84–90 (2017).
- 43 Konar, J., Khandelwal, P. & Tripathi, R. Comparison of various learning rate scheduling techniques on convolutional neural network. In 2020 IEEE International Students’ Conference on Electrical, Electronics and Computer Science (SCEECS), 1–5 (IEEE, 2020).
- 44 Rocke, T. E. & Samuel, M. D. Water and sediment characteristics associated with avian botulism outbreaks in wetlands. The Journal of Wildlife Management 1249–1260 (1999).
- 45 News, C. Avian flu causing migratory birds’ death at hp’s pong dam, toll rises to 2,400. The Hindustan Times (2021). URL https://www.hindustantimes.com/chandigarh/avian-flu-suspected-behind-migratory-birds-death-at-hp-s-pong-dam-toll-rises-to-1-700/story-udxEKkf2YlnKg9rob0LO3N.html.
- 46 Govender, D., Russell, I. A., Randall, R. M. & Zimmerman, D. Outbreak of avian botulism and its effect on waterbirds in the wilderness lakes, south africa. Koedoe: African Protected Area Conservation and Science 61, 1–13 (2019).
- 47 Locke, L. N. & Friend, M. N. 13.2. 4. avian botulism: Geographic expansion of a historic disease. Waterfowl management handbook 3 (1989).
- 48 Current avian botulism outbreak in lower klamath basin. https://birdallyx.net/current-avian-botulism-outbreak-in-lower-klamath-basin-heats-up/. Accessed: 2021-01-03.
- 49 Release, K. W. U. A. P. Lower klamath lake nwr to begin receiving water from klamath project. Klamath Falls News (2019). URL https://www.klamathfallsnews.org/news/lower-klamath-lake-nwr-to-begin-receiving-water-from-klamath-project.
- 50 NOAA National Centers for Environmental information . Climate at a Glance: County Time Series (2020). URL https://www.ncdc.noaa.gov/cag/. Published November 2020, Retrieved on December 8, 2020.