AGILE Observations of Fast Radio Bursts
Abstract
We report on a systematic search for hard X-ray and -ray emission in coincidence with fast radio bursts (FRBs) observed by the AGILE satellite. We used 13 yr of AGILE archival data searching for time coincidences between exposed FRBs and events detectable by the MCAL (0.4 - 100 MeV) and GRID (50 MeV - 30 GeV) detectors at timescales ranging from milliseconds to days/weeks. The current AGILE sky coverage allowed us to extend the search for high-energy emission preceding and following the FRB occurrence. We considered all FRBs sources currently included in catalogs, and identified a subsample (15 events) for which a good AGILE exposure either with MCAL or GRID was obtained. In this paper we focus on nonrepeating FRBs, compared to a few nearby repeating sources. We did not detect significant MeV or GeV emission from any event. Our hard X-ray upper limits (ULs) in the MeV energy range were obtained for timescales from submillisecond to seconds, and in the GeV range from minutes to weeks around event times. We focus on a subset of five non-repeating and two repeating FRB sources whose distances are most likely smaller than that of 180916.J0158+65 (150 Mpc). For these sources, our MeV ULs translate into ULs on the isotropically emitted energy of about , comparable to that observed in the 2004 giant flare from the Galactic magnetar SGR 1806-20. On average, these nearby FRBs emit radio pulses of energies significantly larger than the recently detected SGR 1935+2154 and are not yet associated with intense MeV flaring.
1 Introduction
Fast radio bursts (FRBs) are transient events of unknown origin consisting of bright millisecond radio pulses at having usually large dispersion measures (DMs; the free electron density along the line of sight at a certain distance) in excess of Galactic values (Lorimer et al. 2007; Katz 2019; Petroff et al. 2019, and Cordes & Chatterjee 2019, hereafter CC19). The sources known so far, 110 as of 2020 May 1 (see FRBCAT111http://www.frbcat.org/ Petroff et al. 2016, and the CHIME/FRB telescope public on-line database222https://www.chime-frb.ca), have an isotropic sky distribution and for most of them a single radio burst was detected. A smaller, but increasing number of FRBs show repeating pulses (Spitler et al., 2016), which usually occur erratically in time, and two of them show a periodic pattern in their activity cycle, as in the case of FRB 180916.J0158+65 (CHIME/FRB Collaboration et al., 2020, hereafter C20). No clear evidence for physically different populations distinguishing repeating and nonrepeating sources has been obtained so far. The FRB distances can be deduced from their DM measures, which are typically DM 500 , which, taking into account Galactic and extragalactic contributions, point to an extragalactic origin. The short duration of FRBs (typically milliseconds or less) favors models involving compact objects such as strongly magnetized neutron stars (magnetars) and massive black holes (Platts et al., 2019).
Since 2019 the CHIME/FRB collaboration has reported the discovery of several repeating FRBs (hereafter R-FRBs; CHIME/FRB Collaboration et al. 2019a, b, c, hereafter C19; Fonseca et al. 2020), with DM ranging from 103.5 to 1378 . The characteristics of this sample of R-FRBs are particularly interesting for counterpart searches, as we discussed in Casentini et al. 2020, focused on two nearby sources, 180916.J0158+65 (Source 1, following the nomenclature of C19) and 181030.J1054+73 (Source 2). These two sources have low DM values in excess of their respective Galactic disk and halo contributions (see next section) and are therefore expected to be relatively close to Earth (as confirmed by the redshift-determined distance of Source 1 equal to 149 Mpc; Marcote et al. 2020, hereafter M20). As we will see, this distance determination for a prominent FRB sets the scale for our discussion on the implications of our search for high-energy emission from FRBs. Source 1 has been recently reported to have periodic bursting activity (C20), with most radio bursts emitted within time intervals recurring periodically every 16.3 days (Pleunis et al., 2021). A multifrequency follow-up campaign has been organized to search for high-energy and optical emission during active
| ID | DATE | LII | BII | DM and Error | Radio | Within | Within | Within | Off-axis | Repeater |
|---|---|---|---|---|---|---|---|---|---|---|
| UTC | Fluence | MCAL FOV | GRID FOV | Super-A FOV | Angle | |||||
| (deg) | (deg) | () | (Jy ms) | (deg) | ||||||
| 090625 | 2009-06-25 21:53:51.379 | 226.44 | -60.03 | 899.55 0.01 | 2.189 | YES | NO | NO | 94.91 | NO |
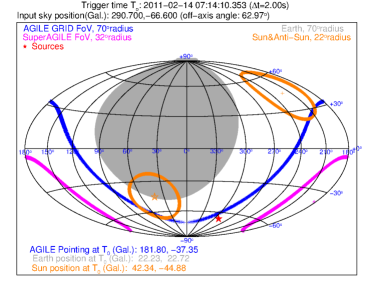
| 110214 | 2011-02-14 07:14:10.353 | 290.70 | -66.60 | 168.9 0.5 | 51.300 | YES | YES | NO | 63.02 | NO |
| 110220 | 2011-02-20 01:55:48.096 | 50.83 | -54.77 | 944.38 0.05 | 7.310 | NO | NO | NO | 93.94 | NO |
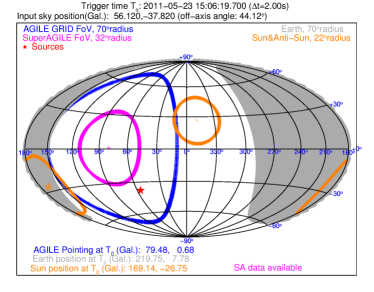
| 110523 | 2011-05-23 15:06:19.700 | 56.12 | -37.82 | 623.3 0.06 | 1.038 | YES | YES | NO | 44.12 | NO |
| 110626 | 2011-06-26 21:33:17.477 | 355.86 | -41.75 | 723.0 0.3 | 0.560 | NO | NO | NO | 128.61 | NO |
| 110703 | 2011-07-03 18:59:40.607 | 81.00 | -59.02 | 1103.6 0.7 | 1.750 | NO | NO | NO | 157.70 | NO |
| 120127 | 2012-01-27 08:11:21.725 | 49.29 | -66.20 | 553.3 0.3 | 0.750 | - | - | - | - | NO |
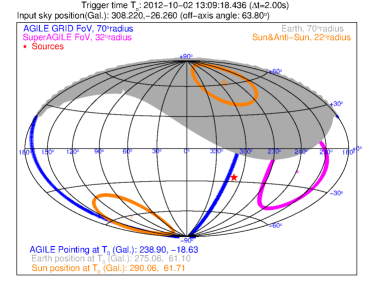
| 121002 | 2012-10-02 13:09:18.436 | 308.22 | -26.26 | 1629.18 0.02 | 2.280 | YES | YES | NO | 63.80 | NO |
| 121102 | 2012-11-02 06:35:53.244 | 174.95 | -0.23 | 557 2 | 1.200 | NO | NO | NO | 133.28 | YES |
| 130626 | 2013-06-26 14:55:59.771 | 7.45 | 27.42 | 952.4 0.1 | 1.500 | - | - | - | - | NO |
| 130628 | 2013-06-28 03:58:00.178 | 225.96 | 30.66 | 469.88 0.01 | 1.220 | YES | YES | NO | 50.26 | NO |
| 130729 | 2013-07-29 09:01:51.190 | 324.79 | 54.74 | 861 2 | 3.5 | NO | NO | NO | 67.85 | NO |
| 131104 | 2013-11-04 18:04:11.200 | 260.55 | -21.93 | 779 1 | 2.750 | - | - | - | - | NO |
| 140514 | 2014-05-14 17:14:11.060 | 50.84 | -54.61 | 562.7 0.6 | 1.320 | NO | NO | NO | 144.34 | NO |
| 141113 | 2014-11-13 07:42:55.220 | 191.90 | 0.36 | 400.3 | 0.078 | YES | YES | NO | 61.39 | NO |
| 150215 | 2015-02-15 20:41:41.714 | 24.66 | 5.28 | 1105.6 0.8 | 2.020 | - | - | - | - | NO |
| 150418 | 2015-04-18 04:29:06.657 | 232.67 | -3.23 | 776.2 0.5 | 1.760 | NO | NO | NO | 161.08 | NO |
| 150610 | 2015-06-10 05:26:59.396 | 278.00 | 16.50 | 1593.9 0.6 | 1.300 | YES | NO | NO | 141.61 | NO |
| 150807 | 2015-08-07 17:53:55.830 | 333.89 | -53.60 | 266.5 0.1 | 44.800 | NO | NO | NO | 49.49 | NO |
| 151206 | 2015-12-06 06:17:52.778 | 32.60 | -8.50 | 1909.8 0.6 | 0.900 | NO | NO | NO | 63.28 | NO |
| 151230 | 2015-12-30 16:15:46.525 | 239.00 | 34.80 | 960.4 0.5 | 1.900 | YES | NO | NO | 90.33 | NO |
| 160102 | 2016-01-02 08:28:39.374 | 18.90 | -60.80 | 2596.1 0.3 | 1.800 | NO | NO | NO | 44.87 | NO |
| 160317 | 2016-03-17 09:00:36.530 | 246.05 | -0.99 | 1165 11 | 63.000 | NO | NO | NO | 61.41 | NO |
| 160410 | 2016-04-10 08:33:39.680 | 220.36 | 27.19 | 278 3 | 28.000 | NO | NO | NO | 32.96 | NO |
| 160608 | 2016-06-08 03:53:01.088 | 254.11 | -9.54 | 682 7 | 38.700 | NO | NO | NO | 165.22 | NO |
| 170107 | 2017-01-07 20:05:08.139 | 266.08 | 51.45 | 609.5 0.5 | 58.000 | YES | YES | YES | 29.45 | NO |
| 170416 | 2017-04-16 23:11:12.799 | 337.62 | -50.05 | 523.2 0.2 | 97.000 | YES | NO | NO | 133.52 | NO |
| 170428 | 2017-04-28 18:02:34.700 | 326.75 | -41.85 | 991.7 0.9 | 34.000 | YES | NO | NO | 122.82 | NO |
| 170707 | 2017-07-07 06:17:34.354 | 275.02 | -52.39 | 235.2 0.6 | 52.000 | YES | YES | NO | 50.66 | NO |
| 170712 | 2017-07-12 13:22:17.394 | 327.41 | -49.24 | 312.79 0.07 | 53.000 | YES | NO | NO | 104.46 | NO |
| 170827 | 2017-08-27 16:20:18.000 | 303.20 | -51.70 | 176.80 0.04 | 19.870 | NO | NO | NO | 81.31 | NO |
| 170906 | 2017-09-06 13:06:56.488 | 33.85 | -50.20 | 390.3 0.4 | 74.000 | YES | NO | NO | 73.37 | NO |
| 170922 | 2017-09-22 11:23:33.400 | 45.10 | -38.70 | 1111 1 | 177.000 | YES | NO | NO | 128.74 | NO |
| 171003 | 2017-10-03 04:07:23.781 | 294.90 | 48.41 | 463.2 1.2 | 81.000 | YES | NO | NO | 95.98 | NO |
| 171004 | 2017-10-04 03:23:39.250 | 282.69 | 48.84 | 304.0 0.3 | 44.000 | YES | NO | NO | 79.72 | NO |
| 171019 | 2017-10-19 13:26:40.097 | 52.51 | -49.24 | 460.8 1.1 | 219.000 | YES | NO | NO | 134.78 | NO |
| 171020 | 2017-10-20 10:27:58.598 | 36.17 | -53.49 | 114.1 0.2 | 200.000 | NO | NO | NO | 80.64 | NO |
| 171116 | 2017-11-16 14:59:33.305 | 206.37 | -51.93 | 618.5 0.5 | 63.000 | YES | NO | NO | 95.06 | NO |
| 171209 | 2017-12-09 20:34:23.500 | 332.20 | 6.24 | 1457.40 0.03 | 3.700 | YES | NO | NO | 105.10 | NO |
| 171213 | 2017-12-13 14:22:40.467 | 198.85 | -47.48 | 158.6 0.2 | 133.000 | YES | NO | NO | 126.69 | NO |
| 171216 | 2017-12-16 17:59:10.822 | 271.19 | -49.29 | 203.1 0.5 | 40.000 | NO | NO | NO | 30.35 | NO |
| 180110 | 2018-01-10 07:34:34.959 | 9.18 | -51.32 | 715.7 0.2 | 420.000 | YES | NO | NO | 121.76 | NO |
| 180119 | 2018-01-19 12:24:40.747 | 199.58 | -50.41 | 402.7 0.7 | 110.000 | YES | NO | NO | 98.08 | NO |
| 180128.0 | 2018-01-28 00:59:38.617 | 330.05 | 52.72 | 441.4 0.2 | 51.000 | YES | NO | NO | 121.32 | NO |
| 180128.2 | 2018-01-28 04:53:26.796 | 329.86 | -48.32 | 495.9 0.7 | 66.000 | YES | YES | NO | 39.87 | NO |
| 180130 | 2018-01-30 04:55:29.993 | 4.21 | -51.07 | 343.5 0.4 | 95.000 | - | - | - | - | NO |
| 180131 | 2018-01-31 05:45:04.320 | 0.93 | -50.47 | 657.7 0.5 | 100.000 | YES | NO | NO | 116.37 | NO |
| 180212 | 2018-02-12 23:45:04.399 | 341.52 | 52.45 | 167.5 0.5 | 96.000 | IDLE | NO | NO | 54.69 | NO |
| 180309 | 2018-03-09 02:49:32.990 | 10.90 | -45.40 | 263.42 0.01 | 13.120 | YES | YES | NO | 54.96 | NO |
| 180311 | 2018-03-11 04:11:54.800 | 337.30 | -43.70 | 1570.9 0.5 | 2.100 | IDLE | - | - | 45.81 | NO |
| 180315 | 2018-03-15 05:05:30.985 | 13.20 | -20.90 | 479.0 0.4 | 56.000 | NO | NO | NO | 148.08 | NO |
| 180324 | 2018-03-24 09:31:46.706 | 245.20 | -20.50 | 431.0 0.4 | 71.000 | YES | NO | NO | 126.04 | NO |
| 180417 | 2018-04-17 13:18:31.000 | 276.00 | 75.60 | 474.8 | 55.000 | YES | NO | NO | 105.53 | NO |
| 180430 | 2018-04-30 09:59:58.700 | 221.76 | -4.61 | 264.1 0.5 | 177.000 | YES | NO | NO | 168.04 | NO |
| 180515 | 2018-05-15 21:57:26.485 | 349.50 | -64.90 | 355.2 0.5 | 46.000 | YES | YES | NO | 60.12 | NO |
| 180525 | 2018-05-25 15:19:06.515 | 349.00 | 50.70 | 388.1 0.3 | 300.000 | NO | NO | NO | 60.90 | NO |
| 180528 | 2018-05-28 04:24:00.900 | 258.80 | -22.35 | 899.3 0.6 | 32.000 | YES | NO | NO | 111.25 | NO |
| 180714 | 2018-07-14 10:00:08.700 | 14.80 | 8.72 | 1467.92 0.3 | 1.850 | NO | NO | NO | 72.72 | NO |
| 180725.J0613+67 | 2018-07-25 17:59:32.813 | 147.00 | 21.00 | 715.98 0.2 | 12.000 | YES | NO | NO | 114.43 | NO |
| 180727.J1311+26 | 2018-07-27 00:52:04.474 | 25.00 | 85.00 | 642.07 0.03 | 14.000 | YES | NO | NO | 152.33 | NO |
| 180729.J0558+56 | 2018-07-29 00:48:19.238 | 115.00 | 61.00 | 317.37 0.01 | 34.000 | YES | YES | NO | 61.89 | NO |
| 180729.J1316+55 | 2018-07-29 17:28:18.258 | 156.00 | 15.00 | 109.610 0.002 | 9.000 | YES | NO | NO | 100.32 | NO |
| 180730.J0353+87 | 2018-07-30 03:37:25.937 | 125.00 | 25.00 | 849.047 0.002 | 50.000 | YES | NO | NO | 155.51 | NO |
| 180801.J2130+72 | 2018-08-01 08:47:14.793 | 109.00 | 15.00 | 656.20 0.03 | 28.000 | NO | NO | NO | 42.06 | NO |
| 180806.J1515+75 | 2018-08-06 14:13:03.107 | 112.00 | 38.00 | 739.98 0.03 | 24.000 | YES | YES | NO | 62.78 | NO |
| 180810.J0646+34 | 2018-08-10 17:28:54.614 | 180.00 | 14.00 | 414.95 0.02 | 11.000 | NO | NO | NO | 64.62 | NO |
| 180810.J1159+83 | 2018-08-10 22:40:42.493 | 125.00 | 34.00 | 169.134 0.002 | 17.000 | YES | NO | NO | 117.77 | NO |
| 180812.J0112+80 | 2018-08-12 11:45:32.872 | 123.00 | 18.00 | 802.57 0.04 | 18.000 | YES | NO | NO | 153.02 | NO |
| 180814.J1554+74 | 2018-08-14 14:20:14.440 | 108.00 | 37.00 | 238.32 0.01 | 25.000 | YES | NO | NO | 165.94 | NO |
| 180814.J0422+73 | 2018-08-14 14:49:48.022 | 136.00 | 16.00 | 189.38 0.09 | 21.000 | YES | NO | NO | 116.42 | YES |
| 180817.J1533+42 | 2018-08-17 01:49:20.202 | 68.00 | 54.00 | 1006.840 0.002 | 26.000 | NO | NO | NO | 20.36 | NO |
| 180908.J1232+74 | 2018-09-18 21:13:01.00 | 124.7 | 42.9 | 195.7 0.9 | 2.700 | YES | NO | NO | 81.89 | YES |
| 180916.J0158+65 | 2018-09-16 10:15:19.802 | 129.70 | 3.70 | 349.2 0.4 | 2.30 | NO | NO | NO | 155.08 | YES |
| 180924 | 2018-09-24 16:23:12.626 | 0.74 | -49.41 | 361.42 0.06 | 16.000 | YES | NO | NO | 139.88 | NO |
| 181016 | 2018-10-16 04:16:56.3 | 345.51 | 22.67 | 1982.8 2.8 | 87.000 | YES | NO | NO | 86.53 | NO |
| 181017 | 2018-10-17 10:24:37.4 | 50.50 | -47.00 | 239.97 0.03 | 31.000 | YES | NO | NO | 73.46 | NO |
| 181017.J1705+68 | 2018-10-17 23:26:11.860 | 99.20 | 34.80 | 1281.9 0.4 | 1.000 | NO | NO | NO | 3.95 | YES |
| 181030.J1054+73 | 2018-10-30 04:13:13.025 | 133.40 | 40.90 | 103.5 0.7 | 7.300 | YES | NO | NO | 91.44 | YES |
| 181112 | 2018-11-12 17:31:15.483 | 342.60 | -47.70 | 589.27 0.03 | 26.000 | YES | YES | NO | 42.93 | NO |
| 181119.J12+65 | 2018-11-19 16:49:03.191 | 124.50 | 52.00 | 364.2 1.0 | 1.800 | NO | NO | NO | 53.99 | YES |
| 181128.J0456+63 | 2018-11-28 08:27:41.740 | 146.60 | 12.40 | 450.2 0.3 | 4.400 | - | - | - | - | YES |
| 181228 | 2018-12-28 13:48:50.1 | 253.39 | -26.06 | 354.2 0.9 | 24.000 | YES | NO | NO | 159.68 | NO |
| 190116.J1249+27 | 2019-01-16 13:07:33.833 | 210.50 | 89.50 | 444.0 0.6 | 0.800 | NO | NO | NO | 48.06 | YES |
| 190222.J2052+69 | 2019-02-22 18:46:01.367 | 104.90 | 15.90 | 460.6 0.1 | – | YES | YES | NO | 40.38 | YES |
| 190523 | 2019-05-23 06:05:55.815 | 117.03 | 44.00 | 760.8 0.6 | – | YES | NO | NO | 111.84 | NO |
| 190102 | 2019-01-02 05:38:43.49184 | 312.654 | -33.493 | 363.6 0.3 | 14.000 | YES | NO | NO | 93.41 | NO |
| 190608 | 2019-06-08 22:48:12.88391 | 53.209 | -48.530 | 338.7 0.5 | 26.000 | NO | NO | NO | 169.31 | NO |
| 190611 | 2019-06-11 05:45:43.29937 | 312.935 | -33.282 | 321.4 0.2 | 10.000 | YES | YES | NO | 42.93 | NO |
| 190711 | 2019-07-11 01:53:41.09338 | 310.908 | -33.902 | 593.1 0.4 | 34.000 | YES | NO | NO | 142.35 | NO |
phases in the period 2020 February – September. No X-ray emission has been detected simultaneously with radio burst activity and interesting constraints have been determined (Pilia et al., 2020; Tavani et al., 2020; Scholz et al., 2020). Recently, some high-energy counterpart searches for FRBs have been published (see Cunningham et al., 2019; Martone et al., 2019; Guidorzi et al., 2020; Marcote et al., 2020; Nicastro et al., 2021), based on the updated sample of sources in the FRBCAT catalog and reporting searches in timescales from 0.1 to 100 s in the X–ray/soft -ray bands. No significant detection was found, while average isotropic luminosity upper limits (ULs) have been set from Insight/HXMT data (40 keV – 3 MeV), to – for the most part of FRBs and for Source 1 at 1 s integration, and 2 orders of magnitude higher at 0.1 s, while from Fermi and Swift/BAT data (8 keV – 100 GeV) lower limits to the radio-to-X–ray flux ratio at – have been set for the nonrepeating sources. In this paper, we report on a systematic search in AGILE archival data for MeV and GeV emission in coincidence with FRB radio detections. We searched for simultaneous or temporally close high-energy emission for a sample of 89 FRB sources selected from FRBCAT and from the CHIME/FRB telescope public online database, with the inclusion of recent FRB detections (Macquart et al., 2020). Most of these FRBs are nonrepeating.
In this paper, Section 2 presents a discussion of the different components making the observed DM of FRBs. Section 3 briefly presents the characteristics of the AGILE instrument. In Section 4 we presents the FRB list and the details of our search analysis procedure. We discuss our measurements and their implications with respect to the radio fluences and DM distributions. In Section 4.1 and in Section 4.2 we report our main conclusions.
2 The FRB Dispersion Measure Decomposition and the Case of Source 1
The DM of each FRB is given by the sum of the following components:
| (1) |
where DMgdisk and DMghalo are the Galactic disk and halo components, DMhost is the FRB source host galaxy component from disk and halo and all specific local gas, and DMIGM is the intergalactic component. When no information on the local host component is known, we define the excess DM as DMDMDMIGM. The DMIGM has a strong distance dependence, and DMhost could have a correlation with age (Macquart et al., 2020). The recently discovered CHIME/FRB and ASKAP FRBs include some sources having small total DM values only slightly in excess of the galactic contribution considering the available Galactic DM models Cordes & Lazio (2002); Prochaska & Zheng (2019). Moreover, the recent precise localizations of a few FRBs (Chatterjee et al., 2017; Nicastro et al., 2021) allows to have a set of FRBs (nine sources) to compare the DMIGM with the expected DM according to the intergalactic medium (IGM)-DM relation, DM (McQuinn, 2014). Source 1 has a low value of DMex and has been recently localized with good precision by VLBI. It has been associated with a possible star-forming region in a massive spiral galaxy at redshift , corresponding to 149.0 Mpc (M20). Knowing the distance, it is possible to estimate the DMhost for this source. After subtracting the DMgdisk value and assuming a value of 50 pc cm-3 for DMghalo, we obtain DM, but from z = we obtain DM and consequently DM (see Tavani et al., 2021). This source has the lowest DMIGM among those with a certain localization.
3 The AGILE Instrument
AGILE is a small space mission of the Italian Space Agency (ASI) devoted to X–ray and -ray astrophysics Tavani et al. (2009), operating since 2007 in an equatorial orbit. Its spinning operational mode exposes of the entire sky every 7 minutes. The instrument consists of four detectors: an imaging -ray Silicon Tracker (sensitive in the energy range 30 MeV – 30 GeV; Barbiellini et al., 2002), a coded mask X-ray imager, Super-AGILE (Super-A; operating in the energy range 18 – 60 keV Feroci et al., 2007), the Mini-Calorimeter (MCAL; working in the range 0.35 – 100 MeV; Labanti et al., 2009), with a 4 acceptance, and the anticoincidence (AC; Perotti et al., 2006) system. The combination of Tracker, MCAL, and AC working as a -ray imager constitutes the AGILE/GRID. The GRID has a field of view (FOV) of about 70∘ around the pointing direction, while Super-A has a 2D-coded squared FOV of size . The AGILE instrument has important characteristics for short transient follow-up in X-rays and -rays Pittori (2013); Bulgarelli et al. (2014, 2019); Verrecchia et al. (2019). The instrument is capable of detecting -ray transients and GRB-like phenomena on timescales ranging from sub-milliseconds to tens to hundreds of seconds. For a summary of the AGILE mission features, see Tavani (2019).
4 AGILE Observations of Nonrepeating FRBs
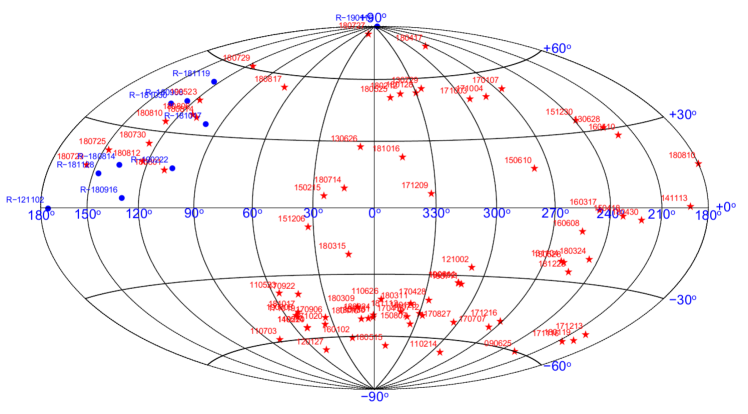
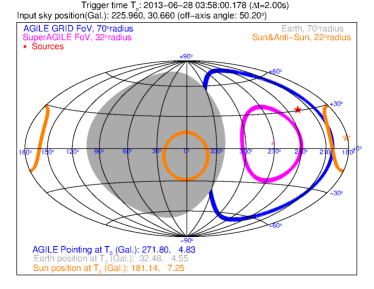
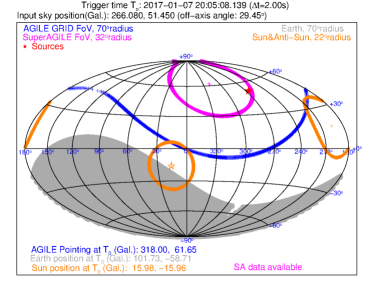
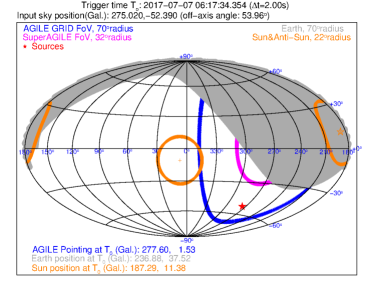
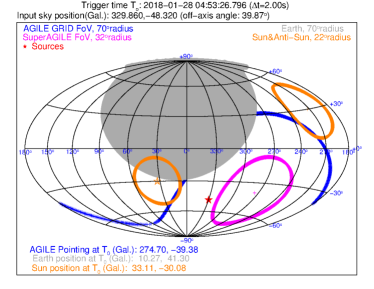
We considered a sample of 89 FRB sources selected from the public catalog FRBCAT (consisting of 110 sources as of 2020 May 1) and from the CHIME/FRB telescope public online database, among the verified events having a reliable position measure. We report the source list in Table 1, showing the main burst radio parameters, such as the detection time (T0), sky position, fluence, and measured DM. We show in Figure 1 the plot of the source positions in Aitoff projection. Our main goal in this work is to focus on nonrepeating sources, and for R-FRBs we report in Table 1 the parameters of the first repetition only; a complete analysis of all the repetitions is not included in this work. The AGILE satellite pointing direction rotates around the axis pointed towards the Sun; so the GRID and Super-A can obtain exposures of each FRB error circle at each satellite revolution not affected by Earth occultation or SAA passages (MCAL is only affected by Earth occultations; in the following we will indicate the unocculted region of the sky with ”MCAL FOV”). We applied a procedure divided in two main steps: a first check of the eventual prompt emission, supposed to include a few seconds around taking into account the time delay due to dispersion of the radio frequency with respect to X-rays, and then a search for delayed or preceding emission on longer time scales. The initial check of the prompt coverage with the three detectors of a few seconds around to account for time delay due to dispersion value and its uncertainty (in the range –) of each unocculted source has been executed, and we report the event coverage in dedicated columns of Table 1, indicating whether each source was within each detector’s FOV at burst times (marked by the ”Y” symbol, for ”yes”). We determine that 15 FRBs were exposed at the radio event times within the GRID FOVs; instead only one (170107) was inside the Super-A FOV, while 54 events were inside the unocculted part of the sky for MCAL. In Figure 2 and 3, we show Aitoff plots in Galactic coordinates of the AGILE exposures of seven FRB events that occurred within the GRID FOV, in particular the one falling also within the Super-A one. In our analysis, we selected time intervals preceding and following the FRB radio times of arrival . We extended our searches to time intervals sufficiently large to take into account the radio dispersion delays that can amount to many seconds. In the following, we will describe analyses of two integrations timescales: (a) short timescales, below 1 hr; (b) long timescales, from 1 hr to 100 days. We will report the results with these timescales for the two AGILE detectors, MCAL and GRID.
4.1 Search for Hard X-ray/Soft -ray Emission
The AGILE/MCAL is a triggered detector, with an onboard trigger logic acting on different energy ranges and timescales (from s to s). The submillisecond logic timescale allows MCAL to trigger on very short duration impulsive events. Moreover, the logic is capable of efficiently detecting long and short transients such as GRBs (Marisaldi et al., 2008; Galli et al., 2013) as well as terrestrial -ray flashes on millisecond and submillisecond timescales (Tavani et al., 2011; Marisaldi et al., 2015). A detailed discussion about MCAL triggering capabilities and UL evaluation is given in Casentini et al. (2020) and Ursi et al. (2019).
| Sub-ms | 1 ms | 16 ms | 64 ms | 256 ms | 1024 ms | 8192 ms |
|---|---|---|---|---|---|---|
As soon as each FRB position becomes not occulted and accessible by MCAL, we carried out a search for transient X-ray emission on the six fixed integration timescales of the trigger logic in the 400 keV – 100 MeV energy range at the data interval nearest in time, within . No significant triggered or untriggered detection was obtained by MCAL. We determined 3 fluence UL values, reported in Table 2, with values ranging from , on the submillisecond timescale, to on 8 s timescale, using a mean power law with photon index 1.5 as the spectral model.
4.2 Search for -ray Emission
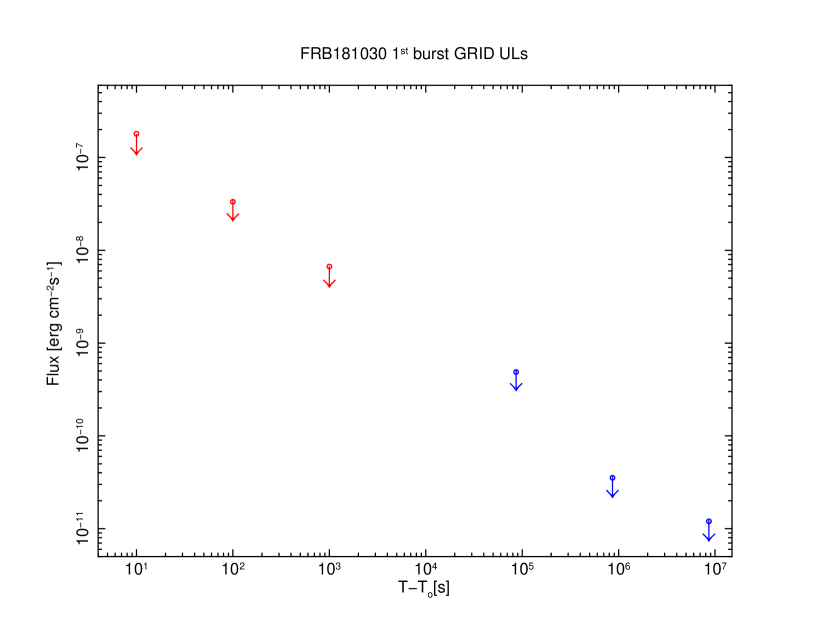
We searched for -ray emission in the GRID detector data, applying two different types of analyses: the “GRB detection mode” Giuliani et al. (2010); Verrecchia et al. (2017); Casentini et al. (2020) for short-timescale integrations of 10, 100 and 1000 s before and after the event , which allowed us to obtain flux ULs in the 50 MeV – 10 GeV energy band; and the AGILE multi-source maximum likelihood (ML) analysis Bulgarelli et al. (2012) for long timescales, up to 100 days in the 100 MeV – 10 GeV band. The ULs were obtained for a mean power-law spectral model with photon index 2.0.
In the case of 110523, with a 100 s integration, applying the method described in Li & Ma (1983), we obtained a weak -ray signal spatially coincident with the FRB source at pretrial significance.
| 10 s | 100 s | 1000 s | 1 day | 10 days | 100 days |
|---|---|---|---|---|---|
5 Discussion
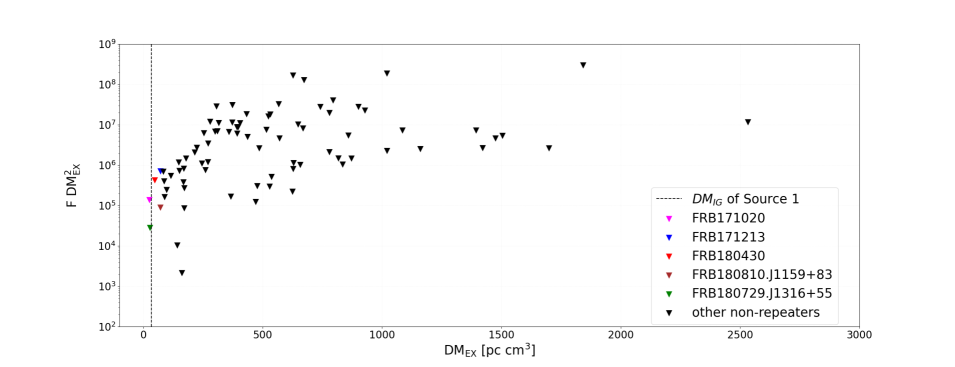
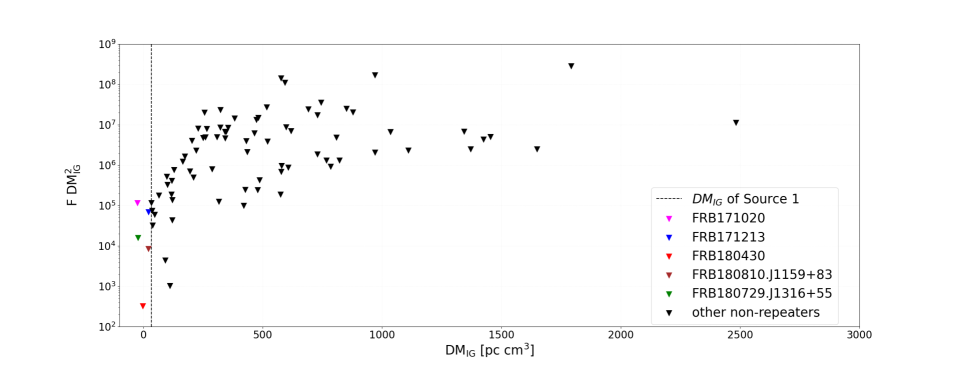
We notice that typical FRB excess DMs are in the range of 100 – 1000 pc cm-3, primarily due to inter-galactic propagation of the radio signal (; CC19), thus setting an extra-galactic scale for the FRB distances. Typical host-galaxy contributions to the DM (; as for the case of our Galaxy) amount to values . Therefore, typical FRB source extrapolated distances are of the order of Gpc, except for a currently small number of FRBs with small DM excesses () as shown in Table 4. This table includes also two sources having . Focusing on nearby FRB sources of Table 4, we will consider the Source 1 distance as a distance UL for a typical scale of .
| ID | Tel.11footnotemark: | 22footnotemark: | 33footnotemark: | 44footnotemark: | 55footnotemark: | W.66footnotemark: | AGILE | ||
| Cov.77footnotemark: | |||||||||
| () | () | () | |||||||
| 171020 | A | 114.1 0.2 | 38.0 | 32 | 32 | 0.0340 | 150 | 3.20 | NNN |
| 171213 | A | 158.6 0.2 | 36.0 | 41 | 32 | 0.0340 | 150 | 1.50 | YNN |
| 180430 | A | 264.1 0.5 | 165.4 | 50 | 32 | 0.0340 | 150 | 1.20 | YNN |
| 180729.J1316+55 | C | 109.61 0.002 | 31.0 | 32 | 32 | 0.0340 | 150 | 0.12 | YNN |
| 180810.J1159+83 | C | 169.134 0.002 | 47.0 | 50 | 32 | 0.0246 | 150 | 0.28 | YNN |
| 180814.J0422+73(R) | C | 189.38 0.09 | 87.0 | 20 | 32 | 0.0340 | 150 | … | … |
| 181030.J1054+73(R) | C | 103.5 0.7 | 40.0 | 32 | 32 | 0.0340 | 150 | … | … |
| 180916.J0158+65(R) | C | 348.8 0.2 | 200.0 | 68 | 32.0++footnotemark: | 0.0337++footnotemark: | 149++footnotemark: | … | … |
| 110214 | P | 168.9 0.5 | 31.1 | 50 | 37.8 | 0.0420 | 177 | 1.90 | YYN |
| 170707 | A | 235.2 0.6 | 36.0 | 50 | 99.2 | 0.1102 | 465 | 3.50 | YYN |
(R) Repeater FRBs.
(1) Radio telescopes, ”C” for CHIME/FRB, ”A” for ASKAP and ”P” for Parkes.
(2) Observed dispersion measure values (Petroff et al., 2016).
(3) The contribution to DM from the IGM obtained by subtracting the Galactic plane contribution (depending on the sky position) and the Galactic halo (which we assumed to be equal to 50 ; Prochaska & Zheng 2019) plus host galaxy contribution (the latter value has been assumed to be equal to 50 except for source 1 whose distance is known). However sources with low DM have uncertain value (using the previous assumptions would bring to negative values) so we assume they should have a value lower than that of Source 1.
(4,5) Estimated redshift according to the IGM-DM relation in McQuinn 2014 and the corresponding distance.
(6) Radio burst scattering-corrected width.
(7) AGILE event spatial coverage within the three detectors’ FOV, according to Table 1 (MCAL, GRID and SA, respectively), where ”Y” for ”Yes” and ”N” for ”No”, while we do not report the coverage for R-FRB, indicated with ellipses.
(+) The value of of the repeater Source 1 is known (Marcote et al., 2020; Tavani et al., 2020).
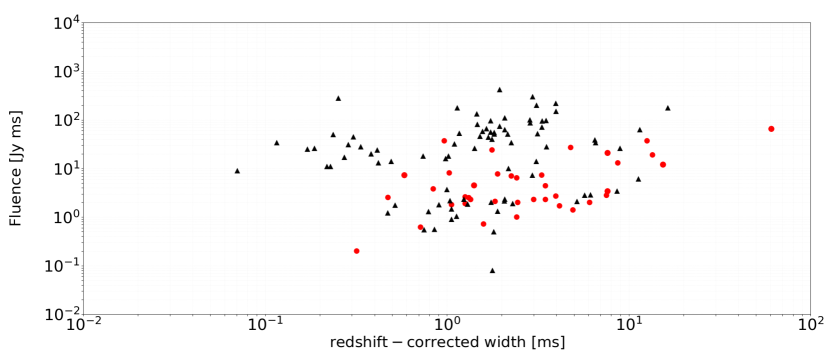
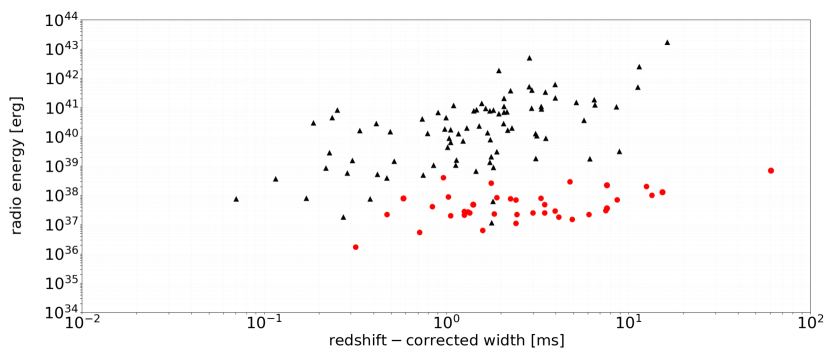
The observed emitted radio flux densities () of FRB events reported in Table 1 have typical values in the range 1 – 100 Jy, on millisecond timescales. These fluxes can be converted to energies considering the relation , where is the radio flux density in Jy, is the intrinsic temporal burst duration in units of 1 ms, is the bandwidth in units of GHz and is a constant for the conversion from to distance in parsecs. In Figure 5 we show the values of the quantities (which is based on measured values of DM with the Galactic plane contribution subtracted) and of (which is a deduced quantity; see Table 4). The values of are evaluated with the assumption reported in Section 2 and for sources for which the distance is not known; consequently, some of the sources in Table 4 have negative values of this quantity. In Figure 6, we show the observed FRB radio spectral fluences and the deduced isotropic FRB radio energies. The latter quantities turn out to be in the range .
Our fluence UL in the millisecond range at near-MeV energies has the typical value of (or in the range of seconds) for all the FRBs exposed by AGILE/MCAL, in particular for those of Table 4 (except 171020, which was occulted). This fluence UL translates into an UL for the isotropically MeV-radiated energy (or for the second timescale). Obviously, the total emitted energy can be smaller than the isotropic equivalent when taking into account the eventual beaming effect.
This UL is relevant because it is of the same order of magnitude of the 200 ms long first peak of the 2004 ”giant flare” from SGR 1806-20 (with an emitted energy ; Palmer et al., 2005; Hurley et al., 2005). The lack of MeV detections for the FRBs of Table 4 translates into the absence of X-ray bursts larger than the most intense giant flare from a Galactic magnetar. Our result is very significant in light of the recent discovery of a giant radio burst from the Galactic magnetar SGR 1935+2154 (Mereghetti, 2020; Bochenek et al., 2020a, b; Scholz, 2020; Scholz et al., 2020; Li et al., 2020). FRB-like radio pulses are therefore associable to magnetars (e.g., Tavani et al., 2020; Katz, 2020), and we might expect powerful X-ray emission in coincidence with FRBs. This expectation is based on the energetics of the radio emission from FRBs as deduced from Fig. 5 that requires a source of energy presumably larger than that available in observed Galactic magnetars, when considering those sources having high measured DM values, so are probably distant. This source might be a fraction of the magnetic field energy that for a neutron star of radius is , where is the internal magnetic field in units of , where radio emission can be triggered by neutron star magnetic field instabilities or magnetospheric particle acceleration phenomena (as discussed in Thompson & Duncan 1996). It is interesting to note that in the case of SGR 1806-20 (with a magnetic field deduced from the magnetar spindown ; Kaspi 2017) the giant outburst flare energy of corresponds to a fraction of 2.5% of the total energy . We therefore can expect detectable X-ray and MeV flaring activity near the UL value , or above, from FRBs if magnetars constitute the physical sources associated with the majority of FRBs of Table 4.
A variety of FRB models discuss the possibility of X-ray and -ray emission from magnetar sources associated with coherent radio pulses (see CC19, Petroff et al. 2019 and Platts et al. 2019 for a 2019 summary). The synchrotron maser modeling of FRB radio flares has been recently applied to the newly discovered CHIME/FRB burst repeaters (Margalit et al., 2020b) and to the comparison of FRBs with the SGR 1935+2154 1 millisecond radio flare detected on April 28th (Scholz, 2020; Bochenek et al., 2020a; Scholz et al., 2020; Mereghetti, 2020; Bochenek et al., 2020b; Li et al., 2020) and with other magnetar X-ray bursts (Margalit et al., 2020a). The simultaneous radio and X-ray burst detections of SGR 1935+2154 allow us to obtain the radio-to-X-ray fluence ratio , where and (with the assumption of a distance of 10 kpc, Tavani et al. 2021). It is a single event but indicative of a physical phenomenon that has to produce simultaneous X-ray emission, together with unabsorbed radio pulses. The decelerating maser blast wave model (Beloberodov, 2017; Metzger et al., 2019), based on the observed parameters of the radio burst alone, leads us to infer the intrinsic energy of the SGR 1935+2154 flare to be , where is the intrinsic synchrotron maser efficiency, supposed to be – (for moderate magnetization), , and W is the 1.4 GHz burst duration. This energy is and the expected is of the same order as the observed one, 10-5. Moreover, delayed X-ray radiation is expected: the “afterglow” peak frequency is set by synchrotron emission, and in the model of a decelerating ultrarelativistic blastwave, it corresponds to and so –, with the time from the flare peak and the medium magnetization parameter (Metzger et al., 2019). We consider a fast cooling synchrotron spectrum with an exponential cutoff at , so that , where is the fluence at . This range of emitted radiation is compatible with the observations of SGR 1935+2154. However, this model predicts a level of prompt X-ray emission significantly lower than the giant flare of SGR 1806-20, and consequently, it does not predict detectable high-energy emission from the FRBs of Table 4.
Prompt and delayed -ray emission can be considered as well. A deceleration blast wave model leads to for millisecond timescale emissions in the -ray band (Margalit et al., 2020a); these expected short bursts are different from the giant Galactic magnetar soft -ray flares lasting several hundreds of milliseconds. The synchrotron maser model thus predicts that radio flares might be followed by emissions also in the -ray band; the fluences (in MeV – GeV band) calculated for SGR 1935+2154 should be of the order of 10 (Margalit et al., 2020b). The FRB phenomenon might lead to high-energy emission on long timescales, from days to months/years. In this hypothesis AGILE/GRID observations of the FRBs of Table 1 (marked by “YES” in the GRID column) allowed us to set -ray ULs at different integration timescales ranging from tens of seconds up to hundreds of days. The longest timescale flux ULs for 100-day integrations are of the order of above 100 MeV. For FRBs with small excess DM, this UL corresponds to the isotropic luminosity limit
| (2) |
Eq. 2 indicates that delayed -ray emission from FRBs is unlikely to be detected also for distances smaller by one order of magnitude compared to Source 1.
6 Conclusions
In this paper we report the results of a systematic search for high-energy emission in AGILE data from FRBs. Outflows are expected to be leptonic; hadrons, if any, may lead to neutrino emission in case of near-magnetar or interstellar shocks, but we do not believe this is the case under the circumstances of situations leading to strong radio pulses. Our search for MeV and GeV emission associated with FRBs did not produce a positive detection among the 89 FRBs that were accessible to our investigation. Interestingly, for a subsample of these FRBs, 15 events, we could determine the lack of detectable emission in the MeV range at a level that is close to the giant flare emission from the magnetar SGR 1806-20. Our ULs are particularly relevant for FRB sources with low intergalactic DM, i.e., presumably located at relatively small distances (smaller than 150 Mpc), whose parameters are shown in Table 4. Currently, the distance out to which we can exclude an MeV flare in the millisecond timescale range similar to SGR 1806-20 for FRBs is 100 Mpc. Furthermore, we obtain long-timescale -ray luminosity limits reaching the relevant value of .
Recently, other high-energy counterpart searches for FRBs have been reported, with results qualitatively similar to those reported here (see Cunningham et al., 2019; Martone et al., 2019; Marcote et al., 2020; Guidorzi et al., 2020), such as isotropic -ray luminosity limits at 1 ms timescale. The search for X-ray, as well as MeV and GeV, emissions from FRBs should continue as more events are discovered and, hopefully, smaller distances are applicable.
The recent breakthrough discovery of a giant double-peaked radio burst from the Galactic magnetar SGR 1935+2154 (Scholz et al., 2020; Bochenek et al., 2020b) was announced when this work was in its final form. The detection of a structured X-ray burst associated with the giant radio burst from SGR 1935+2154 (Mereghetti, 2020; Tavani et al., 2021; Ridnaia, 2020; Li et al., 2020) confirms that high-energy emission can be associated with coherent submillisecond radio bursts from a magnetar. These data are of crucial relevance for resolving the question of the ultimate origin of a class of, if not all, FRBs. Future investigations on the possible link between FRB sources and highly magnetized neutron stars will be presented elsewhere.
Acknowledgments:
This investigation was carried out with partial support by the ASI grant no. I/028/12/05. We would like to acknowledge the financial support of ASI under contract to INAF: ASI 2014-049-R.0 to ASI-SSDC. We thank the anonymous referee for the useful comments that helped to improve the manuscript. F.V. dedicates this work to his late father Giorgio.
References
- Barbiellini et al. (2002) Barbiellini, G., Fedel, G., Liello, F., et al. 2002, NIM A, 490, 146
- Beloberodov (2017) Beloborodov, A. M. 2017, ApJL, 843, L26
- Bochenek et al. (2020a) Bochenek, C., Kulkarni, S., Ravi, V., et al. 2020a, ATel, 13684, 1
- Bochenek et al. (2020b) Bochenek, C., Kulkarni, S., Ravi, V., et al. 2020b, Natur, 587, 59
- Bulgarelli et al. (2019) Bulgarelli, A. 2019, ExA, 48, 199
- Bulgarelli et al. (2012) Bulgarelli, A., Chen, A.W., Tavani, M., et al. 2012, A&A, 540, A79
- Bulgarelli et al. (2014) Bulgarelli, A., Trifoglio, M., Gianotti, F., et al. 2014, ApJ, 781, 19
- Casentini et al. (2020) Casentini, C., Verrecchia, F., Tavani, M., et al. 2020, ApJL, 890, L32
- Chatterjee et al. (2017) Chatterjee, S., Law, C. J., Wharton, R. S., et al. 2017, Natur, 541, 58
- CHIME/FRB Collaboration et al. (2019a) CHIME/FRB Collaboration, Amiri, M., Bandura, K., Bhardwaj, M., et al. 2019a, Natur, 566, 230
- CHIME/FRB Collaboration et al. (2019b) CHIME/FRB Collaboration, Amiri, M., Bandura, K., Bhardwaj, M., et al. 2019b, Natur, 566, 235
- CHIME/FRB Collaboration et al. (2019c) CHIME/FRB Collaboration, Andersen, B. C., Bandura, K., Bhardwaj, M., et al. 2019c, ApJL, 885, 24 (C19)
- CHIME/FRB Collaboration et al. (2020) CHIME/FRB Collaboration, Amiri, M., Andersen, B. C., Bandura, K., Bhardwaj, M., et al. 2020, Natur, 582, 351 (C20)
- Cordes & Chatterjee (2019) Cordes, J. M., and Chatterjee, S. 2019, ARA&A, 119, 161101 (CC19), doi:10.1146/annurev-astro-091918- 104501
- Cordes & Lazio (2002) Cordes, J. M., & Lazio, T. J. W. 2002, arXiv preprint astro-ph/0207156
- Cunningham et al. (2019) Cunningham, V., Cenko, S. B., Burns, E., et al. 2019, ApJ, 879, 40
- Feroci et al. (2007) Feroci, M., Costa, E., Soffitta, P., et al. 2007, NIM A, 581, 728
- Fonseca et al. (2020) Fonseca, E., Andersen, B.C., Bhardwaj, M., et al. 2020, ApJ, 891, L6
- Galli et al. (2013) Galli, M., Marisaldi, M., Fuschino, F., et al. 2013, A&A, 553, A33
- Giuliani et al. (2010) Giuliani, A., Fuschino, F., Vianello, G., et al. 2010, ApJ, 708, L84
- Guidorzi et al. (2020) Guidorzi, C., Marongiu, M., Martone, R., et al. 2020, A&A, 637A, 69
- Hurley et al. (2005) Hurley, K., Boggs, S. E., Smith, D. M., et al. 2005, Natur, 434, 1098
- Kaspi (2017) Kaspi,V. M., Beloborodov, A. M. 2017, ARA&A, 55, 261
- Katz (2019) Katz, J. I. 2019, MNRAS, 487, 491
- Katz (2020) Katz, J. I. 2020, MNRAS, 499, 2319
- Labanti et al. (2009) Labanti, C., Marisaldi, M., Fuschino, F., et al. 2009, NIMPA, 598, 470
- Li et al. (2020) Li, C. K., Lin, L., Xion, S. L., et al. 2020, Nature Astronomy, 5, 378
- Li & Ma (1983) Li, T. & Ma, Y. 1983, ApJ, 272, 317
- Lorimer et al. (2007) Lorimer, D. R., Bailes, M., McLaughlin, M. A., Narkevic, D. J., & Crawford, F. 2007, Science, 318, 777
- Macquart et al. (2020) Macquart, J. P., Prochaska, J. X., McQuinn, M., et al. 2020, Natur, 581, 391
- Marcote et al. (2020) Marcote, B, Nimmo, K., Hessels, J. W. T., et al. 2020, Natur, 577, 190
- Margalit et al. (2020a) Margalit, B., Beniamini, P., Sridhar, N., et al. 2020a, ApJ, 899, L27
- Margalit et al. (2020b) Margalit, B., Metzger, B. D., Sironi, L., et al. 2020b, MNRAS, 494, 4627
- Marisaldi et al. (2015) Marisaldi, M., Argan, A., Ursi, A., et al. 2015, GeoRL, 42, 9481
- Marisaldi et al. (2008) Marisaldi, M., Labanti, C., Fuschino, F., et al. 2008, A&A, 490, 1151
- Martone et al. (2019) Martone, R., Guidorzi, C., Margutti, R., Nicastro, L., Amati, L., et al. 2019, A&A, 631, A62
- McQuinn (2014) McQuinn, M. 2014, ApJ, 780, L33
- Mereghetti (2020) Mereghetti, S., Savchenko, V., Ferrigno, C., et al. 2020, ApJ, 829, L29
- Metzger et al. (2019) Metzger, B. D., Margalit, B.,and Sironi, L. 2019, MNRAS, 485, 4091
- Nicastro et al. (2021) Nicastro, L., Guidorzi, C., Palazzi, E., et al. 2021, Univ, 7, 76
- Palmer et al. (2005) Palmer, D.M., Barthelmy, S., Gehrels, N., et al. 2005, Natur, 434, 1107
- Perotti et al. (2006) Perotti, F., Fiorini, M., Incorvaia, S., Mattaini, E., & Sant’Ambrogio, E. 2006, NIMPA, 556, 228
- Petroff et al. (2016) Petroff, E., Barr, E. D., Jameson, A., et al. 2016, PASA, 33, e045
- Petroff et al. (2019) Petroff, E., Hessels, J. W. T. & Lorimer, D. R. 2019, A&ARv, 27, 4.
- Pilia et al. (2020) Pilia, M., Burgay, M., Possenti, A., et al. 2020, ApJ, 896, L40, arXiv:2003.12748
- Pittori (2013) Pittori, C. 2013, NuPhS, 239, 104
- Platts et al. (2019) Platts, E., Weltman, A., Walters, A., et al 2019, PhR, 821, 1, http://frbtheorycat.org.
- Pleunis et al. (2021) Pleunis, Z., Michilli, D., Bassa, C.G., et al 2021, ApJ, 911, L3
- Prochaska & Zheng (2019) Prochaska, J. X., & Zheng, Y., 2019, MNRAS, 485, 648
- Ridnaia (2020) Ridnaia, A., Svinkin, D., Frederiks, D., et al. 2020, NatAs, 5, 372
- Scholz (2020) Scholz, P., 2020, ATel, 13681, 1
- Scholz et al. (2020) Scholz, P., Cook, A., Cruces, M., et al. 2020, ApJ, 901, 165
- Spitler et al. (2016) Spitler, L. G., Scholz, P., Hessels, J. W. T., et al. 2016, Natur, 531, 202
- Tavani (2019) Tavani, M. 2019, RLSFN, 30, 13
- Tavani et al. (2009) Tavani, M., Barbiellini, G., Argan, A., et al. 2009, A&A, 502, 995
- Tavani et al. (2021) Tavani, M., Casentini, C., Ursi, A., et al. 2021, NatAs, 5, 401
- Tavani et al. (2011) Tavani, M., Marisaldi, M., Labanti, C., et al. 2011, Physical Review Letters, 106, 018501
- Tavani et al. (2020) Tavani, M., Verrecchia, F., Casentini, C., et al. 2020, ApJ, 893, L42
- Thompson & Duncan (1996) Thompson, C. & Duncan, R. C. 1996, ApJ, 473, 322
- Ursi et al. (2019) Ursi, A., Tavani, M., Verrecchia, F., et al. 2019, ApJ, 871, 27
- Verrecchia et al. (2019) Verrecchia, F., Tavani, M.,Bulgarelli, A., et al., 2019, RLSFN, 30, 71
- Verrecchia et al. (2017) Verrecchia, F., Tavani, M., Donnarumma, I., et al. 2017, ApJ, 850, L27