High-performance, compact optical standard
Abstract
We describe a high-performance, compact optical frequency standard based on a microfabricated Rb vapor cell and a low-noise, external cavity diode laser operating on the Rb two-photon transition at . The optical standard achieves an instability of for times less than and a flicker noise floor of ut to . At long integration times, the instability is limited by variations in optical probe power and the AC Stark shift. The retrace was measured to fter 30 hours of dormancy. Such a simple, yet high-performance optical standard could be suitable as an accurate realization of the SI meter or, if coupled with an optical frequency comb, as a compact atomic clock comparable to a hydrogen maser.
Two-photon transitions in alkali and alkaline earth metals are considered promising candidates for simple, field-deployable optical frequency references and optical clocks [1, 2]. To first-order, Doppler-free spectroscopy can be accomplished by driving the transition using counter propagating beams at the same frequency, resulting in narrow lines. Because atoms in all velocity classes contribute to the signal and because two-photon transitions are typically observed in fluorescence through decay channels at a wavelength distinct from the driving field, measurements of such transitions can be performed with high signal-to-noise ratios. As a result, optical standards based on two-photon transitions can achieve excellent stability and accuracy.
The two-photon transition in Rb at was studied extensively as an optical frequency reference throughout the 1990s and early 2000s [3, 4, 5]. The short-term frequency stability of these early tabletop systems [5, 4] was measured at out to . More recently, improved long-term performance has been demonstrated at out to [6]. Dichroic standards are also being developed, in which much smaller detunings from the intermediate level result in larger signals, at the cost of increased light shift [7, 8]. With the recent progress in miniaturization of frequency comb technology (both fiber and microresonator based) there has been renewed interest in the Rb two-photon transition for use as the local oscillator in a compact low power optical clock [9, 6]. To that end, our group recently demonstrated a miniature optical reference, with the optical bench having a total volume , and performance of , limited by the frequency noise of the semiconductor probe laser [10].
In this Letter, we stabilize a near-infrared, external cavity diode laser (ECDL) to the two-photon transition in rubidium-85 confined in a microfabricated vapor cell. We achieve an instability of from , comparable to or outperforming previous measurements of the two-photon standard over these time scales. In the current configuration, the laser achieves an instability of at .
Figure 1 shows a schematic of the optical standard which consists of an stabilized to the , two-photon transition in rubidium-85. Figure 1(b) gives a close-up view of the vapor cell, which employs an in-line geometry for probing and measuring the two-photon transition [9], in which the counter-propagating beams necessary for avoiding Doppler-broadening of the transition are generated by retro-reflecting the laser off a high reflectivity dielectric coating on the back of a planar, microfabricated cell. We introduce rubidium into the cell by laser activatation of a rubidium dispenser compound after the cell is sealed. While this introduces some unwanted background gases, it serves as a convenient way to load atoms into a -scale cell. The addition of a non-evaporable getter helps preserve good vacuum inside the chamber that allows us to do high-resolution spectroscopy and helps mitigate some of the shifts associated with background gases from the dispenser.
A photomultiplier tube placed at the back of the cell detects excitation of the transition via fluorescence at . In contrast, laboratory scale rubidium two-photon standards typically locate the PMT adjacent to the vapor cell [11, 5, 6]. The compact cell geometry also reduces the sensitivity of average probe beam power due to angular misalignment of the beam steering optics, as the sensitivity scales as roughly the square of the beam propagation length for the simple retro-reflection geometry [12].
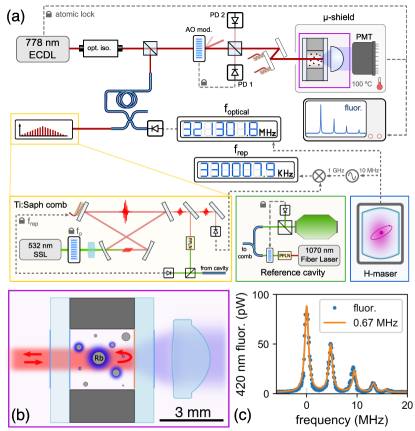
We measure the frequency of the ECDL by comparing the heterodyne beat between the ECDL and a mode of a self-referenced, repetition-rate, titanium sapphire frequency comb [13] locked to an ultrastable optical cavity [14]. At short integration times the frequency comb stability, determined by the stability of the reference cavity ( at ), is more than sufficient for measuring the frequency of the ECDL. However, at long integration times linear drift of the cavity is a limiting factor in our measurements. To work around this issue, we track the cavity drift by measuring the repetition of the Ti:sapph laser against a maser-synthesized tone and subtract a fourth-order polynomial fit of the frequency drift from the ECDL-comb beat in the optical domain.
Figure 1(c) shows a spectrum (blue dots) of the hyperfine components ( to ) of the clock transition as the laser frequency is swept across the resonance with a fit (orange line) that gives a linewidth of . The observed linewidth includes contributions from the natural linewidth (), collisional broadening () from helium that diffuses into the cell through the glass windows, transit time broadening () resulting from the finite interaction time of the atoms with the laser [15], the laser linewidth () and resulting from collisions with unwanted background gases that arise from introducing rubidium into the cell. These contributions are consistent with earlier measurements of similar microfabricated cells [9].
Figure 2(a) shows a time-series of the locked laser frequency from which we calculate the Allan deviation of the optical standard, shown in Fig. 2b. The typical performance of the system is well characterized by the data set (orange). At longer times () we observe a flicker noise floor of , and attribute this to ac Stark shifts caused by instability of the laser probe intensity as described in the following section. During time periods where the intensity of the driving field is more stable, however, we commonly see improved performance as exemplified by the data set (blue).
We first consider the short-term instability, which scales as for times less than . There are two main contributions to this instability that we assess in panels (c) and (d). Panel (c) shows the measured frequency noise spectrum , of the free-running ECDL. According to [16], the short term instability limit imposed by frequency noise of the local oscillator (intermodulation noise) is , where corresponds to the dither frequency used to generate the error signal via lock-in detection, and is the clock laser frequency. For our system, this corresponds to and an instability of . For reference, integration of the free-running frequency noise of the laser below the -line (shaded red region) yields a linewidth.
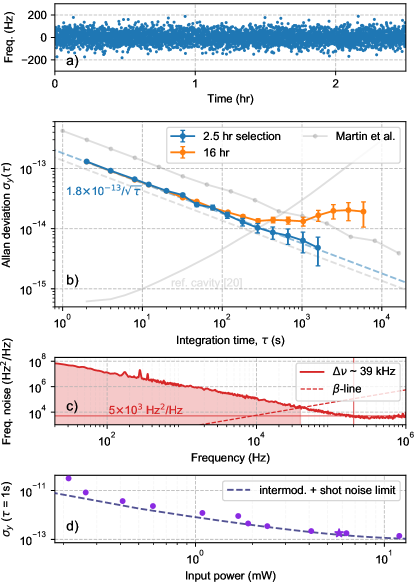
Figure 2(d) shows the scaling of the short term instability at averaging time with input probe power . For an instability limited by fluorescence photon shot noise, we expect the instability to scale as , which agrees well with the observations for powers less than . The dashed line in Fig 2(d) is a fit to the instability data where a term that scales as and a constant offset of corresponding to the intermodulation limit, have been added in quadrature. This model fits the instability data well and indicates that operating at powers larger than does not further improve the short term instability due to the limit imposed by intermodulation noise for this laser. The time series data presented in Fig. 2 are taken with an input power of , as denoted by the star in panel (d).
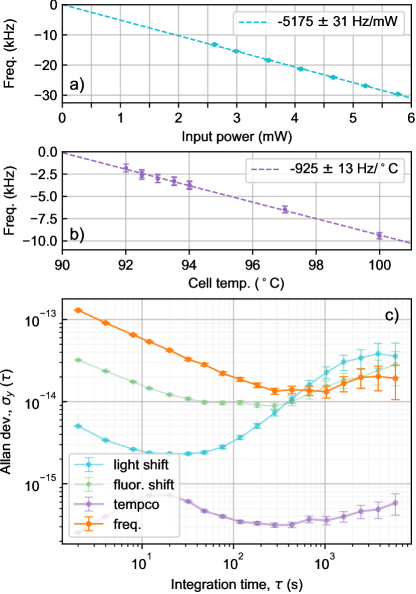
Figure 3 summarizes measurements of systematic effects that limit the stability of the optical reference at long times. Panels (a) and (b) show measurements of the ac Stark shift and vapor cell temperature shift, respectively. In panels (a) and (b), the input power and cell temperature are recorded using in-loop control measurements. Panel (c) shows the limits to the the laser instability imposed by the ac Stark shift and cell temperature variation as recorded by out-of-loop measurements for the laser power and cell temperature (PD2 as shown in 1(b) and a auxiliary thermistor placed in the cell mount).
A measurement of the fluorescence amplitude, which is proportional to the square of the probe power, provides a second out-of-loop monitor of the laser power. Figure 3(c), shows fractional instabilities for both these out-of-loop measurement techniques. We find that both of these out-of-loop power measurements overestimate the actual variation observed in operation of the optical standard at integration times longer than .
Figure 4 shows prior measurements of 85Rb, transition corrected for zero optical power [3, 17, 18, 19, 20, 21, 22]. Taking the mean value of our 16 hour measurement campaign, and correcting for zero optical power and cell temperature, we measure the frequency of our optical standard to be (385 285 142 369 5) (red circle). This corresponds to a frequency difference -6 5 from the BIPM (2005) accepted transition frequency [18, 19]. The uncertainty of corresponds to the cell temperature shift over the typical operating temperature range of to .
Frequency shifts due to collisions with background gas impurities typically limit the accuracy of vapor cell optical references [4, 21]. Previous measurements made using fused silica or pyrex cells are likely to contain of helium due to permeation of atmospheric helium into the cell, leading to a frequency shift of compared to an evacuated cell [23]. In contrast, the vapor cell used in this work is fabricated using low helium permeability aluminosilicate glass windows, with a predicted helium leak rate [24] of , and negligible frequency shift due to collisions with helium. Our rubidium cell loading method introduces additional background gases into the cell that we subsequently attempt to remove using pumping from a non-evaporable getter. Thus, estimating the additional background gas impurities after the cell is sealed is difficult, but our two-photon linewidth and frequency measurements are consistent with pressures of less than .
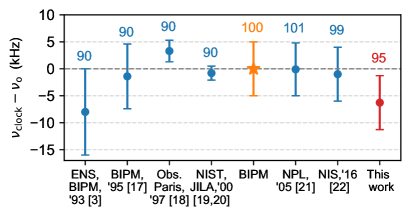
Figure 5 shows a retrace measurement. Retrace, as described by Vanier et. al. [25], in the context of our optical standard refers to a change in the clock laser frequency after the system power has been cycled and is particularly relevant for battery-powered or portable frequency standards. Figure 5 shows a fractional retrace measurement for the optical standard with a --- ’on’-’off’-’warmup’-’on’ cycle.
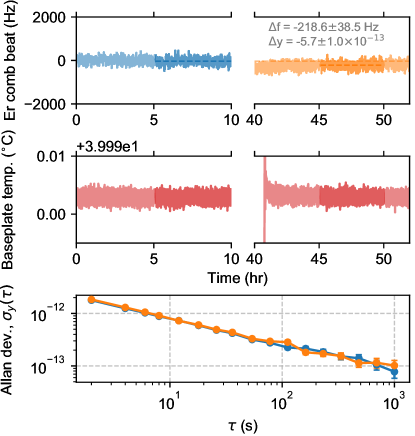
After a warm up period of , we achieve a retrace of , which represents an improvement of close to compared to the retrace of the chip-scale atomic clock [26]. The warm up time of is currently limited by thermalization of the optical bread board base plate, which could be reduced in the future by implementing a more compact physics package. This improvement in retrace will be important for applications where a portable clock needs to achieve a high level of accuracy after turn on when disciplining to a reference oscillator (e.g., GNSS timing) is impracticable.
In summary, we have demonstrated a high quality standard and presented a framework for future evaluations of compact optical references (absolute frequency combined with retrace measurements). Based on our measurements, we believe optical standards based on optical transitions in warm alkali vapors, such as rubidium, can support even higher performance; in fact we have observed at 1s using a low noise clock laser. We suspect short term instabilities at the level are within reach by utilizing high power, low noise laser in conjunction with a light shift mitigating interrogation scheme [27].
Funding information. Defense Advanced Research Projects Agency (DARPA); Atomic Clocks with Enhanced Stability (ACES).
Acknowledgement. The authors would like to thank Samuel Brewer for his assistance in operating the optical reference cavity as well as Jenifer Black and Andrew Ferdinand for comments on the manuscript. The views, opinions and/or findings expressed are those of the authors and should not be interpreted as representing the official views or policies of the Department of Defense or the U.S. Government. Any mention of commercial products is for information only; it does not imply recommendation or endorsement by NIST. Distribution Statement "A" (Approved for Public Release, Distribution Unlimited).
Disclosure. ZLN is a co-founder of Octave Photonics, a company specializing in nonlinear nanophotonics with applications for optical clocks.
References
- [1] G. Grynberg and B. Cagnac, “Doppler-free multiphotonic spectroscopy,” \JournalTitleReports on Progress in Physics 40, 791–841 (1977).
- [2] J. L. Hall, M. Zhu, and P. Buch, “Prospects for using laser-prepared atomic fountains for optical frequency standards applications,” \JournalTitleJournal of the Optical Society of America B 6, 2194 (1989).
- [3] F. Nez, F. Biraben, R. Felder, and Y. Millerioux, “Optical frequency determination of the hyperfine components of the two-photon transitions in rubidium,” \JournalTitleOptics Communications 102, 432–438 (1993).
- [4] L. Hilico, R. Felder, D. Touahri, O. Acef, A. Clairon, and F. Biraben, “Metrological features of the rubidium two-photon standards of the BNM-LPTF and Kastler Brossel Laboratories,” \JournalTitleThe European Physical Journal Applied Physics 4, 219–225 (1998).
- [5] M. Poulin, C. Latrasse, D. Touahri, and M. Têtu, “Frequency stability of an optical frequency standard at 192.6 THz based on a two-photon transition of rubidium atoms,” \JournalTitleOptics Communications 207, 233–242 (2002).
- [6] K. W. Martin, G. Phelps, N. D. Lemke, M. S. Bigelow, B. Stuhl, M. Wojcik, M. Holt, I. Coddington, M. W. Bishop, and J. H. Burke, “Compact Optical Atomic Clock Based on a Two-Photon Transition in Rubidium,” \JournalTitlePhysical Review Applied 9, 014019 (2018).
- [7] C. Perrella, P. S. Light, J. D. Anstie, F. N. Baynes, R. T. White, and A. N. Luiten, “Dichroic Two-Photon Rubidium Frequency Standard,” \JournalTitlePhysical Review Applied 10, 54063 (2019).
- [8] V. Gerginov and K. Beloy, “Two-photon Optical Frequency Reference with Active ac Stark Shift Cancellation,” \JournalTitlePhysical Review Applied 10, 014031 (2018).
- [9] Z. L. Newman, V. Maurice, T. E. Drake, J. R. Stone, T. C. Briles, D. T. Spencer, C. Fredrick, Q. Li, D. A. Westly, B. R. Illic, B. Shen, M.-G. Suh, K. Youl Yang, C. Johnson, D. M. S. Johnson, L. W. Hollberg, K. J. Vahala, K. Srinivasan, S. A. Diddams, J. E. Kitching, S. B. Papp, and M. T. Hummon, “Architecture for the photonic integration of an optical atomic clock,” \JournalTitleOptica 6, 680–685 (2019).
- [10] V. Maurice, Z. L. Newman, S. Dickerson, M. Rivers, J. Hsiao, P. Greene, M. Mescher, J. Kitching, M. T. Hummon, and C. Johnson, “Miniaturized optical frequency reference for next-generation portable optical clocks,” \JournalTitleOptics Express 28, 24708 (2020).
- [11] J. E. Bernard, a. a. Madej, K. J. Siemsen, L. Marmet, C. Latrasse, D. Touahri, M. Poulin, M. Allard, and M. Têtu, “Absolute frequency measurement of a laser at 1556 nm locked to the 5S1/2 - 5D5/2 two-photon transition in 87Rb,” \JournalTitleOptics Communications 173, 357–364 (2000).
- [12] K. W. Martin, B. Stuhl, J. Eugenio, M. S. Safronova, G. Phelps, J. H. Burke, and N. D. Lemke, “Frequency shifts due to Stark effects on a rubidium two-photon transition,” \JournalTitlePhysical Review A 100, 023417 (2019).
- [13] T. M. Fortier, A. Bartels, and S. A. Diddams, “Octave-spanning Ti:sapphire laser with a repetition rate >1 GHz for optical frequency measurements and comparisons,” \JournalTitleOptics Letters 31, 1011 (2006).
- [14] B. C. Young, F. C. Cruz, W. M. Itano, and J. C. Bergquist, “Visible Lasers with Subhertz Linewidths,” \JournalTitlePhysical Review Letters 82, 3799–3802 (1999).
- [15] F. Biraben, M. Bassini, and B. Cagnac, “Line-shapes in Doppler-free two-photon spectroscopy. The effect of finite transit time,” \JournalTitleJournal de Physique 40, 445–455 (1979).
- [16] C. Audoin, V. Candelier, and N. Dimarcq, “A limit to the frequency stability of passive frequency standards due to an intermodulation effect,” \JournalTitleIEEE Transactions on Instrumentation and Measurement 40, 121–125 (1991).
- [17] R. Felder, D. Touahri, O. Acef, L. Hilico, J.-J. Zondy, A. Clairon, B. de Beauvoir, F. Biraben, L. Julien, F. Nez, and Y. P. Millerioux, “Performance of a GaAlAs laser diode stabilized on a hyperfine component of two-photon transitions in rubidium at 778 nm,” \JournalTitleLaser Frequency Stabilization and Noise Reduction 2378, 52 (1995).
- [18] D. Touahri, O. Acef, A. Clairon, J.-J. Zondy, R. Felder, L. Hilico, B. de Beauvoir, F. Biraben, and F. Nez, “Frequency measurement of the two-photon transition in rubidium,” \JournalTitleOptics Communications 133, 471–478 (1997).
- [19] D. J. Jones, S. A. Diddams, J. K. Ranka, A. Stentz, R. S. Windeler, J. L. Hall, and S. T. Cundiff, “Carrier-Envelope Phase Control of Femtosecond Mode-Locked Lasers and Direct Optical Frequency Synthesis Carrier-Envelope Phase Control of Femtosecond Mode-Locked Lasers and Direct Optical Frequency Synthesis,” \JournalTitleScience (New York, N.Y.) 288, 635 (2000).
- [20] S. Diddams, D. Jones, J. Ye, S. Cundiff, J. Hall, J. Ranka, R. Windeler, R. Holzwarth, T. Udem, and T. Hänsch, “Direct Link between Microwave and Optical Frequencies with a 300 THz Femtosecond Laser Comb,” \JournalTitlePhysical Review Letters 84, 5102–5105 (2000).
- [21] C. S. Edwards, G. P. Barwood, H. S. Margolis, P. Gill, and W. R. C. Rowley, “Development and absolute frequency measurement of a pair of 778nm two-photon rubidium standards,” \JournalTitleMetrologia 42, 464–467 (2005).
- [22] O. Terra and H. Hussein, “An ultra - stable optical frequency standard for telecommunication in rubidium,” \JournalTitleApplied Physics B 122, 1–12 (2016).
- [23] N. D. Zameroski, G. D. Hager, C. J. Erickson, and J. H. Burke, “Pressure broadening and frequency shift of the 5S 1/2 to 5D 5/2 and 5S 1/2 to 7S 1/2 two photon transitions in 85 Rb by the noble gases and N 2,” \JournalTitleJ. Phys. B: At. Mol. Opt. Phys 47, 225205 (2014).
- [24] A. T. Dellis, V. Shah, E. A. Donley, S. Knappe, J. Kitching, A. R. T. D. Ellis, V. I. S. Hah, E. L. A. D. Onley, S. V. K. Nappe, A. T. Dellis, V. Shah, E. A. Donley, S. Knappe, and J. Kitching, “Low helium permeation cells for atomic microsystems technology,” \JournalTitleOptics Letters 41, 2775 (2016).
- [25] J. Vanier, J. Gagnepain, W. Riley, F. Walls, and M. Granveaud, “Aging, warm-up time and retrace: important characteristics of standard frequency generators (Proposal for IEEE Standards Project P1193),” \JournalTitleProceedings of the 1992 IEEE Frequency Control Symposium pp. 807–815 (2003).
- [26] Microsemi Space Chip Scale Atomic Clock data sheet., https://www.microsemi.com/document-portal/doc_download/1243238-space-csac-datasheet.
- [27] V. Yudin, M. Y. Basalaev, A. Taichenachev, J. Pollock, Z. Newman, M. Shuker, A. Hansen, M. Hummon, R. Boudot, E. Donley, and J. Kitching, “General methods for suppressing the light shift in atomic clocks using power modulation,” \JournalTitlePhys. Rev. Applied 14, 024001 (2020).