0 \vgtccategoryResearch \vgtcpapertypeplease specify \authorfooter Yuncong Yu is with IAV GmbH. E-mail: yuncong.yu@iav.de. Dylan Kruyff is with Utrecht University. E-mail: d.l.w.kruyff@students.uu.nl Tim Becker is with IAV GmbH. E-mail: tim.becker@iav.de. Michael Behrisch is with Utrecht University. E-mail: m.behrisch@uu.nl. \shortauthortitleYu et al.: PSEUDo: Multivariate Time Series Exploration Using Locality Sensitive Hashing
PSEUDo: Interactive Pattern Search in Multivariate Time Series with Locality-Sensitive Hashing and Relevance Feedback
Abstract
We present PSEUDo, an adaptive feature learning technique for exploring visual patterns in multi-track sequential data. Our approach is designed with the primary focus to overcome the uneconomic retraining requirements and inflexible representation learning in current deep learning-based systems. Multi-track time series data are generated on an unprecedented scale due to increased sensors and data storage. These datasets hold valuable patterns, like in neuromarketing, where researchers try to link patterns in multivariate sequential data from physiological sensors to the purchase behavior of products and services. But a lack of ground truth and high variance make automatic pattern detection unreliable. Our advancements are based on a novel query-aware Locality-Sensitive Hashing technique to create a feature-based representation of multivariate time series windows. Most importantly, our algorithm features sub-linear training and inference time. We can even accomplish both the modeling and comparison of 10,000 different 64-track time series, each with 100 time steps (a typical EEG dataset) under 0.8 seconds. This performance gain allows for a rapid relevance feedback-driven adaption of the underlying pattern similarity model and enables the user to modify the speed-vs-accuracy trade-off gradually. We demonstrate PSEUDo’s superiority in terms of efficiency, accuracy, and steerability through a quantitative performance comparison and a qualitative visual quality comparison to the state-of-the-art algorithms in the field. Moreover, we showcase PSEUDo’s usability through a case study demonstrating our visual pattern retrieval concepts in a large meteorological dataset. We find that our adaptive models can accurately capture the user’s notion of similarity and allow for an understandable exploratory visual pattern retrieval in large multivariate time series datasets.
keywords:
Sublinear Time Visual Analytics, Locality-Sensitive Hashing, Relevance Feedback-Driven ExplorationK.6.1Management of Computing and Information SystemsProject and People ManagementLife Cycle;
\CCScatK.7.mThe Computing ProfessionMiscellaneousEthics
\teaser
![[Uncaptioned image]](/html/2104.14962/assets/x1.png) The PSEUDo system. Based on an adaptive Locality-Sensitive Hashing algorithm (can be typically learned in near real-time), we extract a visual pattern similarity model adopted for interactive exploration. Using a relevance-feedback mechanism, the user can interactively modify the current notion of pattern interestingness
or give more impact on the accuracy-vs-speed trade-off in the model’s retrieval uncertainty.
The PSEUDo system. Based on an adaptive Locality-Sensitive Hashing algorithm (can be typically learned in near real-time), we extract a visual pattern similarity model adopted for interactive exploration. Using a relevance-feedback mechanism, the user can interactively modify the current notion of pattern interestingness
or give more impact on the accuracy-vs-speed trade-off in the model’s retrieval uncertainty.
- DBA
- Dynamic Time Warping Barycenter Averaging
- DTW
- Dynamic Time Warping
- DTWD
- Dynamic Time Warping Dependent
- ED
- Euclidean Distance
- LSH
- Locality-Sensitive Hashing
- MTS
- Multivariate Time Series
- PAA
- Piecewise Aggregate Approximation
- SAX
- Symbolic Aggregate approXimation
- QALSH
- Query-Aware Locality Sensitive Hashing
- UTS
- Univariate Time Series
Introduction
Although Deep Learning models have led to a rejuvenation of artificial intelligence along with tremendous progress on practical problems, the non-scalable training process inhibits their application in highly exploratory and dynamic use cases. Consequently, these advanced techniques are limited to offline preprocessing machineries, specifically tailored to a few data analysis tasks [18, 28]. In the context of exploratory analysis, however, we need more flexible solutions, as the nuanced interplay between exploration and exploitation requires the ability to constantly (re-)define our exploration models[70]. In this line of research, and particularly in this paper, we are therefore choosing a complementary path and explore sub-linear machine learning algorithms whose training times are a fraction of the time needed for training deep neural networks. This speedup opens up new opportunities to promptly react to the newly occurring problem sets by, e.g., constant model (re-)evaluation/training or on-the-fly relevance feedback adaption of the underlying exploration model.
With PSEUDo, we present a system for interactive visual pattern exploration in large Multivariate Time Series (MTS). We chose this domain since it exposes a range of interesting challenges from the Visual Analytics and the technical perspective. From the Visual Analytics point of view, pattern search in MTS data is inherently a user-centered problem as the data analysts’ domain understanding is the key factor in the pattern exploration and interpretation process[2]. A study by Correll and Gleicher[21] shows that no single algorithm accounts for human judgments of time series similarity. This dilemma, coined biased similarity, implies that a canonical representation (featurization) of patterns, or what a retrieval index can capture, is only part of the solution. The remainder is retrieving interesting patterns based on the user’s notion of similarity. To define similarity, researchers have created various distance metrics[35] and, similar to our approach in PSEUDo, (adaptive) search and manifold learning strategies[12, 23, 60].
The next challenge for pattern search in MTS is cognitive biases, particularly the confirmation bias, i.e., people tend to search for, interpret, favor, and recall information in a way that confirms their prior beliefs, and more generally, Pareidolia, people’s tendency for an incorrect perception of a stimulus as a pattern[80, 24]. Even experienced domain experts oversee striking pattern(-combinations) only because they are biased or overwhelmed by information overload. In PSEUDo, we can circumvent these problems by combining interactive pattern detection with unbiased or even bias-counteracting recommendation algorithms. As we will present in this work, this approach has several advantages. For example, since the interestingness of patterns is not solely determined by the computer, we can offer a mixed-initiative system in which the user has full governance over the pattern retrieval process. Another advantage is the exploration models’ unbiased representation of the feature or latent space capturing the dataset’s information. As such, we can always recommend unexplored pattern spaces, hence actively combating the expert’s cognitive biases.
As a technical challenge, it is evident that the sheer size of MTS datasets requires advanced search and retrieval algorithms to capture the potentially inter-linked multi-track patterns; i.e., a 60min EEG epilepsy/seizure screening dataset captured on 32-channels with 1000Hz amounts to 3.7GB of raw data; typically, hundreds of subjects participate in these studies[43]. Even after applying sophisticated data compression techniques and efficient data structures, pattern search still requires an enormous number of comparisons, where the number is the product of time steps and dimension of measured features. A human alone is unable to accomplish this task. However, even for computers, this investigation is not trivial, as demonstrated by a plethora of approaches targeting the automated analysis of Univariate Time Series (UTS) [38, 51, 31, 36, 53]. The investigation of MTS, as in this paper, is inevitably more complex. Even though MTS are “just” an agglomeration of multiple tracks or dimensions, and each track itself is just an agglomeration of several data points (feature expressions), we cannot treat these points independently. All values are potentially correlated and form an intertwined dependency network of temporal patterns, one example being the (time-delayed) gene-protein reaction chains studied in computational ecogenomics[75]. This property distinguishes MTS data from most other data types and requires custom solutions to general data analysis problems.
We propose PSEUDo, a scalable (visual) pattern analysis technique based on the conceptual idea of relevance feedback-driven exploration[9], allowing us to tackle all four challenges. Our method focuses on a human-in-the-loop approach in which we combine a query-aware adaption of Locality-Sensitive Hashing (LSH) with a novel feedback-driven active learning algorithm. Our feature learning and indexing technique allows for capturing and adapting the notion of similarity between visual patterns in MTS in near real-time. LSH refers to a set of probabilistic functions, known as LSH families, to hash data points into buckets. Similar data points are located in the same buckets (with high probability), while dissimilar data is likely to be placed in different buckets[47]. If LSH functions are defined for a metric space, like in our case, the buckets even imply a distance between each other[33]. PSEUDo actively makes use of these ideas and maps time series windows into buckets in hash tables. Hash collisions indicate groups of similar time series window candidates. The final result of LSH is obtained by an ensemble of all hash tables[42]. In PSEUDo, we exploit this ensemble step to convey the subjectively perceived similarity between visual patterns to our LSH model. We implemented this relevance feedback mechanism through feature weighting, attaching more importance to positively labeled time series samples and hash tables that better reflect our notion of similarity.
We make PSEUDo accessible through a prototypical interface and evaluate the potential of our idea in a series of technical and real-world evaluation scenarios. Our logical first step is to prove our LSH algorithm’s capabilities to capture visual features in sequential datasets. To ensure comparability, we conducted six quantitative experiments using standard information retrieval metrics, like recall and accuracy, on four MTS datasets and compare ourselves with four state-of-the-art TS analysis algorithms, Dynamic Time Warping Dependent (DTWD)[62], Symbolic Aggregate approXimation (SAX)[54], Euclidean Distance (ED). We find that our model retrieves patterns with similar accuracy but significantly outperforms all other approaches in terms of processing and retrieval speed whenever the track-size increases or the pattern shape matching process is getting non-trivial. Additionally, we conducted one UTS experiment with the aforementioned algorithms and the recently introduced autoencoder-based technique PEAX[51]. We achieve over 2160x faster processing speed with our slowest but most accurate implementation variant compared to PEAX, thus enabling interactive and steerable retrieval of visual patterns now also in large and multi-track temporal datasets. We evaluate PSEUDo’s usability in a series of case studies, which we will demonstrate in the paper and the paper appendix. These case studies demonstrate how analysts can use PSEUDo to capture and adapt their subjectively perceived pattern similarity effectively, how this adaption blends into their analysis, and how it contributes to a faster and user-centered exploration.
1 Requirement Analysis and Background
This section gives an overview of the domain, its challenges, and recent advancements. To keep the didactic flow, we decided to layout PSEUDo’s primary embedding into the relevant academic topics in this section and elaborate on the gap in the related work in section 5.
1.1 Requirements for Multi-Track Time Series Exploration
PSEUDo has been developed for the analysis of MTS datasets. These datasets find wide application in various disciplines, such as marketing and finance, biological and medical research, network security, IoT, or video and audio analysis[46, 1]. We conducted a broad, serendipitous literature research spanning various domains starting from the past years IEEE VIS and Eurographics EuroVIS papers. We collected an initial list of requirements for MTS data visualizations and analysis. To be of practical use for the broad public, we generalize our criteria to be domain-independent based on our experience in the field.
-
R1
Scalable time complexity. The query-relevant size of MTS grows exponentially with the number of time steps and tracks. Processing algorithms should, therefore, scale (sub-)linearly with respect to the query size, dataset size, and number of tracks.
-
R2
Adaptive similarity definition. Similarity perception differs from user to user[63]. As a result, the similarity measure should be adjustable and should converge to the user’s wishes.
-
R3
Accurate pattern retrieval. Based on a notion of similarity, the pattern retrieval algorithm should find the majority of similar patterns with high accuracy, e.g., . On top of that, the algorithm should accurately approximate the degree of similarity between a pattern and the query.
-
R4
Interactive querying and model steering. On the one hand, users need a mechanism to define a visual search pattern, for instance, through query-by-sketch or query-by-example[21], and on the other hand, a way to steer the retrieval process. One opportunity here is active learning-based approaches that rely on the user’s explicit relevance feedback, such as in[9, 23, 51].
-
R5
Understandable process. To understand the data and algorithm changes, transparent and user-friendly visualization of the model’s internal mechanism and results is necessary.
-
R6
Free exploration. The user should be able to engage freely with the data to find and explore patterns. As user feedback may change the direction of the pattern search, users need a way to revert or adapt query- and similarity definitions flexibly.
Our requirement analysis lays the foundation of PSEUDo’s design and will be referred to throughout this work. We distinguish two categories: technical/algorithmic and Visual Analytics. On the technical side, we highlight the need for a scalable R1, accurate R3, steerable R4 (through relevance feedback) and understandable R5 visual MTS analysis processes. From the Visual Analytics perspective, we require that our interface supports and fosters querying R4, feedback interaction R2, exploration R6, and transparency R5.
Our requirement gathering approach led us to an interesting secondary finding that we would like to share: Although several domains have already put a great accent on time series pattern visualization and mining[2, 14, 39, 25], a thorough and systematic MTS task taxonomy is still missing. We plan to fill this gap in the literature soon.
1.2 PSEUDo’s Powerhouse: Locality-Sensitive Hashing
The bedrock of our computational approach is laid on LSH[42]. In general, hashing-based algorithms excel in low time-complexity during model building and inference and a small model footprint, especially for large datasets. LSH inherits the high speed while differing from the other hashing algorithms in that it maps similar data objects to close hash codes. This enables its application in a wide range of data mining problems, like nearest neighbor search[42, 41], hierarchical clustering[48, 20] and near-duplicate detection[22].
The classical (vector-based) LSH conceives data objects in the database as points in a high dimensional space. The hash function describes a set of random hyperplanes cutting the space into disjoint subspaces[42]. Each subspace corresponds to a bucket in the hash table, meaning that the entry points in the same subspace fall into the same hash table bucket. To reduce false positives and false negatives (especially the latter), multiple hash functions, i.e., multiple sets of hyperplanes, are used. All the entries that collide with the query under at least one hash function are treated as candidates. Subsequently, the candidates can be filtered in a second stage to suppress false positives.
Since LSH is considerably fast, one can even postpone part of the model building process to the querying phase, as suggested by Query-Aware Locality Sensitive Hashing (QALSH) in the context of high-dimensional data retrieval[41]. By using the query’s hash code as an anchor for partitioning the hash tables, QALSH yields better accuracy while accelerating the hashing with simpler hash functions.
Recently, LSH received attention also for time series indexing. Up to 20x faster processing speeds with nearly the same accuracy as state-of-the-art algorithms could be achieved[59]. Shortly after, a query-aware LSH approach for multivariate cases was demonstrated by Yu et al.[82]. This work builds the cornerstones of our system. In PSEUDo, we contribute to the QALSH-MTS algorithm of Yu et al. with a structural modification: Our method uses a distance metric on the hash functions instead of the original data, thus turning the approach into an approximate retrieval algorithm (we will detail this aspect in subsection 2.1). This modification has the benefit of introducing a relevance feedback mechanism to tackle the problem of subjectivity in the notion of similarity, i.e., no single similarity measure accounts for human judgment of time series similarity[21]. Moreover, our processing time stays constant as the number of tracks increases (in the original QALSH-MTS algorithm we have a linear growth). On the downside, our approximations naturally lead to a slight decrease in accuracy, which is, on the other hand, only an academic consideration in our exploratory data analysis setting.
1.3 Recent Developments: Deep Learning-based Interactive Visual Pattern Search
One development has sparked particularly our critical reflection with this analysis field and specifically the of topic economic efficiency. Recently, novel deep-learning-based interactive visual pattern search algorithms were introduced; see, e.g., [74, 40] for an overview. One prominent and thorough example is PEAX, “a novel feature-based technique for interactive visual pattern search in sequential data”[51] by Lekschas et al. PEAX uses an autoencoder to extract the TS representations for each window (feature vector) from a dataset. After this (static) featurization stage, an adaptive classifier receives binary relevance feedback from a user. It uses this feedback to influence the pattern retrieval algorithm by adapting the importance of latent-space dimensions. Similar approaches were presented, e.g., for image data[76], TS data[36, 31, 68], or even information visualizations[60, 37].
We claim that Deep Learning-, and particularly autoencoder-based concepts are only sustainable for VA in pattern-wise strongly confined application fields. These are fields in which visual pattern occurrences do not or only linearly influence each other, such as in univariate or single-track time series. In MTS data, patterns affect each other through delay or spread and even over multiple tracks. One possible solution for autoencoders, in this case, is to concatenate individual channels and featurize them as one. But not only does this invoke the curse of dimensionality, but it also eliminates the possibility of capturing inter-channel correlations. This problem is general and exists in several other domains, such as textual/discourse, network, or video data analysis.
Secondly, the use of autoencoders imposes further drawbacks. An autoencoder training can take hours and even up to days to finish[51] and is then fixed to a specific window or kernel size. This is vastly inconvenient in terms of exploration flexibility. Every time the user wants to change, e.g., the pattern’s window size, the autoencoder needs to be retrained. Furthermore, the autoencoder is trained on a specific domain/dataset. For MTS, this means that the model might be able to extract essential features from one channel but might perform poorly on another track.
We explore an orthogonal approach to this problem based on significantly more light-weight hashing algorithms in this work. Note that we discuss further related work in section 5 at the end of this paper.
2 Classifier Learning using Steerable Locality-Sensitive Hashing based on Relevance Feedback
This section introduces our two primary technical contributions: (1) a novel feedback-driven classifier learning that is based on (2) a novel QALSH adaption. Not only does this method allow pattern search in large MTS to be fast enough for real-time human interaction, but our concept of a steerable LSH is well transferable to other applications. Please note that unless otherwise specified, we use LSH as an abbreviation for QALSH in subsequent sections.
We derive our conceptual model, depicted in Figure 1, from FDive, the feedback-driven preference model learning approach proposed by Behrisch et al.[9]. In light of this conceptual model, we assume that the randomly initialized parameters in LSH functions are trainable, creating room for coping with the ambiguity of time series similarity.
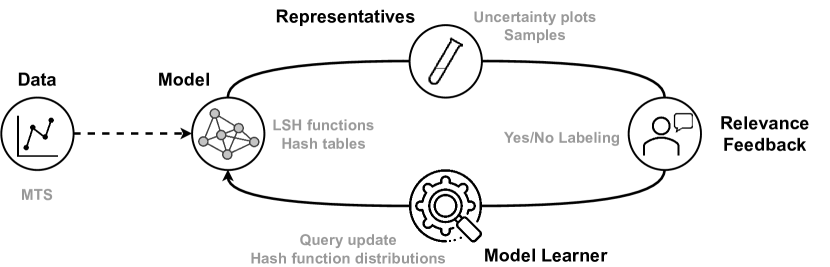
In our conceptual model, input MTS data is modeled with LSH functions and stored in query-aware hash tables. To guarantee a sensible data modeling on top of the probabilistic nature of LSH functions (R1), and combat subjectiveness of similarity (R2), we draw a sample from the hashed time series. This sample set gets checked and (re-)evaluated by the user on the ”average” shape and variance per bucket. This relevance feedback is actively contributing to the interactive pattern search in that PSEUDo learns to estimate the user’s similarity notion and interpret it as feature/track importance. Due to the size and complexity of MTS data, such an open and adaptable exploration process (R4, R6) was unthinkable before within our self-imposed scalability and performance limits. Moreover, we can see that such a user-in-the-loop (active) learning approach not only improves the overall retrieval performance (R3) but also significantly adds to the user understandability (R5) of finding and exploring patterns in MTS.
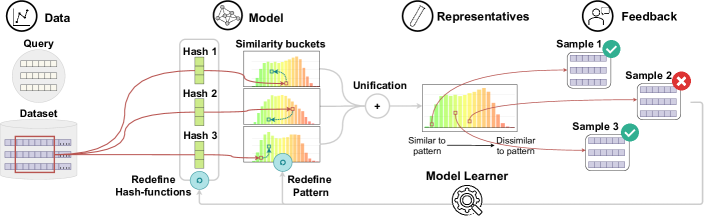
To ensure a precise and concise description of our work, we introduce the following notations: We use lower case letters for scalars, e.g., ; subscript for time steps and for track indices, e.g., and for iterations of training, e.g., ; upper case letter are used for matrices, e.g., ; Vectors are denoted with arrows, like . To describe element-wise operations, vectors and matrices can also be represented per their entries like . We use to denote sampling candidates, with being positively or negatively labeled items. Next, we will explain how we transform our conceptual model into the concrete PSEUDo pipeline depicted in Figure 2.
2.1 Modeling Multivariate Time Series
As Figure 3 depicts, the modeling process begins with partitioning the -dimensional MTS , of length , in which to search for the Query , , with a sliding Window of size (given by ). This approach converts the local pattern search problem into a more frequently addressed problem, namely time series indexing[30, 3, 49]. Subsequently, the windows and the query are normalized to focus on the pattern shape and simplify hashing.
Generally, the modeling follows the approach proposed by Yu et al. in[82], where compound hash functions h(x) are generated, each corresponding to a hash table or a classifier (in Figure 3 omitted for readability). We use “compound hash function”, “hash table”, and “classifier” as synonyms in this work according to the context. Every compound hash function consists of atomic hash functions , each being separately initialized with a vector containing independent elements drawn from the normal distribution (; green boxes in h(x)).
To determine retrieval candidates (Figure 3.2), calculates the dot product of every time step in the time series window with to produce , thus merging tracks in to one univariate hash code of length . A projection collision for a time step occurs when holds with a given error band . Further, a hash collision under an happens if the number of projection collisions between the query and exceeds a user-defined threshold , i.e., for a sub-sequence of the time series. We can make a stronger similarity claim if the hash collision between and happens for all atomic hash functions in a compound hash function. Finally, is considered to be a similarity candidate to , when they collide under at least one of the compound hash functions (Figure 3.2 middle).
Given LSH’s probabilistic traits, a non-deterministic number of candidates can end up in the same bucket as the query (arrow Figure 3.2 to Figure 3.3). The mindful reader can experience this aspect through the counter-intuitive results in our performance experiment in subsection 4.1.
PSEUDo extends on Yu et al.’s conventional MTS modeling scheme[82] by exploiting the univariate hash code of each retrieval candidate. This conceptual extension has two advantages: (1) Rather than calculating the similarity on the high-dimensional dataset, we compute an approximate distance on the low-dimensional hash using any arbitrary distance metric (Figure 3.3), resulting in a speedup from linear to constant time with respect to the number of tracks. And (2), we can react to the user wishes since we can adapt the generated hash functions according to the trained user labels, as we will describe in subsection 2.3. Although the model building appears to be complex, it can be computed instantaneously and allows for rapid adaption (R1, R2).
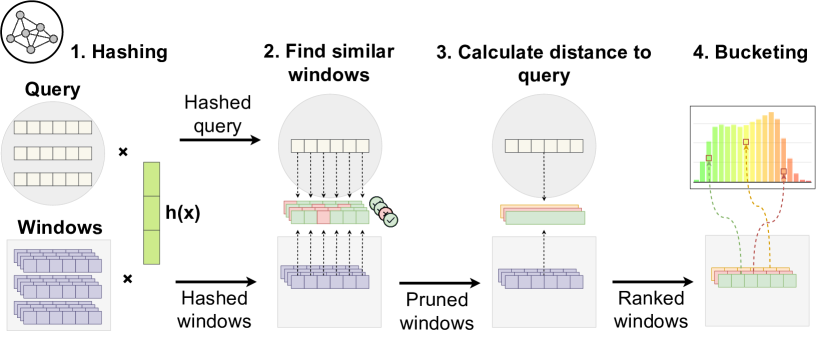
Retrieval Invariances: Our modeling scheme allows us to account for a range of invariances, which has not only an impact on retrieval performance (R3) but also improves high-level understanding (R5) and similarity perception (R2), as recently demonstrated in[34]. While horizontal translational invariance is covered by design through the window-based approach (Figure 3.1), we are inheriting its weakness of not being able to capture signal length invariance, i.e., longitudinally stretched or compressed patterns. Our approach of using a single univariate hash allows us to handle a special type of invariance occurring in MTS data: track-based invariance. To capture distorted/wrapped patterns, i.e., locally morphed shapes, we can even employ an expensive DTW calculation for the few candidate windows in the same bucket as the query (upper bound; Figure 3.3). Amplitude scaling invariance, i.e., compressed or enlarged patterns in the y-axis, is implemented by normalizing across all windows in the first modeling step (Figure 3.1), as it is typically done in window-based methods.
2.2 Representative Sampling and Relevance Feedback
We initiate the model steering in our conceptual model (Figure 1) through the representative selection and relevance feedback steps. These steps allow users to incorporate their own domain experiences and subjectivity and give nuanced feedback on how the application should alter its current state. This process has two components: (1) it is inherently a visual-interactive (interface) problem (R4, R5) and will therefore be elaborated in section 3, and (2) we need to decide which influential samples to show to the user. In PSEUDo, the user can give feedback on two different entities: samples and hash tables/classifiers.
Sample Relevance Feedback: In terms of (un-)classified windows, we can easily expect hundreds or thousands of windows in a database. The user can not process more than maybe a few dozen without being stuck in a tedious labeling process. To follow the central idea of (visual) active learning[27, 4, 23], we choose representatives based on two concepts: exploitation and exploration. Given a query pattern and (initial) feedback from the user, PSEUDo will exploit this feedback to choose archetypal representatives. This allows the user to make further distinctions and refinements between the (so far classified) ”similar” windows (R2). We, therefore, select the top-k results (user parameter; ) from each hash table.
But, if we only restrict ourselves to showing windows that are deemed similar, we will cause an increasing learning bias, as the user can not diverge from the current classifier understanding (R6). To allow for guided exploration, we draw random sample windows from all classifiers, i.e., the average distribution of all individual hash tables.
Classifier Relevance Feedback: As the number of classifiers is limited ( and are usually lower than 5) showing a overview representation of individual classifiers is possible. The model itself already has a simple representation of the classifier, namely a histogram of similarity buckets. Representing the classifier is thus a projection of that part of the model.
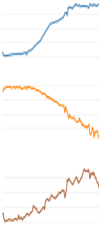
We have to interpret the potentially occurring histogram patterns in the following manner: A positively skewed shape
![]() points to a hash table in which many windows are similar to the query, while a negatively skewed shape
points to a hash table in which many windows are similar to the query, while a negatively skewed shape
![]() means the opposite. Unitary
means the opposite. Unitary
![]() or bi-modal distributions
or bi-modal distributions
![]() refer to undecided, respectively uncertain, classifiers.
refer to undecided, respectively uncertain, classifiers.
2.3 Model Learning
Conventional LSH does not contain trainable parameters. Thus, it cannot be optimized directly by relevance feedback. The randomly initialized parameters in the hash functions, however, do not need to be set once and for all. As described in subsection 2.1, a hash function calculates the dot product with its hashing vector and i-th time step in window . This operation can be interpreted as a weighted merge of tracks in with the track weights in .
To capture the relevance feedback (R2), we propose to modify with a learned weighting vector and use this preference-adapted parameter vector for the similarity calculation. To avoid vanishing and exploding parameters, we want to retain the expectation of the magnitude of , namely . This is achieved by normalizing the magnitude of to . We keep detailed mathematical proof in the Appendix.
We allow two types of relevance feedback in PSEUDo (R4), namely feedback on the classifiers (hash tables) and on the result samples. Consequently, we maintain two weight vectors and for classifiers, respectively samples, to track their importance adoption.
Classifier Relevance Adaption: The feedback on classifiers can be implemented in a straightforward manner. Let be the parameter vectors of all hash functions labelled as positive by the user. Then, we can define . After normalization to magnitude we get
Sample Relevance Adaption: The feedback on the positively labeled samples, , is transformed to a per-track importance. For this, we make use of the DTW distance between the tracks of the positively labeled samples and the query . Let be the j-th track of , the j-th track of . We can define as the aggregate distance between and with . Next, we normalize the entries in between with . Converting distance to its negatively correlated weight vector yields , which is subsequently normalized to
We are unifying both vectors and into through a linear combination with the previous feedback round values , and followed by a normalization (Equation 1) with a learning rate , which can be gradually modified to enforce exploration stability[9].
| (1) | ||||
Query Specificity Adaption: As shown in the second arrow in Figure 2, we not only redefine the LSH hash functions, but also the search pattern. In other words, we actively update the query for specificity based on the received user feedback. In each training iteration, we integrate (search query) and (set of positively labeled samples). This operation is known to be non-trivial[29] and has an impact on future exploration direction. After the trial with the naïve elementwise average yields unsatisfactory results, because the average often resembles none of the original windows, we decided for Dynamic Time Warping Barycenter Averaging (DBA)[66], as it takes distortion and time shift into consideration[66, 29, 32]
3 Interactive and transparent visual interface for Multivariate Time Series retrieval
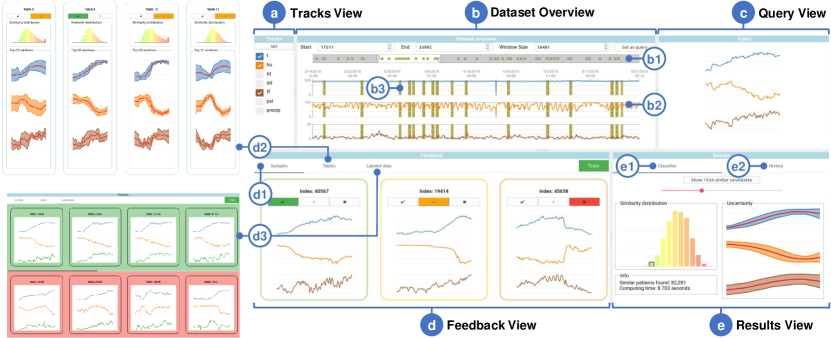
Since capturing and processing human subjectivity is one of the central goals of this project (R2), and to test the PSEUDo’s functionality in a realistic (R6) and (also for us) understandable environment (R5), we designed the visual interface depicted in Figure 4. It consists of five interlinked views facilitating querying, relevance feedback, exploration and transparency, and result overview. The web-based user interface is connected to the PSEUDo backend algorithm through a REST API. Both backend (primarily Python) and frontend code (mostly Angular) are detailed and freely available under https://git.science.uu.nl/vig/sublinear-algorithms-for-va/locality-sensitive-hashing-visual-analytics.
3.1 Dataset Overview, Channels View, and Query View.
The Dataset Overview, Channels View, and Query View collaborate closely. The Dataset Overview (Figure 4.b) plots tracks selected in the Channels View (Figure 4.a) together with the window labels (Figure 4.b3). Besides the direct panning and zooming in the plot, a range slider (Figure 4.b1) above the track curves (Figure 4.b2) serves as a mini-map for navigation and overview of labeled windows. Real-life datasets easily reside over millions of data points, posing a challenge for a fluent interaction and clean visualization design on a screen with limited resolution. While algorithmic, e.g.,[26], or visualization-focused, e.g.,[65], solutions exist that compress data with information loss, we dynamically downsample each track to hundreds of data points during the zoom and increasingly add information to the coarse overview as the user zooms in.
The Query View (Figure 4.c) shows the user-defined multi-track query. Our query is defined in a query-by-example manner by selecting a region in the Dataset Overview (R4, R6). The user is allowed to change the query on-the-fly at any time, but we have to repeat the hashing process whenever the query size changes, in other words, if the window width differs. Typically a user has to wait around 8-10 seconds for the model rebuilding on a 100K 100-track, 100 timestep window dataset. While not being in the focus of this project, we found that our query definition interface lacks the option to define pattern sequences across tracks. We plan to investigate better query interfaces for MTS data following recent examples, such as[16].
3.2 Feedback View
The Feedback View (Figure 4.c) shows representatives of the classifier result, visualizes hash tables, and keeps track of labeled data (R5). We differentiate three respective tabs for different purposes:
The Samples Tab (Figure 4.d1) lists representatives or samples of the classified windows.
The windows are surrounded by frames color encoded from green to red, indicating declining similarity predicted by the classifier.
Right above the curves, the user is invited to label the window by clicking
![]() for similar,
for similar,
![]() for indecisive and
for indecisive and
![]() for dissimilar, in order to modify the sample relevance, as described also in subsection 2.3 (Sample Relevance Adaption).
for dissimilar, in order to modify the sample relevance, as described also in subsection 2.3 (Sample Relevance Adaption).
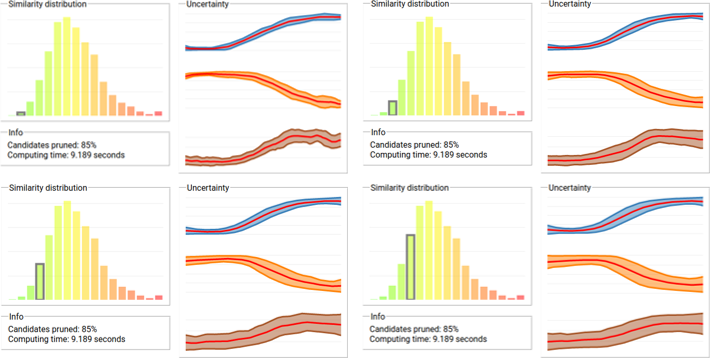
PSEUDo visualizes hash tables in the Tables Tab (Figure 4.d2).
The hash tables are depicted as histograms showing the similarity distribution of one hash function. Each bin corresponds to a bucket in the corresponding hash table.
The bars in the histograms are color encoded from green to red, indicating the decreasing similarity to the current query.
To better understand how well our hash functions work, we plot the mean, minimum, and maximum values of each time step among the top-20 similar windows for each hash table.
The mean values portray the pattern shape as perceived similar by the hash function,
whereas the minimum and maximum values form a lower and upper bound approximation of the pattern variance.
The variance band’s tightness implies the (un-)certainty or importance of the track during classification.
Based on this visual encoding, the user can modify the hash tables’ importance by clicking
![]() for important and
for important and
![]() for indecisive, as described also in subsection 2.3 (Classifier Relevance Adaption).
for indecisive, as described also in subsection 2.3 (Classifier Relevance Adaption).
The labeled windows for the current round are tracked in the Labeled Data Tab (Figure 4.d3). The user can revise and modify the decisions before clicking the Train button (R5). The hash table and label user feedback will be considered during the next training round.
3.3 Results View
The Results View (Figure 4.e) shows the classification outcome for all windows and provides a visual undo/redo panel as a tree visualization to revert entire model learning decisions (R5); Figure omitted.
In the Classifier Tab (Figure 4.e1), we show a result histogram to depict the similarity distribution of all windows to the query. Clicking a bin in the histogram results in the reconstruction of the visual pattern prototype analogous to the curves in the Feedback View. Rather than using the top-20, this pattern result view summarizes all windows in the chosen bin. The mean curves also show the average form within this bin, bounded by each time step’s minimum and maximum values to illustrate the variance within tracks. The histogram and the reconstructed shape help the user better understand the classification result and guide the required strictness during the labeling process (R3-5). One central interaction in this panel is that the user can set the number of top candidates and display them in the data overview.
4 Evaluation PSEUDo on Performance and Usability
We evaluated PSEUDo against the requirements described in subsection 1.1 through three distinct evaluation threads. First, a quantitative/technical evaluation showing PSEUDo’s advancements in terms of R1 (scalability), R3 (accuracy), and R4 (steerability) in comparison to state-of-the-art pattern retrieval techniques. Second, a visual quality inspection that deliberately takes the user’s viewpoint and visually demonstrates the pattern coherence without relying on potentially insufficient (visual) quality metrics[8] And third, a case study that outlines usability aspects and how a target user would apply PSEUDo’s visual interface.
We used five MTS datasets of varying complexity, namely a gas sensor dataset (1 TS/ 4.2 million time steps/ 16 tracks), an EEG dataset (1/0.9M/70), a synthetic dataset (10K/120/3), a meteorological dataset (1/21.9M/5) and an epigenomic dataset (1/120K/1). The gas sensor dataset was also used by Yu et al. to showcase their LSH-based algorithm[82]. We chose the EEG dataset since it contains a large number of tracks. Finally, we added PEAX to the comparison with its original single-track epigenomic dataset[51]. All technical experiments were conducted on a standard laptop running on 64-bit Ubuntu 20.04 with Intel i5-8350U CPU, 16GB RAM, and 512GB SSD. More about these datasets and our experiments can be found in the Appendix and on our website.
4.1 Quantitative Comparison
We evaluated PSEUDo by comparing it to the state-of-the-art techniques ED, DTWD, and SAX on the gas sensor and EEG dataset.
The scalability characteristics of PSEUDo are demonstrated by measuring the computation time on increasing data volume. We distinguished between preprocessing and querying time. For our accuracy investigation, we rely on precision and recall. We compute the top-50 similar windows as suggested by DTWD[62] (referred to as ) and treat them as ground truth. We chose this approach because DTW-based techniques, although being highly inefficient, are currently considered the best in terms of accuracy for time series classification[6]. Aware of the risk that DTWD might perform poorly, we furthered the accuracy evaluation with a visual quality inspection in subsection 4.2. Recall is defined as the portion of also classified as similar by the examined technique. For precision, we defined a strict metric called precision-50 as the portion of the top-50 windows classified by the examined technique that can also be found in . At the same time, we define a relatively looser metric, called precision-10%, as the portion of the top 10% similar windows of the examined technique that are also in .
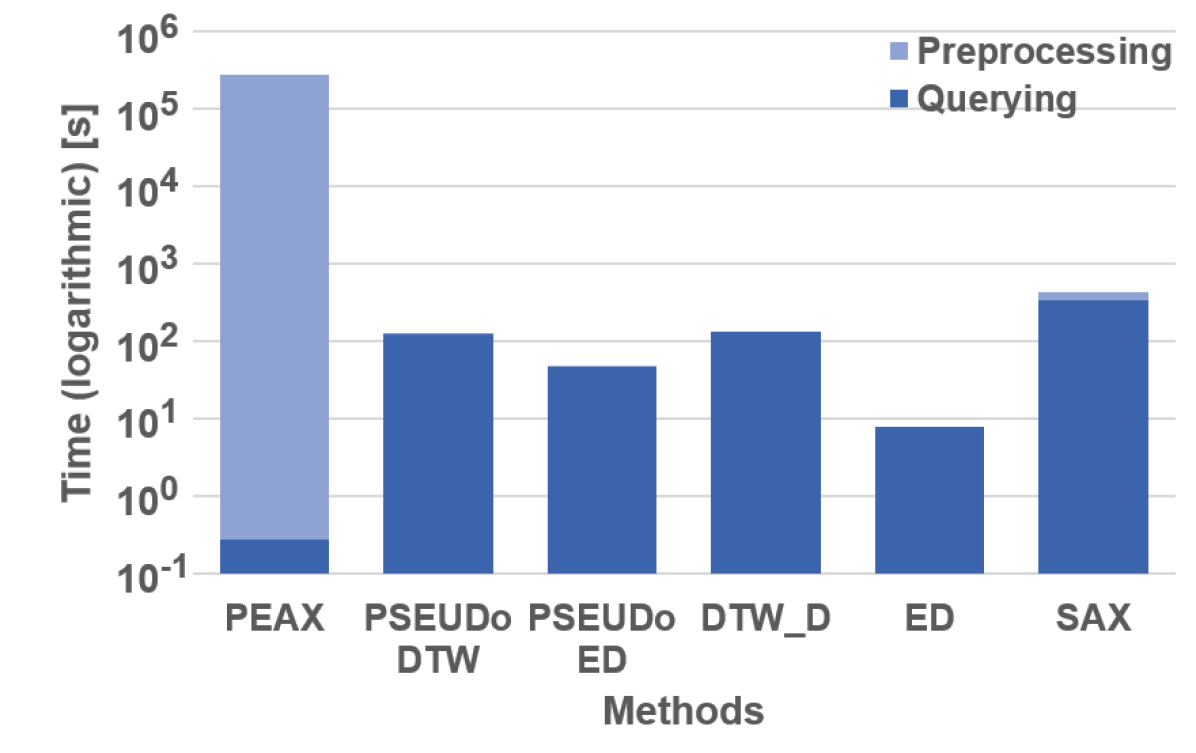
Experiment Overall Speed: The primary claim of this paper is that we can beat the model building and inference time of autoencoder-based methods, such as PEAX[51], while still serving similar objective and subjective retrieval performance (R1, R3).
As 5(a) depicts, PSEUDo is 2167x faster with its slowest but most precise instantiation PSEUDo-DTW and 5557x faster with PSEUDo-ED compared to PEAX (277,200s preprocessing/0.279s querying) on the same 120kb DNase-seq dataset that was used in the PEAX evaluation[51]. PSEUDo (3s/124s) is only seemingly on par with DTW (0s/135s) as its efficiency boost mainly surfaces for many tracks.
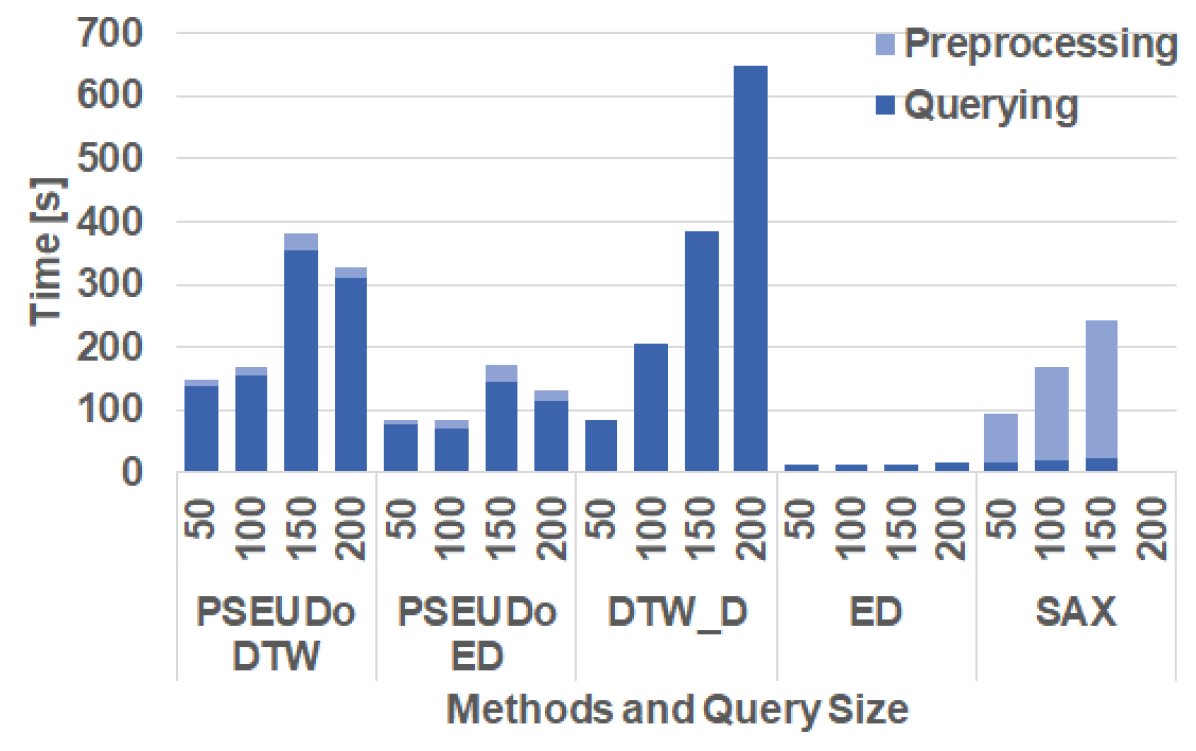
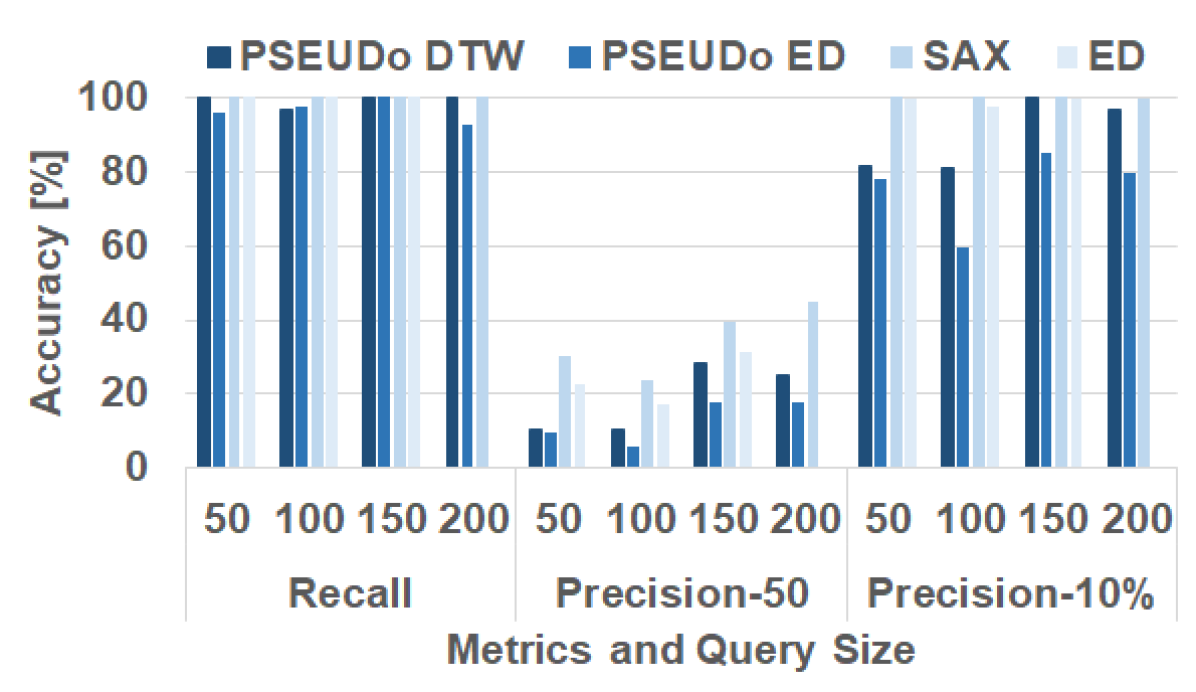
Experiment Query-Size vs. Speed/Accuracy: This experiment evaluated the query size’s influence on scalability and accuracy (R1, R3). We randomly picked ten queries from the gas sensor dataset and measured accuracy and elapsed time with varying query sizes (50/100/150/200 time steps per window). We kept PSEUDo’s relevance feedback switched off in favor of LSH’s objective performance. We illustrate our results in 5(b) for speed and 5(c) for accuracy.
5(b) reveals the good scalability characteristics of PSEUDo-DTW for large query sizes (150/170/380/320 seconds), especially compared to DTWD. PSEUDo-ED has roughly half the processing time as compared to PSEUDo with DTW without considerable accuracy loss. Although SAX features low processing time (95/170/240/-s), its large memory consumption impedes its scalability. Surprisingly, ED outperforms all competitors in computing time and accuracy on the gas sensor dataset used in this experiment. On a side note, PSEUDo needs less time for query size 200 than for 150 because the number of candidates that end up in the same bucket as the query is non-deterministic, as explained in subsection 2.1
5(c) shows a generally better recall than precision, especially for PSEUDo. Although showing many false positives due to its stochastic nature, PSEUDo indicates a good similar pattern retrieval performance, particularly here without relevance feedback. The result seems to reach its optimal around the query size of 150, presumably because this pattern length is characteristic in the EEG dataset. PSEUDo-DTW slightly outperforms PSEUDo-ED, most likely because the ground truth is generated with DTWD. Overall, this experiment does not allow us to judge which technique is better in terms of accuracy but instead serves the purpose of confirming a comparable accuracy of these methods.
Experiments Dataset-Size vs. Speed/Accuracy: The second experiment varied dataset size (25K/50K/75K/100K) instead of query size on the EEG dataset. For space reasons, its detailed result charts can be found in the Appendix. Generally, we see a relatively stable Precision-10% accuracy for PSEUDo-DTW (89.2/93.5/96.6/97.1%), PSEUDo-ED (84.3/95.3/97.5/96%), SAX (100/100/100/-%), ED (100/100/100/100%). Please note that DTWD was used to generate the baseline. On the other hand, our processing time charts show a roughly linear time complexity increase across the dataset sizes for all techniques; PSEUDo-DTW (24/44/71/91s), PSEUDo-ED (17/30/44/59s), DTWD (45/88/133/176s), SAX (30/58/92/-s), ED (2/4/6/9s). PSEUDo outperforms DTWD thanks to sublinear complexity for preprocessing and lower constant factor for querying. Due to a memory problem, SAX is missing for the 100K experiment. Compared with DTWD, PSEUDo-ED again accelerates querying by a factor of two with comparable accuracy.
Experiments No. Tracks vs. Speed/Accuracy: This experiment examines the impact of the number of tracks on performance. We used the EEG dataset in this experiment and varied the number of tracks by 20/40/60. Our results for this experiment are conclusive with the previous experiment and depicted in the Appendix, as well. We see that PSEUDo’s sublinear complexity is especially beneficial as the number of tracks increases. PSEUDo-DTW (65/69/75s) and PSEUDo-ED (35/40/57s) show only minimal processing time increase across the different number of tracks as opposed to DTWD (258/318/400s). ED (5/6/8s) is again the positive outlier but will most likely not meet the user’s accuracy standards in real-world scenarios. SAX is abscent in the plot due to memory issues. In terms of accuracy, we can see also comparable results to Experiment 2 in terms of Precision-10%: PSEUDo-DTW 96.8/90.7/83.8%), PSEUDo-ED (73.2/86.7/81%), ED (100/100/100%).
Experiment Steerability: We evaluated PSEUDo’s steerability by demonstrating the retrieval convergence of our algorithm. By manually assigning a fixed weight vector in each feedback round, we should notice that the strongly weighted tracks become more similar to the query, and their variance bands tighten. We experimented with five random queries and put increasingly more weight on Track 1 while doing the opposite for Track 3. We plot the mean, minimum, and maximum curves of the tracks in the top-50 windows found by PSEUDo. Finally, as a subjective measure, we report the DTW-distance between the corresponding tracks in the query and the times series windows as a progression over four feedback rounds.
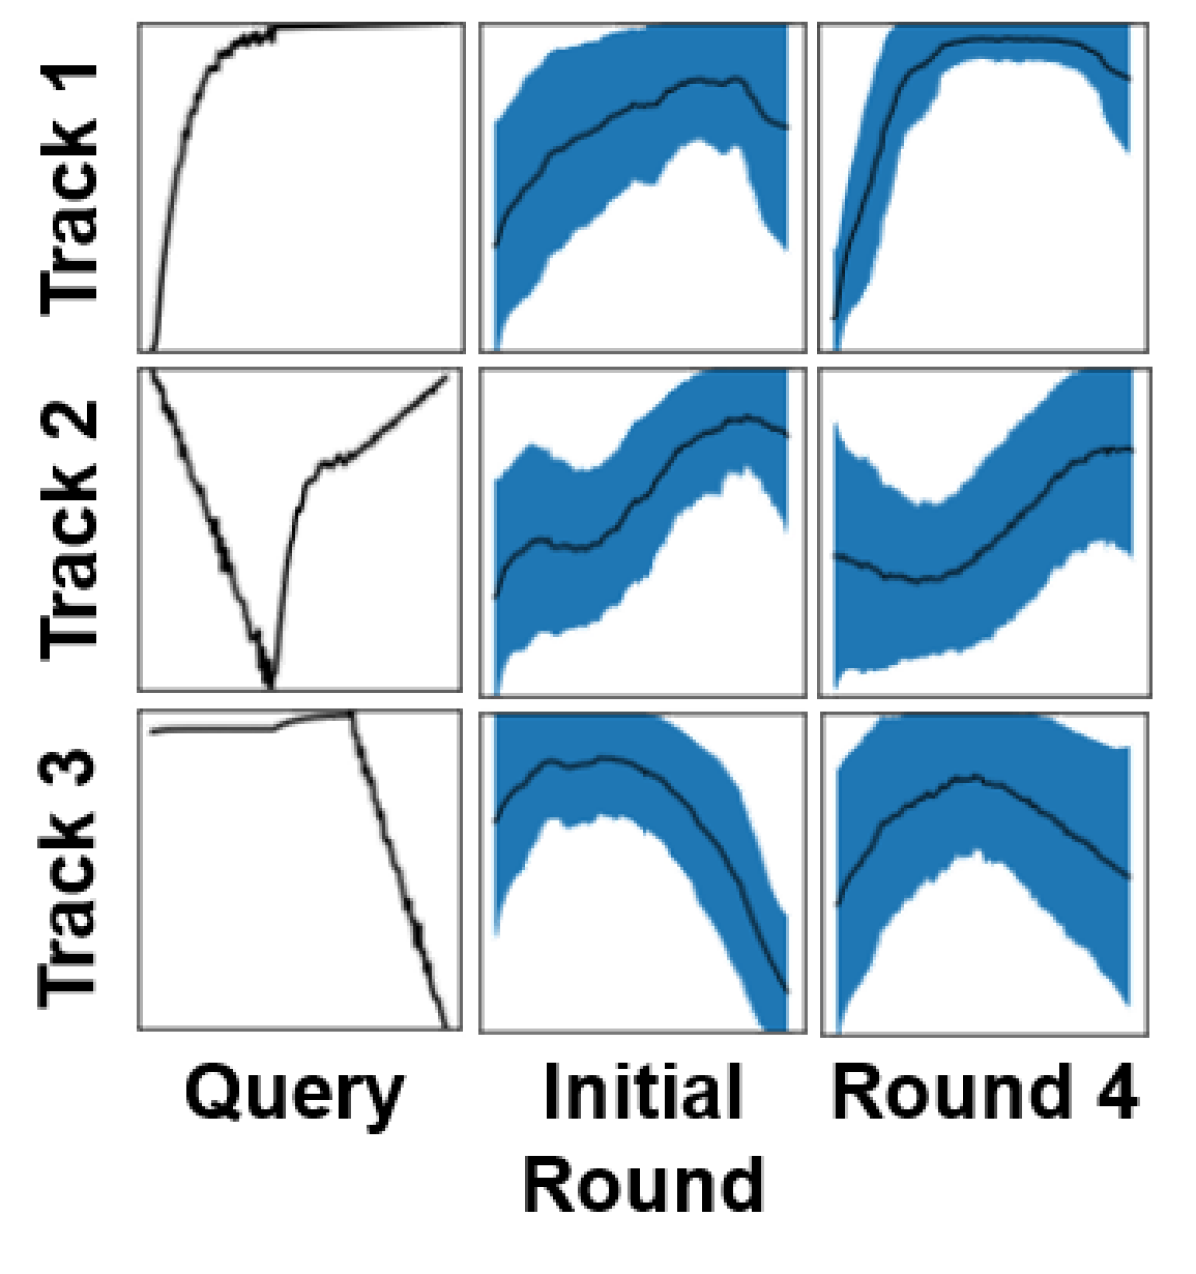
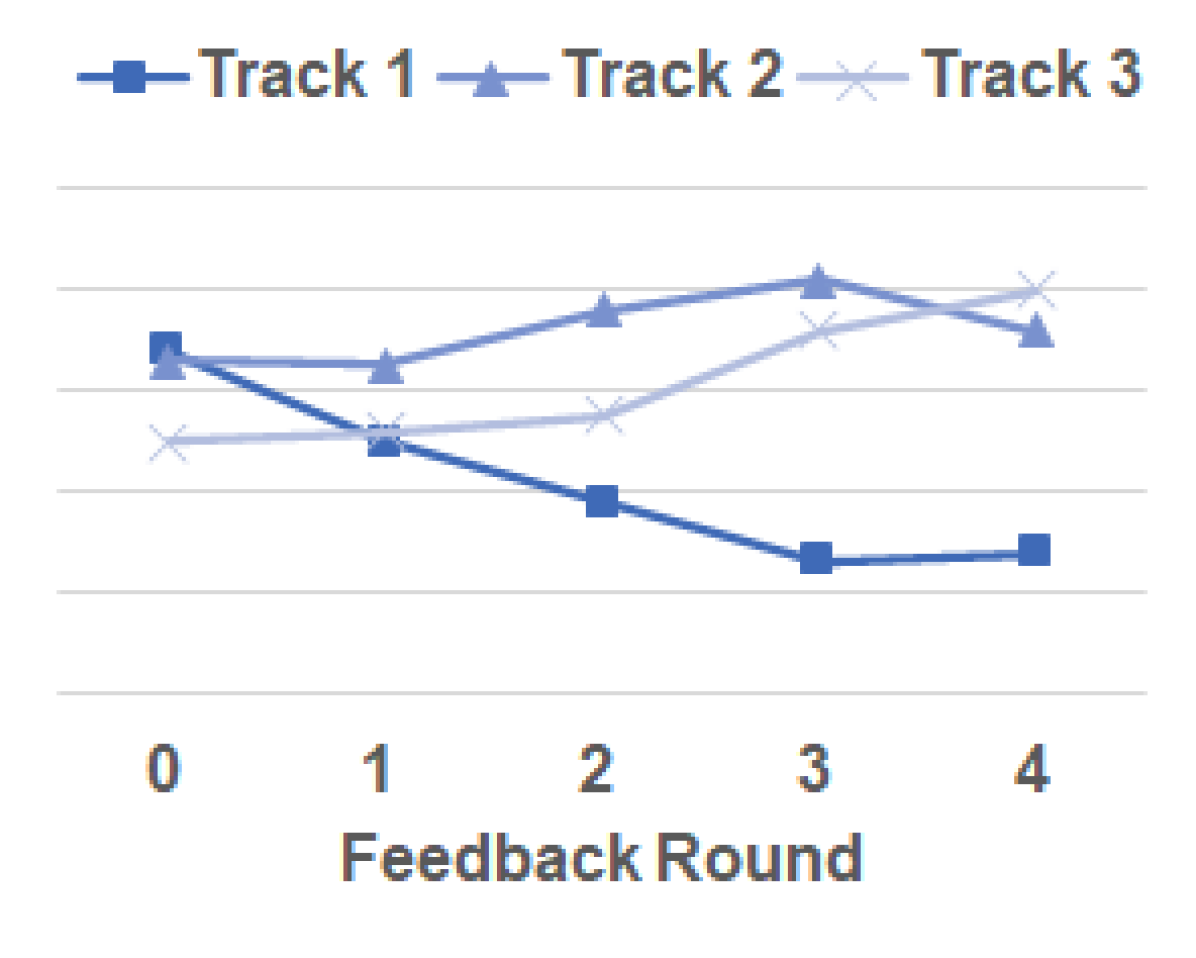
As indicated in 6(a), the strongly weighted Track 1 exhibited less variance and became increasingly similar to Track 1 in the query compared to the shape before training. The opposite happened for Track 3. This observation is consistent with the decreasing DTW-distance between the Track 1 windows and the query, respectively, the increasing DTW-distance for Track 3 (6(b)). For the sake of generalizability, we show repetitions of these experiments with other queries in the Appendix. These experiments show the same behavior. Consequently, we can conclude that the result classified by PSEUDo can be steered by means of a weight vector.
4.2 Visual Quality Inspection
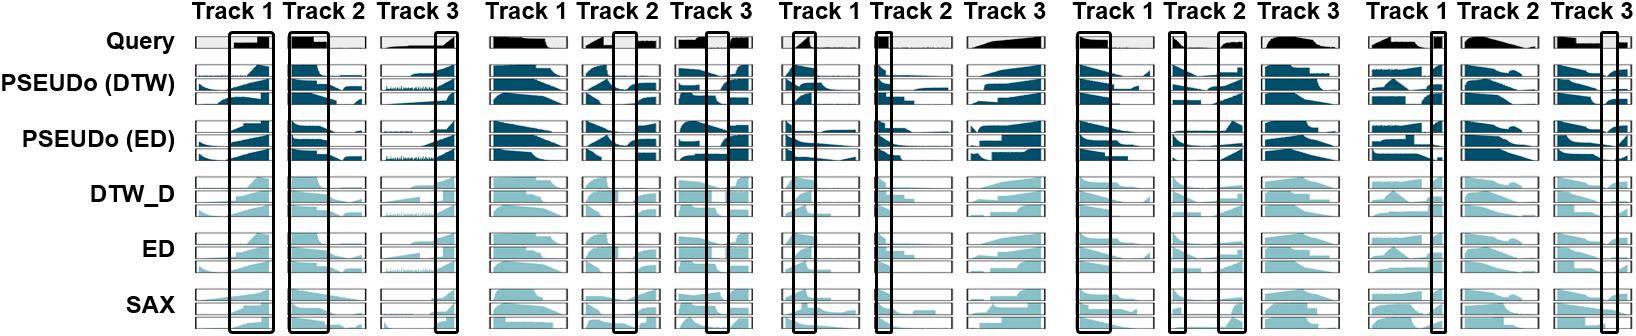
Since the quantitative comparison used the result of DTWD as ground truth and thus implied absolute correctness, we felt compelled to follow the argument that no single similarity measure accounts for human judgement of time series similarity[21] and substantiate our evaluation with a visual quality inspection. We chose five interesting patterns and visually inspected the five top hits with DTWD, ED, and SAX, while keeping PSEUDo’s relevance feedback mechanism switched off. The comparison to PEAX had to be omitted because it does not support multiple tracks readily. This time, we used the synthetic dataset due to its recurrent and easily recognizable patterns and show the results in Figure 7
We can draw several conclusions: (1) PSEUDo delivers comparable visual quality to state-of-the-art techniques; (2) No method significantly outperforms the others, and the results are visually similar. Considering time and space consumption, PSEUDo-ED scores the runner-up position after ED. However, the vanilla version of ED does not contain trainable parameters and thus cannot be updated with relevance feedback, though enhanced version exists in[45].
4.3 Case Study
We demonstrate PSEUDo’s usability, especially in light of the requirements (R4-6) from subsection 1.1. We conduct our case study on the MeteoNet meteorological dataset (1 TS / 88,197 time steps/ 7 tracks)[50]. and show the interactive flow and responsiveness of our visual interface in the accompanying video in the Appendix.
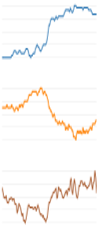
Imagine Tom, a meteorologist who investigates the precursors of tornado formation in rural areas. This is certainly a rare and highly time-dependent event in which several weather phenomena have to come together. Tom loads the weather station data in PSEUDo and checks boxes for temperature, humidity, and wind speed as shown in Figure 4.a, because he believes that the interesting periods correlate with an increase in temperature, falling humidity values, and some unknown behavior of the wind speed in the early stages of the formation process. He browses the Data Overview (Figure 4.b) and finds a pattern shown in 8(a) that seemed to fit his early hypothesis that the humidity drastically drops before the wind speed increases. He pins this pattern as a query and starts the initial search. After approximately nine seconds, i.e., the model building time of PSEUDo, he notices that the feedback view and the result view are packed with information. He eagerly checks the result view in Figure 8 and notices that the result has not captured his desire to a satisfactory extent. Because (1) there are not many windows in the first bins of the result histogram and (2) the windows in the first bins are largely overfitting the query too much, a general problem in most query-by-example retrieval systems. This is indicated by the tight variance bands around the prototypes, as well as the quick rise and fall of the curves in the prototypes that overly resembled the query.
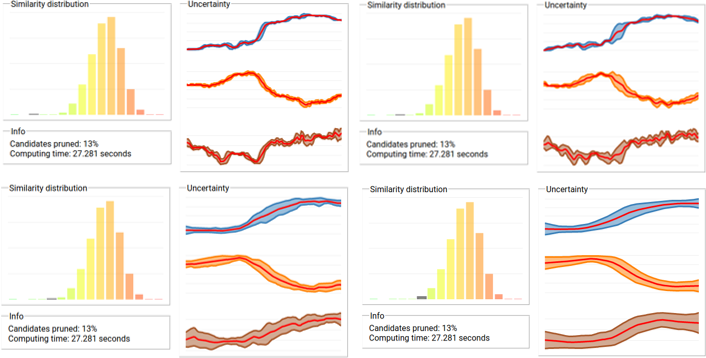
Next, Tom expresses his subjective similarity perception, i.e., his accepted range of fuzziness for his mental model of tornado formation, along with a more precise definition of the query, i.e., his gained knowledge from the first labeling iteration. He first marks sampled windows under the samples tab in the feedback view, tagging a smoother temperature curve, respectively humidity decrease, as shown in Figure 4.d1. Tom labels crudely hash functions that match his expectations (shown in Figure 4.d2) in the tables tab. Then, after a quick validation of the labeled windows in the labels tab, he clicks the ”Train” button to adapt the model. After again around eight seconds, the result succeeding the first training iteration can be explored. He notices a visual improvement and conducts one more feedback round. The final result is shown in Figure 9.
Not only do the prototypes better match his expectation about the early stages of tornado formation, but also the query specification improved each time through our DBA approach described in subsection 2.3. He is content with the search result at this point and focuses now only on his result presentation (Figure 4.e). By interactively checking the result histogram, he determines a cut-off point between similar and dissimilar windows, i.e., supporting vs. contradicting events in the dataset. The similar windows was refreshed automatically in the data overview giving even more insight into (until now) neglected weather features. Satisfied with the result, he continues to check the found interesting instances against his available ground truth from, e.g., news articles.
5 Related Work
For didactic purposes, we discussed the gap in the research literature throughout the paper, e.g., in section 1 or section 2. This Section should give the reader a broader context and focus on advancements in algorithmic and interactive UTS and MTS data analysis.
Automated Analysis: In the past, automated TS analysis has been tackled mostly with feature engineering-based approaches or through direct distance metrics-based techniques, such as Euclidean Distance (ED), Dynamic Time Warping (DTW)[25], or Dynamic Time Warping Dependent (DTWD)[62]. For example, Single Value Decomposition (SVD) [30, 79], Discrete Fourier Transformation (DFT)[30], Discrete Wavelet Transformation (DWT)[17] and Piecewise Aggregate Approximation (PAA)[44] all present varyingly complex and efficient problem space transformations that divide TS data into segments and define a real-valued approximation for this segment. But, representing the data using real-values has been shown to lead to algorithmic limitations[56]. Symbolic representations, on the other hand, convert the TS into a fixed vocabulary of categorical symbols. The most popular symbolic reduction technique is Symbolic Aggregate approXimation (SAX)[55], which uses PAA and a distribution-based lookup-table to discretize a time series into a series of symbols of a fixed-size alphabet. Its data-size independent dimensionality reduction and simplicity are the reasons for its popularity and many extensions[57, 73, 71]. Most recently, Loeschcke et al. presented a progressive parameter exploration to find task-adapted parameter settings for PAA and SAX[58]. Although originally created for UTS, this technique can be extended to MTS[64]. The interested reader will find more details in the survey papers of Ding et al.[25], focusing on the comparison of problem space transformation approaches and Xing et al.[81] focusing on similarity measures for pattern search in sequential data.
Semi-automated Analysis: Pattern search in MTS and UTS analysis is also approached from a human-in-the-loop viewpoint. These works primarily emphasize the effective communication between the domain-knowledge savvy analysts and the algorithmic analysis system. As in PSEUDo, in almost all research on pattern search in (multivariate) time series data, the query is itself a (multivariate) time series fragment. Usually, these queries are either represented by sketch[77, 61, 15] or by example[14, 51]. Both have been shown to provide efficient query specifications in mixed-initiative systems[21]. In the case of query-by-example, the user chooses a segment of the data as the query, and the retrieval system compares the query to a database in a feature- or data-space[19, 52]. Hao et al. [39] use a similar approach for finding frequently occurring patterns in MTS data, the difference being that they put an emphasis on pattern visualization and distinctly visualize all frequently occurring patterns.
Visualization Approaches: While the works above reduce the data overload by only focusing on sections and important subregions of the data, this domain has also been addressed from a visualization-focused angle. For example, Buono et al. emphasise the importance of visualizing the MTS pattern search process in TimeSearcher 2[14]. In this system, the user can select up to eight channels for inspection and zoom in and out to generate a simple overview of the dataset. An easy-to-use and effective visualization is demonstrated by Peng[65], where each channel of an MTS is discretized into a series of categorical colors and stacked to show the inter-channel correlation. Buchmüller et al.’s MotionRugs[13] adopt a similar idea to incorporate additional spatial information. Bach et al.[5] and Bernard et al.[10] use a more abstract representation as a path in a 2D space. Even more abstract, e.g., glyph-based overview visualizations, are presented in[7, 67]. Although many of these visualization approaches provide a good overview, they are often highly task-oriented (overview vs. detail) and accept to hide a lot of nuanced information from the user.
6 Discussion and Future Work
Compared to the related work on interactive MTS analysis, our approach goes beyond the state-of-the-art by incorporating three main aspects that make MTS data exploration more tractable for real-world applications. Firstly, our system offers an adaptive, as opposed to static one-shot classification, making it a user-centric Visual Analytics approach. Secondly, it relies on one of the most scalable data processing techniques ever invented: hashing-based algorithms. Thirdly, the notion of “buckets” can be easily understood, allowing PSEUDo to be applied in less ML-savvy application environments.
We also came across implementation/design decisions and challenges during the research project that we would like to discuss here. On the conceptual side, we found that a thorough task taxonomy for MTS data is missing. While we can still map out PSEUDo’s high-level tasks into Brehmer and Munzner’s typology[11], e.g., we serve browse, explore, locate, and lookup (all search-related) tasks, the specific MTS tasks like finding patterns with significant cross-track time shifts or tasks that assess the invariance properties of specific patterns are apparently on a different abstraction level.
We decided early on in the project to focus our attention on the backend aspects rather than the frontend. One can see this aspect distinctively in the rather simplistic use of standard visualizations and the implemented query-by-example system, which work flawlessly and effortlessly for the intended tasks. In the future, however, we plan to extend in two directions: First, we will tackle challenging questions, like How can we let a user specify a) multi-track queries or b) queries with a temporal relationship between them? with new query definition panels and plan to apply interactive augmentation, like in Shadow Draw[72], to help with this process. Second, we will expand our interface with one additional view that should work in unison with the resulting histogram: A SOM-based pattern space overview, such as presented in[69]. This view can be easily understood by users and proves to display (automatically) visual patternclasses into distinct visual space regions.
Currently, our approach is following the thought that MTS is interpreted as multi-dimensional numeric vectors in sequential order. We have to state that we are independent of the so-called resolution of the time series. However, there are other application areas where such a simplistic MTS interpretation does not hold, and the entries in distinct dimensions can be categorical, ordinal, or even a complex data type. For example, in crime analysis, one dimension could be a surveillance webcam frame, while the other ones are numeric features. PSEUDo’s design is flexible enough to learn distinct (time-synchronized) models in parallel to tackle these challenges.
One challenge for which we do not have a good solution yet is biased search. Right now, we include negative and indecisive labels to promote the target class separation, adding to the confirmation bias in every iteration. One approach implemented in PSEUDo is to suggest enormously different samples to give the user an option to “broaden” the search. Nonetheless, we can regard every new positive label distinct enough from the current set of already labeled items as a new exploration thread/fork. These complex analytic provenance concepts and potentially task-change metrics still need to find their way into future VA systems.
On the technical side, we plan to experiment with a multi-scale LSH variant[78] to address the problem of introducing a user context switch by having to retrain our models when the query size changes. We plan to enhance PSEUDo’s feedback-driven mechanism with better active learning suggestions and extend PSEUDo to other time series analysis problems, like anomaly detection and motif discovery.
7 Conclusion
We presented PSEUDo, a novel relevance-feedback-driven technique and tool for visual pattern retrieval in multivariate time series. Our system features an LSH-based classifier with massive scaling potential that the analyst can actively steer and easily understand. We found that the LSH-based algorithm scales significantly better to large datasets than the state-of-the-art techniques, like DTW and SAX, while retaining comparable accuracy compared to autoencoder-based systems, like PEAX, paving the path for real-time user interaction. Furthermore, users can understand our algorithm through the interactive query interface and effectively steer the modeling process. Therefore, the prevailing problem of the subjectiveness of similarity cursing virtually all automatic similarity search algorithms can be well addressed. In the future, we can expect that our technical contributions, such as PSEUDo’s adaptive classifier and visual similarity definition interfaces, will enable a better, more user-centric approach towards anomaly detection and motif discovery even in challenging data environments like multivariate or high-dimensional data spaces.
References
- [1] S. Ahmad, A. Lavin, S. Purdy, and Z. Agha. Unsupervised real-time anomaly detection for streaming data. Neurocomputing, 262:134–147, 2017. doi: 10 . 1016/j . neucom . 2017 . 04 . 070
- [2] W. Aigner, S. Miksch, H. Schumann, and C. Tominski. Visualization of Time-Oriented Data. Human-Computer Interaction Series. Springer, 2011. doi: 10 . 1007/978-0-85729-079-3
- [3] H. André-Jönsson. Indexing Strategies for Time Series Data. Department of Computer and Information Science, Linköpings universitet, 2002.
- [4] D. Arendt, E. Saldanha, R. Wesslen, S. Volkova, and W. Dou. Towards rapid interactive machine learning: evaluating tradeoffs of classification without representation. In W. Fu, S. Pan, O. Brdiczka, P. Chau, and G. Calvary, eds., Proc. 24th Int. Conf. on Intelligent User Interfaces, IUI 2019, pp. 591–602. ACM, 2019. doi: 10 . 1145/3301275 . 3302280
- [5] B. Bach, C. Shi, N. Heulot, T. M. Madhyastha, T. J. Grabowski, and P. Dragicevic. Time curves: Folding time to visualize patterns of temporal evolution in data. IEEE Trans. Vis. Comput. Graph., 22(1):559–568, 2016. doi: 10 . 1109/TVCG . 2015 . 2467851
- [6] A. Bagnall, J. Lines, A. Bostrom, J. Large, and E. Keogh. The great time series classification bake off: a review and experimental evaluation of recent algorithmic advances. Data Mining and Knowledge Discovery, 31(3):606–660, 2017.
- [7] K. Bale, P. Chapman, N. Barraclough, J. Purdy, N. Aydin, and P. Dark. Kaleidomaps: A new technique for the visualization of multivariate time-series data. Information Visualization, 6(2):155–167, 2007. doi: 10 . 1057/palgrave . ivs . 9500154
- [8] M. Behrisch, M. Blumenschein, N. W. Kim, L. Shao, M. El-Assady, J. Fuchs, D. Seebacher, A. Diehl, U. Brandes, H. Pfister, T. Schreck, D. Weiskopf, and D. A. Keim. Quality metrics for information visualization. Comput. Graph. Forum, 37(3):625–662, 2018. doi: 10 . 1111/cgf . 13446
- [9] M. Behrisch, F. Korkmaz, L. Shao, and T. Schreck. Feedback-driven interactive exploration of large multidimensional data supported by visual classifier. In 2014 IEEE Conference on Visual Analytics Science and Technology (VAST), pp. 43–52, 2014. doi: 10 . 1109/VAST . 2014 . 7042480
- [10] J. Bernard, N. Wilhelm, M. Scherer, T. May, and T. Schreck. Timeseriespaths: Projection-based explorative analysis of multivariate time series data. In Journal of WSCG20, vol. 2, pp. 97–106, 2012.
- [11] M. Brehmer and T. Munzner. A multi-level typology of abstract visualization tasks. IEEE Trans. Vis. Comput. Graph., 19(12):2376–2385, 2013. doi: 10 . 1109/TVCG . 2013 . 124
- [12] E. T. Brown, J. Liu, C. E. Brodley, and R. Chang. Dis-function: Learning distance functions interactively. In 7th IEEE Conf. on Visual Analytics Science and Technology, IEEE VAST 2012, pp. 83–92. IEEE Computer Society, 2012. doi: 10 . 1109/VAST . 2012 . 6400486
- [13] J. Buchmüller, D. Jäckle, E. Cakmak, U. Brandes, and D. A. Keim. Motionrugs: Visualizing collective trends in space and time. IEEE Trans. Vis. Comput. Graph., 25(1):76–86, 2019. doi: 10 . 1109/TVCG . 2018 . 2865049
- [14] P. Buono, A. Aris, C. Plaisant, A. Khella, and B. Shneiderman. Interactive pattern search in time series. In Visualization and Data Analysis 2005, vol. 5669, pp. 175–186. International Society for Optics and Photonics, 2005.
- [15] P. Buono and A. L. Simeone. Interactive shape specification for pattern search in time series. In Proceedings of the working conference on Advanced visual interfaces, pp. 480–481, 2008.
- [16] B. C. M. Cappers, P. N. Meessen, S. Etalle, and J. J. van Wijk. Eventpad: Rapid malware analysis and reverse engineering using visual analytics. In D. Staheli, C. L. Paul, J. Kohlhammer, D. M. Best, S. Trent, N. Prigent, R. Gove, and G. Sauer, eds., 15th IEEE Symposium on Visualization for Cyber Security, VizSec 2018, Berlin, Germany, October 22, 2018, pp. 1–8. IEEE, 2018. doi: 10 . 1109/VIZSEC . 2018 . 8709230
- [17] K.-P. Chan and A. W.-C. Fu. Efficient time series matching by wavelets. In Proceedings 15th International Conference on Data Engineering (Cat. No. 99CB36337), pp. 126–133. IEEE, 1999.
- [18] A. Chatzimparmpas, R. M. Martins, I. Jusufi, K. Kucher, F. Rossi, and A. Kerren. The state of the art in enhancing trust in machine learning models with the use of visualizations. Comput. Graph. Forum, 39(3):713–756, 2020. doi: 10 . 1111/cgf . 14034
- [19] H. Cheng, P.-N. Tan, C. Potter, and S. Klooster. Detection and characterization of anomalies in multivariate time series. In Proc. of the 2009 SIAM international Conf. on Data Mining, pp. 413–424. SIAM, 2009.
- [20] M. Cochez and H. Mou. Twister tries: Approximate hierarchical agglomerative clustering for average distance in linear time. In Proceedings of the 2015 ACM SIGMOD International Conference on Management of Data, SIGMOD ’15, pp. 505–517. Association for Computing Machinery, New York, NY, USA, 2015. doi: 10 . 1145/2723372 . 2751521
- [21] M. Correll and M. Gleicher. The semantics of sketch: Flexibility in visual query systems for time series data. In 2016 IEEE Conference on Visual Analytics Science and Technology (VAST), pp. 131–140. IEEE, 2016.
- [22] A. S. Das, M. Datar, A. Garg, and S. Rajaram. Google news personalization: Scalable online collaborative filtering. In Proceedings of the 16th International Conference on World Wide Web, WWW ’07, pp. 271–280. Association for Computing Machinery, New York, NY, USA, 2007. doi: 10 . 1145/1242572 . 1242610
- [23] F. L. Dennig, T. Polk, Z. Lin, T. Schreck, H. Pfister, and M. Behrisch. Fdive: Learning relevance models using pattern-based similarity measures. In 2019 IEEE Conference on Visual Analytics Science and Technology (VAST), pp. 69–80. IEEE, 2019.
- [24] E. Dimara, S. Franconeri, C. Plaisant, A. Bezerianos, and P. Dragicevic. A task-based taxonomy of cognitive biases for information visualization. IEEE Trans. Vis. Comput. Graph., 26(2):1413–1432, 2020. doi: 10 . 1109/TVCG . 2018 . 2872577
- [25] H. Ding, G. Trajcevski, P. Scheuermann, X. Wang, and E. Keogh. Querying and mining of time series data: experimental comparison of representations and distance measures. Proceedings of the VLDB Endowment, 1(2):1542–1552, 2008.
- [26] D. H. Douglas and T. K. Peucker. Algorithms for the reduction of the number of points required to represent a digitized line or its caricature. Cartographica: the international journal for geographic information and geovisualization, 10(2):112–122, 1973.
- [27] J. J. Dudley and P. O. Kristensson. A review of user interface design for interactive machine learning. ACM Trans. Interact. Intell. Syst., 8(2):8:1–8:37, 2018. doi: 10 . 1145/3185517
- [28] A. Endert, W. Ribarsky, C. Turkay, B. L. W. Wong, I. T. Nabney, I. D. Blanco, and F. Rossi. The state of the art in integrating machine learning into visual analytics. Comput. Graph. Forum, 36(8):458–486, 2017. doi: 10 . 1111/cgf . 13092
- [29] F. Petitjean, G. Forestier, G. I. Webb, A. E. Nicholson, Y. Chen, and E. Keogh. Dynamic time warping averaging of time series allows faster and more accurate classification. In 2014 IEEE International Conference on Data Mining, pp. 470–479, 2014. doi: 10 . 1109/ICDM . 2014 . 27
- [30] C. Faloutsos, M. Ranganathan, and Y. Manolopoulos. Fast subsequence matching in time-series databases. Acm Sigmod Record, 23(2):419–429, 1994.
- [31] M. Fiterau, J. Fries, E. Halilaj, N. Siranart, S. Bhooshan, and C. Re. Similarity-based lstms for time series representation learning in the presence of structured covariates. In 29th Conference on Neural Information Processing Systems, vol. 3, 2016.
- [32] G. Forestier, F. Petitjean, H. A. Dau, G. I. Webb, and E. Keogh. Generating synthetic time series to augment sparse datasets. In 2017 IEEE International Conference on Data Mining (ICDM), pp. 865–870, 2017. doi: 10 . 1109/ICDM . 2017 . 106
- [33] A. Gionis, P. Indyk, R. Motwani, et al. Similarity search in high dimensions via hashing. In Vldb, vol. 99, pp. 518–529, 1999.
- [34] A. Gogolou, T. Tsandilas, T. Palpanas, and A. Bezerianos. Comparing similarity perception in time series visualizations. IEEE Trans. Vis. Comput. Graph., 25(1):523–533, 2019. doi: 10 . 1109/TVCG . 2018 . 2865077
- [35] R. Gregor, A. Lamprecht, I. Sipiran, T. Schreck, and B. Bustos. Empirical evaluation of dissimilarity measures for 3d object retrieval with application to multi-feature retrieval. In 13th International Workshop on Content-Based Multimedia Indexing, CBMI 2015, Prague, Czech Republic, June 10-12, 2015, pp. 1–6. IEEE, 2015. doi: 10 . 1109/CBMI . 2015 . 7153629
- [36] Y. Guo, Z. Wu, and Y. Ji. A hybrid deep representation learning model for time series classification and prediction. In 3rd International Conference on Big Data Computing and Communications, BIGCOM 2017, Chengdu, China, August 10-11, 2017, pp. 226–231. IEEE Computer Society, 2017. doi: 10 . 1109/BIGCOM . 2017 . 13
- [37] H. Haleem, Y. Wang, A. Puri, S. Wadhwa, and H. Qu. Evaluating the readability of force directed graph layouts: A deep learning approach. IEEE Computer Graphics and Applications, 39(4):40–53, 2019. doi: 10 . 1109/MCG . 2018 . 2881501
- [38] J. D. Hamilton. Time series analysis. Princeton university press, 2020.
- [39] M. C. Hao, M. Marwah, H. Janetzko, U. Dayal, D. A. Keim, D. Patnaik, N. Ramakrishnan, and R. K. Sharma. Visual exploration of frequent patterns in multivariate time series. Information Visualization, 11(1):71–83, 2012. doi: 10 . 1177/1473871611430769
- [40] F. Hohman, M. Kahng, R. Pienta, and D. H. Chau. Visual analytics in deep learning: An interrogative survey for the next frontiers. IEEE Trans. Vis. Comput. Graph., 25(8):2674–2693, 2019. doi: 10 . 1109/TVCG . 2018 . 2843369
- [41] Q. Huang, J. Feng, Y. Zhang, Q. Fang, and W. Ng. Query-aware locality-sensitive hashing for approximate nearest neighbor search. Proceedings of the VLDB Endowment, 9(1):1–12, 2015.
- [42] P. Indyk and R. Motwani. Approximate nearest neighbors: Towards removing the curse of dimensionality. In Proceedings of the Thirtieth Annual ACM Symposium on Theory of Computing, STOC ’98, p. 604–613. Association for Computing Machinery, New York, NY, USA, 1998. doi: 10 . 1145/276698 . 276876
- [43] J. Jeong. Eeg dynamics in patients with alzheimer’s disease. Clinical neurophysiology, 115(7):1490–1505, 2004.
- [44] E. Keogh, K. Chakrabarti, M. Pazzani, and S. Mehrotra. Dimensionality reduction for fast similarity search in large time series databases. Knowledge and information Systems, 3(3):263–286, 2001.
- [45] E. J. Keogh and M. J. Pazzani. Relevance feedback retrieval of time series data. In Proceedings of the 22nd Annual International ACM SIGIR Conference on Research and Development in Information Retrieval, SIGIR ’99, pp. 183–190. Association for Computing Machinery, New York, NY, USA, 1999. doi: 10 . 1145/312624 . 312676
- [46] A. Khaleghi, D. Ryabko, J. Mary, and P. Preux. Consistent algorithms for clustering time series. J. Mach. Learn. Res., 17:3:1–3:32, 2016.
- [47] N. Kitaev, L. Kaiser, and A. Levskaya. Reformer: The efficient transformer. In 8th International Conference on Learning Representations, ICLR 2020, Addis Ababa, Ethiopia, April 26-30, 2020. OpenReview.net, 2020.
- [48] H. Koga, T. Ishibashi, and T. Watanabe. Fast agglomerative hierarchical clustering algorithm using locality-sensitive hashing. Knowledge and Information Systems, 12(1):25–53, 2007. doi: 10 . 1007/s10115-006-0027-5
- [49] E. Laftchiev and Y. Liu. Finding multidimensional patterns in multidimensional time series. In KDD Workshop on MiLeTS, 08 2018.
- [50] G. Larvor, L. Berthomier, V. Chabot, B. L. Pape, B. Pradel, and L. Perez. Meteonet, an open reference weather dataset by meteo france, 2020. doi: 10 . 13140/RG . 2 . 2 . 20331 . 18729
- [51] F. Lekschas, B. Peterson, D. Haehn, E. Ma, N. Gehlenborg, and H. Pfister. Peax: Interactive visual pattern search in sequential data using unsupervised deep representation learning. In Computer Graphics Forum, vol. 39(3), pp. 167–179. Wiley Online Library, 2020.
- [52] D. Li, D. Chen, J. Goh, and S.-k. Ng. Anomaly detection with generative adversarial networks for multivariate time series. arXiv preprint arXiv:1809.04758, 2018.
- [53] B. Lim, S. O. Arik, N. Loeff, and T. Pfister. Temporal fusion transformers for interpretable multi-horizon time series forecasting. 2020.
- [54] J. Lin, E. Keogh, S. Lonardi, and B. Chiu. A Symbolic Representation of Time Series, with Implications for Streaming Algorithms. In Proc. of 8th ACM SIGMOD Workshop on Research Issues in DM and Knowledge Discovery, DMKD ’03, pp. 2–11. Assoc. for Comp. Mach., New York, NY, USA, 2003. doi: 10 . 1145/882082 . 882086
- [55] J. Lin, E. Keogh, L. Wei, and S. Lonardi. Experiencing sax: a novel symbolic representation of time series. Data Mining and knowledge discovery, 15(2):107–144, 2007.
- [56] J. Lin, S. Williamson, K. Borne, and D. DeBarr. Pattern recognition in time series. Advances in Machine Learning and Data Mining for Astronomy, 1(617-645):3, 2012.
- [57] B. Lkhagva, Y. Suzuki, and K. Kawagoe. Extended sax: Extension of symbolic aggregate approximation for financial time series data representation. DEWS2006 4A-i8, 7, 2006.
- [58] S. Loeschcke, M. Hogräfer, and H. Schulz. Progressive parameter space visualization for task-driven SAX configuration. In C. Turkay and K. Vrotsou, eds., 11th International EuroVis Workshop on Visual Analytics, EuroVA@Eurographics/EuroVis 2020, pp. 43–47. Eurographics Association, 2020. doi: 10 . 2312/eurova . 20201085
- [59] C. Luo and A. Shrivastava. SSH (Sketch, Shingle, & Hash) for indexing massive-scale time series. In NIPS 2016 Time Series Work., pp. 38–58, 2017.
- [60] Y. Ma, A. K. H. Tung, W. Wang, X. Gao, Z. Pan, and W. Chen. Scatternet: A deep subjective similarity model for visual analysis of scatterplots. IEEE Trans. Vis. Comput. Graph., 26(3):1562–1576, 2020. doi: 10 . 1109/TVCG . 2018 . 2875702
- [61] M. Mannino and A. Abouzied. Expressive time series querying with hand-drawn scale-free sketches. In Proceedings of the 2018 CHI Conference on Human Factors in Computing Systems, CHI ’18, p. 1–13. Association for Computing Machinery, New York, NY, USA, 2018. doi: 10 . 1145/3173574 . 3173962
- [62] Mohammad Shokoohi-Yekta, Jun Wang, and Eamonn Keogh. On the Non-Trivial Generalization of Dynamic Time Warping to the Multi-Dimensional Case. In Proc. of the 2015 SIAM Int. Conference on Data Mining, pp. 289–297, 2015. doi: 10 . 1137/1 . 9781611974010 . 33
- [63] A. V. Pandey, J. Krause, C. Felix, J. Boy, and E. Bertini. Towards understanding human similarity perception in the analysis of large sets of scatter plots. In J. Kaye, A. Druin, C. Lampe, D. Morris, and J. P. Hourcade, eds., Proc. of 2016 CHI Conf. on Human Factors in Computing Systems, 2016, pp. 3659–3669. ACM, 2016. doi: 10 . 1145/2858036 . 2858155
- [64] H. Park and J.-Y. Jung. SAX-ARM: Deviant event pattern discovery from multivariate time series using symbolic aggregate approximation and association rule mining. Expert Systems with Appl, 141:112950, 2020.
- [65] R. D. Peng. A method for visualizing multivariate time series data. Journal of Statistical Software, 25, 2008.
- [66] F. Petitjean, A. Ketterlin, and P. Gançarski. A global averaging method for dynamic time warping, with applications to clustering. Pattern Recognit., 44(3):678–693, 2011. doi: 10 . 1016/j . patcog . 2010 . 09 . 013
- [67] V. Pham, N. Nguyen, J. Li, J. Hass, Y. Chen, and T. Dang. Mtsad: Multivariate time series abnormality detection and visualization. In 2019 IEEE International Conference on Big Data (Big Data), pp. 3267–3276. IEEE, 2019.
- [68] A. Roberts, J. Engel, and D. Eck, eds. Hierarchical Variational Autoencoders for Music, 2017.
- [69] D. Sacha, M. Kraus, J. Bernard, M. Behrisch, T. Schreck, Y. Asano, and D. A. Keim. Somflow: Guided exploratory cluster analysis with self-organizing maps and analytic provenance. IEEE Trans. Vis. Comput. Graph., 24(1):120–130, 2018. doi: 10 . 1109/TVCG . 2017 . 2744805
- [70] D. Sacha, A. Stoffel, F. Stoffel, B. C. Kwon, G. P. Ellis, and D. A. Keim. Knowledge generation model for visual analytics. IEEE Trans. Vis. Comput. Graph., 20(12):1604–1613, 2014. doi: 10 . 1109/TVCG . 2014 . 2346481
- [71] P. Senin and S. Malinchik. Sax-vsm: Interpretable time series classification using sax and vector space model. In 2013 IEEE 13th international conference on data mining, pp. 1175–1180. IEEE, 2013.
- [72] L. Shao, M. Behrisch, T. Schreck, T. von Landesberger, M. Scherer, S. Bremm, and D. A. Keim. Guided sketching for visual search and exploration in large scatter plot spaces. In M. Pohl and J. C. Roberts, eds., 5th International EuroVis Workshop on Visual Analytics, EuroVA@EuroVis 2014, Swansea, UK, June 9-10, 2014. Eurographics Association, 2014. doi: 10 . 2312/eurova . 20141140
- [73] J. Shieh and E. Keogh. iSAX: disk-aware mining and indexing of massive time series datasets. Data Mining and Knowledge Disc., 19(1):24–57, 2009.
- [74] T. Spinner, U. Schlegel, H. Schäfer, and M. El-Assady. explainer: A visual analytics framework for interactive and explainable machine learning. IEEE Trans. Vis. Comput. Graph., 26(1):1064–1074, 2020. doi: 10 . 1109/TVCG . 2019 . 2934629
- [75] A. E. Thessen, R. Bartelme, M. Behrisch, E. J. Cain, R. Chang, I. Debnath, P. B. Heidorn, P. Jaiswal, D. S. LeBauer, A. Mosca, et al. Predicting phenotype from multi-scale genomic and environment data using neural networks and knowledge graphs. In 2020 ESA Annual Meeting (August 3-6). ESA, 2020.
- [76] Z. J. Wang, R. Turko, O. Shaikh, H. Park, N. Das, F. Hohman, M. Kahng, and D. H. P. Chau. CNN explainer: Learning convolutional neural networks with interactive visualization. IEEE Trans. Vis. Comput. Graph., 27(2):1396–1406, 2021. doi: 10 . 1109/TVCG . 2020 . 3030418
- [77] M. Wattenberg. Sketching a graph to query a time-series database. In CHI ’01 Extended Abstracts on Human Factors in Computing Systems, CHI EA ’01, p. 381–382. Association for Computing Machinery, New York, NY, USA, 2001. doi: 10 . 1145/634067 . 634292
- [78] L. Weng, I. Jhuo, M. Shi, M. Sun, W. Cheng, and L. Amsaleg. Supervised multi-scale locality sensitive hashing. In A. G. Hauptmann, C. Ngo, X. Xue, Y. Jiang, C. Snoek, and N. Vasconcelos, eds., Proc. of the 5th ACM on Int. Conf. on Multimedia Retrieval, 2015, pp. 259–266. ACM, 2015. doi: 10 . 1145/2671188 . 2749291
- [79] X. Weng and J. Shen. Classification of multivariate time series using two-dimensional singular value decomposition. Knowledge-Based Systems, 21(7):535–539, 2008.
- [80] H. Wickham, D. Cook, H. Hofmann, and A. Buja. Graphical inference for infovis. IEEE Trans. Vis. Comput. Graph., 16(6):973–979, 2010. doi: 10 . 1109/TVCG . 2010 . 161
- [81] Z. Xing, J. Pei, and E. J. Keogh. A brief survey on sequence classification. SIGKDD Explor., 12(1):40–48, 2010. doi: 10 . 1145/1882471 . 1882478
- [82] C. Yu, L. Luo, L. L.-H. Chan, T. Rakthanmanon, and S. Nutanong. A fast lsh-based similarity search method for multivariate time series. Information Sciences, 476:337–356, 2019.