A weakening Compton hump and Soft X-ray excess detected in the Seyfert-1 galaxy MCG –02–58–22
Abstract
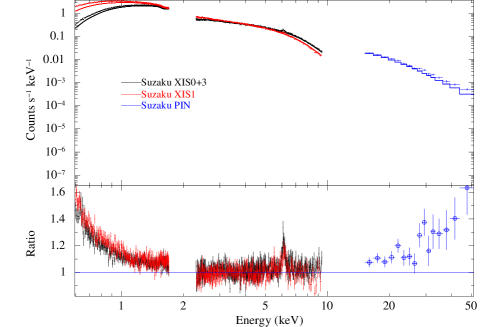
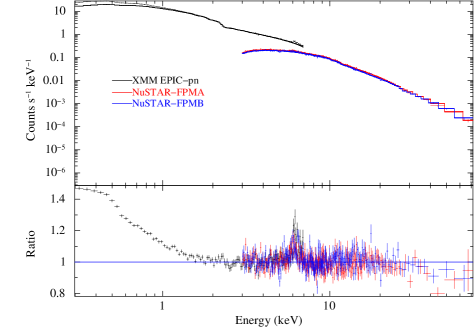
We have carried out an extensive X-ray spectral study of the bare Seyfert-1 galaxy MCG –02–58–22 to ascertain the nature of the X-ray reprocessing media, using observations from Suzaku (2009) and simultaneous observations from XMM-Newton and NuSTAR (2016) . The most significant results of our investigation are: 1. The primary X-ray emission from the corona is constant in these observations, both in terms of the power law slope () and luminosity (). 2. The soft excess flux decreased by a factor of two in 2016, the Compton hump weakened/vanished in 2016, and the narrow FeK emission line became marginally broad () and its flux doubled in 2016. 3. From physical model fits we find that the normalization of the narrow component of the FeK line does not change in the two epochs, although the Compton hump vanishes in the same time span. Since the primary X-ray continuum does not change, we presume that any changes in the reprocessed emission must arise due to changes in the reprocessing media. Our primary conclusions are: A. The vanishing of the Compton hump in 2016 can probably be explained by a dynamic clumpy torus which is infalling/outflowing, or by a polar torus wind. B. The torus in this AGN possibly has two structures: an equatorial toroidal disk (producing the narrow FeK emission) and a polar component (producing the variable Compton hump), C. The reduction of the soft-excess flux by half and increase in the FeK flux by a factor of two in the same period cannot be adequately explained by ionized disk reflection model alone.
1 INTRODUCTION
It is believed that accretion of matter onto a supermassive black hole (1973A&A....24..337S) powers the enigmatic active galactic nuclei (AGN). The primary X-ray emission from AGN central engine arise from Compton upscattering of the accretion disk UV photons by an optically thin and hot ( K) corona, resulting in a power-law spectrum (1991ApJ...380L..51H). The X-ray photons from the corona gets reflected off the cold nuclear matter (the torus) and the ionized accretion disk producing several reprocessed spectral features, such as the Compton-hump at (1995MNRAS.273..837M; 2009MNRAS.397.1549M; 2011ApJ...734...75L; 2018MNRAS.480.1522L), the Soft X-ray excess (SE) at (2012mnras.420.1848d; 2014ApJ...782...76G; 2020MNRAS.497.4213G; 2020arXiv201210620G; 2019MNRAS.486.3124L; 2013ApJ...777....2L; 2014MNRAS.437.2664L; 2017MNRAS.466.1777P) and several fluorescent emission lines in the soft and hard X-rays, of which the most prominent and ubiquitous is the FeK at (2005MNRAS.358..211R; 2009Natur.459..540F; 2010ApJ...718..695G). The exact geometry and location of the corona as well as the reprocessing media are still unknown. In some sources the soft and the hard X-ray band spectra exhibit complex ionized absorption features (2010A&A...521A..57T; 2011ApJ...734...75L; 2014MNRAS.441.2613L; 2015Natur.519..436T; 2016MNRAS.457.3896L; 2018ApJ...868...10L; 2020ApJ...895...37R; 2021NatAs...5...13L; 2019BAAS...51c.429C; 2019BAAS...51c.138L) which are signatures of particle outflows from the central engine.
As per the AGN unification model (1985ApJ...297..621A; 1995PASP..107..803U), the central engine is surrounded by a gravitationally bound toroidal dusty region, popularly called the torus, the geometry and dynamics of which are not well defined. This neutral/lowly-ionized obscurer accounts for the observational differences between the two types of AGN, types I and II (2015ApJ...815L..13R; 2002ApJ...571..234R; 2020ApJ...897...66L). If our line of sight intersects the dusty torus (edge on view), we see only the reflected emission (type-II), while a face-on view gives us a glimpse of the primary emission from the central engine (type-I). The torus is a significant reprocessor of the X-ray primary emission, and perhaps plays a significant role in feeding the SMBH (1988ApJ...329..702K). The dusty torus is believed to extend to approximately parsec scales, that is, larger than the broad-line region (BLR) but smaller than the narrow line region (NLR). The simplest configuration of an axi-symmetric donut-shaped torus is now known to be not true, instead the structure is more complex and diverse as revealed by multi-wavelength observations over the last couple of decades (see, e.g., reviews by 2012AdAst2012E..17B; 2015ARA&A..53..365N; 2017NatAs...1..679R).
Out of the several torus models, the clumpy-torus-models (2008ApJ...685..160N; 2008ApJ...685..147N) have successfully reproduced the observed infrared spectral energy distribution (SED) of AGN. The clumpiness of the torus has also been indirectly verified by the more recent X-ray observational studies of short and long timescale X-ray eclipse events in several AGN (2014MNRAS.439.1403M; 2020ApJ...897...66L). These are attributed to the passage of individual clumpy absorbing clouds across our line of sight. 2017NatAs...1..679R suggests that in the infrared, the torus is a transition zone between the broad-line and the narrow-line regions, and, at least in some galaxies, it consists of two structures: an equatorial toroidal disk (torus) and a polar component (2019ApJ...884..171H). The narrow FeK emission line at and the Compton hump are the most prominent spectral features of the reflection of hard X-ray photons off the torus.
Previous studies on this source have detected a prominent Compton hump at energies in the 2009 Suzaku spectra (2011ApJ...732...36R; 2020MNRAS.498.5207W). This is a bare Seyfert galaxy and has exhibited a remarkably stable power law slope () in the last years (1992ApJ...398..501G; 1995ApJ...451..147W; 2011ApJ...732...36R). In this paper we investigate the cause for variability in the SE, the FeK emission line and the weakening of the Compton hump, using broad band multi-epoch data from Suzaku, XMM-Newton and NuSTAR.
The paper is arranged as follows: Section LABEL:sec:obs discusses the observations and data reprocessing, followed by spectral analysis in Section LABEL:sec:analysis. In Section LABEL:sec:results we list the prominent results. Section LABEL:sec:discussion discusses the results followed by conclusions. Throughout this paper, we assumed a cosmology with and . The source is located at a luminosity distance of . We note that this source is also known as Mrk 926.
| X-ray | observation | Short | Date of obs | Net exposure |
|---|---|---|---|---|
| Satellite | id | id | ||
| Suzaku | 704032010 | obs1 | 02-12-2009 | |
| XMM-Newton | 0790640101 | obs2 | 21-11-2016 | |
| NuSTAR | 60201042002 | obs3 | 21-11-2016 |
| Spectral | Flux | Flux |
|---|---|---|
| Component | obs1 | obs2 & obs3 |
| Soft Excess () | ||
| Power law () | ||
| FeK emission line () | ||
| Reflected emission () |
Unabsorbed power law flux estimated in the energy range .
The reflected emission due to Compton scattering of the hard X-ray photons by a neutral medium, as estimated using the model pexrav. See Table LABEL:Table:pheno1 for the model fit. The fluxes are in the units of .