AA \jyearYYYY
Tidal Disruption Events
Abstract
The concept of stars being tidally ripped apart and consumed by
a massive black hole (MBH) lurking in the center of a galaxy first
captivated theorists in the late 1970’s. The observational evidence
for these rare but illuminating phenomena for probing otherwise
dormant MBHs, first emerged in archival searches of the soft X-ray
ROSAT All-Sky Survey in the 1990’s; but has recently
accelerated
with the increasing survey power in the optical time domain, with
tidal disruption events (TDEs) now regarded as a class of optical
nuclear transients with distinct spectroscopic features.
Multiwavelength observations of TDEs have revealed
panchromatic emission, probing a wide range of scales, from the
innermost regions of the accretion flow, to the surrounding
circumnuclear medium. I review the
current census of 56 TDEs
reported in the literature, and their observed properties can be
summarized as follows:
The optical light curves follow a power-law decline from peak that
scales with the inferred central black hole mass as expected for the
fallback rate of the stellar debris, but the rise time does not.
The UV/optical and soft X-ray thermal emission come from
different spatial scales, and their intensity ratio has a large
dynamic range, and is highly variable, providing important clues
as to what is
powering
the two components.
They can be grouped into three spectral classes, and those with
Bowen fluorescence line emission show a preference for a hotter and
more compact line-emitting region, while those with only He II
emission lines are the rarest class.
doi:
10.1146/((please add article doi))keywords:
tidal disruption, black holes, transients, accretion physics, surveys1 INTRODUCTION
Tidal disruption events (TDEs) originated in the late 1970s as a theoretical concept; a dynamical consequence of massive black holes (MBHs) speculated to be at the centers of most galaxies (Hills, 1975; Lidskii & Ozernoi, 1979). A star’s orbit could bring it close enough to the MBH to be disrupted or captured by the black hole, depending on the relative size of the tidal disruption radius to the black hole event horizon. When a star is disrupted outside the event horizon, which for a solar type star occurs for , a luminous flare of radiation is expected from the bound fraction of the tidal debris that falls back onto the black hole, and circularizes to form an accretion disk (Rees, 1988; Phinney, 1989; Evans & Kochanek, 1989; Ulmer, 1999). This electromagnetic signal was suggested at the time to be one of the best probes for dormant MBHs lurking in the galaxy centers, when direct dynamical measurements of black hole mass are not feasible.
TDEs also act as a cosmic laboratory to study the real-time formation of an accretion disk and jet. In a TDE, a previously dormant black hole goes through a dramatic transformation, with a sudden new influx of gas, and potentially magnetic fiux, available from the disrupted star for accretion. Given that the timescale for fallback and circularization of the stellar debris streams is as short as months (see §3.1), TDEs allow us to witness the process of the assembly of the nascent accretion disk, and and the launching of any accompanying outflow or jet. Once the accretion process begins, we can also probe the gas density of the inner regions of galaxy nuclei from observing the photoionization and interaction of jets and outflows with its circumnuclear environment.
The rate at which stars are destined to be tidally disrupted is well determined by the mass of the central black hole, and the nuclear stellar density and orbital distribution. Analytical and numerical calculations for stars scattering into the MBH “loss cone” (Frank & Rees, 1976), the angular momentum phase-space for which , where is the pericenter of the star’s orbit, are in general agreement for a rate that ranges from yr-1 galaxy-1 (Magorrian & Tremaine, 1999; Wang & Merritt, 2004; Stone & Metzger, 2016; Brockamp, Baumgardt & Kroupa, 2011), with rates as high as yr-1 galaxy-1 in galaxies with steep nuclear density profiles such as nucleated dwarf galaxies (Wang & Merritt, 2004) and post-starburst (“E+A”) galaxies (Stone & van Velzen, 2016). The spin distribution of MBHs can also leave an imprint on the TDE rate, especially at masses close to the maximum mass for which the tidal disruption radius is still outside the black hole’s event horizon, , which increases from for a nonspinning (”Schwarzschild”) BH up to for a maximally spinning (”Kerr”) black hole, due to the effects of the shrinking event horizon with increasing spin (Beloborodov et al., 1992; Kesden, 2012a).

The presence of a binary MBH, as a product of a recent galaxy merger, can also temporarily enhance (suppress) the TDE rate due to the pumping up (ejection) of stars on radial orbits, until the binary MBHs inspiral, and the loss cone is refilled by two-body interactions (Milosavljević & Merritt, 2003; Lezhnin & Vasiliev, 2016). Finally, the mere presence of a central black hole can be tested by comparing to the TDE rates expected for galaxy mass functions with different galaxy-mass dependent black hole occupations fractions (Stone & Metzger, 2016), which may reveal the formation mechanism of the MBHs themselves (Greene, 2012).
Given these sensitivities of the TDE rate to the mass, spin, binarity and occupation fraction of MBHs, they serve as excellent probes of MBH demographics. Finally, it should be noted that the demographics, internal structure, and evolutionary state of the unlucky stars themselves can be revealed from the timescales and chemical composition of the observed TDEs (Syer & Ulmer, 1999; Lodato, King & Pringle, 2009; MacLeod, Guillochon & Ramirez-Ruiz, 2012; Guillochon & Ramirez-Ruiz, 2013; Kochanek, 2016; Ryu et al., 2020; Law-Smith et al., 2020). In Figure 1, I plot the distinct regions of the parameter space of black hole mass and impact parameter that TDEs can probe, from the disruption of white dwarfs by intermediate-mass black holes to the disruption of red giants by the most massive black holes known.
Despite the strong theoretical motivations for using TDEs to probe MBHs, and the current census of 56 TDEs reviewed here, progress for using TDEs as probes of black hole demographics has been severely hampered by our lack of understanding of the emission mechanism powering TDEs. Indeed, in the last decade, observations of TDEs have outpaced theoretical modeling, with many important aspects of TDE properties still yet to be definitively and consistently accounted for with a physically motivated model for the tidal disruption debris and its eventual assembly into an accretion disk. However, the goal of this review is to present our latest understanding of the observed properties of TDEs, with the hopes that a theoretical understanding will soon follow after a global view of the TDE population.
2 OBSERVED CANDIDATES
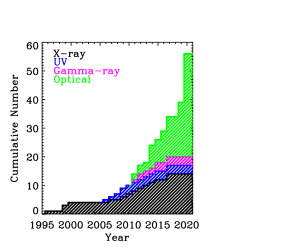
We are still at a point in the field of TDEs, that the well studied candidates can be listed individually. In Table 1 I list the 56 TDE candidates that have been reported in the literature, including the name of the survey that discovered the transient, the waveband of the survey (ultraviolet, optical, X-ray, or gamma-ray), the peak luminosity and the characteristic thermal blackbody temperature at peak, and the reference associated with those measurements. All of these nuclear transients have been shown to not harbor an active galactic nucleus (AGN) or a supernova (SN) in the host galaxy nucleus, with a TDE as the most viable explanation for the flaring source. In principle TDEs should occur around massive black holes that have an AGN accretion disk, and at least one strong candidate has been reported in a Narrow-Line Seyfert 1 galaxy (Blanchard et al., 2017). TDEs in an AGN host may even produce interesting signatures from the interaction with the debris streams with the pre-existing AGN disk that could distinguish them from TDEs around quiescent black holes (Chan et al., 2019). However, there are too many ways in which observations of a variable AGN could be mistook with the signatures of a TDE flare, and so I avoid these candidates to ensure the purity of the TDE census. In Figure 2 we show the cumulative number of TDEs reported in the literature as a function of time and color-coded by the survey waveband. Once can see how wide-field optical surveys have played an important role in the last decade in discovering TDEs, and account for almost 2/3 of all the reported TDEs to date.
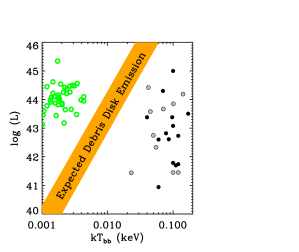
One of the most distinguishing characteristics of TDEs is that their continuum is very well described by a thermal blackbody. However, as can be seen in Figure 2, the temperature distribution of TDEs is bimodal, and seemingly dependent on the waveband in which they were discovered. However, there are now 10 UV/optically selected TDEs for which a soft X-ray component was also detected in follow-up X-ray observations (see §3.8). We plot their blackbody temperatures in gray, and see that their characteristic temperatures fall within the X-ray selected TDE distribution, indicating that these two components are in fact physically distinct. In §4.2 we discuss how the UV/optical and X-ray thermal components are related, and present an important population of nearby TDEs for which both components have been detected, and reveal clues about their physical nature from their relative temporal evolution.
2.1 Soft X-ray Candidates
The first TDE candidates emerged from archival searches of the ROSAT All Sky Survey (RASS) conducted in , whose coverage of 20% of the sky in the 0.1-2.4 keV band, when compared to follow-up pointed observations the with Position Sensitive Proportional Counter (PSPC), revealed luminous ( erg s-1), extremely soft () X-ray outbursts from four galaxies with no previous evidence of an AGN, that implied a rate of yr-1 per galaxy, consistent with theoretical dynamical predictions for the rates of TDEs (Donley et al., 2002). Follow-up observations of three of these candidates with Chandra a decade later, revealed that they had faded in the X-rays by factors of 240 to 6000, consistent with the expectations of the power-law decline of the accretion rate in a TDE (Halpern, Gezari & Komossa, 2004).
The next X-ray survey with the wide-field coverage ( 15 % of sky), soft X-ray (0.2-2 keV) sensitivity capable of detecting TDEs was the XMM-Newton Slew Survey (XMMSL) starting in 2003, which discovered two galaxies with no detections in RASS or signs of an AGN in their optical spectra, that were detected as luminous soft X-ray sources in the XMMSL (Esquej et al., 2007), and subsequently shown to have faded in follow-up observations yr later by a factor consistent with a power-law decline (Esquej et al., 2008). However, one of the TDE candidates from XMMSL, NGC 3599, was found to have unanalyzed archival slew observations which showed that the galaxy was bright in the X-rays 18 months before the XMMSL detection, and thus did not have the flaring behavior of a bonafide TDE (Saxton et al., 2015). More recently, the XMM-Newton slew survey has discovered five more candidates, one of which, XMMSL1 J0740-85, is notable for a well sampled light curve from follow-up Swift-XRT and pointed XMM-Newton observations (Saxton et al., 2017), a detection of a UV-bright transient component from Swift-UVOT follow-up, a detection in the radio from a non-relativistic outflow or a weak jet (Alexander et al., 2017), and a non-thermal power-law component to the X-ray flare.
A couple more TDE candidates have been discovered by following up archival luminous and extremely soft ROSAT PSPC sources with XMM-Newton and/or Chandra (Cappelluti et al., 2009; Maksym, Lin & Irwin, 2014), including a candidate from a dwarf galaxy with a central black hole estimated to be as inferred from the host galaxy luminosity (Maksym, Lin & Irwin, 2014). A more recent cross match of sources that were detected by RASS but then had faded in serendipitous XMM-Newton observations taken two decades later, revealed three more sources broadly consistent with a TDE, potentially implying a TDE rate of yr-1 per galaxy, but with no optical spectroscopic follow-up observations to investigate the nature of their host galaxies (Khabibullin, Sazonov & Sunyaev, 2014).
Several soft X-ray outbursts were also detected from archival searches of Chandra data, in particular of rich galaxy clusters with multiple epochs of observations, including a TDE candidate in a dwarf galaxy WINGS J1348+26 in cluster Abell 1795 (Maksym et al., 2013), with a host galaxy stellar stellar mass indicating a black hole in the intermediate-mass black hole range, of (Maksym et al., 2014), and a serendipitous detection of the flare in the EUV by the Extreme Ultraviolet Explorer (EUVE) satellite (Donato et al., 2014). The large-amplitude, flaring soft X-ray source 3XMM J1521+07 was discovered in archival Chandra and XMM-Newton observations of a galaxy group NGC 5813, and identified as a TDE candidate, albeit with a very shallow decline rate post peak, argued to be the signature of slow circularization and super Eddington accretion (Lin et al., 2015).
While all of the candidates from X-ray observations are convincing because of their extremely soft, thermal X-ray spectra, and large variability amplitudes unique from AGN, one of the weakness of these candidates is the lack of high cadence coverage of the X-ray light curves, and multiwavelength coverage to better constrain the broadband spectral energy distributions (SEDs) of the flares. Fortunately, optical surveys have played an important role in enabling prompt discovery and follow-up, as well as a great improvement in time sampling of days instead of years.
2.2 UV Candidates
The first TDE candidate from UV observations was reported by Renzini et al. (1995) from archival Hubble Space Telescope (HST)/FOC observations of elliptical galaxy NGC 4552, which showed an enhanced nuclear flux in an epoch in 1993 compared to 1991. However, HST/FOS follow-up spectroscopy by Cappellari et al. (1999) found broad-line emission from the nucleus, indicative of a low-luminosity AGN.
The first search for TDEs in UV survey data was done with the Galaxy Evolution Explorer (GALEX) Deep Imaging Survey, which surveyed a total of 80 deg2 of sky in the and bands in order to produce deep UV images to map the star formation history of galaxies out to (Martin et al., 2005). A systematic search for extragalactic UV transients from creating yearly coadds of the multiple exposures taken to build up the GALEX DIS images, and selecting only host galaxies with follow-up optical spectra that indicated an inactive galaxy host, yielded three candidates, two of which, D1-9 and D3-13, were serendipitously detected as an optical transient in , , , and -band difference imaging from the CFHT Legacy Survey (CFHTLS) (Gezari et al., 2006, 2008, 2009). The third GALEX candidate, D23H-1, was followed up with prompt optical imaging that detected a coincident optical transient (Gezari et al., 2009), however, this candidate is now suspect, since a significant level of variability was detected in the mid-infrared years after the peak from serendipitous WISE observations, which suggest that the event could be associated with persistent variability of an AGN (van Velzen et al., 2016), which was masked by the strong emission lines powered by star-formation in the host galaxy spectrum (Gezari et al., 2009).
The multi-band detections of these TDE candidates in the , , , , , and bands were well fitted by thermal blackbody emission, although with blackbody temperatures an order of magnitude cooler than had been measured for the X-ray selected TDEs with K and erg s-1 (Gezari et al., 2009). Chandra follow-up X-ray observations of the GALEX TDE candidates, years after their UV/optical peak, revealed weak, extremely soft X-ray emission in D1-9 and D3-13 (Gezari et al., 2008), indicating a second, higher temperature component ( K), distinct from the UV/optical thermal emission (Gezari et al., 2009).
While the UV light curves constructed from GALEX DIS images with a yearly cadence were consistent with a flaring event, the optical light curves extracted from CFHTLS with a much higher cadence of 4 days, were in remarkably good agreement with numerical simulations for the fallback rate expected in a TDE, although with evidence for a shallower decline rate at late times (Gezari et al., 2009). Furthermore, the optical difference imaging from CFHTLS localized the position of the flares to within 0.25 arcsec of the host galaxy nucleus, a great improvement over the 5 arcsec PSF GALEX. The detection of TDEs in optical survey data, designed for the detection of supernovae, had powerful implications for the next generation of optical surveys, such as Pan-STARRS and PTF, to detect large numbers of TDEs, and in real-time.
2.3 Optical Candidates
Before the first real-time searches for TDEs from optical time domain data, van Velzen et al. (2011) performed an archival study of the 300 deg2 SDSS Stripe 82 survey with the 2.5m telescope at Apache Point Observatory multi-epoch data to search for nuclear transients in inactive galaxy hosts. This search yielded two candidates, TDE1 and TDE2, which had serendipitous UV detections by GALEX, and again were well described by thermal emission with K, and a light curve that could be fitted with a power-law decline, although shallower than the decline expected for the fallback rate. TDE2 had a serendipitous follow-up spectrum during the flare, which showed evidence of transient broad H emission associated with the event. One of the most important results of this study, was that the properties of the optical light curve, namely their blue optical color, and lack of color evolution with time, could be used to distinguish TDEs from more common interlopers like variable AGN and SNe. This study also measured an empirical TDE rate of 1.9 yr-1 (/300 deg2) (/22 mag)-3/2, which could be scaled to the flux limit () and area () of future optical surveys.
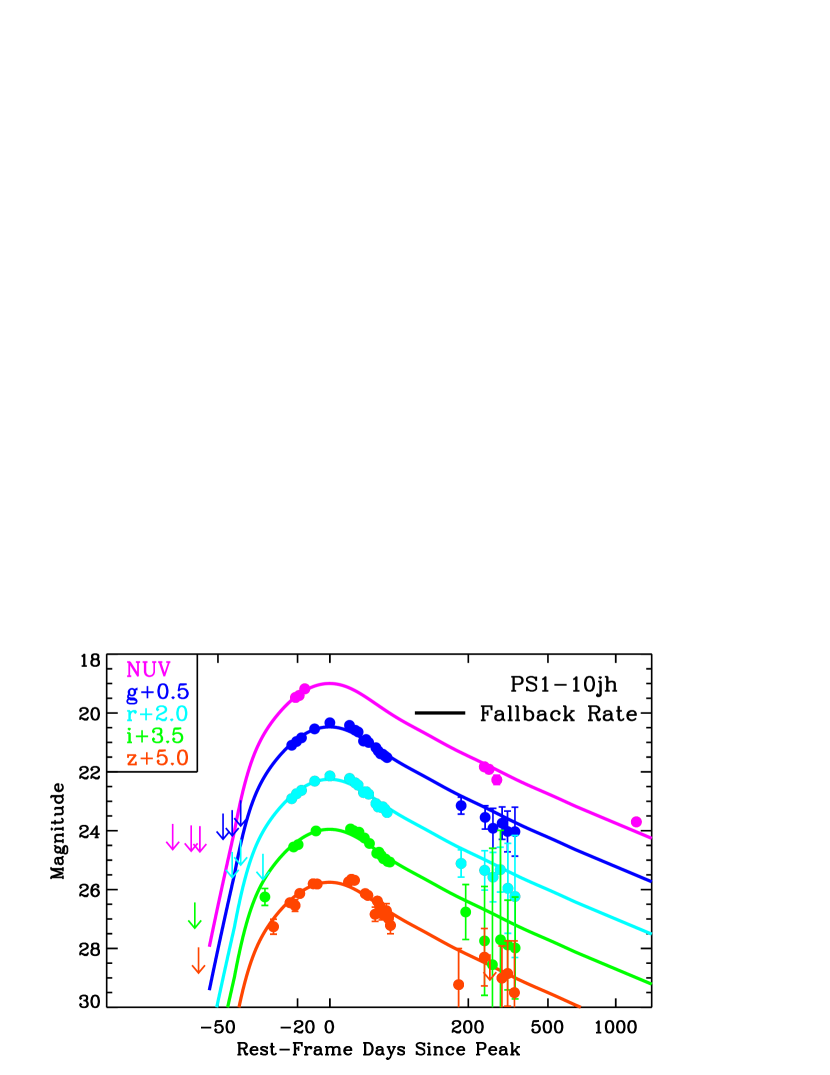
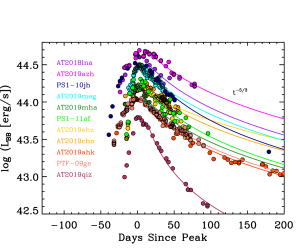
There was a huge jump in quality of TDE light curves with the search for TDEs in real time from optical time domain surveys. PS1-10jh was the first TDE detected with a well-sampled rise to peak in optical survey data, and was discovered in a joint search by Gezari et al. (2012) for nuclear transients in the 2-day cadence GALEX Time Domain Survey in the and the 3-day cadence ,,, and band optical difference imaging of the 70 deg2 Pan-STARRS1 (PS1) Medium Deep survey (MDS) taken with the 1.8 m telescope on Haleakala Observatory (Chambers et al., 2016). Figure 3 shows the well-sampled GALEX+PS1 light curve of PS1-10jh, including a late-time detection from HST/WFC3 (Gezari et al., 2015), and a fit to a numerical simulation for the fallback rate in a tidal disruption event from Guillochon & Ramirez-Ruiz (2013). The light curve is distinct from a SN for its remarkably constant blue optical color and persistent UV-bright emission, and it is surprising how well the numerical simulations describe the light curve shape, with no additional physics added to take into account accretion physics or radiative transfer effects.
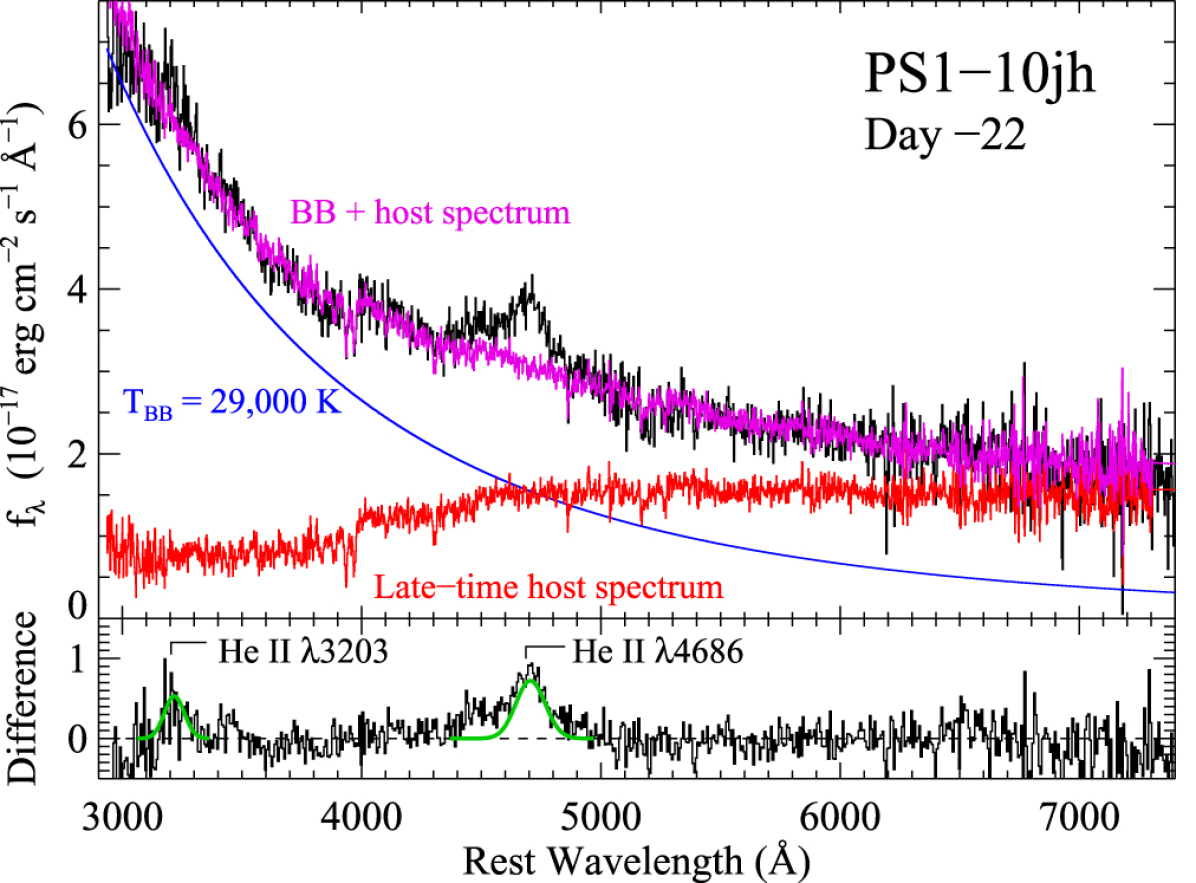
Another important aspect of this event was the first unambiguous detection of transient, broad emission lines in prompt optical spectroscopic follow-up observations. Interestingly, the most prominent broad spectral feature in PS1-10jh was misidentified as Mg II at . However, when the transient faded enough to reveal the underlying host galaxy absorption features 7.5 months after peak at , the broad line in the peak spectrum was identified as He II with FWHM = 9,000 km s-1, along with a detection of broad He II, and no detection of broad Balmer line emission, which would be expected to have (see Figure 3). A careful subtraction of a late-time spectrum of the host galaxy placed further limits on the He II/H ratio to be in the pre-peak spectrum (Gezari et al., 2015). This first spectroscopic TDE was to be the first of a rare class of helium-only (TDE-He) TDEs.
A second TDE candidate was discovered from search for blue, UV-bright nuclear transients in the GALEX and PS1 data, PS1-11af (Chornock et al., 2014), and was similar in UV/optical blackbody temperature and light curve shape as the other UV/optical TDEs. This higher-redshift TDE, at , was notable for having a relatively featureless spectrum, except for transient broad absorption features in the UV at early times reminiscent of the O II ”W” feature seen in some superluminous supernovae (SLSNe), but without the emergence of any optical line features or significant cooling, as seen in SLSNe.
Pan-STARRS has continued surveying the Northern Sky in the wide optical filter that covers the spans the bands as the Pan-STARRS Survey for Transients, and reported the discovery of AT2017eqx/PS17dhz, which had a typical UV/optical light curve of a TDE, but demonstrated the first case of a transformation in TDE spectral class, from a TDE-H+He to TDE-He spectrum, with initially broad H and He II lines, with the broad H lines disappearing on a timescale of days (Nicholl et al., 2019). Note that this is the first TDE for which there is a ”survey name” and an ”astronomical transient (AT)” name, assigned by the Transient Name Server (TNS). The TNS AT name is the official IAU mechanism for reporting new astronomical transients, and is important for keeping track of transients that are increasingly being detected by multiple surveys. It is the convention to assign the ”survey name” from the survey that first registered the coordinates of the transient with the TNS.
An archival analysis of transients in the Palomar Transient Factory (PTF) survey with the Palomar 48in telescope, with follow-up spectra and peak absolute magnitudes intermediate between SNe Ia and SLSNe, ( mag mag) produced three nuclear transients, one of which, PTF 09ge, had a very similar light curve shape and He II only spectrum to that of PS1-10jh (Arcavi et al., 2014). The other two, PTF09djl and PTF09axc, had less well-sampled light curves, but did show very broad Balmer line features, representing a class of H-rich (TDE-H) TDEs, and interestingly, had strong H absorption characteristic of the rare class of E+A galaxies, whose strong A-star features and no emission lines are explained as post-starburst galaxies with a truncation of star formation Gyr ago. PTF had detected another interesting blue, nuclear transient, PTF10iya, in a star-forming galaxy (Cenko et al., 2012a), however, with its poorly sampled light curve, featureless optical spectrum, and non-thermal X-ray spectrum () , the association of the short-lived ( d) event with a TDE was not clear-cut.
A real-time search for TDEs was conducted during the next phase of PTF operations, known as iPTF. During this search, the strategy for selecting TDEs was to use complete Neil Gehrels Swift UV follow-up of all nuclear transients to filter out AGN and SNe (Figure LABEL:fig:sdss). This systematic UV follow-up program, which due to finite Swift observing time was limited to nuclear transients in red galaxy hosts (characteristic of previous TDE discoveries), yielded three more nuclear transients with properties consistent with previously discovered optical TDEs: iPTF-16axa (Hung et al., 2017), iPTF-16fnl (Blagorodnova et al., 2017), and iPTF-15af (Blagorodnova et al., 2019). At the time, iPTF-16fnl was the closest optical TDE ever detected, in a nearby, E+A galaxy at , and with a lower peak luminosity ( erg s-1) and faster fading timescale than previous TDEs, with important implications for the TDE luminosity function and rate. An HST/STIS UV spectrum of iPTF-15af revealed broad absorption and emission line features analogous to broad absorption-line quasars (BAL QSOs), suggesting the presence of an outflow, and discussed further in §3.9.
One of the unexpected results from the All-Sky Automated Survey for Supernovae (ASAS-SN) survey (Kochanek et al., 2017), a network of 14 cm telescopes hosted by the Las Cumbres Observatory, is that despite its large pixel size (8 arcsec) compared to other optical surveys, it would be highly efficient in detected tidal disruption events in the nuclei of galaxies. One of the reasons for this is the bright limit of ASAS-SN ( mag), and manageable detection rate, allowing for near spectroscopic completeness (Brown et al., 2019), and thus no selection bias in spectroscopically following-up and classifying transients. In the first two years of the ASAS-SN survey, they discovered four TDEs: ASASSN-14ae (Holoien et al., 2014), ASASSN-14li (Holoien et al., 2016b), ASASSN-15lh (Dong et al., 2016; Leloudas et al., 2016), and ASASSN-15oi (Holoien et al., 2016a). The bright, nearby TDEs discovered by ASAS-SN allow for high signal-to-noise multi-wavelength follow-up and spectroscopic monitoring, and we will discuss each of these important TDE discoveries as we discuss the exciting results from their multiwavelength observations, including detections in the X-ray, mid-infrared, radio.
In the last two years, ASAS-SN has discovered another five TDEs (AT2018fyk/ASASSN-18ul, AT2018dyb/ASASSN-18pg, AT2018hyz/ASASSN-18zj, AT2019ahk/ASASSN-19bt, and AT2019azh/ASASSN-19dj), an impressive discovery rate that is now only recently being outpaced by the ZTF survey. One of these recent TDE discoveries, AT2019ahk/ASASSN-19bt, was detected in the Transiting Exoplanet Survey Satellite (TESS) Continuous Viewing Zone (CVZ), which enabled the extraction of a light curve in the TESS broadband optical filter binned into a cadence of just 2 hr over a timescale of 2 months (Holoien et al., 2019a)! This allowed for an extremely detailed look at the pre-peak light curve of the TDE, which was surprisingly smooth, and well fitted to a rise to peak in the first 15 days of its 41 day rise to peak.
The Zwicky Transient Facility (Bellm et al., 2019, ZTF), which uses an upgraded detector on the Palomar 48in telescope with a 50 deg2 field of view and a limiting magnitude per epoch of mag in the and bands, as well as a dedicated robotically operated low-resolution () SED Machine (SEDM) spectrograph on the Palomar 60in telescope (Blagorodnova et al., 2018) for classification of transients brighter than mag, has yielded the largest sample of TDEs from a single survey to date. In the first 1.5 yr of survey operations, they reported the systematic selection, classification, and characterization of 17 TDEs (van Velzen et al., 2020a), some of which were detected or discovered by other surveys, including ASAS-SN, the Asteroid Terrestrial-impact Last Alert System (Tonry et al., 2018, ATLAS), and the Pan-STARRS Survey for Transients (Nicholl et al., 2019).
2.4 Hard X-ray Candidates
There was a big shift in the TDE landscape on 2011 March 25, when Swift/BAT discovered a long-duration hard X-ray transient, accompanied by transient radio and infrared emission, from the nucleus of a quiescent galaxy at : Swift J1644+57 (Bloom et al., 2011; Levan et al., 2011; Zauderer et al., 2011). The hard, power-law X-ray spectrum, highly super Eddington luminosity (isotropic X-ray luminosity of erg s-1), radio synchrotron spectrum, and power-law decline of the X-ray light curve were explained as viewing an on-axis collimated jet launched by the tidal disruption of a star by the galaxy’s central black hole. In fact, a class of ”jetted-TDEs” had actually been predicted by Giannios & Metzger (2011), but their models focused on off-axis emission from the interaction of the jet with the interstellar medium, and radio searches had only yielded a few late-time detections (Bower, 2011; Bower et al., 2013), implying that of TDEs launch jets. Two more jetted TDE candidates were detected by Swift with similar X-ray and radio properties: Swift J2058+05 (Cenko et al., 2012b; Pasham et al., 2015) and Swift J1112-82 (Brown et al., 2015). The implyed rate of jetted TDEs is only yr-1 per galaxy, suggesting a combination of the effects of a small beaming angle (), and that only of TDEs produce relativistic jets (Brown et al., 2015).
In the case of Swift J2015+05 a thermal component ( K) in the UV and optical was detected, similar to the UV and optically selected TDEs, and which may have been missed in Swift J1644+57 due to dust extinction in the host galaxy nucleus. A systematic search of 53,000 galaxies within 100 Mpc with observations in the Swift/BAT archive yielded the association of a hard X-ray flare from nine quiescent galaxies, implying a candidate TDE rate in the hard X-rays of yr-1 per galaxy, a rate comparable to that measured for TDEs selected in the soft X-rays, suggesting that hard X-ray components could be ubiquitous even in unbeamed TDEs (Hryniewicz & Walter, 2016). However, with sparsely sampled X-ray light curves, and no multiwavelength follow-up data, it is hard to verify their classification as bonafide TDEs.
Integral discovered a flaring hard X-ray source in the 20-40 keV band, which was also detected in the 2-10 keV band in follow-up observations with Swift/XRT and XMM-Newton, from the nucleus of the nearby spiral galaxy NGC 4845, which was argued from X-ray spectrum, luminosity and timing arguments, to be emission from an accretion disk corona formed from the tidal disruption of a super-Jupiter sized object around a black hole (Nikołajuk & Walter, 2013) and was also detected as a radio transient consistent with emission from an off-axis jet (Lei et al., 2016). The tidal disruption of a substellar object was also invoked to explain the low peak luminosity of the ROSAT soft X-ray selected TDE in NGC 5905 (Li, Narayan & Menou, 2002).
| Name | Surveya | Waveband | Redshift | log L | log TBB | Publicationc |
|---|---|---|---|---|---|---|
| (erg s-1) | (K) | |||||
| NGC 5905 | ROSAT | X | 0.01124 | 40.94 | 5.84 | Bade, Komossa & Dahlem (1996) |
| RX J1624+75 | ROSAT | X | 0.0636 | 43.38 | 6.05 | Grupe, Thomas & Leighly (1999) |
| RX J1242-11A | ROSAT | X | 0.050 | 42.60 | 5.84 | Komossa & Greiner (1999) |
| RX J1420+53 | ROSAT | X | 0.147 | 43.38 | 5.67 | Greiner et al. (2000) |
| GALEX D3-13 | GALEX | U | 0.3698 | 43.98 | 4.66 | Gezari et al. (2006) |
| SDSS J1323+48 | XMM | X | 0.0875 | 44.30 | 5.91 | Esquej et al. (2007) |
| GALEX D1-9 | GALEX | U | 0.326 | 43.48 | 4.59 | Gezari et al. (2008) |
| TDXF J1347-32 | ROSAT | X | 0.0366 | 42.73 | 6.14 | Cappelluti et al. (2009) |
| GALEX D23H-1 | GALEX | U | 0.1855 | 43.95 | 4.70 | Gezari et al. (2009) |
| SDSS J1311-01 | Chandra | X | 0.195 | 41.74 | 6.14 | Maksym, Ulmer & Eracleous (2010) |
| SwiftJ1644 | Swift | G | 0.353 | n/a | n/a | Bloom et al. (2011) |
| 2XMMi J1847-63 | XMM | X | 0.0353 | 42.82 | 5.96 | Lin et al. (2011) |
| SDSS-TDE1 | SDSS | O | 0.136 | 43.64 | 4.42 | van Velzen et al. (2011) |
| SDSS-TDE2 | SDSS | O | 0.2515 | 44.54 | 4.37 | van Velzen et al. (2011) |
| PS1-10jh | PS | O | 0.1696 | 44.47 | 4.59 | Gezari et al. (2012) |
| SDSS J1201+30 | XMM | X | 0.146 | 45.00 | 6.06 | Saxton et al. (2012) |
| SwiftJ2058 | Swift | G | 1.186 | n/a | n/a | Cenko et al. (2012b) |
| WINGS J1348+26 | Chandra | X | 0.0651 | 41.79 | 6.06 | Maksym et al. (2013) |
| PS1-11af | PS | O | 0.4046 | 44.16 | 4.28 | Chornock et al. (2014) |
| RBS 1032 | ROSAT | X | 0.026 | 41.70 | 6.11 | Maksym et al. (2014) |
| PTF-09ge | PTF | O | 0.064 | 44.04 | 4.08 | Arcavi et al. (2014) |
| PTF-09axc | PTF | O | 0.1146 | 43.46 | 4.08 | Arcavi et al. (2014) |
| PTF-09djl | PTF | O | 0.184 | 44.42 | 4.41 | Arcavi et al. (2014) |
| ASASSN-14ae | ASASSN | O | 0.0436 | 43.87 | 4.29 | Holoien et al. (2014) |
| 3XMM J1521+07 | XMM | X | 0.179 | 43.51 | 6.30 | Lin et al. (2015) |
| SwiftJ1112 | Swift | G | 0.89 | n/a | n/a | Brown et al. (2015) |
| ASASSN-14li | ASASSN | O | 0.02058 | 43.66 | 4.52 | Holoien et al. (2016b) |
| ASASSN-15lh | ASASSN | O | 0.2326 | 45.34 | 4.30 | Dong et al. (2016) |
| ASASSN-15oi | ASASSN | O | 0.0484 | 44.45 | 4.60 | Holoien et al. (2016b) |
| iPTF-16axa | PTF | O | 0.108 | 43.82 | 4.46 | Hung et al. (2017) |
| iPTF-16fnl | PTF | O | 0.0163 | 43.18 | 4.47 | Blagorodnova et al. (2017) |
| 3XMM J1500+01 | XMM | X | 0.1454 | 43.08 | 6.06 | Lin et al. (2017) |
| OGLE16aaa | OGLE | O | 0.1655 | 44.22 | 4.36 | Wyrzykowski et al. (2017) |
| XMMSL1 J0740-85 | XMM | X | 0.0173 | 42.61 | 6.00 | Saxton et al. (2017) |
| iPTF-15af | PTF | O | 0.07897 | 44.10 | 4.85 | Blagorodnova et al. (2019) |
| AT2017eqx/PS17dhz | PS | O | 0.1089 | 43.82 | 4.32 | Nicholl et al. (2019) |
| AT2018zr/PS18kh | PS | O | 0.071 | 43.78 | 4.14 | van Velzen et al. (2020a) |
| AT2018bsi/ZTF18aahqkbt | ZTF | O | 0.051 | 43.87 | 4.53 | van Velzen et al. (2020a) |
| AT2018dyb/ASASSN-18pg | ASASSN | O | 0.018 | 44.08 | 4.40 | Leloudas et al. (2019) |
| AT2018fyk/ASASSN-18ul | ASASSN | O | 0.059 | 44.48 | 4.54 | Wevers et al. (2019) |
| AT2018hco/ATLAS18way | ATLAS | O | 0.088 | 44.25 | 4.39 | van Velzen et al. (2020a) |
| AT2018hyz/ASASSN-18zj | ASASSN | O | 0.04573 | 44.10 | 4.25 | Gomez et al. (2020) |
| AT2018iih/ATLAS18yzs | ATLAS | O | 0.212 | 44.62 | 4.23 | van Velzen et al. (2020a) |
| AT2018lna/ZTF19aabbnzo | ZTF | O | 0.091 | 44.56 | 4.59 | van Velzen et al. (2020a) |
| AT2018lni/ZTF18actaqdw | ZTF | O | 0.138 | 44.21 | 4.38 | van Velzen et al. (2020a) |
| AT2019ahk/ASASSN-19bt | ASASSN | O | 0.0262 | 44.08 | 4.30 | Holoien et al. (2019b) |
| AT2019azh/ASASSN-19dj | ASASSN | O | 0.0222 | 44.50 | 4.51 | van Velzen et al. (2020a) |
| AT2019bhf/ZTF19aakswrb | ZTF | O | 0.1206 | 43.91 | 4.27 | van Velzen et al. (2020a) |
| AT2019cho/ZTF19aakiwze | ZTF | O | 0.193 | 43.98 | 4.19 | van Velzen et al. (2020a) |
| AT2019dsg/ZTF19aapreis | ZTF | O | 0.0512 | 44.26 | 4.59 | van Velzen et al. (2020a) |
| AT2019ehz/Gaia19bpt | Gaia | O | 0.074 | 44.03 | 4.34 | van Velzen et al. (2020a) |
| AT2019eve/ZTF19aatylnl | ZTF | O | 0.0813 | 43.14 | 4.06 | van Velzen et al. (2020a) |
| AT2019lwu/ZTF19abidbya | ZTF | O | 0.117 | 43.60 | 4.14 | van Velzen et al. (2020a) |
| AT2019meg/ZTF19abhhjcc | ZTF | O | 0.152 | 44.36 | 4.44 | van Velzen et al. (2020a) |
| AT2019mha/ATLAS19qqu | ATLAS | O | 0.148 | 44.05 | 4.35 | van Velzen et al. (2020a) |
| AT2019qiz/ZTF19abzrhgq | ZTF | O | 0.0151 | 43.44 | 4.27 | van Velzen et al. (2020a) |
aSurvey that first discovered the nuclear transient; bIntegrated blackbody luminosity except for X-ray selected TDEs for which the absorbed luminosity in 0.3-2 keV band is given; b Publication in which the luminosity and temperature were used.
3 OBSERVED PROPERTIES
It is now possible, with the growing census of observed TDEs listed above, to compare them in detail to the theoretical expectations for emission from TDEs, and attempt to extract the physical parameters of the events, including black hole mass and stellar type. As we will see in the following sections, however, there are many discrepancies between the observations and the basic predictions for emission from an accreting debris disk, requiring important modifications to the simplest emission models.
3.1 Light Curves
The tidal disruption of a star occurs when it approaches the distance from the black hole at which the tidal forces exceed the self gravity of the star,
| (1) |
resulting in a tidal disruption radius,
| (2) |
where , and depends weakly on the structure of the star (Phinney, 1989; Evans & Kochanek, 1989). After disruption, the stellar debris will have a spread of specific binding energy,
| (3) |
such that half the mass will be gravitationally bound to the black hole () and thus available to be accreted. The fallback timescale (), the characteristic minimum timescale in a TDE, is defined as the orbital period of the most bound debris,
| (4) |
The fact that scales with the square-root of the black hole mass, implies that the timing of TDE flares should in principle be used to yield information on the mass of the central black hole. Another fundamental property of the fallback of the debris streams, is that if their specific energy distribution is uniform, i.e. dE/dM = 0, then the rate at which material returns to pericenter can be derived as:
| (5) |
and follows a power-law, . In the case of a partial disruption, a steeper power-law decline is expected, (Coughlin & Nixon, 2019). In addition, the internal structure (Ramirez-Ruiz & Rosswog, 2009; Guillochon & Ramirez-Ruiz, 2013; Golightly, Nixon & Coughlin, 2019) and spin (Golightly, Coughlin & Nixon, 2019) of the star, as well as the spin of the black hole (Kesden, 2012a; Gafton & Rosswog, 2019) and the impact parameter of the star’s orbit (Gafton & Rosswog, 2019), will have an imprint on the energy distribution of the debris, and thus the fallback rate.
One of the most remarkable observed characteristics of TDEs is that at face value, they do appear to have a light curve that follows the general shape of the theoretical TDE fallback rate. In fact, when one fits a power law to the light curve on its decline from peak, there is a strong correlation with the time of peak since the inferred time of disruption, ), and the estimated black hole mass, where , as would be expected for the fallback timescale (van Velzen et al., 2019, 2020b).
However, this good agreement between the optical light curves and the power-law of the fallback accretion rate is actually not entirely consistent with the theory. For emission from a geometrically thin, and optically thick accretion disk, one would expect a gradual cooling over time with the declining accretion rate, since . Thus for optical emission, which is on the Rayleigh Jeans tail of the hot blackbody emission characteristic of TDEs, (Lodato & Rossi, 2011), and one expects a shallower power-law in the optical bands. Furthermore, there does not appear to be a strong correlation between the rise-time to peak with black hole mass (van Velzen et al., 2020a), as one would expect if it was following the fallback rate. Regardless, the fact that the observed light curve decline follows the fallback rate is still somewhat of a surprise, given that this assumes that the accretion rate is equivalent to the fallback rate, which allows for no time delay for the debris streams to shock and circularize into an accretion disk. The physical implication is that either that accretion does proceed promptly, or that we are seeing emission from a process not related to the accretion disk, potentially from the debris stream collisions themselves. One of the important ways to distinguish between these scenarios is by looking at the evolution of the soft X-ray emission in these events, which are a more direct tracer of the accretion flow near the central black hole, and are discussed in more detail in §4.2.
3.2 Peak Luminosities and Characteristic Temperatures
The peak fallback rate, , will result in a range of Eddington ratios, depending on the central black hole mass and the fraction of gas expelled in an outflow (),
| (6) |
where erg s-1. This presents the possibility that the “mode” of the accretion flow will be vastly different for black holes of different mass, with black holes less than in the super-Eddington regime, and above in the sub-Eddington regime (Strubbe & Quataert, 2009; Lodato & Rossi, 2011; Metzger & Stone, 2016). This Eddington limit should imprint itself on the TDE luminosity function, if non-axisymmetric effects are not dominant. The estimation of the Eddington ratio requires a measurement of the central black hole mass. For the two dozen TDEs with host galaxy velocity dispersion measurements used to estimate , the inferred Eddington ratios appear to be clustered between for the UV/optical component, and with a much larger range for the soft X-ray component, with , during peak (Wevers et al., 2019). However, given the dramatic variability observed in X-rays from TDEs, as discussed in §3.8, there could be many factors contributing to the low Eddington ratios of the X-ray component in some cases, including due to the presence of obscuration, delayed accretion, and non-isotropic emission.
By combining the observed luminosities, with the flux limits of the individual surveys, van Velzen (2018) calculated a luminosity function for TDEs fitted by power-law, , with no correlation with black hole mass, as would be expected for Eddington-limited accretion. However, van Velzen (2018) explain this as a potential result of the sensitivity of to . Since (see Equation 6), then for an initial mass function of stars, where , where , then one would expect a steep decrease of the event rate with peak luminosity. However, there may be other effects on the peak luminosity, such as photon trapping in a radiatively driven wind, which we will address in Section 4.3.
3.3 Spectral Classes
The first definitive detection of transient line emission from a TDE was reported for PS1-10jh (Gezari et al., 2012). This TDE was selected as a UV-bright, optically blue nuclear flare in a galaxy with an unknown redshift. It’s spectrum, taken 3 weeks before its peak actually delayed the classification of the event as a TDE, because on top of the very blue continuum, only a single strong broad emission line was detected, and assumed to be Mg II 2798, a line seen in isolation in the optical spectra of higher redshift quasars () for which the H line has been redshifted out of the optical band. It was not until the flare faded enough for the absorption features of the host galaxy to emerge at , that the broad-line detected in the spectrum was identified as He II 4686, a line actually predicted by Ulmer (1999) to be a signature of the hot photoionizing continuum in a TDE. In fact, transient, broad He II emission had been detected in a Seyfert galaxy NGC 5548, and interpreted as the accretion of new material at small distances from the black hole, potentially from the tidal disruption of a star (Peterson & Ferland, 1986).
While the detection of He II fit into the expectations of a TDE spectrum, the complete lack of any hydrogen features was very surprising, but also confirmed that the gas being photoionized by the event was not ambient gas from the interstellar medium (ISM), but originated from the stellar debris itself. The high He II/H ratio was explained either a as a signature of helium-rich gas from the tidal disruption of a stripped star (Gezari et al., 2012; Bogdanović, Cheng & Amaro-Seoane, 2014), or the result of suppression of hydrogen line emission due to optically-thick reprocessing (Roth et al., 2016). Soon after, archival detections of three new optical TDE candidates were reported by the Palomar Transient Factory (PTF) survey, the one for which they had the best sampled light curve, PTF09ge, also showed only broad He II line emission in its spectrum (Arcavi et al., 2014)! However, two of the PTF TDE candidates showed only broad H Balmer-line emission, and the first TDE from the ASAS-SN survey, ASASSN-14ae (Holoien et al., 2014) showed both H and He II features, leading Arcavi et al. (2014) to suggest a continuum of spectral types, from H-dominated to intermediate H+He to He-dominated spectra.
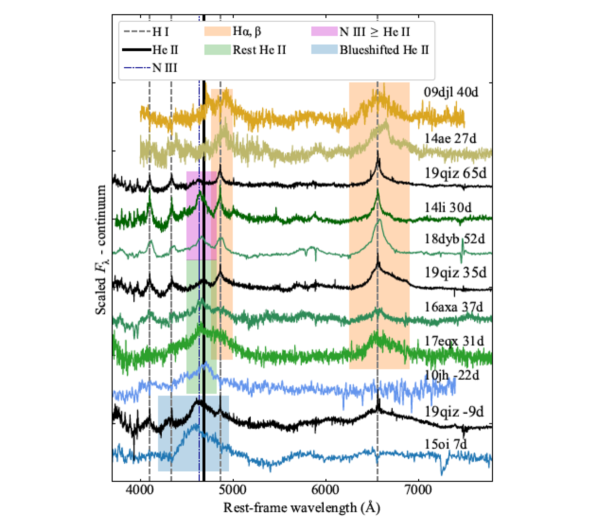
This continuum of spectral classes became more complex with the identification of Bowen fluorescence metal lines of O III3760 and N III 4100 and 4640 in the ”intermediate” H+He spectral type-TDEs iPTF15af (Blagorodnova et al., 2019), and in ASASSN-14li, iPTF16axa, and AT2018dyb/ASASSN-18bg (Leloudas et al., 2019; Holoien et al., 2020). Interestingly, despite these lines being expected in systems with strong UV radiation (Å), Bowen flourescence lines had only recently been detected in AGN spectra in a new class of flaring AGN by Trakhtenbrot et al. (2019). This trend was further strengthened by the detection of these O III/N III features in all of the H+He TDEs from the ZTF survey (7 classified as TDE-H+He), with the remaining TDEs having either only broad H features (9 classified as TDE-H) or broad He II features (1 classified as TDE-He) (van Velzen et al., 2020a). Indeed, He II4686 is expected to accompany Bowen lines, since the Bowen fluorescence mechanism is triggered by the ionization and recombination of He II (Leloudas et al., 2019), which excites transitions in N and O with similar energies to that of the He II Ly photons (Bowen, 1935). However, Leloudas et al. (2019) note that not all TDEs with strong He II lines exhibit the Bowen fluorescence lines, suggesting that they do not all have the optimal physical conditions for strong resonance to happen. However, in fact, in the ZTF TDE sample, all TDEs with H and He II lines also show Bowen features, while it is only the spectra with He II only spectra that do not have Bowen features.
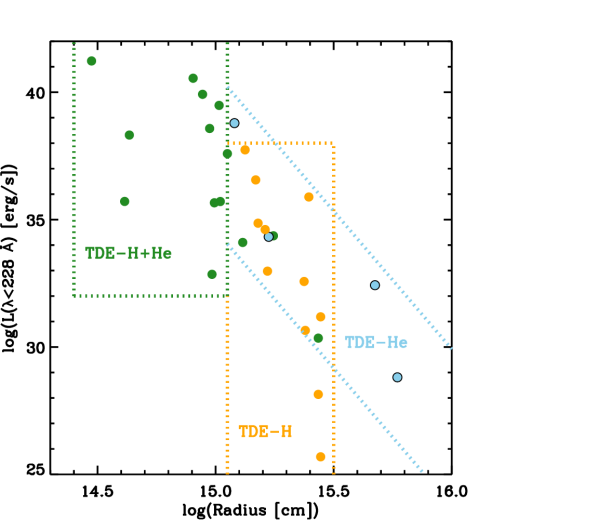
van Velzen et al. (2020a) presented a suggestive trend that spectral type correlates with the radius and temperature of the UV/optical photosphere, with TDE-Bowen spectra coming from smaller radii (i.e. a more compact region) and higher temperatures than the H-rich spectra, both physical conditions more conducive to powering Bowen fluorescence. In Figure 5 I plot the luminosity below 228 Å vs. radius for the optically selected TDEs as a function of their spectral class. It is clear that the TDE-H+He class (including Bowen line features) prefer higher EUV luminosities and compact radii compared to the TDE-H class, while the TDE-He class show a range of conditions. Another important clue is the relative rates of the spectral types. Note that among the 17 TDEs in the Year 1.5 ZTF TDE sample, only one was He-only! Given that the galaxy host properties and flare properties do not stand out for this one object, AT2018iih/ATLAS18yzs, it may be indicating that it was the disrupted star’s properties that were unique (i.e. He-rich). However, a simple picture connecting spectral class with TDE parameters is complicated further by the detection of a TDE by Pan-STARRS, AT2017eqx/PS17dhz, that transitioned over a timescale of 100 days from H-dominated to He-dominated, with the He II line blueshifted by 5000 km s-1 (Nicholl et al., 2019). Nicholl et al. (2019) explain this spectral transformation as due to a contracting atmosphere, eventually revealing a wind in the polar direction. The contracting atmosphere is needed to suppress H emission at late times, which is expected in the Roth et al. (2016) model for optically thick atmosphere’s with a certain radius.
In Wevers et al. (2019), they noted the emergence of Fe II lines in AT2018fyk/ASASSN-18ul and ASASSN-15oi, signaling the presence of low-ionization lines from of optically thick, dense gas. Furthermore, they argued that since the Fe II complex is visible during a secondary maximum in the UV/optical light curve of AT2018fyk/ASASSN-18ul, perhaps both the low-ionization lines and the UV/optical plateau are a result of reprocessing of the soft X-ray radiation into the UV/optical wavebands.
3.4 Line Profiles
The profiles of TDE emission lines are very broad ( km s-1 (Arcavi et al., 2014; Hung et al., 2017; Holoien et al., 2019a), and in some cases with double-peaked, boxy, and/or blue-shifted structures. Such large velocities are expected in a TDE. If one assumes that the lines are broadened by Doppler broadening of the gas in the gravitational potential of the central black hole, then one can translate the velocity width of the line to a radius in gravitational radii, (Brown et al., 2017). Specifically, the velocity at the tidal radius is expected to be km s-1, where is the average density of the disrupted star (Arcavi et al., 2014). The unbound tidal debris streams have a lower characteristic velocity, with the most energetic bound material being ejected at speeds of km s-1 (Strubbe & Quataert, 2009), and should have a narrow profile due to the small velocity dispersion in the tidal tail of unbound debris (Bogdanović et al., 2004).
PTF-09dj (Arcavi et al., 2014) was the first TDE to be fitted by a double-peaked profile to its very broad H line, albeit the circular Keplerian disk model fit required an extra redshift of 15,000 km s-1 to match the wavelengths of the red and blue peaks, and a better fit was achieved, without a bulk redshift, with an elliptical disk, with a large disk inclination, and a pericenter orientation nearly vertical to the observer (Liu et al., 2017). Furthermore, Cao et al. (2018) argue that even single-peaked broad line profiles in TDEs can be fitted using extremely eccentric disk models with a pericenter position nearly pointing towards the observer and a low disk inclination.
The double-peaked profile of the H line in PS18kh was modeled by Holoien et al. (2019a) with an elliptical disk with an eccentricity of . However, Hung et al. (2019) favored an expanding spherical outflow model with a flat-topped shape to fit the line profile, because of the identification of narrow absorption features in the broad H line that were mimicking a double-peaked profile. The most extreme case for a double-peaked line profile is that observed in the Balmer lines of AT2018hyz/ASASSN-18zj, which are well fitted with a circular disk model in some epochs, but with evolution in the line profile that requires an additional variable Gaussian broad-line component (Short et al., 2020; Hung et al., 2020). The flat Balmer decrement observed in this source (H/H) was also argued to be the signature of collisional excitation of the line emission, possibly in the chromosphere of the disk.
One model prediction is that in the presence of an optically thick wind, the lines should be broadened due to electron scattering out of the photosphere (Roth & Kasen, 2018). Indeed, an observed trend for the broad TDE lines is that they decrease in line-width with time. Holoien et al. (2016b) noted that this is the opposite as expected from reverberation of a fading continuum. In an AGN, the line-width is determined by the kinematics of the broad-line gas. Thus, as the continuum fades, you would expect broader lines due to the decreasing radius, and thus higher gas velocities, for which the virialized gas around the black hole was photoionized. If instead, line width is set by electron scattering, then the evolution of the line width depends on the evolution of the optical depth of the scattering medium. In the unified TDE model presented by Dai et al. (2018), due to the wind launched by the super-Eddington accreting debris disk, the optical depth to electron scattering is viewing angle dependent, increasing from the poles to the plane of the disk. Disentangling these effects is critical for using the line shapes to extract the geometry and kinematics of the photoionized gas.
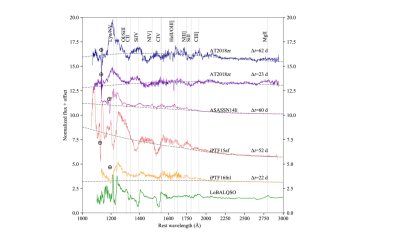
3.5 UV Spectroscopy
UV spectroscopy is a precious resource, since it requires observations from space to evade absorption from the Earth’s atmosphere. The HST/STIS instrument has played an important role in revealing the spectroscopic properties of TDEs in the UV. As of now, there are only 4 TDEs with UV spectra (Figure 6), ASASSN-14li (Cenko et al., 2016), iPTF-16fnl (Brown et al., 2018), iPTF-15af (Blagorodnova et al., 2019), and AT2018zr/PS18kh (Hung et al., 2019). They are characterized by a hot, continuum, and strong, broad UV-resonance lines, in emission and sometimes absorption, including Ly, N V , Si IV , and C IV . They have many spectral features in common with the broad absorption line quasar (BALQSOs), but are notable for the higher strength of nitrogen features relative to carbon, and the relative weakness of C III] , and Mg II , similar to the rare class of ”Nitrogen-rich QSOs”.
Interestingly, Yang et al. (2017) argue that given that C and N are co-located in the same photoionization zone, their ratio is not as sensitive to photoinization conditions (density fo the gas or shape of the photoionizing continuum), but rather their relative chemical abundances. The measured abundance ratios measured for nitrogen to carbon from UV lines of C III] 1908/N III] , indicate N-enriched material. Indeed, Kochanek (2016) argue that the disrupted star’s mass and evolutionary state on the main-sequence will be imprinted on the TDE spectrum, including the enhancement of He, and the rapid enhancement of N and the depletion of C in the CNO cycle for stars more massive than .
Recently, Parkinson et al. (2020) came up with a unification scheme for TDE UV spectra using a Monte Carlo ionization and radiative transfer code, in which the lines are produced in a biconical accretion disk wind, and broad absorption lines are produced for sight lines into the wind cone, and broad emission lines are produced otherwise. This model successfully reproduces the diversity of UV spectra shown in Figure 6, including the suppression of C IV relative to N V due to CNO-processed chemical abundances of the stellar debris.
3.6 Infrared Dust Echoes
In the presence of dust, the UV-bright flare of a TDE will be absorbed and re-emitting in the mid-infrared, producing a luminous ”echo” (Lu, Kumar & Evans, 2016). Indeed, archival searches of Wide-field Infrared Survey Explorer (WISE) data revealed luminous, delayed mid-infrared (MIR) flares from three TDEs, including ASASSN-14li (van Velzen et al., 2016; Jiang et al., 2016), PS16dtm (Jiang et al., 2017), and OGLE17aaj (Yang et al., 2019). In a study of quiescent galaxies with variable MIR emission measured by WISE, there were 14 candidates for long-term fading that could be attributed to a TDE (Wang et al., 2018). The detection of increased Fe II emission in several of the TDEs with dust echoes was explained by Fe released into the gas phase from dust grains by UV photons, providing direct evidence for dust sublimation by the TDE flare (Jiang et al., 2019).
One of the advantages of detecting a dust echo, is that the luminosity in the MIR can be used as a bolometer, to determine the total luminosity emitted by the TDE, even without direct access to the unobservable portions of the SED, such as the EUV, where the bulk of the TDE emission is expected to be emitted. van Velzen et al. (2016) show that from the estimation of the dust reprocessing shell, , assuming it has the size of the sublimation radius, it will have a radius of
| (7) |
where erg s-1 is the luminosity of the flare, m, where is the size of the dust grains, and K. Thus from measuring the dust temperature from the MIR colors, and inferring the radius from the time delay of the dust echo with respect with the TDE flare, where (Jiang et al., 2016), one can infer the peak luminosity over all frequencies where dust absorbs radiation from the TDE. Then the covering factor of the dust can be determined from the ratio of the total energy radiated by the dust in the MIR by the energy absorbed by the dust, . One interesting trend is that appears to be quite low for TDEs, (van Velzen et al., 2016). This is much smaller than the covering fraction inferred from MIR flares from changing-look AGN (CLAGN). CLAGN are AGN which transform in spectral type, broad-line (Type 1) to narrow-line (Type 2), and vice versa, accompanied by a luminous flare of continuum radiation. CLAGN are expected to have a pre-existing dusty torus, and thus their characteristic higher values of could be a potential discriminator between TDEs vs. CLAGN for the source of the flaring continuum radiation (Frederick et al., 2019).
3.7 Coronal-line Emitters
Another manifestation of a TDE is line emission powered by gas in the vicinity of the black hole that is photoionized by the flare of radiation from the TDE. The class of ”extreme coronal-line emitters” (ECLEs), galaxies with transient, fading narrow-line emission of [Fe VII], and coronal lines from [Fe X] to [Fe XIV], and in some cases broad recombination lines of H, H, and He II , have been argued to be the result of photoionization by a TDE (Komossa et al., 2008; Wang et al., 2012; Yang et al., 2013). Dou et al. (2016) also found fading mid-infrared emission associated with these coronal-line emitter TDE candidates, further evidence that these were powered by TDEs in a gas-rich environment. In fact, in Palaversa et al. (2016), they were able to recover the nuclear flare that powered the high-ionization lines in one of the ECLEs from archival LINEAR optical monitoring data, as well as follow-up Swift observations of archival GALEX UV detection, which confirmed the fading of the UV emission after the flare. In general, ECLE’s allow us to probe the effects of TDEs on much longer timescales than the accretion event itself, thanks to light travel time delays as the flare propagates through a gas-rich circumnuclear medium (Wang et al., 2012). Future, massively multiplexed fiber spectrographic surveys could yield a large population of ECLEs, and place a valuable, independent constraint on the TDE rate.
3.8 X-rays
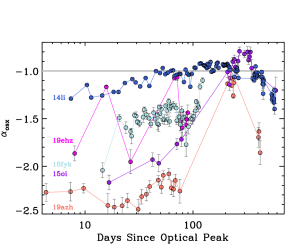
There are now 12 UV/optically-selected TDEs which have been detected in the soft X-rays: GALEX D3-13, GALEX D1-9, ASASSN-14li, ASASSN-15oi, AT2018zr/PS18kh, AT2018hyz/ASASSN-18zj, AT2019azh/ASASSN-19dj, AT2019dst/ZTF19aapreis, AT2019ehz/Gaia19bpt, AT2018fyk/ASASSN-18ul, and OGLE16aaa. While the spectral properties of the soft X-ray component in these TDEs share the same characteristics of the soft X-ray selected TDEs: an extremely soft spectrum well fitted by blackbody temperatures that range from keV (see Figure 2), the relative brightness of this component compared to the UV/optical component can range from 1 to 103 (Gezari, Cenko & Arcavi, 2017; Wevers et al., 2019; van Velzen et al., 2019, 2020a), and also shows dramatic variability with time, that is unlike the smoothly evolving power-law decline of the UV/optical flare, and is often completely uncorrelated. Understanding what is driving the wide range and variability of the optical to X-ray ratio in TDEs may be the most revealing diagnostic for what is powering these two components: accretion, reprocessing, or stream-stream collisions.
In the case of ASASSN-15oi (Gezari, Cenko & Arcavi, 2017; Holoien et al., 2018) and AT2019azh/ASASSN-19dj (Liu et al., 2019; van Velzen et al., 2020a) there was a gradual brightening in the soft X-rays over a timescale of a year, which the UV/optical component was declining from peak. In the case of AT2018fyk/ASASSN-18ul, the TDE is detected in the soft X-rays at early times, but with a factor of variability on the timescale of days, and then shows brightening at late times, but then shows a dramatic brightening by a factor of 10 in just 6 days, 3 months after the peak of the flare, resulting in a rapid decrease in the optical to X-ray ratio (Wevers et al., 2019). OGLE16aaa (Kajava et al., 2020) showed the rapid appearance of soft X-rays 6 months after the optical peak, followed by a decline to a lower, steady-state soft X-ray flux over the next year.
In order to characterize the relative strength of the UV/optical and soft X-ray components, I use commonly used definition of for characterizing the SEDs of AGN, but modify it to measure the ratio of the monochromatic luminosity density at to 0.5 keV, instead of 2 keV, since most of the TDEs show such soft spectra, that they are not detected above 1 keV. I use the unabsorbed X-ray luminosity density corrected for the Galactic HI column density, and the UV luminosity for the Galactic extinction. Thus I define,
| (8) |
In the case where , one gets . In AGN, there is an anti-correlation between and (Maoz, 2007), although in this case is measured at 2 keV, and is comparing the relative strength of UV emission from the ”big blue bump” associated with thermal emission from the accretion disk, and non-thermal hard X-ray emission associated with the AGN ”corona”. It can be seen in the 5 TDEs with well-sampled UV and soft X-ray light curves from Swift follow-up observations in Figure 7, that there is strong variability in of the TDEs, with a general trend of increasing with time, suggestively peaking near . In the case of AT2019ehz/Gaia19bpt, the soft X-ray flux appears to flare by a factor on timescales of just a few days, with during each flare (van Velzen et al., 2020a). In the case of ASASSN-15oi and AT2019azh/ASASSN-19dj, the soft X-ray flux increases by a factor over 200 days, with increasing from to , but with no evidence of a change in absorbing column density, and no significant evolution in temperature (Gezari, Cenko & Arcavi, 2017; Hinkle et al., 2020a). AT2018fyk/ASASSN-18ul showed variability of a factor of on the timescale of days, and then, 100 days after peak, brightens by a factor of 10 in less than a week (Wevers et al., 2019), approaching close to , but again with no evidence of a change in line-of-sight absorption.
Understanding what is driving this variability on both short ( day) and long ( yr) timescales is critical for determining if variable obscuration and/or delayed accretion is determining the optical to soft X-ray flux ratio. Already, the lack of an obvious decrease in line-of-sight column density with increasing soft X-ray luminosity is problematic for the obscuration scenario. However, it may be that if the opacity is dominated by electron scattering by a highly ionized medium (Dai et al., 2018), then the soft X-rays can be obscured without changing the observed spectral slope as is the case for absorption by neutral gas.
3.9 Evidence for Jets and Outflows
One of the biggest surprises in TDE observations was the discovery of a class of “relativistic” TDEs, whose luminous, non-thermal radiation was explained as viewing a jet face on that was launched by a TDE. In retrospect, this class of TDE is a natural extension of the “blazar” class for AGN, and the impact of jets on the radiation from TDEs had already been discussed in the literature in the context of jets interacting with the circumnuclear medium. The detection of such radio emission was not actualized until the low-redshift optically selected TDE ASASSN-14li. For the first time, a multiwavelength campaign was able to detect several components of emission from this TDE across the electromagnetic spectrum, including transient radio emission.
The radio emission from ASASSN-14li was interpreted as synchrotron emission from either external shocks driven by the interaction of a non-relativistic outflow (Alexander et al., 2016), the unbound debris streams (Krolik et al., 2016), or a relativistic jet (van Velzen et al., 2016) with the circumnuclear medium, or from internal shocks in a relativistic jet (Pasham & van Velzen, 2018). However, the detection of a correlation between the X-ray and radio light curves, with , suggests that the accretion and jet power are linearly coupled (Pasham & van Velzen, 2018). This follows from the fact that the synchrotron luminosity from a power-law distribution of electrons with index in the radio scales with the jet power () as . Thus for and , where one gets . Pasham & van Velzen (2018) also observe a time lag between soft X-ray and the radio of 12 days, which is self-consistent with their model for a freely expanding canonical jet. The strong coupling between the accretion rate and jet power strongly favor the internal jet model over an external emission mechanism (Pasham & van Velzen, 2018; Bright et al., 2018).
Radio emission has also been detected from XMMSL1 J0740-85(Alexander et al., 2017) and AT2019dsg (Stein et al., 2020), suggesting that radio follow-up observations, or even radio blind-searches for transient radio emission (Anderson et al., 2019), can place important constraints on the nature and frequency of jets and outflows in TDEs. Already one can infer from radio follow-up that high radio-luminosity, relativistic jets similar to Sw J1644+57 must occur in only 1% of TDEs (Alexander et al., 2020).
The super-Eddington accretion rates in TDEs make them especially conducive to launching an outflow. This outflow could manifest itself as bright optical emission from the reprocessing of higher energy emission from the accretion disk (Strubbe & Quataert, 2009; Lodato & Rossi, 2011; Metzger & Stone, 2016), or in the form of absorption lines, particularly in the UV Strubbe & Quataert (2011). Highly ionized outflows have now been detected from spectra in the X-rays from ASASSN-14li (Miller, 2015; Kara et al., 2018), and in the UV from ASASSN-14li (Cenko et al., 2016), iPTF16fnl (Brown et al., 2018), iPTF15af (Blagorodnova et al., 2019), and AT2018zr/PS18kh (Hung et al., 2019), with a wide range of velocities, sometimes blue-shifted and sometimes red-shifted, reflecting a diverse set of physical conditions in the outflow in terms of their geometry, kinematics, and optical depth (Hung et al., 2019). Progress in mapping the UV spectra of TDEs to the geometry and orientation of the accretion disk wind is critical for testing models in which the optical-to-X-ray ratio is determined by the inclination angle to a radiatively-driven wind (Dai et al., 2018). In general, understanding the radiation, winds, and jets from TDE accretion disks give important insight to the feedback mechanisms of AGN in general.
4 TENSIONS BETWEEN OBSERVATIONS AND TDE THEORY
4.1 Large Inferred Radii
One of the common properties of both X-ray and UV/optically selected TDEs is the thermal nature of their continuum. This is expected for the continuum from the circularized, accreting debris disk. Following the classical relations for an optically, thick, geometrically, thin accretion disk. one expects a peak effective temperature of (Miller, 2015):
| (9) |
where is the opacity due to electron scattering. Both components are well described by a blackbody, albeit with a factor of difference in temperature. The first TDE candidates, discovered in the soft X-rays by the ROSAT survey, initially were puzzling due to their relatively small inferred radii, using the simple relation for a blackbody, , even smaller than the Schwarzschild radius of the central black hole. However, the next generation of TDE candidates, discovered in UV and optical surveys, had the opposite problem. Their inferred radii were too large compared to the expectations of the size of the circularized debris disk, with . These disagreements with the basic theoretical predictions of accretion powered emission from a circularized debris disk has necessitated the development of more complex theories, involving a reprocessing envelope (Loeb & Ulmer, 1997; Guillochon, Manukian & Ramirez-Ruiz, 2014), electron scattering (Li, Narayan & Menou, 2002), stream-stream collisions (Piran et al., 2015; Jiang et al., 2016), and radiatively driven winds (Metzger & Stone, 2016).
In Figure 8 I show the radius of the observed blackbody emission in the 49/56 of the TDEs in Table 1 with a black hole mass inferred from the host galaxy mass measured from the broadband SED for 10 of the X-ray TDE hosts (Graur et al., 2018; Wevers et al., 2019; French et al., 2020) and 39 of the UV/optical TDE hosts (van Velzen, 2018; van Velzen et al., 2020a), to estimate . I use the correlation between the total galaxy mass () and measured from dynamical masses of early and late-type galaxies from Greene, Strader & Ho (2020), , with an intrinsic scatter of 0.79 dex. This relation is most relevant for estimating for the TDE hosts since it is based on the total galaxy mass, and thus does not require knowledge of the bulge-to-total ratio, which is not well measured for most of the host galaxies. However, the relation is based on only 5 galaxies below with dynamical BH masses, and there appears to be two different normalizations between the early type and late-type galaxies. The versus relation has a smaller scatter (0.53 dex) and does not have this difference in normalization between the galaxy types. Thus, continued high spectral resolution follow-up of TDE galaxy hosts is critical for the best constraints on .
On this plot are also the expectations for the various characteristic size scales for a TDE as a function of , including, , and
| (10) |
circularization radius due to angular momentum conservation, where is the initial eccentricity and is the pericenter of the star’s orbit.
| (11) |
self-intersection radius from Dai, McKinney & Miller (2015), where is the eccentricity of the orbit of the most bound debris, and is the angle of apsidal precession, and is the semi-major axis of the most bound debris (Dai, McKinney & Miller, 2015; Bonnerot et al., 2016).
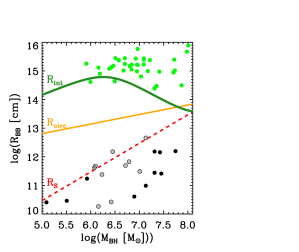
It is clear that the characteristic radii of the UV/optical thermal component in TDEs are much larger than expected for a debris disk formed from the circularized debris streams, and that the soft X-ray thermal component in TDEs is often even smaller than the size of the event horizon of the black hole (). Both of these situations are problematic, and require an expansion of the simplest TDE models. Interestingly, the UV/optical component is close to the size of the self-intersection radius of the debris streams, as pointed out by Wevers et al. (2019). An important consideration is also whether or not the UV/optical component is powered by reprocessing of the soft X-ray component, or is in fact a source of emission generated from the shock interaction of the debris streams themselves. In the following section, we examine the relative behavior of these two components in order to determine their origin.
4.2 Large Optical to X-ray Ratio, and its Evolution With Time
One of the most intriguing questions in TDE observations is why are many optically selected TDEs faint in the X-rays, and what is driving the X-ray variability observed in several optically selected TDEs. The main explanation for the high optical-to-X-ray ratio in TDEs has been either a) obscuration or b) delayed accretion. In the case of an optically thick wind, the material is initially opaque to X-rays due to electron scattering. It is not until the ejecta expands, and becomes completely ionized by the inner disk radiation after that the soft X-rays can escape (Metzger & Stone, 2016), implying that for the largest black holes, , and the X-ray radiation escapes promptly, resulting in an ”X-ray luminous” TDE. However, viewing angle effects may come into play if the geometry of the accretion flow allows for some lines of sight out of the wind and directly towards the inner accretion disk (Dai et al., 2018).
Another nice outcome of this model, is that the radiation diffused through the wind results in an effective temperature of,
| (12) |
and provides a potential explanation for the observed temperature of the UV/optical component in TDEs, but not their relatively constant temperature with time, with several TDEs showing an increase in temperature with time (van Velzen et al., 2020a; Hinkle et al., 2020b), challenging these models even further. However, this model’s prediction for a cooling of the temperature with time does not take into account the fact that as the material expands, and becomes optically thin, the photosphere will recede to deeper layers, resulting in a slower evolution of .
However, there are more complications. This model assumes that the material circularizes and forms an accretion disk with . In fact this process depends sensitively on the central black hole mass. In several numerical and analytical studies, most recently by Bonnerot & Lu (2020), it is the smaller mass black holes for which the circularization timescale is quite long (Bonnerot et al., 2016),
| (13) |
and this was dubbed a ”Dark Year for Tidal Disruptions” by Guillochon & Ramirez-Ruiz (2015). The smaller black holes also result in stream-stream collisions further from the black hole, resulting in longer viscous timescales, since the debris that accretes onto the black hole from that self-intersection point is subject to the viscous timescale at that distance:
| (14) |
where . If then the accretion rate will be ”slowed” with respect to the fallback rate, also resulting in a reduced peak luminosity.
An alternative model to explaining the weak X-ray luminosity at early times in optically-selected TDEs, is that the optical emission is powered locally by shock heating from stream-stream collisions near apocenter, which thermalizes, and diffuses out through the infalling matter with an intrinsic temperature of
| (15) |
thereby matching the observed temperature of the UV/optical component in TDEs, without requiring the reprocessing of soft X-radiation from an accretion flow. In this model the UV/optical emission and the soft X-ray emission are completely decoupled, and one could explain the late-time brightening of the soft X-ray emission in some TDEs as delayed accretion in a circularizing debris disk. There already is some evidence for a black hole mass dependence on the emergence of a late-time UV plateau in optically selected TDEs, explained as delayed emission from a viscously spreading accretion disk in the TDEs with lower mass black holes () (van Velzen et al., 2019). This result important in that it also implies that the prompt UV/optical component of these TDEs is not powered by accretion!
4.3 Correlations (or Lack Thereof) with Central Black Hole Mass
One of the robust predictions of TDE theory, is that there should be a maximum central black hole mass, above which a star will cross the event horizon before being disrupted, i.e., , which occurs for
| (16) |
where and . van Velzen (2018) showed that indeed the luminosity function of TDEs as a function of black hole mass (measured from the host galaxy bulge velocity dispersion) did show an intrinsic cut-off at , and argued this as clear evidence for the black hole event horizon. The one exception to this cut-off was ASASSN-15lh, a TDE candidate (also argued to be a SLSN by Dong et al. (2016)) from the center of a passive red galaxy with an inferred central black hole mass (from the host galaxy stellar mass) of , well above the Hills mass of a non-rotating (Schwarzschild) black hole for a solar-type star. However, a star could be disrupted outside the event horizon for this black hole mass if either it was a maximally spinning (Kerr) black hole, or if the star was massive (). However, given the old stellar population of the host galaxy measured from stellar population synthesis fits to its spectral energy distribution, a spinning black hole was favored (Leloudas et al., 2016).
Furthermore, given that the tidal disruption radius, fallback timescale, and peak mass accretion rate have dependencies on black hole mass, one would expect the properties of the TDE flares to correlate with . Currently, the most stringent constraints on for TDE hosts come from stellar velocity dispersion measurements. Wevers et al. (2019) reported black hole mass estimates for 23 TDE hosts using homogeneous measurements of the flux-weighted central stellar velocity dispersion () from medium resolution ( km s-1), optical long-slit spectra, and found a relatively flat distribution of between , with no significant difference in black hole masses between the optically selected and X-ray selected TDEs.
However, the ultimate goal for TDE observations is to use the properties of the TDE itself to weigh the mass of the central black hole, instead of relying on indirect host galaxy scaling relations. Indeed, Mockler, Guillochon & Ramirez-Ruiz (2019) attempted to do so by fitting multi-band optical light curves with a model based on numerical simulations of the fallback rate () as a function of stellar polytropic index () and impact parameter (), and fitting for an accretion efficiency (), where , and adjusting such that the luminosity cannot exceed the Eddington limit. In order to fit the temperatures and constant colors characteristic of optically-selected TDEs, the model includes the addition of a reprocessing photosphere with a radius that can change with a power-law dependence on the luminosity, and with a minimum and maximum radius set by the innermost stable circular orbit of the black hole () and the semi-major axis of the debris streams (), respectively. Finally, the model also allows for a “viscous delay”, to account for potential delays between the fallback of material, and its subsequent accretion via an accretion disk. This parametric model, fitted with an MCMC routine to find the highest likelihood model parameters with Bayesian statistics (MOSFiT) yields a constraint on and (Mockler, Guillochon & Ramirez-Ruiz, 2019). However, the black hole masses derived from MOSFiT show just a marginal agreement with the black hole masses inferred from the host galaxies’ properties. This is not surprising, since it is not clear yet that the observable parameters of a TDE, such as rise time or peak luminosity, even scale with as expected for a light curve powered solely by fallback accretion.
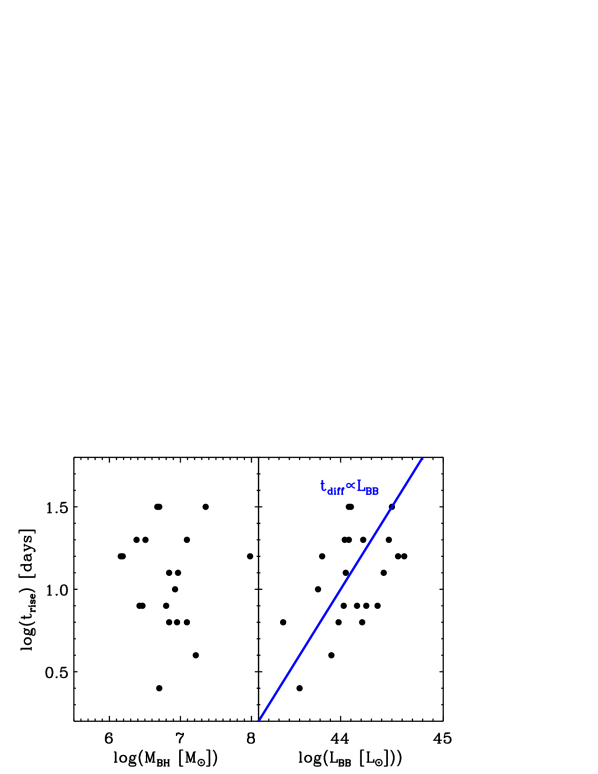
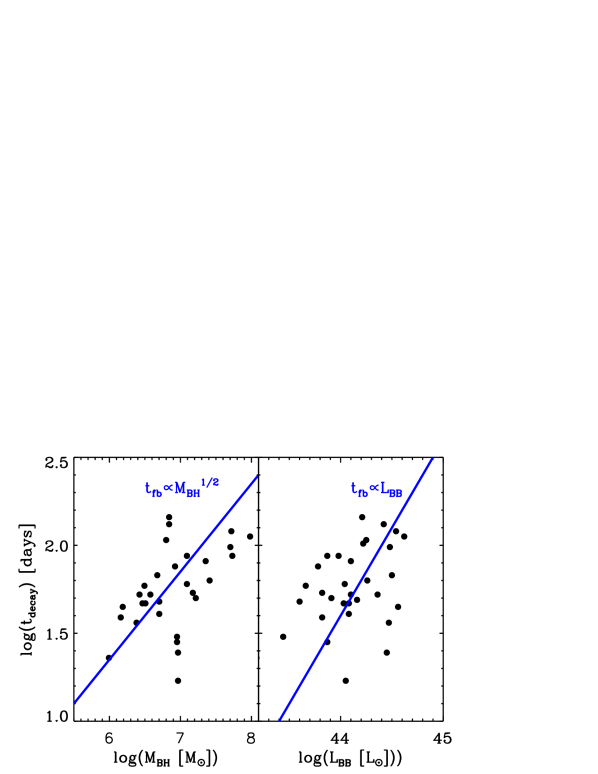
We now have 22 TDEs with pre-peak sampling of their light curves, PS1-10jh (Gezari et al., 2012), PS1-11af (Chornock et al., 2014), PTF09ge (Arcavi et al., 2014), iPTF16fnl (Blagorodnova et al., 2017), 15/17 TDEs in ZTF (van Velzen et al., 2020a), plus AT2018dyb/ASASSN-18pg (Leloudas et al., 2019), AT2018fyk/ASASSN-18ul (Wevers et al., 2019), AT2019ahk/ASASSN-19bt (Holoien et al., 2019b) (see Figure 4 for some examples). This enables us to investigate how their rise time to peak correlates with other TDE parameters and host galaxy properties. In Figure 9 I plot the e-folding rise timescale to the peak luminosity, , and e-folding decay timescale, as measured by van Velzen et al. (2020b), as a function of inferred black hole mass from the host galaxy mass. As found in van Velzen et al. (2020a), there is a correlation between luminosity and rise time, but surprisingly no correlation between rise time and inferred central black hole mass. Interestingly, if the rise time was tracing the fallback time scale, then since and , then one would expect . If instead, the rise time is tracing the radiative diffusion timescale, , which for a spherical distribution of radius and mass , translates to , then if the radius of the photosphere is set by the intersection radius of the debris streams, , and the peak luminosity traces the mass accreted, then one gets , and then one would get the positive correlation between and that is observed. With a similar argument, van Velzen et al. (2020a) explained that the lack of the expected correlation of could be attributed to photon trapping in the presence of an outflow, which will prolong the rise time to peak if , where (Metzger & Stone, 2016), and thus should be a more important effect for less massive black holes.
It has been proposed, that instead of using fits to the TDE light curve, one can simply use the observed temperature and UV/optical luminosity at peak to infer and , if the UV/optical emission is powered by the dissipation of energy by shocks intersecting near the apocenter of the highly eccentric orbits of the stellar debris, where
| (17) |
and assuming a mass-radius relation of (Ryu, Krolik & Piran, 2020). Since the luminosity from the shock in this model scales as , and the temperature scales as , then one gets (Ryu, Krolik & Piran, 2020). Interestingly, this method does provide black hole mass estimates that are in good agreement with the black hole mass estimated from the host galaxy bulge mass. Another piece of evidence in favor of the physical model where stream-stream shocks at are powering the UV/optical component, instead of reprocessing of emission from a more compact, circularized accretion disk with .
Another intriguing signal to probe , which originates from the heart of the accreting black hole in a TDE, is quasi periodic emission from the innermost stable circular orbit () around the black hole. Quasi-periodic oscillations have been reported in two TDEs, in an analysis of the non-thermal hard X-ray light curve of jetted TDE Swift J1644+57 (Reis et al., 2012) ( = 200 sec), and of the soft thermal X-ray light curve of optically-selected TDE ASASSN-14li (Pasham et al., 2019) ( sec). This period corresponds to a radius of , and with a knowledge of the spin parameter , and assuming the emission originates from , since for a=0 to for a maximally spinning (a=0.998) black hole, it can be used to determine .
4.4 Observed Rates: Too Low, Too High, or Just Right?
The expected rate of TDEs in galaxy nuclei has been both analytically and numerically determined from calculations of stellar orbits for galaxies of various stellar density profiles (core vs. cusp) as well as black holes of different configurations (Schwarzschild, Kerr, binary, recoiling). One of the most exciting applications of measuring the TDE rate as a function of galaxy type and black hole mass, is distinguishing between these scenarios. For example, measuring the TDE rate on the low-mass end can shed light on the black hole occupation fraction in low-mass galaxies, a potential discriminator between BH seed formation models (Stone & Metzger, 2016). Measuring the TDE rate on the high-mass end, can probe the spin distribution of MBHs (Kesden, 2012b). However, while the TDE event rate is well determined, predictions for the observed tidal disruption flare rate relies on several assumptions: the peak luminosity, effective temperature, and galaxy central black hole mass. One can take an empirical approach, and start with the observed luminosities, temperatures, and light curves. However, there may be a population of TDEs that the current survey selection techniques are missing, or an error in our assumptions about the black hole mass function which is poorly constrained in low-mass galaxies. Comparing the theoretical rate to the observational rate can thus be quite revealing.
Measuring the TDE rate () per galaxy requires an understanding of each survey’s detection efficiency, , where is the detection efficiency for each TDE detection, effective survey time (), and number of galaxies monitored (), where (van Velzen & Farrar, 2014). In order to calculate , one has to make assumptions about the luminosity and time evolution of TDEs. The first attempts to measure from X-ray and optical survey data resulted in rates of galaxy-1 yr-1 (Donley et al., 2002; Esquej et al., 2008; Gezari et al., 2009; van Velzen & Farrar, 2014; Holoien et al., 2016b), an order of magnitude below the expectations from dynamical models, but were based on the detection of only TDEs in each survey.
This tension with the theoretical expectation of the rate from loss-cone dynamics using realistic stellar density profiles of galaxy-1 yr-1 (Magorrian & Tremaine, 1999; Wang & Merritt, 2004) was initially attributed to selection effects due to insensitivity to faint and fast, or long-timescale TDEs (Kochanek, 2016), conservative candidate filtering for SNe or AGN, our uncertainty in the nature of the optical emission component, which may not be present in all TDEs, or an anisotropic velocity distribution of stellar orbits, with a bias towards tangential velocities that would suppress the TDE rate from two-body relaxation (Stone & Metzger, 2016).
However, with larger samples of TDEs now available, the observed TDE rates appear to be coming into agreement with theoretical expectations. If one is interested in the volumetric rate (), one needs to take into account not the number of galaxies, but the total volume surveyed. Using the ”” method, where , and A is the area of the survey, is the maximum redshift that one could detect the TDE of a given luminosity by the flux limit of the survey, and is the corresponding volume per unit area. Using the value of in bins of luminosity, van Velzen (2018) derived a luminosity function of TDEs from 17 TDEs from the literature, well fitted with a steep power-law of the form,
| (18) |
where erg s-1, Mpc-3 yr-1 and . One can then make a more accurate estimate of the TDE rate per galaxy, by calculating using the observed luminosity function, instead of a constant characteristic luminosity, or a model-dependent luminosity. Indeed, van Velzen (2018) find a per galaxy rate of galaxy-1 yr-1 by using the observed host galaxy stellar mass function from the method, now coming into agreement with theoretical predictions. Similarly, (Hung et al., 2017) derived a TDE rate from the systematic follow-up of iPTF nuclear transients in the UV with Swift, resulting in two TDE detections, and assuming the steep luminosity function from van Velzen (2018) dominated by less luminous flares, resulting in a rate of galaxy-1 yr-1. A recent update to the van Velzen (2018) calculation by van Velzen et al. (2020b), with double the sample of TDEs from adding the most recent influx of optical TDE discoveries in the literature, yields a slightly lower overall rate of galaxy-1 yr-1.
One of the challenges for the next generation of surveys, is how to filter transients down to TDE candidates without making assumptions about their properties that would bias the survey against finding the full population of TDEs. However, despite these challenges, we are finding that the observed TDE rate is in general agreement with dynamical predictions, and with important preferences in the host galaxy types.
4.5 Do TDEs Prefer Post-Starburst Galaxy Hosts? If so, Why?
Given that the TDE rate should be primarily driven by stellar dynamics within the sphere of influence of the central black hole, the rates and properties of TDEs should correlate with host galaxy stellar density and structure. It was surprising, however, when Arcavi et al. (2014) noted that several TDEs were hosted in a rare subclass of galaxies with no active star formation and a bright population of A stars resulting in strong H absorption known as ”E+A” galaxies. This was broadened further by (French, Arcavi & Zabludoff, 2016) to be a preference for quiescent, Balmer strong galaxies, more common than ”E+A” galaxies, but still only making up only % of the local galaxy population, but 75% of the optical TDE hosts known at the time. This puzzling over-representation of TDEs in this rare galaxy type was attributed to several effects, including a recent galaxy merger (potentially yielding a binary SMBH with an enhanced TDE rate,) or a higher concentration of A stars susceptible for disruption.
However, TDE hosts also share other properties, including in colors predominantly in the “green valley” of the mass-color diagram (Law-Smith et al., 2017; van Velzen et al., 2020a; Hammerstein et al., 2020) and high central stellar density (Law-Smith et al., 2017; Graur et al., 2018; Hammerstein et al., 2020), both favorable conditions for stellar disruptions. Using forward modeling techniques, Roth et al. (2020) find that they can explain the lack of ZTF TDE hosts in the blue locus of galaxies in the mass-color diagram from dust obscuration in star-forming galaxies. However, selection effects alone can not explain their over-representation of E+A galaxy hosts. Although, Hammerstein et al. (2020) note that the over-representation of the quiescent, Balmer strong, ”E+A” (HÅ) galaxies dissappears to when selecting from only the green and centrally concentrated galaxy population.
5 FUTURE PROSPECTS
5.1 Improving Search Strategies from the Ground and in Space
While survey capabilities in the optical band have been steadily increasing, and will have a large jump in survey power with the beginning of the Vera Rubin Observatory Legacy Survey of Space and Time (LSST) in just a couple years, our selection strategies for discovering TDEs will still be hampered by intensive filtering of more common interlopers, such as AGN and SNe. One feature of TDEs that has been critical for their confirmation from optical candidates has been their uniform property of bright, persistent UV emission. In Figure 10 I show the UV-optical color vs. their absolute magnitude in the of TDEs measured by Swift follow-up of optically selected TDEs, in comparison to the mean UV properties at the optical peak of SNe Ia measured by Swift (Milne et al., 2013), and by the GALEX satellite for Type II-P SNe (Gezari et al., 2015) and AGN (Gezari et al., 2013).
It is striking how easily the UV-optical color alone can be used to filter our SNe. With a wide-field, UV space telescope, observing concurrently with ground-based optical surveys, one could promptly distinguish TDEs from from SNe, and “clear the fog” of contaminants, without the labor of follow-up spectroscopy, and the potential incompleteness introduced by filtering-down the full transient alert stream.
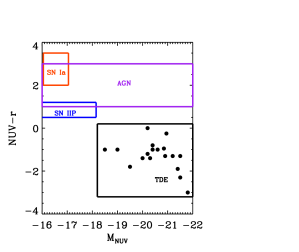
There is still a possibility that searching for TDEs with the UV/optical properties of the optically-selected TDE candidates may miss an entire population of TDEs that are not UV-bright! While X-ray follow-up has been possible for the promptly discovered optical TDEs, there has been much less comprehensive multiwavelength follow-up for the soft X-ray selected TDEs. It may be that the component producing the UV/optical component, whether from stream-stream collisions, reprocessing, or a combination of both, is not present in all TDE systems. A soft X-ray selected TDE sample, with contemporaneous optical monitoring, could address the following important questions:
are optical and X-ray selected TDEs tracing the same population?
what are the parameters that favor optical vs. X-ray emission?
how does the optical and X-ray evolution of the TDEs constrain emission models?
what are the timescales for the formation of an accretion disk in a TDE as a function of its black hole mass?
what is the true TDE rate?
With new X-ray survey capabilities, such as the extended Roengen Survey with an Imaging Telescope Array (eROSITA) on board the Russian-German Spektrum-Roentgen-Gamma (SRG) mission, currently conducting an all-sky X-ray (0.5-2 keV) survey, there should be soon a much larger sample (potentially thousands) of X-ray selected TDEs to shed light on these questions (Khabibullin, Sazonov & Sunyaev, 2014).
An exciting X-ray signal that is predicted, but has yet to be detected, for stars on deep encounters at the moment of pericenter passage, is a ”shock break out” when the shock produced from the tidal compression of the star propagates through and heats the deformed star (Carter & Luminet, 1983; Brassart & Luminet, 2008), resulting in a pulse of X-ray radiation, with a temperature of keV, a duration of order fo the crossing time, s, where is the orbital velocity at periastron, and a luminosity of ergs s-1 (Kobayashi et al., 2004; Yalinewich et al., 2019). The detection of shock breakout would provide a clean time stamp for the time of disruption. Detecting this brief X-ray burst is challenging, however, and requires a combination of wide area and high sensitivity in the X-ray band, potentially achievable with future X-ray telescopes being developed with lobster-eye X-ray optics (Hudec et al., 2017).
5.2 Intermediate Mass Black Holes
One of the most exciting prospects of using TDEs as probes of MBH demographics, is using the detection of the disruption of a white dwarf (WD) as a smoking-gun signature of an intermediate-mass black hole (IMBH), the elusive missing link between MBHs and stellar-mass black holes from the remnants of the evolution of massive stars (see recent review on IMBHs by (Greene, Strader & Ho, 2020)). The reason for this, is that given the high density of a WD, and the fact that the maximum mass for which a star is disrupted outside the event horizon scales as, , WDs can only be disrupted by lower-mass black holes. Assuming typical values of a C/O white dwarf, of and , one gets . Furthermore, given the distinct radii and compositions of C/O WDs from He WDs, formed from the truncated evolution of red giants in a close binary system, one could use the observed TDE spectra to distinguish between them (Law-Smith et al., 2017), and get a more accurate measure of from the timescales of the system.
Indeed, there is at least one candidate for a WD disruption by an IMBH from the detection of [O III] and [N II] narrow-line emission, and no detection of hydrogen Balmer emission lines, from a globular cluster in the Fornax elliptical galaxy NGC 1399, which is also coincident with an ultra-luminous X-ray source (Irwin et al., 2010). The strong oxygen line, and lack of any hydrogen Balmer-line emission, was interpreted as emission from photoionized hydrogen-free gas from a tidally disrupted star around an IMBH powering the X-ray emission via accretion. Although the strong [N III] emission is not predicted from photoionization models for the spectrum from a disrupated CO white dwarf (Clausen & Eracleous, 2011). Unfortunately, there is no optical spectral information about the other IMBH candidate TDE detected by Chandra from a dwarf galaxy (Maksym et al., 2013), which would definitively identify it as a WD disruption and thus require an IMBH.
In general, a WD TDE will be a challenge to detect, since the characteristic timescales for a WD disruption very short, , and the peak luminosities lower, due to the lower Eddington luminosity of the IMBH involved. However, another potential manifestation of a WD disruption is the detonation of thermonuclear runaway from the tidal compression of the WD in a deep encounter with the IMBH, resulting in a supernova-like transient powered by the radioactive decay of iron-group elements from explosive nuclear burning (Brassart & Luminet, 2008; Rosswog, Ramirez-Ruiz & Hix, 2009; Anninos et al., 2018). This would result in a Type Ia supernova-like thermonuclear transient, albeit likely underluminous in comparison, due to the much different geometry and lower ejecta mass involved in the explosion (MacLeod et al., 2016).
5.3 TDEs as Multi-Messenger Sources
5.3.1 Very High Energy Neutrinos
The first multi-messenger observation of a TDE is the IceCube detection of a very high energy (VHE) neutrino in the direction of a radio and X-ray detected optical TDE discovered by ZTF, AT2019dsg/ZTF19aapreis (Stein et al., 2020), establishing TDEs as a potential site for PeV neutrino production. The detected PeV neutrino must have been produced by protons accelerated to high energies ( 4 PeV) that then collided with a photon target (p production) from the thermal TDE continuum, or a proton target (pp production), in the form of the unbound stellar debris or the radio-emitting outflow. No gamma-ray emission was detected by the Fermi-LAT telescope. However, a coincident TeV gamma-ray signal, potentially detectable with gamma-ray Cherenkov telescopes, would confirm a hadronic origin, since the pp production produces a power-law neutrino spectrum, which would be accompanied by a lower-energy gamma rays. Future multi-messenger observations of TDEs in PeV neutrinos, TeV neutrinos, and gamma rays, can distinguish between these neutrino production mechanisms, and be used to model the contribution of TDEs to the diffuse cosmic neutrino flux.
5.3.2 Gravitational Waves
With the detection of the neutron star binary merger GW170817 in gravitational waves and in light across the electromagnetic spectrum, we officially entered a new era of multi-messenger astronomy (Abbott et al., 2017). From this one source, one learned how combining information from gravitational waves and light can reveal profound insights into the physical properties of a transient like never before. Since the the gravitational wave (GW) strain for a binary system scales as,
| (19) |
with a frequency of
| (20) |
the best chance of detecting a TDE in gravitational waves is from the tidal disruption of a compact star, like a white dwarf, on a deep encounter with a black hole, with a low frequency GW detector like the Laser Interferometer Space Antenna (LISA), but out to a distance of only 10 kpc (Kobayashi et al., 2004; Rosswog, Ramirez-Ruiz & Hix, 2009; Anninos et al., 2018). This again favors the tidal disruption around an IMBH and is therefore an even more exciting as probe for IMBHs speculated to exist in dwarf galaxy nuclei and/or globular clusters (Greene, Strader & Ho, 2020). With both a GW and EM signal, one could use the chirp mass measured from the GW signal, as well as the exact timing of the pericenter passage of the star, together with the light generated from the debris streams, to model the accretion flow in detail, and determine the true timescale for circularization and accretion (Eracleous et al., 2019). However, even without producing a detectable GW signal themselves, TDEs can provide a useful constraint on the rate of detecting GWs from extreme-mass ratio inspirals (EMRIs) of compact objects into massive black holes, which will be an important signal for LISA.
6 Conclusions
In this review, I have highlighted the exciting progress in the discovery of TDEs from wide-field X-ray, UV, and optical surveys, including the build up of a statistically significant sample of TDEs with well-sampled light curves and detailed multi-wavelength characterization of their emission from the radio to the hard X-rays. The panchromatic emission detected from TDEs probe a wide range of scales, from the innermost regions of a newly forming accreting debris disk, to the first collisions of debris streams as they fallback on the the black hole after disruption, to the expansion of the unbound debris, wind, or jet into the circumnuclear medium, and the heating of circumnuclear dust. While TDEs are now well established as a class of nuclear transients with common, distinguishable properties, there are still important unknowns about what powers their luminous emission. However, they certainly have realized their potential as probes of accretion onto black holes, and may be the only observable probes of accretion onto intermediate-mass () black holes in the future.
The most important observed trends can be summarized as follows.
The power-law decline rate of TDE light curves follows the expectation for emission that follows the fallback rate, , but the rise time does not, and appears to be more closely related to the radiative diffusion timescale.
The characteristic radius of the UV/optical thermal emission in TDEs is consistent with the spatial scale of the intersection radius of the bound debris streams near apocenter, while the characteristic radius of the soft X-ray component is consistent with or even smaller.
TDEs can be grouped into three spectral classes, TDE-H, TDE-H+He, and TDE-He, with the TDE-H+He class showing Bowen fluorescence line emission, and a preference for a hotter and more compact line-emitting region. The TDE-He class is the rarest, and may be associated with the tidal disruption of evolved or stripped stars with helium-rich composition.
The spectral line profiles of TDEs in the optical and UV are very broad, and with detailed photoionization modeling, can be a good tracer of the kinematics and geometry of the stellar debris disk and its associated wind.
The UV to soft X-ray ratio in TDEs is highly variable, and appears to approach a ratio close to unity at late times. However, the lack of an decrease in observed line-of-sight absorption with increasing soft X-ray flux disfavors the ”unveiling” of the soft X-ray emission through an expanding reprocessing layer.
Infrared echoes and transient coronal-line emission are valuable indirect probes of TDEs from their influence on their gas and dust in the circumnuclear environment.
There is strong evidence for outflows and/or jets powered by TDEs from the UV, radio, and X-rays. Mapping their properties as a function of TDE parameters can provide insight on jet formation and AGN feedback.
Observational constraints on the rate of TDEs is improving, and appear to be consistent with the expectations of stellar dynamical models.
TDEs have a strong preference for galaxies in the green valley with centrally concentrated stellar density profiles, which may be the underlying cause for their frequent detection in ”E+A” galaxy hosts.
The future is bright for multi-wavelength and multi-messenger observations of TDEs, and their use as probes of central massive black hole demographics, accretion physics, and jet formation over cosmic time.
DISCLOSURE STATEMENT
The author is not aware of any affiliations, memberships, funding, or financial holdings that might be perceived as affecting the objectivity of this review.
ACKNOWLEDGMENTS
I want to thank my close collaborators in the observational hunt for TDEs from the ZTF ”black hole” Science Working Group, especially Sjoert van Velzen, S. Brad Cenko, Matthew Graham, and Shri Kulkarni, and my terrific team of current and former graduate students, who have spent many nights observing, and days scanning for, TDEs: Tiara Hung, Sara Frederick, Charlotte Ward, and Erica Hammerstein. I acknowledge support for some of this work from the National Science Foundation CAREER grant 1454816, and from several NASA Neil Gehrels Swift and XMM-Newton grants. I also want to thank the Aspen Center for Physics, supported by National Science Foundation grant PHY-1607611, for hosting our 2018 Winter Workshop on “Using Tidal Disruption Events to Study Super-Massive Black Holes”, which was one of the first conferences dedicated to TDEs. Finally, I want to thank my ”village”, Tanikwa, Gloria, Lexi, Natalie, my husband Chase, and The Sherwood Forest Boys and Girls Camp, without whose wonderful care of my adorable children, Cutter, Steele, Brooke and Ryder, I would not have been able to focus on finishing my review during a global pandemic.
References
- Abbott et al. (2017) Abbott BP, Abbott R, Abbott TD, Acernese F, Ackley K, et al. 2017. ApJ 848:L12
- Alexander et al. (2016) Alexander KD, Berger E, Guillochon J, Zauderer BA, Williams PKG. 2016. ApJ 819:L25
- Alexander et al. (2020) Alexander KD, van Velzen S, Horesh A, Zauderer BA. 2020. Space Science Rev. 216:81
- Alexander et al. (2017) Alexander KD, Wieringa MH, Berger E, Saxton RD, Komossa S. 2017. ApJ 837:153
- Anderson et al. (2019) Anderson MM, Mooley KP, Hallinan G, Dong D, Phinney ES, et al. 2019. arXiv e-prints :arXiv:1910.11912
- Anninos et al. (2018) Anninos P, Fragile PC, Olivier SS, Hoffman R, Mishra B, Camarda K. 2018. ApJ 865:3
- Arcavi et al. (2014) Arcavi I, Gal-Yam A, Sullivan M, Pan YC, Cenko SB, et al. 2014. ApJ 793:38
- Bade, Komossa & Dahlem (1996) Bade N, Komossa S, Dahlem M. 1996. A&A 309:L35–L38
- Bellm et al. (2019) Bellm EC, Kulkarni SR, Graham MJ, Dekany R, Smith RM, et al. 2019. PASP 131:018002
- Beloborodov et al. (1992) Beloborodov AM, Illarionov AF, Ivanov PB, Polnarev AG. 1992. MNRAS 259:209–217
- Blagorodnova et al. (2019) Blagorodnova N, Cenko SB, Kulkarni SR, Arcavi I, Bloom JS, et al. 2019. ApJ 873:92
- Blagorodnova et al. (2017) Blagorodnova N, Gezari S, Hung T, Kulkarni SR, Cenko SB, et al. 2017. ApJ 844:46
- Blagorodnova et al. (2018) Blagorodnova N, Neill JD, Walters R, Kulkarni SR, Fremling C, et al. 2018. PASP 130:035003
- Blanchard et al. (2017) Blanchard PK, Nicholl M, Berger E, Guillochon J, Margutti R, et al. 2017. ApJ 843:106
- Bloom et al. (2011) Bloom JS, Giannios D, Metzger BD, Cenko SB, Perley DA, et al. 2011. Science 333:203
- Bogdanović, Cheng & Amaro-Seoane (2014) Bogdanović T, Cheng RM, Amaro-Seoane P. 2014. ApJ 788:99
- Bogdanović et al. (2004) Bogdanović T, Eracleous M, Mahadevan S, Sigurdsson S, Laguna P. 2004. ApJ 610:707–721
- Bonnerot & Lu (2020) Bonnerot C, Lu W. 2020. MNRAS 495:1374–1391
- Bonnerot et al. (2016) Bonnerot C, Rossi EM, Lodato G, Price DJ. 2016. MNRAS 455:2253–2266
- Bowen (1935) Bowen IS. 1935. ApJ 81:1
- Bower (2011) Bower GC. 2011. ApJ 732:L12
- Bower et al. (2013) Bower GC, Metzger BD, Cenko SB, Silverman JM, Bloom JS. 2013. ApJ 763:84
- Brassart & Luminet (2008) Brassart M, Luminet JP. 2008. A&A 481:259–277
- Bright et al. (2018) Bright JS, Fender RP, Motta SE, Mooley K, Perrott YC, et al. 2018. MNRAS 475:4011–4019
- Brockamp, Baumgardt & Kroupa (2011) Brockamp M, Baumgardt H, Kroupa P. 2011. MNRAS 418:1308–1324
- Brown et al. (2015) Brown GC, Levan AJ, Stanway ER, Tanvir NR, Cenko SB, et al. 2015. MNRAS 452:4297–4306
- Brown et al. (2017) Brown JS, Holoien TWS, Auchettl K, Stanek KZ, Kochanek CS, et al. 2017. MNRAS 466:4904–4916
- Brown et al. (2018) Brown JS, Kochanek CS, Holoien TWS, Stanek KZ, Auchettl K, et al. 2018. MNRAS 473:1130–1144
- Brown et al. (2019) Brown JS, Stanek KZ, Holoien TWS, Kochanek CS, Shappee BJ, et al. 2019. MNRAS 484:3785–3796
- Cao et al. (2018) Cao R, Liu FK, Zhou ZQ, Komossa S, Ho LC. 2018. MNRAS 480:2929–2938
- Cappellari et al. (1999) Cappellari M, Renzini A, Greggio L, di Serego Alighieri S, Buson LM, et al. 1999. ApJ 519:117–133
- Cappelluti et al. (2009) Cappelluti N, Ajello M, Rebusco P, Komossa S, Bongiorno A, et al. 2009. A&A 495:L9–L12
- Carter & Luminet (1983) Carter B, Luminet JP. 1983. A&A 121:97–113
- Cenko et al. (2012a) Cenko SB, Bloom JS, Kulkarni SR, Strubbe LE, Miller AA, et al. 2012a. MNRAS 420:2684–2699
- Cenko et al. (2016) Cenko SB, Cucchiara A, Roth N, Veilleux S, Prochaska JX, et al. 2016. ApJ 818:L32
- Cenko et al. (2012b) Cenko SB, Krimm HA, Horesh A, Rau A, Frail DA, et al. 2012b. ApJ 753:77
- Chambers et al. (2016) Chambers KC, Magnier EA, Metcalfe N, Flewelling HA, Huber ME, et al. 2016. arXiv e-prints :arXiv:1612.05560
- Chan et al. (2019) Chan CH, Piran T, Krolik JH, Saban D. 2019. ApJ 881:113
- Chornock et al. (2014) Chornock R, Berger E, Gezari S, Zauderer BA, Rest A, et al. 2014. ApJ 780:44
- Clausen & Eracleous (2011) Clausen D, Eracleous M. 2011. ApJ 726:34
- Coughlin & Nixon (2019) Coughlin ER, Nixon CJ. 2019. ApJ 883:L17
- Dai, McKinney & Miller (2015) Dai L, McKinney JC, Miller MC. 2015. ApJ 812:L39
- Dai et al. (2018) Dai L, McKinney JC, Roth N, Ramirez-Ruiz E, Miller MC. 2018. ApJ 859:L20
- Donato et al. (2014) Donato D, Cenko SB, Covino S, Troja E, Pursimo T, et al. 2014. ApJ 781:59
- Dong et al. (2016) Dong S, Shappee BJ, Prieto JL, Jha SW, Stanek KZ, et al. 2016. Science 351:257–260
- Donley et al. (2002) Donley JL, Brandt WN, Eracleous M, Boller T. 2002. AJ 124:1308–1321
- Dou et al. (2016) Dou L, Wang Tg, Jiang N, Yang C, Lyu J, Zhou H. 2016. ApJ 832:188
- Eracleous et al. (2019) Eracleous M, Gezari S, Sesana A, Bogdanovic T, MacLeod M, et al. 2019. BAAS 51:10
- Esquej et al. (2007) Esquej P, Saxton RD, Freyberg MJ, Read AM, Altieri B, et al. 2007. A&A 462:L49–L52
- Esquej et al. (2008) Esquej P, Saxton RD, Komossa S, Read AM, Freyberg MJ, et al. 2008. A&A 489:543–554
- Evans & Kochanek (1989) Evans CR, Kochanek CS. 1989. ApJ 346:L13
- Frank & Rees (1976) Frank J, Rees MJ. 1976. MNRAS 176:633–647
- Frederick et al. (2019) Frederick S, Gezari S, Graham MJ, Cenko SB, van Velzen S, et al. 2019. ApJ 883:31
- French, Arcavi & Zabludoff (2016) French KD, Arcavi I, Zabludoff A. 2016. ApJ 818:L21
- French et al. (2020) French KD, Wevers T, Law-Smith J, Graur O, Zabludoff AI. 2020. Space Science Rev. 216:32
- Gafton & Rosswog (2019) Gafton E, Rosswog S. 2019. MNRAS 487:4790–4808
- Gezari et al. (2008) Gezari S, Basa S, Martin DC, Bazin G, Forster K, et al. 2008. ApJ 676:944–969
- Gezari, Cenko & Arcavi (2017) Gezari S, Cenko SB, Arcavi I. 2017. ApJ 851:L47
- Gezari et al. (2012) Gezari S, Chornock R, Rest A, Huber ME, Forster K, et al. 2012. Nature 485:217–220
- Gezari et al. (2009) Gezari S, Heckman T, Cenko SB, Eracleous M, Forster K, et al. 2009. ApJ 698:1367–1379
- Gezari et al. (2015) Gezari S, Jones DO, Sanders NE, Soderberg AM, Hung T, et al. 2015. ApJ 804:28
- Gezari et al. (2013) Gezari S, Martin DC, Forster K, Neill JD, Huber M, et al. 2013. ApJ 766:60
- Gezari et al. (2006) Gezari S, Martin DC, Milliard B, Basa S, Halpern JP, et al. 2006. ApJ 653:L25–L28
- Giannios & Metzger (2011) Giannios D, Metzger BD. 2011. MNRAS 416:2102–2107
- Golightly, Coughlin & Nixon (2019) Golightly ECA, Coughlin ER, Nixon CJ. 2019. ApJ 872:163
- Golightly, Nixon & Coughlin (2019) Golightly ECA, Nixon CJ, Coughlin ER. 2019. ApJ 882:L26
- Gomez et al. (2020) Gomez S, Nicholl M, Short P, Margutti R, Alexander KD, et al. 2020. arXiv e-prints :arXiv:2003.05469
- Graur et al. (2018) Graur O, French KD, Zahid HJ, Guillochon J, Mandel KS, et al. 2018. ApJ 853:39
- Greene (2012) Greene JE. 2012. Nature Communications 3:1304
- Greene, Strader & Ho (2020) Greene JE, Strader J, Ho LC. 2020. arXiv e-prints :arXiv:1911.09678
- Greiner et al. (2000) Greiner J, Schwarz R, Zharikov S, Orio M. 2000. A&A 362:L25–L28
- Grupe, Thomas & Leighly (1999) Grupe D, Thomas HC, Leighly KM. 1999. A&A 350:L31–L34
- Guillochon, Manukian & Ramirez-Ruiz (2014) Guillochon J, Manukian H, Ramirez-Ruiz E. 2014. ApJ 783:23
- Guillochon & Ramirez-Ruiz (2013) Guillochon J, Ramirez-Ruiz E. 2013. ApJ 767:25
- Guillochon & Ramirez-Ruiz (2015) Guillochon J, Ramirez-Ruiz E. 2015. ApJ 809:166
- Halpern, Gezari & Komossa (2004) Halpern JP, Gezari S, Komossa S. 2004. ApJ 604:572–578
- Hammerstein et al. (2020) Hammerstein E, Gezari S, van Velzen S, Cenko SB, Roth N, et al. 2020. ApJ
- Hills (1975) Hills JG. 1975. Nature 254:295–298
- Hinkle et al. (2020a) Hinkle JT, Holoien TWS, Auchettl K, Shappee BJ, Neustadt JMM, et al. 2020a. arXiv e-prints :arXiv:2006.06690
- Hinkle et al. (2020b) Hinkle JT, Holoien TWS, Shappee BJ, Auchettl K, Kochanek CS, et al. 2020b. ApJ 894:L10
- Holoien et al. (2020) Holoien TWS, Auchettl K, Tucker MA, Shappee BJ, Patel SG, et al. 2020. arXiv e-prints :arXiv:2003.13693
- Holoien et al. (2018) Holoien TWS, Brown JS, Auchettl K, Kochanek CS, Prieto JL, et al. 2018. MNRAS 480:5689–5703
- Holoien et al. (2019a) Holoien TWS, Huber ME, Shappee BJ, Eracleous M, Auchettl K, et al. 2019a. ApJ 880:120
- Holoien et al. (2016a) Holoien TWS, Kochanek CS, Prieto JL, Grupe D, Chen P, et al. 2016a. MNRAS 463:3813–3828
- Holoien et al. (2016b) Holoien TWS, Kochanek CS, Prieto JL, Stanek KZ, Dong S, et al. 2016b. MNRAS 455:2918–2935
- Holoien et al. (2014) Holoien TWS, Prieto JL, Bersier D, Kochanek CS, Stanek KZ, et al. 2014. MNRAS 445:3263–3277
- Holoien et al. (2019b) Holoien TWS, Vallely PJ, Auchettl K, Stanek KZ, Kochanek CS, et al. 2019b. ApJ 883:111
- Hryniewicz & Walter (2016) Hryniewicz K, Walter R. 2016. A&A 586:A9
- Hudec et al. (2017) Hudec R, Sveda L, Pína L, Inneman A, Semencova V, Skulinova M. 2017. LOBSTER: new space x-ray telescopes. In Society of Photo-Optical Instrumentation Engineers (SPIE) Conference Series, vol. 10567 of Society of Photo-Optical Instrumentation Engineers (SPIE) Conference Series
- Hung et al. (2019) Hung T, Cenko SB, Roth N, Gezari S, Veilleux S, et al. 2019. ApJ 879:119
- Hung et al. (2020) Hung T, Foley RJ, Ramirez-Ruiz E, Dai JL, Auchettl K, et al. 2020. arXiv e-prints :arXiv:2003.09427
- Hung et al. (2017) Hung T, Gezari S, Blagorodnova N, Roth N, Cenko SB, et al. 2017. ApJ 842:29
- Irwin et al. (2010) Irwin JA, Brink TG, Bregman JN, Roberts TP. 2010. ApJ 712:L1–L4
- Jiang et al. (2016) Jiang N, Dou L, Wang T, Yang C, Lyu J, Zhou H. 2016. ApJ 828:L14
- Jiang et al. (2019) Jiang N, Wang T, Mou G, Liu H, Dou L, et al. 2019. ApJ 871:15
- Jiang et al. (2017) Jiang N, Wang T, Yan L, Xiao T, Yang C, et al. 2017. ApJ 850:63
- Kajava et al. (2020) Kajava JJE, Giustini M, Saxton RD, Miniutti G. 2020. arXiv e-prints :arXiv:2006.11179
- Kara et al. (2018) Kara E, Dai L, Reynolds CS, Kallman T. 2018. MNRAS 474:3593–3598
- Kesden (2012a) Kesden M. 2012a. Phys. Rev. D 86:064026
- Kesden (2012b) Kesden M. 2012b. Phys. Rev. D 85:024037
- Khabibullin, Sazonov & Sunyaev (2014) Khabibullin I, Sazonov S, Sunyaev R. 2014. MNRAS 437:327–337
- Kobayashi et al. (2004) Kobayashi S, Laguna P, Phinney ES, Mészáros P. 2004. ApJ 615:855–865
- Kochanek (2016) Kochanek CS. 2016. MNRAS 458:127–134
- Kochanek et al. (2017) Kochanek CS, Shappee BJ, Stanek KZ, Holoien TWS, Thompson TA, et al. 2017. PASP 129:104502
- Komossa & Greiner (1999) Komossa S, Greiner J. 1999. A&A 349:L45–L48
- Komossa et al. (2008) Komossa S, Zhou H, Wang T, Ajello M, Ge J, et al. 2008. ApJ 678:L13
- Krolik et al. (2016) Krolik J, Piran T, Svirski G, Cheng RM. 2016. ApJ 827:127
- Law-Smith et al. (2017) Law-Smith J, MacLeod M, Guillochon J, Macias P, Ramirez-Ruiz E. 2017. ApJ 841:132
- Law-Smith et al. (2020) Law-Smith JAP, Coulter DA, Guillochon J, Mockler B, Ramirez-Ruiz E. 2020. arXiv e-prints :arXiv:2007.10996
- Lei et al. (2016) Lei WH, Yuan Q, Zhang B, Wang D. 2016. ApJ 816:20
- Leloudas et al. (2019) Leloudas G, Dai L, Arcavi I, Vreeswijk PM, Mockler B, et al. 2019. ApJ 887:218
- Leloudas et al. (2016) Leloudas G, Fraser M, Stone NC, van Velzen S, Jonker PG, et al. 2016. Nature Astronomy 1:0002
- Levan et al. (2011) Levan AJ, Tanvir NR, Cenko SB, Perley DA, Wiersema K, et al. 2011. Science 333:199
- Lezhnin & Vasiliev (2016) Lezhnin K, Vasiliev E. 2016. ApJ 831:84
- Li, Narayan & Menou (2002) Li LX, Narayan R, Menou K. 2002. ApJ 576:753–761
- Lidskii & Ozernoi (1979) Lidskii VV, Ozernoi LM. 1979. Soviet Astronomy Letters 5:16–19
- Lin et al. (2011) Lin D, Carrasco ER, Grupe D, Webb NA, Barret D, Farrell SA. 2011. ApJ 738:52
- Lin et al. (2017) Lin D, Guillochon J, Komossa S, Ramirez-Ruiz E, Irwin JA, et al. 2017. Nature Astronomy 1:0033
- Lin et al. (2015) Lin D, Maksym PW, Irwin JA, Komossa S, Webb NA, et al. 2015. ApJ 811:43
- Liu et al. (2017) Liu FK, Zhou ZQ, Cao R, Ho LC, Komossa S. 2017. MNRAS 472:L99–L103
- Liu et al. (2019) Liu XL, Dou LM, Shen RF, Chen JH. 2019. arXiv e-prints :arXiv:1912.06081
- Lodato, King & Pringle (2009) Lodato G, King AR, Pringle JE. 2009. MNRAS 392:332–340
- Lodato & Rossi (2011) Lodato G, Rossi EM. 2011. MNRAS 410:359–367
- Loeb & Ulmer (1997) Loeb A, Ulmer A. 1997. ApJ 489:573–578
- Lu, Kumar & Evans (2016) Lu W, Kumar P, Evans NJ. 2016. MNRAS 458:575–581
- MacLeod, Guillochon & Ramirez-Ruiz (2012) MacLeod M, Guillochon J, Ramirez-Ruiz E. 2012. ApJ 757:134
- MacLeod et al. (2016) MacLeod M, Guillochon J, Ramirez-Ruiz E, Kasen D, Rosswog S. 2016. ApJ 819:3
- Magorrian & Tremaine (1999) Magorrian J, Tremaine S. 1999. MNRAS 309:447–460
- Maksym, Lin & Irwin (2014) Maksym WP, Lin D, Irwin JA. 2014. ApJ 792:L29
- Maksym, Ulmer & Eracleous (2010) Maksym WP, Ulmer MP, Eracleous M. 2010. ApJ 722:1035–1050
- Maksym et al. (2013) Maksym WP, Ulmer MP, Eracleous MC, Guennou L, Ho LC. 2013. MNRAS 435:1904–1927
- Maksym et al. (2014) Maksym WP, Ulmer MP, Roth KC, Irwin JA, Dupke R, et al. 2014. MNRAS 444:866–873
- Maoz (2007) Maoz D. 2007. MNRAS 377:1696–1710
- Martin et al. (2005) Martin DC, Fanson J, Schiminovich D, Morrissey P, Friedman PG, et al. 2005. ApJ 619:L1–L6
- Metzger & Stone (2016) Metzger BD, Stone NC. 2016. MNRAS 461:948–966
- Miller (2015) Miller MC. 2015. ApJ 805:83
- Milne et al. (2013) Milne PA, Brown PJ, Roming PWA, Bufano F, Gehrels N. 2013. ApJ 779:23
- Milosavljević & Merritt (2003) Milosavljević M, Merritt D. 2003. ApJ 596:860–878
- Mockler, Guillochon & Ramirez-Ruiz (2019) Mockler B, Guillochon J, Ramirez-Ruiz E. 2019. ApJ 872:151
- Nicholl et al. (2019) Nicholl M, Blanchard PK, Berger E, Gomez S, Margutti R, et al. 2019. MNRAS 488:1878–1893
- Nikołajuk & Walter (2013) Nikołajuk M, Walter R. 2013. A&A 552:A75
- Palaversa et al. (2016) Palaversa L, Gezari S, Sesar B, Stuart JS, Wozniak P, et al. 2016. ApJ 819:151
- Parkinson et al. (2020) Parkinson EJ, Knigge C, Long KS, Matthews JH, Higginbottom N, et al. 2020. MNRAS 494:4914–4929
- Pasham et al. (2015) Pasham DR, Cenko SB, Levan AJ, Bower GC, Horesh A, et al. 2015. ApJ 805:68
- Pasham et al. (2019) Pasham DR, Remillard RA, Fragile PC, Franchini A, Stone NC, et al. 2019. Science 363:531–534
- Pasham & van Velzen (2018) Pasham DR, van Velzen S. 2018. ApJ 856:1
- Peterson & Ferland (1986) Peterson BM, Ferland GJ. 1986. Nature 324:345–347
- Phinney (1989) Phinney ES. 1989. Manifestations of a Massive Black Hole in the Galactic Center. In The Center of the Galaxy, ed. M Morris, vol. 136 of IAU Symposium
- Piran et al. (2015) Piran T, Svirski G, Krolik J, Cheng RM, Shiokawa H. 2015. ApJ 806:164
- Ramirez-Ruiz & Rosswog (2009) Ramirez-Ruiz E, Rosswog S. 2009. ApJ 697:L77–L80
- Rees (1988) Rees MJ. 1988. Nature 333:523–528
- Reis et al. (2012) Reis RC, Miller JM, Reynolds MT, Gültekin K, Maitra D, et al. 2012. Science 337:949
- Renzini et al. (1995) Renzini A, Greggio L, di Serego Alighieri S, Cappellari M, Burstein D, Bertola F. 1995. Nature 378:39–41
- Rosswog, Ramirez-Ruiz & Hix (2009) Rosswog S, Ramirez-Ruiz E, Hix WR. 2009. ApJ 695:404–419
- Roth & Kasen (2018) Roth N, Kasen D. 2018. ApJ 855:54
- Roth et al. (2016) Roth N, Kasen D, Guillochon J, Ramirez-Ruiz E. 2016. ApJ 827:3
- Roth et al. (2020) Roth N, van Velzen S, Cenko SB, Mushotzky RF. 2020. arXiv e-prints :arXiv:2008.11231
- Ryu, Krolik & Piran (2020) Ryu T, Krolik J, Piran T. 2020. arXiv e-prints :arXiv:2007.13765
- Ryu et al. (2020) Ryu T, Krolik J, Piran T, Noble SC. 2020. arXiv e-prints :arXiv:2001.03501
- Saxton et al. (2015) Saxton RD, Motta SE, Komossa S, Read AM. 2015. MNRAS 454:2798–2803
- Saxton et al. (2012) Saxton RD, Read AM, Esquej P, Komossa S, Dougherty S, et al. 2012. A&A 541:A106
- Saxton et al. (2017) Saxton RD, Read AM, Komossa S, Lira P, Alexander KD, Wieringa MH. 2017. A&A 598:A29
- Short et al. (2020) Short P, Nicholl M, Lawrence A, Gomez S, Arcavi I, et al. 2020. arXiv e-prints :arXiv:2003.05470
- Stein et al. (2020) Stein R, van Velzen S, Kowalski M, Franckowiak A, Gezari S, et al. 2020. arXiv e-prints :arXiv:2005.05340
- Stone & Metzger (2016) Stone NC, Metzger BD. 2016. MNRAS 455:859–883
- Stone & van Velzen (2016) Stone NC, van Velzen S. 2016. ApJ 825:L14
- Strubbe & Quataert (2009) Strubbe LE, Quataert E. 2009. MNRAS 400:2070–2084
- Strubbe & Quataert (2011) Strubbe LE, Quataert E. 2011. MNRAS 415:168–180
- Syer & Ulmer (1999) Syer D, Ulmer A. 1999. MNRAS 306:35–42
- Tonry et al. (2018) Tonry JL, Denneau L, Heinze AN, Stalder B, Smith KW, et al. 2018. PASP 130:064505
- Trakhtenbrot et al. (2019) Trakhtenbrot B, Arcavi I, Ricci C, Tacchella S, Stern D, et al. 2019. Nature Astronomy 3:242–250
- Ulmer (1999) Ulmer A. 1999. ApJ 514:180–187
- van Velzen (2018) van Velzen S. 2018. ApJ 852:72
- van Velzen & Farrar (2014) van Velzen S, Farrar GR. 2014. ApJ 792:53
- van Velzen et al. (2011) van Velzen S, Farrar GR, Gezari S, Morrell N, Zaritsky D, et al. 2011. ApJ 741:73
- van Velzen et al. (2020a) van Velzen S, Gezari S, Hammerstein E, Roth N, Frederick S, et al. 2020a. arXiv e-prints :arXiv:2001.01409
- van Velzen et al. (2020b) van Velzen S, Holoien TWS, Onori F, Hung T, Arcavi I. 2020b. arXiv e-prints :arXiv:2008.05461
- van Velzen et al. (2016) van Velzen S, Mendez AJ, Krolik JH, Gorjian V. 2016. ApJ 829:19
- van Velzen et al. (2019) van Velzen S, Stone NC, Metzger BD, Gezari S, Brown TM, Fruchter AS. 2019. ApJ 878:82
- Wang & Merritt (2004) Wang J, Merritt D. 2004. ApJ 600:149–161
- Wang et al. (2018) Wang T, Yan L, Dou L, Jiang N, Sheng Z, Yang C. 2018. MNRAS 477:2943–2965
- Wang et al. (2012) Wang TG, Zhou HY, Komossa S, Wang HY, Yuan W, Yang C. 2012. ApJ 749:115
- Wevers et al. (2019) Wevers T, Pasham DR, van Velzen S, Leloudas G, Schulze S, et al. 2019. MNRAS 488:4816–4830
- Wyrzykowski et al. (2017) Wyrzykowski Ł, Zieliński M, Kostrzewa-Rutkowska Z, Hamanowicz A, Jonker PG, et al. 2017. MNRAS 465:L114–L118
- Yalinewich et al. (2019) Yalinewich A, Guillochon J, Sari R, Loeb A. 2019. MNRAS 482:2872–2877
- Yang et al. (2017) Yang C, Wang T, Ferland GJ, Dou L, Zhou H, et al. 2017. ApJ 846:150
- Yang et al. (2013) Yang CW, Wang TG, Ferland G, Yuan W, Zhou HY, Jiang P. 2013. ApJ 774:46
- Yang et al. (2019) Yang Q, Shen Y, Liu X, Wu XB, Jiang L, et al. 2019. ApJ 885:110
- Zauderer et al. (2011) Zauderer BA, Berger E, Soderberg AM, Loeb A, Narayan R, et al. 2011. Nature 476:425–428