PANTONE \AddSpotColorPANTONE PANTONE3015C PANTONE\SpotSpace3015\SpotSpaceC 1 0.3 0 0.2 \SetPageColorSpacePANTONE
Corresponding author: Khurram Azeem Hashmi (e-mail: khurram_azeem.hashmi@dfki.de).
Current Status and Performance Analysis of Table Recognition in Document Images with Deep Neural Networks
Abstract
The first phase of table recognition is to detect the tabular area in a document. Subsequently, the tabular structures are recognized in the second phase in order to extract information from the respective cells. Table detection and structural recognition are pivotal problems in the domain of table understanding. However, table analysis is a perplexing task due to the colossal amount of diversity and asymmetry in tables. Therefore, it is an active area of research in document image analysis. Recent advances in the computing capabilities of graphical processing units have enabled the deep neural networks to outperform traditional state-of-the-art machine learning methods. Table understanding has substantially benefited from the recent breakthroughs in deep neural networks. However, there has not been a consolidated description of the deep learning methods for table detection and table structure recognition. This review paper provides a thorough analysis of the modern methodologies that utilize deep neural networks. This work provided a thorough understanding of the current state-of-the-art and related challenges of table understanding in document images. Furthermore, the leading datasets and their intricacies have been elaborated along with the quantitative results. Moreover, a brief overview is given regarding the promising directions that can serve as a guide to further improve table analysis in document images.
Index Terms:
Deep neural network, document images, deep learning, performance evaluation, table recognition, table detection, table structure recognition, table analysis.=-15pt
I Introduction
Table understanding has gained an immense attraction since the last decade. Tables are the prevalent means of representing and communicating structured data [1]. With the rise of Deep Neural Networks (DNN), various datasets for table detection, segmentation, and recognition have been published [2, 3]. This allows the researchers to employ the DNN to improve state-of-the-art results.
Previously, the problem of table recognition has been treated with traditional approaches [4, 5, 6, 7]. One of the earlier works in the area of table analysis has been done by Kieninger et al. [8, 9, 10]. Along with detecting the tabular area, their system known as T-Recs extracts the structural information of the tables.
Later, machine learning techniques are applied to detect the table. One of the pioneers are Cesarini et al. [11]. Their proposed system, Tabfinder converts a document into an MXY tree which is a hierarchical representation of the document. It searches for a block region in the horizontal and vertical parallel lines, and then a depth-first search to handle noisy document images leads to a tabular region. Silva et al. [12] adopted rich Hidden-Markov-Models to detect tabular area based on joint probability distributions.
Support Vector Machines (SVM) [13] have also been exploited along with some handcrafted features to detect tables [14]. Fan et al. [15] tried to detect tables by the fusion of various classifiers trained on linguistic and layout information of documents. Another work carried out by Tran et al. [16] uses a region of interest to detect tables in document images. These regions are further filtered as tables if the text block present in the region of interest satisfies a specific set of rules.
Comprehensive research is conducted by Wang et al. [17] focusing not only on the problem of table detection but table decomposition as well. Their probability optimization-based algorithm is similar to the well-known X-Y cut algorithm [18]. The system published by Shigarov et al. [19] leverages the bounding boxes of words to restore the structure of a table. Since the system is heavily dependent on the metadata, the authors have employed PDF files to execute this experiment.
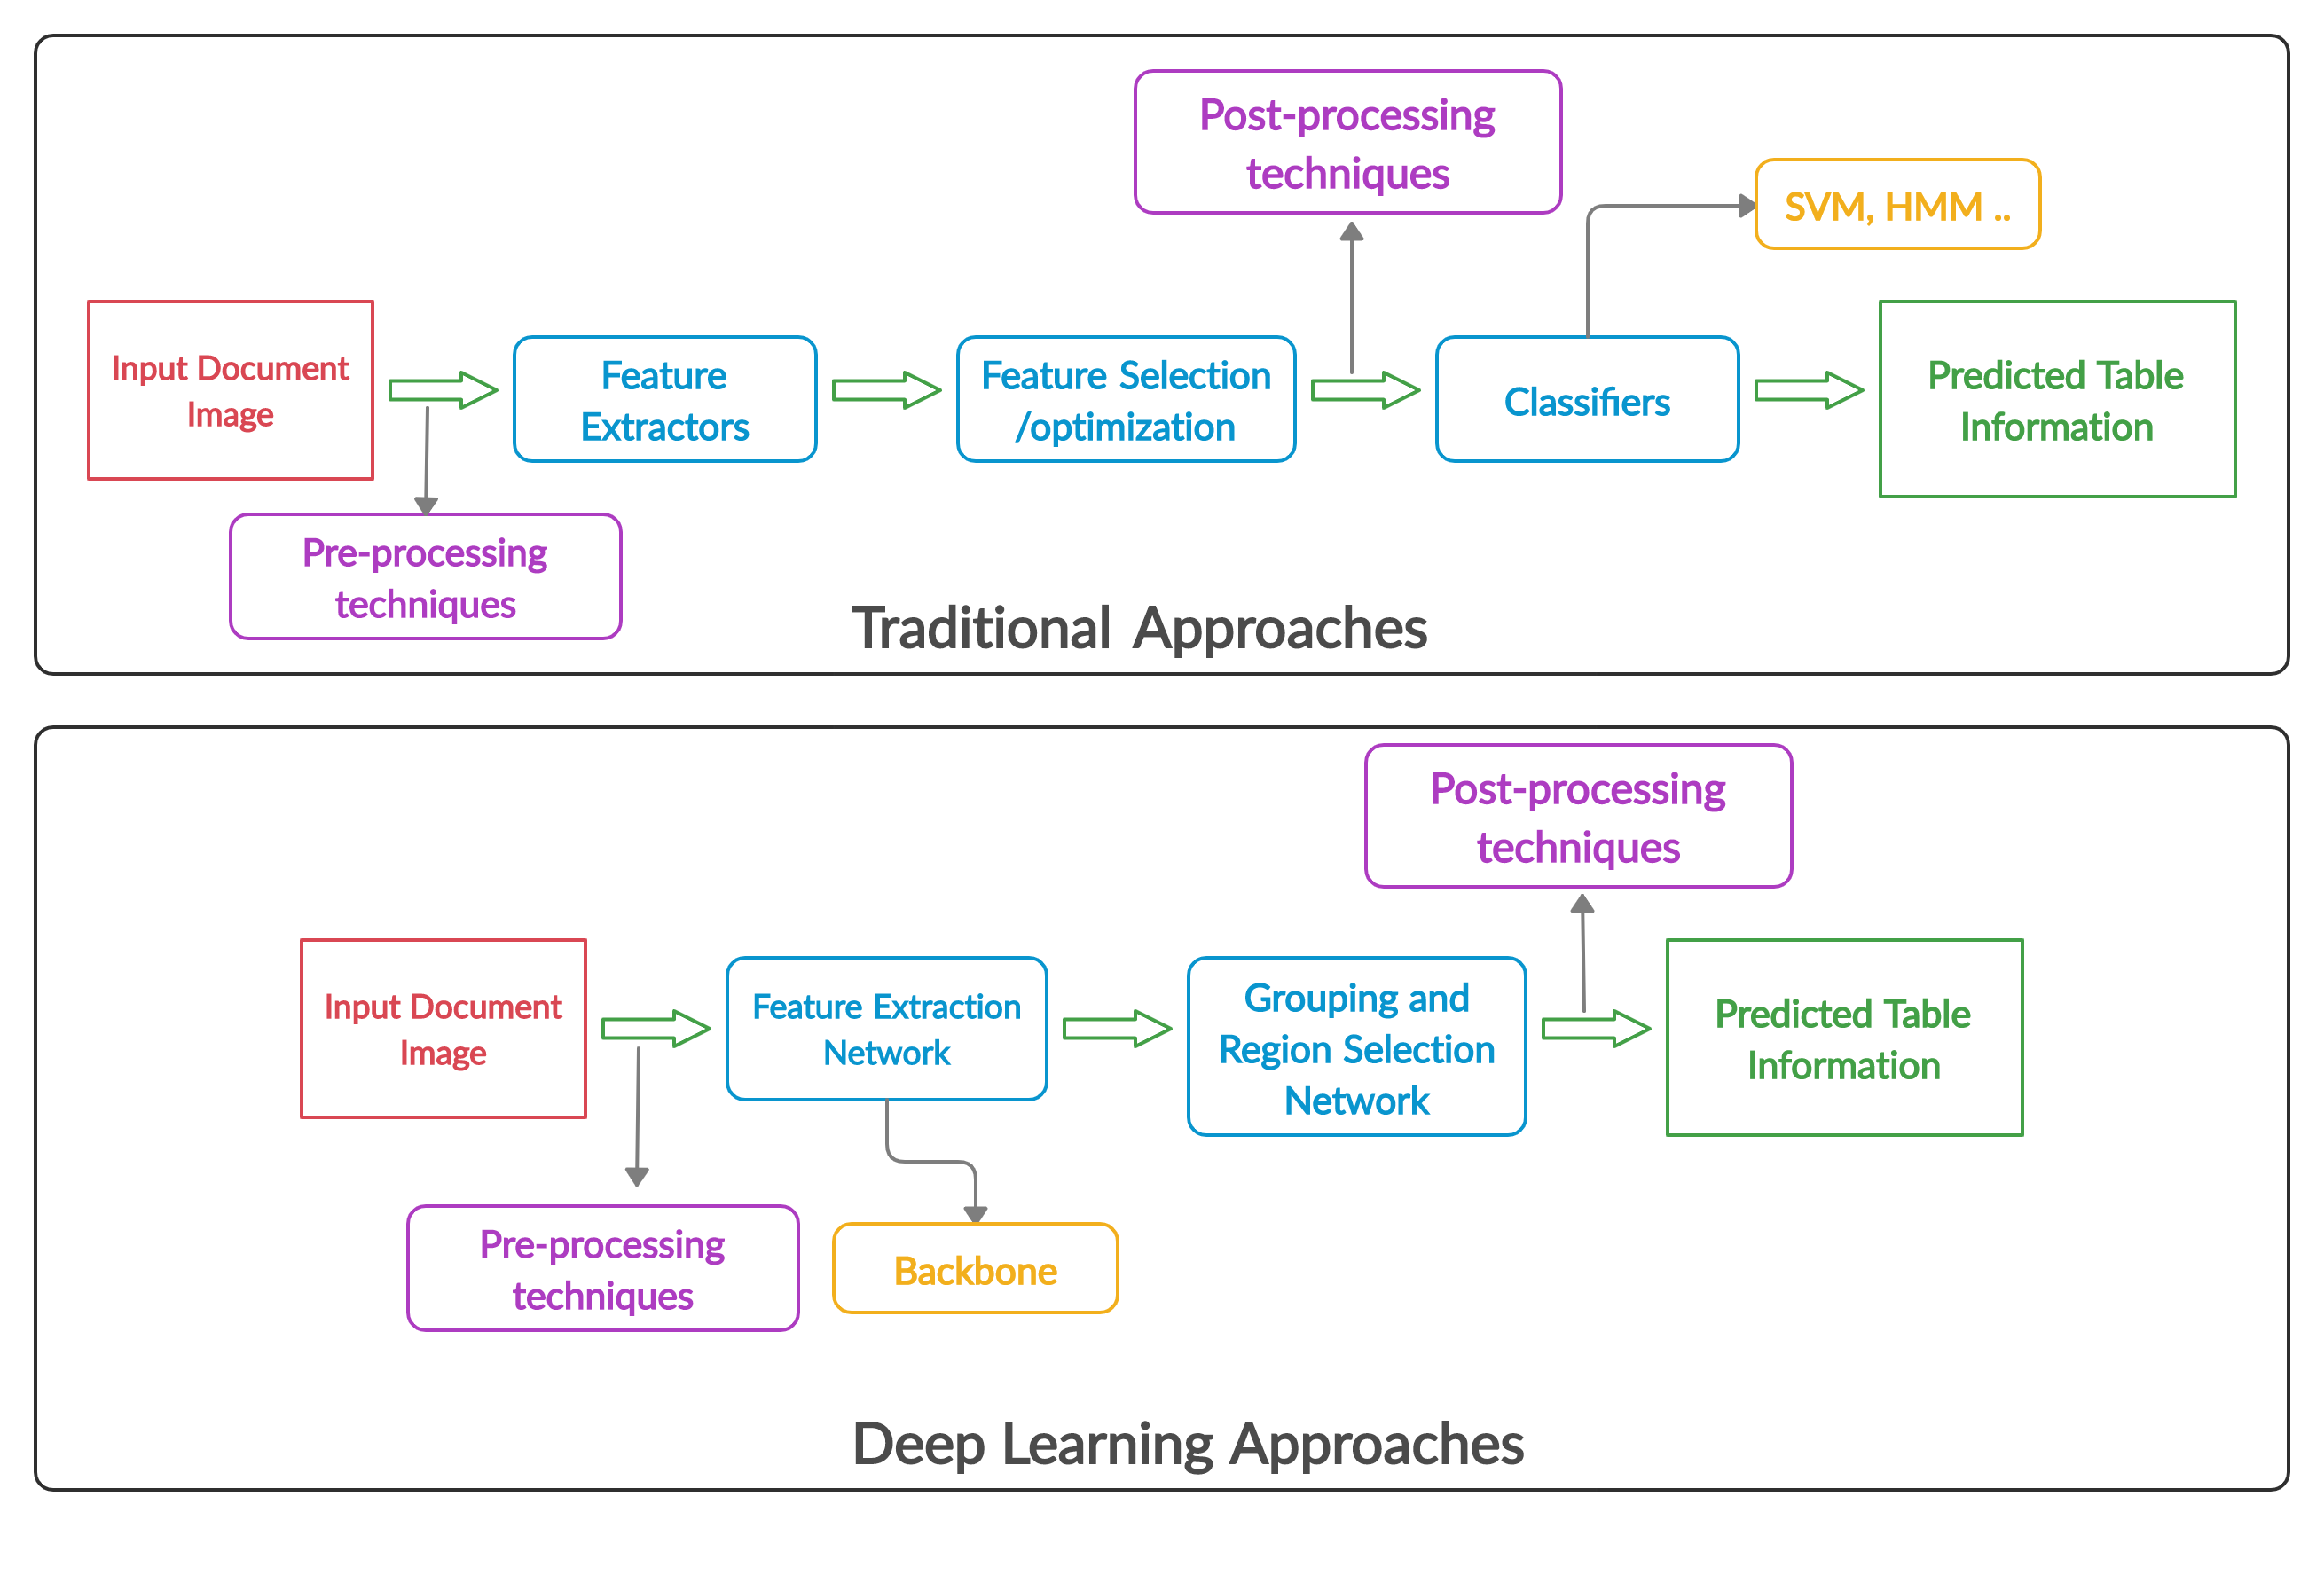
Figure 1 depicts the standard pipeline comparison between traditional approaches and deep learning methods for the process of table understanding. Traditional table recognition systems are either not generic enough on different datasets or they require the additional metadata from PDF files. In most of the traditional methods, exhaustive pre and post-processings were also employed to enhance the performance of traditional table recognition systems. However, in deep learning systems, instead of handcrafted features, neural networks mainly convolutional neural networks [20] are used to extract features. Subsequently, object detection or segmentation networks attempt to distinguish the tabular part which is further decomposed and recognized in a document image.
The text documents can be classified into two categories. The first category belongs to born-digital documents that contain not only text but the related meta-data such as layout information. One such example is the PDF documents. The second category of documents is acquired using devices such as scanners and cameras. To the best of our knowledge, there is no notable work that has employed deep learning for table recognition in camera-captured images. However, in the literature, one heuristic based approach [21] exists that works with camera-captured document images. The scope of this survey is to assess the deep learning-based approaches that have performed table recognition on the scanned document images.
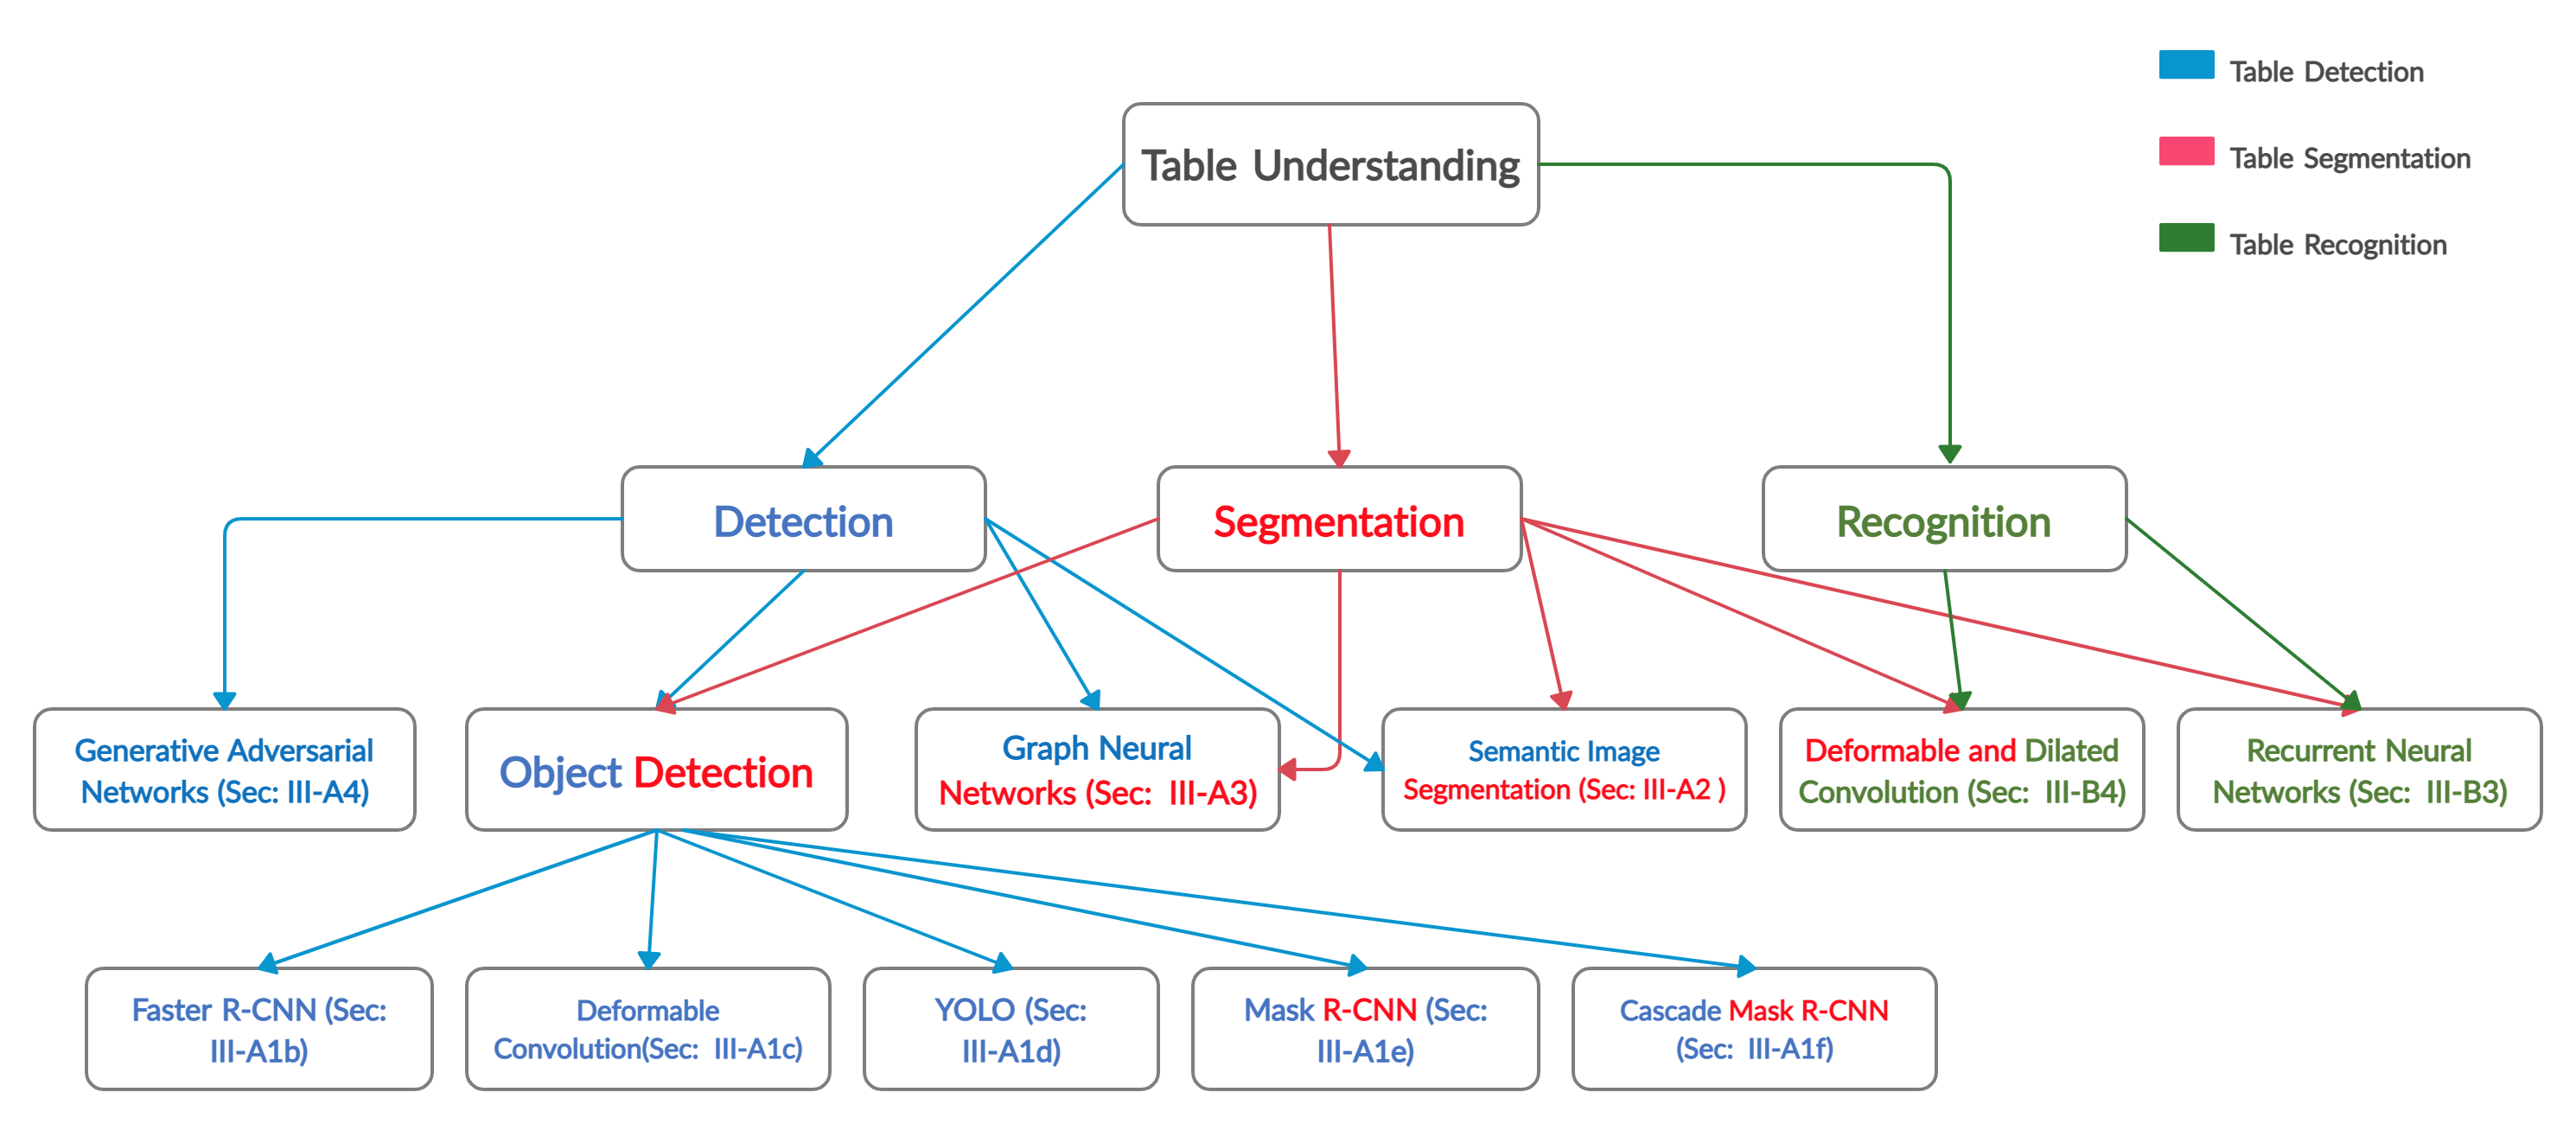
This review paper is organized as follows: Section II provides a brief discussion about the reviews and surveys which are already published in the research community; Section III provides an exhaustive discussion about several approaches that have contributed in the area of table understanding by leveraging deep learning concepts. Figure 2 explains the structural flow of mentioned methodologies; Section IV investigates all the publicly available datasets that can be exploited for the problems in table analysis; Section V explains the well known evaluation metrics and provides performance analysis of all the discussed approaches in Section III; Section VI concludes the discussion where as SectionVII highlights various open issues and future directions.
II RELATED WORK
The problem of table analysis has been a well-recognized problem for several years. Figure 3 illustrates the increasing trend in the number of publications for the last 5 years. Since this is a review paper, we would like to shed some light on the previous surveys and reviews that are already available in the table community. In the chapter Document Recognition in one of his books, Dougherty defines table [22]. In the survey on document recognition, Handley [23] elaborated on the task of table recognition along with a precise explanation of previous work done in this domain. Later, Lopresti et al. [24] presented the survey on table understanding in which they discussed the heterogeneity in different kinds of tables. They also pointed out the potential areas where improvement could be made by leveraging many examples. The comprehensive survey was transformed into a tabular form which was later published as a book [25].
Zanibbi et al. [26] came up with the exhaustive survey which includes all the recent material and state-of-the-art approaches of that time. They define the problem of table recognition as ”the interaction of models, observations, transformations, and inferences”[27]. Hurst in his doctoral thesis [28] defines the interpretation of tables. Silva et al. [29] published another survey in 2006. Along with evaluating the current table processing algorithms, the authors have proposed their own end-to-end table processing method and evaluation metrics to solve the problem of table structure recognition.
Embley et al. [27] wrote a review illustrating about the table-processing paradigms.In 2014, another review on table recognition and forms is published by Coüasnon et al.[30]. The review covers a brief overview of the recent approaches of that time. In the following year and according to our knowledge, the latest review on the detection and extraction of tables in PDF documents is published by Khusro et al.[31].
III METHODOLOGIES
As elaborated in [32], we have also defined the problem of table understanding into three steps:
-
1.
Table Detection: detecting the tabular boundaries in terms of bounding boxes in document images.
-
2.
Table Structural Segmentation: defines the structure of table by analyzing information of row and column layouts.
-
3.
Table Recognition: includes both structural segmentation and parsing information of table cells.
III-A Table Detection
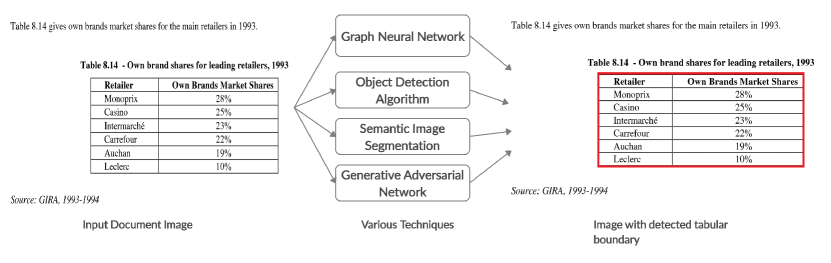
The first part of extracting information from the tables is to identify the tabular boundary in the document images [33]. Figure 4 explains the fundamental flow of table detection which has been discussed in numerous approaches. Various deep learning concepts have been employed to detect tabular areas from the document images. This section reviews the deep learning techniques which are exploited to perform table detection in document images. For the sake of providing convenience to our readers, we have categorized the approaches into discrete deep learning concepts. Table I summarizes all the object detection-based table detection approaches,whereas Table II highlights the advantages and limitations of the methods that have applied other deep learning-based techniques.
Based on our knowledge, the first approach that employed deep learning methods to solve the table detection task is proposed by Hao et al.[34]. Along with the use of a convolutional neural network to extract the image features, authors applied some heuristics by leveraging the PDF metadata. Since this technique is based on PDF documents rather than relying on document images, we decide not to include this research in our performance analysis.
III-A1 Object Detection Algorithms
Object detection is a branch of deep learning which deals with detecting an object in any image or a video frame. Region-based object detection algorithms are mainly divided into two steps: the first one is to generate appropriate proposals also known as region of interest. These regions of interest are classified using convolutional neural networks in the second step.
Transfer Learning
Transfer learning is the concept of utilizing a pre-trained model on a problem that belongs to a different, but related domain [35]. Due to limited number of available labelled datasets, transfer learning has been excessively used in the vision-based approaches [36, 37, 38, 39]. For similar reasons, researchers in the document image analysis community have also powered the capabilities of transfer learning to advance their approaches [40, 41, 42]. The capabilities of transfer learning have aided the researchers to reuse the pre-trained networks (trained on ImageNet [20] or COCO [43]) on the problem of table detection and table structure recognition in document images [44, 45, 46, 47, 48, 49, 50, 51, 52, 53]. While Section III-A1, III-A1 and III-A1 explains transfer learning-based table detection methods, the techniques that employed transfer learning for the task of table structure recognition are elaborated in Section III-B5.
Faster R-CNN
After the improvement of object detection algorithms from Fast R-CNN [54] to Faster R-CNN [55], the tables are treated as an object in the document images. Gilani et al. [44] employed deep learning method on the images to detect tables. The technique involves image transformation as a pre-processing step that follows with the table detection. In the image transformation part, a binary image is taken as an input on which Euclidean distance transform [56], linear distance transform [57], and max distance transform [58] are applied on blue, green and red channels of the image respectively. Later, Gilani et al. [44] have used a region-based object detection model called Faster R-CNN [55]. The backbone of their Region Proposal Network (RPN) is based on ZFNet [59]. Their approach was able to beat the state-of-the-art results on UNLV [2] dataset.
One of the works executed on document images by using the capabilities of deep learning has been accomplished by Schreiber et al. [45]. Their end to end system known as DeepDeSRT not only detects the tabular region but also distinguishes the structure of the table and both of these tasks are dealt with by applying distinctive deep learning techniques. Table detection has been achieved by using Faster R-CNN [55]. They have experimented with two different architectures as their backbone network: Zeiler and Fergus (ZFNet) [59] and a deep VGG-16 network [60]. Models are pre-trained on Pascal VOC [61] dataset. Method for structural segmentation is explained in the Section III-B
With an increase in memory of graphical processing units (GPU), a room for bigger public datasets is created to completely leverage the power of GPUs. Minghao et al. [62] comprehends this need and proposed TableBank, which contains 417K labeled tables and their respective document images. They have also suggested baseline models by using Faster R-CNN [55] for the task of table detection. The author proposed a baseline method for structure recognition as well which will be explained later in Section III-B
In another research presented in the ICDAR 2019 conference, tables are detected using the combination of Faster R-CNN and further improved using the locating corners method [63]. The authors define the corners like a square of size drawn around the vertices of tables. Along with locating the boundary of tables, corners are also detected using the same Faster R-CNN model. These corners are further refined after passing through various heuristics like two consecutive corners are on the same horizontal line. After analyzing the corners, inaccurate corners are filtered and left to form a group. The authors argue that most of the time, inaccuracy in table boundaries is due to inaccurate detection of the left and right side of the boundaries as compared to the top and bottom side of boundaries. Hence, only the right and left sides of a detected table are refined in this experiment. The refinement is carried out by first finding the corresponding corner for a table by calculating the intersection over the union between them. Subsequently, horizontal points of the table are shifted by taking the mean value between the table boundary and the corresponding corner. This article has conducted an experiment on ICDAR 2017 page object detection dataset [64] and reported a 2.8% increase in F-measure as compared to the traditional Faster R-CNN approach.
Deformable Convolutions
Another approach is proposed by Siddiquie et al. [46] in 2018 which was a follow-up work of Schreiber et al. [45]. They have performed the table detection tasks by taking advantage of deformable convolutional neural networks [65] in the model of Faster R-CNN. The authors claim that deformable convolutions exceeds the performance of traditional convolutions due to having various tabular layouts and scales in the documents. Their model DeCNT have shown state-of-the-art results on the datasets of ICDAR-2013 [66], ICDAR-2017 POD [64], UNLV [2] and Marmot [3].
Agarwal et al. [49] presented the approach called CDeC-Net (Composite Deformable Cascade Network) to detect tabular boundaries in document images. In this work, the authors empirically established that there is no need to add extra pre/post-processing techniques to obtain state-of-the-art results for table detection. This work is based on a novel cascade Mask R-CNN [67] along with the composite backbone which is a dual backbone architecture (two ResNeXt-101 [68]) [69]. In their composite backbone, the authors replace the conventional convolutions with the deformable convolutions to address the problem of detecting tables with arbitrary layouts. With the combination of deformable composite backbone and strong Cascade Mask R-CNN, their proposed system produced comparable results on several publicly available datasets in the table community.
YOLO
YOLO (You Only Look Once) [70] which is a famous model for detecting objects in real-world images efficiently has also been employed in the task of table detection by Huang et al. [47]. YOLO is different from region proposal methods because it handles the task of object detection more like a regression instead of a classification problem. YOLOv3 [71] is the recent and enhanced version of YOLO [70] and is therefore used in this experiment. In order to make the predictions more precise, white-space margins are removed from the predicted tabular area along with the refinement of noisy page objects.
Mask R-CNN, YOLO, SSD and Retina Net
Another research that leverages object detection algorithms is ”The Benefits of Close-Domain Fine-Tuning for Table Detection in Document Images” published by Casado-García et al. [72]. After carrying out an exhaustive evaluation, the authors have demonstrated the improvement in the performance of table detection when fine-tuned from a closer domain. Leveraging the object detection algorithms, the writers have used Mask R-CNN [73], YOLO [74], SSD [75] and Retina Net [76]. To conduct this experiment, two base datasets are selected. The first dataset was PascalVOC [61] which contains natural scenic images and has no close relation with the datasets present in the table community. The second base dataset was TableBank [62] which has 417 thousand labeled images further explained in Section IV-G. Two separate models were trained on these datasets and tested comprehensively on all ICDAR table competitions datasets along with other datasets like Marmot and UNLV [2] which are later explained in Section IV. An average of 17% in improvement is noted in this article when models are fine-tuned with closer domain datasets as compared to models trained on real-world images.
Cascade Mask R-CNN
Along with the recent improvements in generic spatial feature extraction networks [77, 78], and object detection networks [67, 79], we have seen a noticeable improvement in table detection systems. Prasad et al. [48] published the CascadeTabNet which is an end-to-end table detection and structure recognition method. In this work, the authors leverage the novel blend of Cascade Mask R-CNN [67] (which is a multistage Mask R-CNN) with the HRNet [77] as a base network. The paper exploited the similar area proposed by [44] and instead of raw document images, transformed images were fed to the strong Cascade Mask R-CNN [67]. Their proposed system was able to achieve state-of-the-art results on the datasets of ICDAR-2013 [66], ICDAR-2019 [80] and TableBank [62].
In one of the very recent works, Zheng et al. [52] published a framework for both the detection and structure recognition of tables in document images. The authors argue that the proposed system GTE (Global Table Extractor) is a generic vision-based method in which any object detection algorithm can be employed. The method feeds raw document images to the multiple object detectors that simultaneously detect tables and the individual cells to achieve accurate table detection. The predicted tables by the object detectors are further refined with the help of an additional penalty loss and predicted cellular boundaries. The approach further improves the predicted cellular areas to tackle table structure recognition, and it is explained in Section III-B.
III-A2 Semantic Image Segmentation
In the year 2018, the combination of deep convolutional neural networks, graphical models, and the concepts of saliency features have been applied to detect charts and tables by Kavasidis et al. [81]. The authors argued that instead of using the object detection networks, the task of detecting the tables can be posed as a saliency detection. The model is based on a semantic image segmentation technique. It first extracts saliency features and then each pixel is classified whether that pixel belongs to a region of interest or not. To notice long-term dependencies, the model employed dilated convolutions [82]. In the end, the generated saliency map is propagated to the fully connected Conditional Random Field (CRF) [83], which further improves the predictions.
Fully Convolutional Networks
TableNet powered by deep learning is an end-to-end model for both detecting as well as recognizing the structure of tables in document images presented by Shubham et al [84]. The proposed method exploits the concepts of fully convolutional networks [85] with a pre-trained VGG-19 [60] layer as the base network. The author claims that the problem of identifying the tabular area and structure recognition can be jointly addressed similarly. They further demonstrated how the performance of a new dataset can be enhanced by exploiting the capabilities of transfer learning.
| Literature | Method | Highlights | Limitations |
|---|---|---|---|
| Gelani et al. [44] | Faster R-CNN (Section III-A1). Images are transformed and then fed into the Faster R-CNN. | a) First deep learning based table detection approach on scanned document images, b) Transforming RGB pixels to distance metrics facilitates the object detection algorithm. | Extra pre-processing steps involved. |
| DeCNT [46] | Deformable convolutions implemented in the Faster R-CNN architecture (Section III-A1). | The dynamic receptive field of deformable convolutional neural networks help in recognizing various tabular boundaries. | Deformable convolutions are computationally intensive as compared to traditional convolutions. |
| DeepDeSRT [45] | Faster R-CNN with transfer learning techniques (Section III-A1) | Simple and effective end-to-end approach to detect tables and structures of the tables. | Not as accurate as compared to other states of the art approaches. |
| TableBank [62] | Faster R-CNN used as a baseline method for a novel dataset (Section III-A1). | This approach presents that by leveraging a large dataset such as TableBank, a simple Faster R-CNN can produce impressive results. | Just a direct application of Faster R-CNN. |
| Sun et al. [63] | Faster R-CNN with locating corners (Section III-A1). | a) Faster R-CNN is exploited to detect not only tables but the corners of the tabular boundaries as well, b) Novel method produces better results. | a) Computationally more extensive because of additional detections, b) Post-processing steps such as corners’ refinement are required. |
| Huang et al. [47] | YOLO based table detection method (Section III-A1). | Comparatively, faster and efficient approach. | The proposed method depends on the data driven post-processing techniques. |
| García et al. [72] | Employed Mask R-CNN, YOLO, SSD and RetinaNet to compare fine-tuning techniques (Section III-A1). | Presented the benefits of leveraging a closer domain fine-tuning methods for table detection while employing object detection networks. | Still, closed domain fine-tuning is not enough to reach the state-of-the-art results. |
| CascadeTabNet [48] | Employed Cascade Mask R-CNN with an iterative transfer learning approach (Section III-A1). | This work presents that transformed images with an iterative transfer learning can reduce the dependency of large-scale datasets. | Similar to [44], extra pre-processing steps are involved in this approach. |
| CDeC-Net [49] | Cascade Mask R-CNN with a deformable composite backbone (Section III-A1). | a) Extensive evaluations on publicly available benchmark datasets for table detection. b) An end-to-end object detection-based framework leveraging composite backbone to produce state-of-the-art results. | Along with the deformable convolutions, a composite backbone is employed which makes the approach computationally intensive. |
| GTE [52] | Proposed a generic object detection approach (Section III-A1). | a) An end-to-end technique that can operate on any object detection framework. b) This work proposed an additional piece-wise constraint loss that benefits the task of table detection. | Since the task of table detection is dependent on cell detections, annotations for cellular boundaries are required. |
| Literature | Method | Highlights | Limitations |
| Kavasidis et al. [81] | Semantic Image Segmentation with saliency concepts (Section III-A2). | a) This method poses the task of table detection as saliency detection, b) Dilated convolutions are applied instead of traditional convolutions. | Multiple processing steps are required to achieve comparable results. |
| TableNet [84] | Fully Convolutional Networks (Section III-A2). | a) An end-to-end approach for table detection and structure recognition in document images, b) First approach to jointly address the task of table detection and structure recognition with a single method. | In the case of table structural extraction, this technique only works on column detection. |
| Martin et al. [86] | Graph Neural Network with the line item detection approach. (Section III-A3) | The method shows promising results on the layout-heavy documents such as invoices. | a) Approach is not evaluated on any publicly available table datasets, b) Weak baseline method and no comparisons with other state-of-the-art methods. |
| Riba et al. [87] | Graph Neural Network by leveraging textual attributes through OCR (Section III-A3) | The proposed method leverages more information than just the spatial features. | a) This method requires extra annotations apart from the information of tabular area, b) No comparisons with other state-of-the-art approaches. |
| Li et al. [88] | Generative Adversarial Networks and object detection network (Section III-A4) | GAN based approach forces the network to extract similar features for ruling and less-ruled tables. | Model with generators is vulnerable in document images having diverse tabular layouts. |
III-A3 Graph Neural Networks
Recently, we have seen that the adoption of graph neural networks in the area of table understanding is on the rise. Riba et al. [87] carried out an experiment of detecting tables using graph neural networks in the invoice documents. Due to the limited amount of information available in the images of invoices, the authors argue that graph neural networks are a better fit to detect the tabular area. The paper also publishes the labeled subset of the original RVL-CDIP dataset [89] which is pulbicly available.
Martin et al. [86] extends the application of graph neural networks by presenting the idea of table understanding using graph convolutions in structured documents like invoices. The proposed research is also conducted on PDF documents however, the authors claim that the model is robust enough to handle other kinds of data sets. In this research, the problem of table detection is solved by combining the task of line item table detection and information extraction. With the line item approach, any word can be easily distinguished whether it is a part of a line item or not. After classifying all words, the tabular area can be efficiently detected since lines in the table separate reasonably well enough as compared to other text-areas in invoices.
III-A4 Generative Adversarial Networks
Generative Adversarial Networks (GAN) [90] have also been exploited to identify tables. The proposed approach [88] makes sure that the generative network sees no difference between the ruling and less-ruling tables and try to extract identical features in both of the cases. Subsequently, the feature generator is joined with semantic segmentation models like Mask R-CNN [73] or U-net [91]. After combining the GAN-based feature generator with Mask R-CNN, the approach is evaluated on the ICDAR2017 POD dataset [64]. Authors claim that this approach will facilitate other object detection and segmentation problems.
III-B Table Structural Segmentation
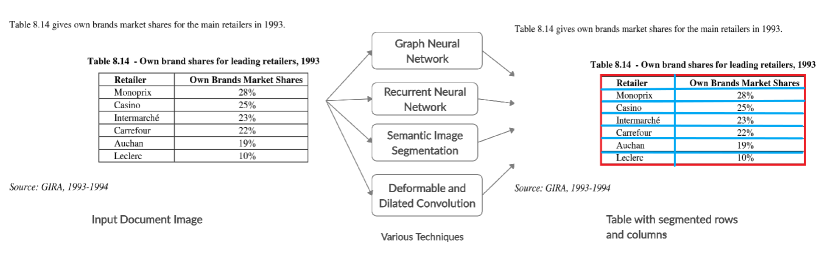
Once, the boundary of the table is detected, the next step is to identify the rows and columns [29]. In this section, we will review the recent approaches that have attempted the problem of table structural segmentation. We have categorized the methodologies according to the architecture of deep neural networks. Table III summarizes these approaches by highlighting their advantages and limitations. Figure 6 illustrates the essential flow of table structural segmentation techniques that are discussed in this review paper.
III-B1 Semantic Image Segmentation
Along with table detection, TableNet segments the structure of a table by detecting the columns in respective tables. Shubham et al [84] used a pre-trained VGG-19 [60] as a base network that acts as an encoder while a decoder performs the column detection. The author tries to convince the readers that due to the interdependence between the table detection and structural segmentation, both of the problems can be solved efficiently by using a single network.
Fully Convolutional Networks
To recognize the structure in tables, the authors of DeepDeSRT [45] have exploited the concept of semantic segmentation. They implemented a fully convolutional network proposed in [85]. An added pre-processing step of stretching the table vertically for rows and horizontally for columns have provided a valuable advantage in the results. They achieved state-of-the-art results on the ICDAR 2013 table structure recognition dataset [66].
Another paper ”Rethinking Semantic Segmentation for Table Structure Recognition in Documents” is proposed by Siddiqui et al. [92]. Just like Schreiber et al. [45], they have formulated the problem of structure recognition as the semantic segmentation problem. The authors have used fully convolutional networks [85] to segment the rows and columns respectively. Assuming the consistency in a tabular structure, the method of prediction tiling is introduced which reduces the complexity of table structural recognition. The author used the structural models of FCN’s encoder and decoder, and loaded pre-trained models on ImageNet [93]. Given an image, the model produces the features having the same size as the original input image. The tiling process averages the features in rows and columns and combines the features of () into for rows and for columns. Features after being convolved are expanded into . Subsequently, the label of each pixel is obtained through the convolution layer. Finally, post-processing is performed to accomplish the final result. The authors have reported the F1-score of 93.42% with an IOU of 0.5 on the ICDAR 2013 dataset [66]. Due to the writer’s constraint of consistency, they have to finetune this dataset which is now publicly available to reproduce similar results111Fine-tuned ICDAR-13 dataset : https://bit.ly/2NhZHCr.
Zou and Ma [94] proposed another research in which fully convolutional networks [85] are utilized to develop image-based table structure recognition method. Similar to the idea of [92], the presented work segments the rows, columns, and cells in a table. Connected Component Analysis is used to improve the predicted boundaries of all of the table components [95]. Later, row and column numbers are assigned for each cell based on the position of row and column separators. Moreover, custom heuristics are applied to optimize cellular boundaries.
III-B2 Graph Neural Networks
So far in most of the mentioned approaches, the problem of segmenting tables in document images is treated with segmentation techniques. In 2019, Qasim et al. [96] exploited the graph neural networks [97] to perform table recognition for the first time. The model is constructed with a blend of deep convolutional neural networks to extract image features and graph neural networks to control the relationship among the vertices. They have open-sourced the proposed work to reproduce or improve the claimed results. 222github.com/shahrukhqasim/TIES-2.0
Another technique powered by graph neural networks to recognize the tabular structure is proposed in the same year by Chi et al. [98]. However, this technique is based on PDF documents instead of images. One contribution from their side worth mentioning is the publication of their large-scale table structure recognition dataset SciTSR which will be discussed in Section IV.
Distance Based Weights
Another work to segment tabular structures presented in ICDAR 2019 is about the reconstruction of syntactic structures from the table as known as ReS2TIM published by Xue et al. [99]. The primary goal of this model is to regress the coordinates for each cell. The novel approach first creates a network that detects neighbors of each cell in a table. Distance-based weight is presented in the paper which will help the network to solve the class imbalance hurdle during training. Experiments were carried out on Chinese medical documents dataset [100] and ICDAR 2013 table competition dataset [66].
| Literature | Method | Highlights | Limitations |
|---|---|---|---|
| Siddiqui et al. [50] | Deformable Convolution with Faster R-CNN (Section III-B4). | a) Published another dataset having structural information of tables. b) Deformable convolution allows tackling varied tabular structures. | The published work will not work well in case of row/column span in the tables. |
| CascadeTabNet [48] | Cascade Mask R-CNN with HRNet as a backbone network (Section III-B5). | An end-to-end approach to directly regress cellular boundaries. | An extra post-processing is required to filter tables (with and without) ruling lines. |
| GTE [52] | Generic object detection approach (Section III-B5). | An hierarchical network with an additional novel cluster-based method to recognize tabular structures. | Final cell structure recognition is conditioned on the precise classification of a table (Graphical ruling lines present or not present). |
| Hashmi et al. [51] | Mask R-CNN with an Anchor optimization method (Section III-B5). | Optimized anchors help region proposal networks to converge faster and better. | This work depends on the initial pre-processing step of clustering the ground-truth to retrieve suitable anchors. |
| Raja et al. [53] | Mask R-CNN with ResNet-101 as a backbone network (Section III-B5). | a) A trainable combination of top-down (cell detection) and bottom-up (structure recognition) is presented. b) An additional alignment loss is proposed to detect cells accurately. | The approach is vulnerable in the case of empty cells. |
| Siddiqui et al. [92] | Fully Convolutional Networks (Section III-B1). | The proposed Prediction tiling technique minimizes the complexity of the problem of table structure recognition. | a) The method relies on the consistency assumption of tabular structures, b) In case of overly-segmented rows/columns, extra post-processing steps are required. |
| Tensmeyer et al. [101] | Dilated Convolutions in Fully Convolutional Networks (Section III-B4). | The system works well both on PDF and scanned document images. | The merging part of the approach is depends on the post-processing heuristics. |
| Zou et al. [94] | Fully Convolutional Networks (Section III-B1). | a) Along with segmenting rows and columns, cells are segmented in a table. b) Applying Connected component analysis further improves the results. | Handful of post-processing steps involving custom heuristics are required to produce comparative results. |
| Qasim et al. [96] | Graph Neural Networks with Convolutional Neural Networks (Section III-B2). | a) The proposed method exploits both the spatial and textual features, b) A novel Monte Carlo based memory efficient training method is also presented in this work. | The system is not evaluated on the publicly available table datasets. |
| Xue et al. [99] | Graph Neural Networks with distance based weights (Section III-B2). | The distance-based weight technique resolves the class imbalance problem for the cell relationship network. | The method is vulnerable in the case of sparse tables. |
| Khan et al. [102] | Recurrent Neural Networks (Section III-B3). | The Bi-directional GRU overcomes the problem of the smaller receptive field of CNNs. | A series of pre-processing steps such as binarization, noise removal, and morphological transformation are required. |
III-B3 Recurrent Neural Networks
So far, we have seen that convolutional neural networks and graph neural networks are employed to perform table structure extraction. Recent research proposed by Khan et al. [102] has experimented with bi-directional recurrent neural networks along with Gated Recurrent Units (GRU) [103] to extract the structure of the table. The authors argue that the receptive field of the convolutional neural network is not capable enough to capture complete information of row and column in one stride. According to the writers, a pair of bi-directional GRU performs better. One GRU caters to the row identification whereas another detects the column boundary. The author tried two classic recurrent neural network models, Long Short Term Memory (LSTM) [104] and GRU [103], and found that GRU has more benefits in experimental results. In the end, the authors experimented with the datasets of the table structure recognition sub-task of the UNLV [2] and ICDAR 2013 table competitions, both surpassing the previous best results. The authors tried to convince that GRU-based sequential models can also be exploited to improve not only the problem of structure recognition but also for the information extraction in the tables.
III-B4 Deformable and Dilated Convolutions
Along with traditional convolutions, deformable and dilated convolutions have been exploited to recognize tabular structures in document images.
Deformable Convolutions
Siddiqui et al. [50] advertised another public image-based table recognition dataset known as TabStructDB. This dataset was curated by using the images from a well known ICDAR 2017 page object detection dataset [64] which are annotated with structural information. TabStructDB has been extensively evaluated on the proposed model called DeepTabStR which can be seen as a follow-up work for [46]. The author stated that there exists a huge diversity in the tabular layouts and traditional convolutions which operates as a sliding window is not the best choice. Deformable convolutions [65] allows the network to adjust the receptive field by considering the current position of an object. Hence, the author leverages the deformable convolution to perform the task of structural recognition of tables. The exercise of table segmentation is operated as an object detection problem in this research. Deformable Faster R-CNN is used in DeepTabStR, where the traditional ROI-pooling layer is replaced with a deformable ROI-pooling layer. Another important point is highlighted in this research that there still exists room for improvement in the area of structural analysis of tables having inconsistent layouts.
Dilated Convolutions
Another technique employing dilated convolutions SPLERGE (Split and Merge models) is proposed by Tensmeyer et al. [101]. Their approach consists of two separate deep learning models in which the first model defines the grid-like structure of the table whereas the second model finds out whether cells can be further spanned into multiple rows or columns. The author claims to achieve state-of-the-art performance on the ICDAR 2013 table competition dataset [66].
III-B5 Object Detection Algorithms
Inspiring from the exceptional results of object detection algorithms [73, 67], researchers in the table community have formulated the task of table structure recognition as an object detection problem.
Hashmi et al. [51] proposed a guided table structure recognition method to detect rows and columns in tables. This paper presents that the localization of rows and columns can be improved by incorporating an anchor optimization method [106]. In their proposed work, Mask R-CNN [73] is employed with optimized anchors to detect the boundaries of rows and columns. The presented work has reported state-of-the-art results on TabStructDB [50] and table structure recognition dataset of ICDAR-2013 (released by [45]).
Until now, we have discussed approaches that detect tabular rows and columns to retrieve the final structure of a table. Contrary to the previous approaches, Raja et al. [53] introduced a table structure recognition method that directly regresses the cellular boundaries. The authors employed Mask R-CNN [73] with a ResNet-101 backbone pre-trained on MS-COCO dataset [43]. In their object detection framework, dilated convolutions [107] are implemented in the region proposal network. Furthermore, the authors introduced alignment loss that also contributes to the overall loss function. Later, graph convolutional networks [108] are applied to obtain the row and column relationship between the predicted cells. The whole process is trained in an end-to-end fashion. The paper presents extensive evaluations on several publicly available datasets for the task of table structure recognition.
Another approach that directly localize the cellular boundaries in tables is presented in CascadeTabNet [48]. In this approach, tabular images are given to the Cascade Mask R-CNN [67] that predicts the cellular mask along with the classification of the table as bordered or borderless. Subsequently, individual post-processing is applied to bordered and borderless tables to retrieve the final cellular boundaries.
The system GTE proposed by Zheng et al. [52] is an end-to-end framework that not only detects the tables but recognizes the structures of tables in document images. Analogous to the approach of [48], the authors have suggested two different cell detection networks i.e: 1) For graphical ruling lines present in a table. 2) No graphical ruling lines in a table. Instead of a tabular image, a complete document image with a table mask is propagated to the classification network. Based on the predicted class, the image is passed to the appropriate cell network to retrieve the final cell boundaries.
| Literature | Method | Highlights | Limitations |
|---|---|---|---|
| Zhong et al. [32] | Attention based encoder dual decoder (Section III-C1). | a) Published a large-scale table dataset, b) The approach presents a novel evaluation metrics TEDS to evaluate table recognition methods. | The approach is not directly comparable with other state-of-the-art methods. |
| Deng et al. [109] | Encoder decoder network presented as the baseline model (Section III-C2). | a) Contributed with another large-scale dataset in the field of table understanding, b) Challenges in end-to-end table recognition are discussed in the presented work. | The proposed baseline method is not evaluated on the other publicly available table recognition datasets. |
III-C Table Recognition
As explained in Section III, the task of table recognition covers the job of table structure extraction along with extracting the text from the table cells. Relatively, less progress has been accomplished in this specific domain.
In this section, we will cover the recent experiments that have attempted the problem of table recognition. Table IV summarizes these approaches by highlighting their advantages and limitations.
III-C1 Encoder-Dual-Decoder
Recently, research on image-based table recognition proposed by Zhong et al. [32] is published. In this research, the authors proposed a new dataset known as PubTabNet which is explained in Section IV-M. The authors have attempted to resolve the problem of inferring both the structure recognition of tables and the information present in their respective cells. The writers of the paper have treated the task of structure recognition and table recognition separately. They proposed the attention-based Encoder-Dual-Decoder (EDD) architecture. The encoder extracts the essential spatial features, then the first decoder segments the table into rows and columns whereas another decoder attempts to identify the content of a table cell. In this research, a new Tree-Edit-Distance-based Similarity (TEDS) metrics is presented to evaluate the quality of cell content identification.
III-C2 Encoder Decoder Network
Another dataset TABLE2LATEX-450K333https://github.com/bloomberg/TABLE2LATEX. has been published recently in the ICDAR conference comprises of arXiv articles. Along with the dataset, Deng et al. [109] discussed the current challenges in the end-to-end table recognition and highlights the worth of a bigger dataset in this field. The creators of this dataset have also conferred the baseline models ( IM2TEX) [110] on the mentioned dataset by using an encoder-decoder architecture with an attention mechanism. IM2TEX model is implemented on OpenNMT [105]. With the probable increase in hardware capabilities of the GPUs in the future, the authors claim that this dataset will be proved as a promising contribution.
IV Datasets
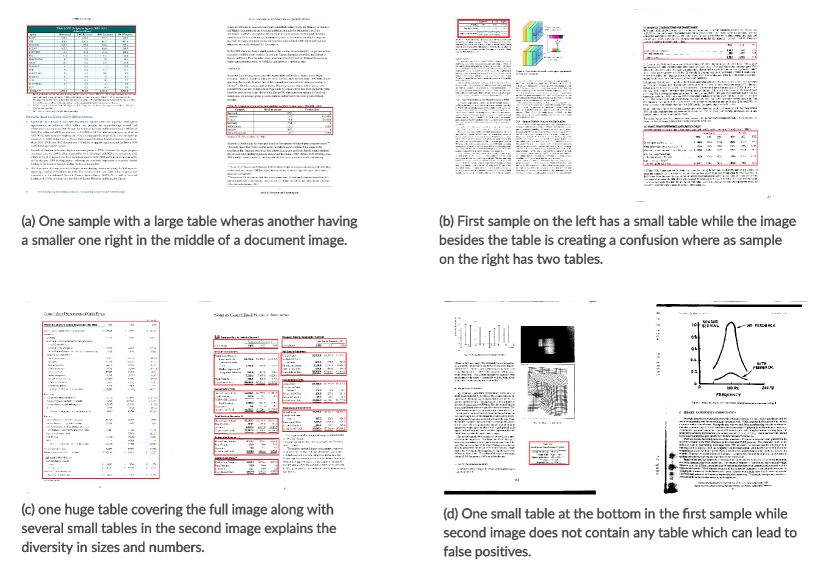
The performance of deep neural networks has a direct relation with the size of the dataset [45, 46]. In this section, we will discuss all of the well-known datasets that are publicly available to deal with the problem of table detection and table structural recognition in document images. Table V contains a comprehensive explanation of all the mentioned datasets which are employed to perform and compare detection, structural segmentation and recognition of tables in document images. Figure 8 demonstrates samples from some of the distinguished datasets in table community.
IV-A ICDAR-2013
International Conference on Document Analysis and Recognition (ICDAR) 2013 [66] is the most renowned dataset among the researchers in the table community. This dataset is published for the table competition organized by the ICDAR conference in 2013. This dataset has the annotations for both table detection and table recognition. The dataset consists of PDF files which are often converted into images to be utilized in the various approaches. The dataset contains structured tables, graphs, charts, and text as information. There are a total of 238 images in the dataset, out of which 128 incorporates tables. This dataset has been extensively used to compare state-of-the-art approaches. As mentioned in the Table V, this dataset has annotations for all of the three tasks of table understanding which are discussed in the paper. A couple of samples from this dataset are illustrated in Figure 8 (a).
IV-B ICDAR-2017-POD
This dataset [64] is also proposed for the competition of Page Object Detection (POD) in ICDAR 2017. This dataset is widely used to evaluate approaches for table detection. This dataset is fairly bigger than the ICDAR 2013 table dataset. It comprises of total 2417 images including tables, formulas, and figures. In many instances, this dataset is divided into 1600 images (731 tabular regions) which are used for training while the rest of 817 images (350 tabular regions) are employed for the testing purpose. A pair of instances of this dataset are demonstrated in Figure 8 (b). This dataset has only information for the tabular boundaries as explained in Table V.
IV-C UNLV
The UNLV dataset [2] is a recognized dataset in the field of document image analysis. This dataset composed of scanned document images from various sources like financial reports, magazines, and research papers having diverse tabular layouts. Although the dataset contains approximately 10,000 images, only 427 images contain tabular regions. Frequently, these 427 images have been used to conduct various experiments in the research community. This dataset has been used for all the three tasks of table analysis which are discussed in the paper. Figure 8 (c) illustrates a couple of samples from this dataset.
IV-D UW3
UW3 [112] is another popular dataset for researchers working in the area of document image analysis. This dataset contains scanned documents from books and magazines. There are approximately 1600 scanned document images out of which only 165 images have table regions. Annotated table coordinates are present in the XML format. Two samples from this dataset are demonstrated in Figure 8 (d). Although this dataset has limited number of tabular regions, it has annotations for all the three problems of table understanding that are discussed in the paper.
IV-E ICDAR-2019
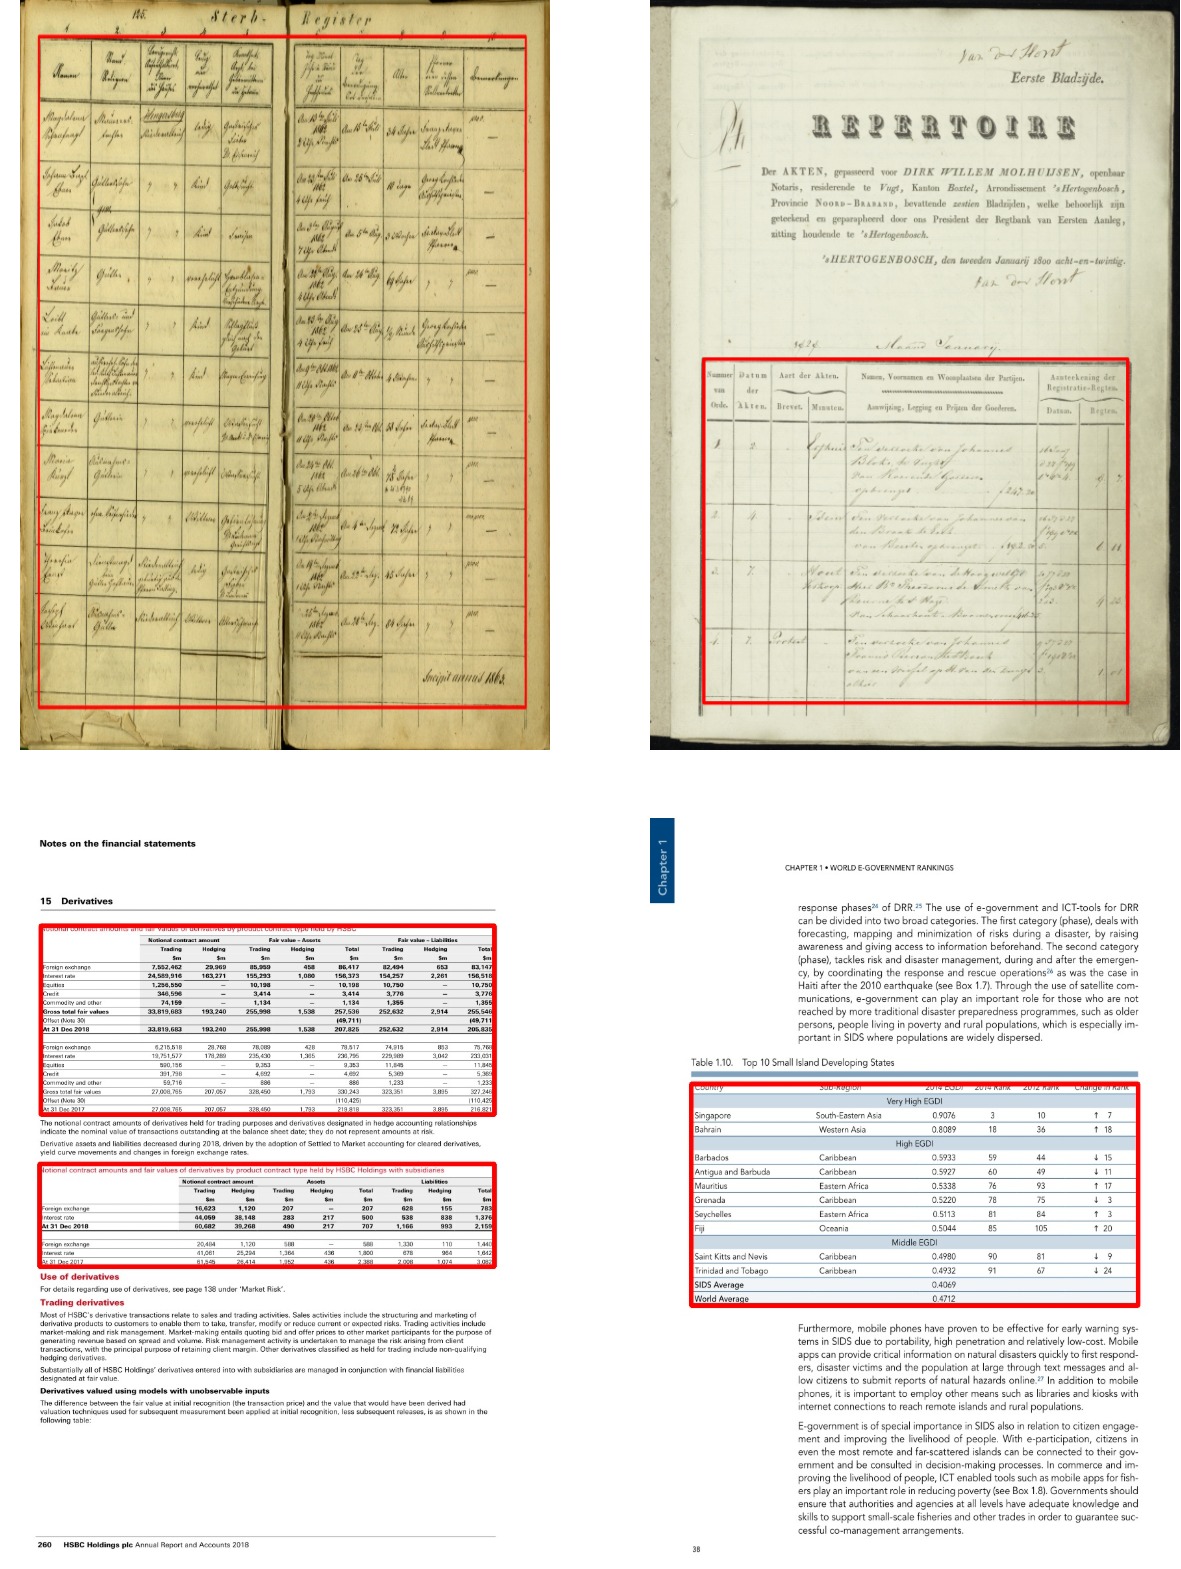
Recently, Competition on Table Detection and Recognition (cTDaR) [80] is carried out in ICDAR 2019. In the competition, two new datasets are proposed: modern and historical datasets. The modern dataset contains samples from scientific papers, forms, and financial documents. Whereas the archival dataset includes images from hand-written accounting ledgers, schedules of train, simple tabular prints from old books, and many more. The prescribed train-test split for detecting tables in the modern dataset is 600 images for training while 240 images for the test. Similarly, for the historical dataset 600 images for the training and 199 images for the testing part are the recommended data distribution. As summarized in Table V, the dataset has information for tabular boundaries and annotations for the cell area as well. This novel dataset is challenging in nature because it contains both modern and historical (archived) document images. This dataset will be used to evaluate the robustness of table analysis methods. In order to understand the diversity, a couple of samples from both the historical and modern datasets are depicted in Figure 9.
IV-F Marmot
Not long ago, Marmot 444http://www.icst.pku.edu.cn/cpdp/sjzy/index.htm is one of the largest publicly available datasets and extensively used by the researchers in the area of table understanding. This dataset has been proposed by the Institute of Computer Science and Technology (Peking University) and later explained by Fang et al. [3]. There are 2000 images in the dataset composed of English and Chinese conference papers from 1970 to 2011. The dataset is highly useful for training the networks due to having diverse and very complex page layouts. There is a roughly 1:1 ratio between positive to negative images in the dataset. Some occasions of incorrect ground-truth annotations have been reported in the past which are later cleaned by Schreiber et al. [45]. As mentioned in Table V, this dataset has annotations for the tabular boundaries and it is widely exploited to train deep neural networks for table detection.
IV-G TableBank
In early 2019, Minghao et al. [62] realized the need for large datasets in the table community and published TableBank, a dataset comprising of 417 thousand labeled images having tabular information. This dataset has been collected by crawling over documents available online in .docx format. Another source of data for this dataset is LaTeX documents which were collected from the database of arXiv 555https://arxiv.org. The publishers of this dataset argue that this contribution will facilitate the researchers to leverage the power of deep learning and fine-tuning methods. The authors claim that this dataset can be used for both table detection and structural recognition tasks. However, we are unable to find annotations for structural recognition in the dataset 666https://github.com/doc-analysis/TableBank. Important information for the dataset is summarized in Table V.
IV-H TabStructDB
In the ICDAR conference 2019, along with the table competition [80], other researchers have also published new datasets in the field of table analysis. One of the dataset known as TabStructDB777https://bit.ly/2XonOEx is published by Siddiqui et al. [50]. Since the ICDAR-2017-POD dataset [64] has only information for the tabular boundaries, the author leverages this dataset and annotated them with structural information comprising of boundaries of respective rows and columns in the table. To maintain consistency, the authors have also kept the same dataset split as mentioned in [80]. Significant information regarding the dataset is summarized in Table V. Since this dataset provides information regarding the boundaries of rows and columns, it facilitates the researchers to treat the task of table structure recognition as object detection or semantic segmentation problem.
IV-I TABLE2LATEX-450K
Another large dataset that is published in the recent ICDAR conference is TABLE2LATEX-450K [109]. The dataset contains 450 thousand annotated tables along with their corresponding images. This huge dataset is constructed by crawling over the arXiv articles from the year 1991 to 2016 and all the LaTeX source documents were downloaded. After the extraction of source code and subsequent refinement, the high-quality labeled dataset is obtained. As mentioned in Table V, the dataset contains annotations for the structural segmentation of tables and the content of table cells. Along with the dataset, publishers have made all the pre-processing scripts publicly available888https://github.com/bloomberg/TABLE2LATEX.. This dataset is an important contribution to tackle the problem of table structural segmentation and table recognition in document images because it enables the researchers to train the massive deep learning architectures from scratch which can be further fine-tuned on relatively smaller datasets.
| Dataset | TD | TSR | TR | # Samples | Image Type | Location |
| ICDAR-2013 [66] (Section IV-A) | ✓ | ✓ | ✓ | 238 | Scanned | http://www.tamirhassan.com/html/dataset.html |
| ICDAR-2017-POD[64] (Section IV-B) | ✓ | ✗ | ✗ | 2.4K | Scanned | http://www.icst.pku.edu.cn/cpdp |
| ICDAR-2019[80] (Section IV-E) | ✓ | ✓ | ✗ | 3.6K | Scanned | https://zenodo.org/record/2649217 |
| UNLV [2] (Section IV-C) | ✓ | ✓ | ✓ | 427 | Scanned | https://drive.google.com/file/d/ |
| Marmot [3] (Section IV-F) | ✓ | ✗ | ✗ | 958 | Scanned | http://www.icst.pku.edu.cn/cpdp/sjzy/ |
| UW3 [112] (Section IV-D) | ✓ | ✓ | ✓ | 165 | Scanned | http://tc11.cvc.uab.es/datasets/DFKITGT2010_1/ |
| TableBank [62] (Section IV-G) | ✓ | ✓ | ✗ | K, K (TSR) | Scanned | https://github.com/doc-analysis/TableBank |
| TabStructDB [50] (Section IV-H) | ✗ | ✓ | ✗ | 2.4K | Scanned | https://bit.ly/2XonOEx |
| TABLE2LATEX [109] (Section IV-I) | ✗ | ✓ | ✓ | 450K | Scanned | https://github.com/bloomberg/TABLE2LATEX |
| SciTSR [98] (Section IV-J) | ✗ | ✓ | ✓ | 15K | Scanned | https://github.com/Academic-Hammer/SciTSR |
| DeepFigures [4] (Section IV-K) | ✓ | ✗ | ✗ | 1.4M | Scanned | https://s3-us-west-2.amazonaws.com/ai2-s2-research-public/ |
| RVL-CDIP (Subset) (Section IV-L) [87] | ✓ | ✗ | ✗ | 518 | Scanned | https://zenodo.org/record/3257319 |
| PubTabNet [32] (Section IV-M) | ✗ | ✓ | ✓ | 568K | Scanned | https://github.com/ibm-aur-nlp/PubTabNet |
| IIT-AR-13k [113] (Section IV-N) | ✓ | ✗ | ✗ | 13K | Scanned | http://cvit.iiit.ac.in/usodi/iiitar13k.php |
| CamCap [21] (Section IV-O) | ✓ | ✓ | ✗ | 75 | Camera-captured | http://ispl.snu.ac.kr/ cusisi/dataset.zip |
IV-J SciTSR
SciTSR is another dataset released in 2019 by Zewen, et al. [98]. According to the authors, this is one of the largest publicly available dataset for the task of table structure recognition 999https://github.com/Academic-Hammer/SciTSR. The dataset consists of 15 thousands tables in PDF format along with its annotations. The dataset is constructed by crawling LaTeX source files from the arXiv. Roughly 25% of the dataset consists of complicated tables that span into multiple rows or columns. This dataset has annotations for table structural segmentation and table recognition as summarized in Table V. Because of having complex tabular structures, this dataset can be exploited to improve state-of-the-art systems dealing with structural segmentation and recognition of tables having complicated layouts.
IV-K DeepFigures
Based on our knowledge, DeepFigures [4] is the biggest dataset publicly available to perform the task of table detection. The dataset contains over 1.4 million documents along with their corresponding bounding boxes of tables and figures. The authors leverage the scientific articles available online on the arXiv and PubMed databases to develop the dataset. The ground truth of the dataset 101010https://s3-us-west-2.amazonaws.com/ai2-s2-research-public/deepfigures/jcdl-deepfigures-labels.tar.gz is available in XML format. As highlighted in Table V, this dataset only contains bounding boxes for the tables. In order to completely exploit deep neural networks for the problem of table detection, this large-scale dataset can be treated as a base dataset to implement closer domain fine-tuning techniques.
IV-L RVL-CDIP (Subset)
The RVL-CDIP (Ryerson Vision Lab Complex Document Information Processing) [89] is a renowned dataset in the document analysis community. It contains 400 thousand images equally distributed into 16 classes. Pau et al. [87] leverages the RVL-CDIP dataset by annotating its 518 invoices. The dataset 111111https://zenodo.org/record/3257319 has been made publicly available for the task of table detection. The dataset has only annotations for the tabular boundaries as mentioned in Table V. This subset of the actual RVL-CDIP dataset [89] is an important contribution for evaluating table detection systems specifically designed for invoice document images.
IV-M PubTabNet
PubTabNet is another dataset published in December 2019 by Zhong et al. [32]. PubTabNet121212https://github.com/ibm-aur-nlp/PubTabNet is currently the largest publicly available dataset that contains over 568 thousand images with their corresponding structural information of tables and content present in each cell. This dataset is created by collecting scientific articles from PubMed CentralTM Open Access Subset (PMCOA). The ground truth format of this dataset is in HTML which can be useful for web applications. The authors are confident that this dataset will boost the performance of information extraction systems in the table and they are also planning to publish ground truth for the respective table cells in the future. The important information for the dataset is summarized in Table V. Along with the TABLE2LATEX-450K dataset [109], PubTabNet [32] allows researchers the independence of training complete parameters of the deep neural networks on the task of table structure extraction or table recognition.
IV-N IIIT-AR-13K
Recently, Mondal et al. [113] contributed to the community of graphical page object detection by introducing a novel dataset known as IIT-AR-13K. The authors generated this dataset by collecting publicly available annual reports written in English and other languages. The authors claim that this is the largest manually annotated dataset published for solving the problem of graphical page object detection. Apart from the tables, the dataset includes annotations for figures, natural images, logos, and signatures. The publishers of this dataset have provided the train, validation, and test splits for various tasks of page object detection. For table detection, 11000 samples are used for training, whereas 2000 and 3000 samples are assigned for validation and testing purposes, respectively.
IV-O CamCap
CamCap is the last dataset which we have included in this survey consists of the camera-captured images. This dataset is proposed by Seo et al.[21]. It contains only 85 images (38 tables on curved surfaces having 1295 cells and 47 tables on the planar surfaces consisting of 1162 cells). Figure 10 contains few samples from this dataset illustrating the challenges. The proposed dataset is publicly available and can be utilized for the task of table detection and table structure recognition as summarized in Table V. In order to assess the robustness of table detection methods on camera-captured document images, this dataset is an important contribution.
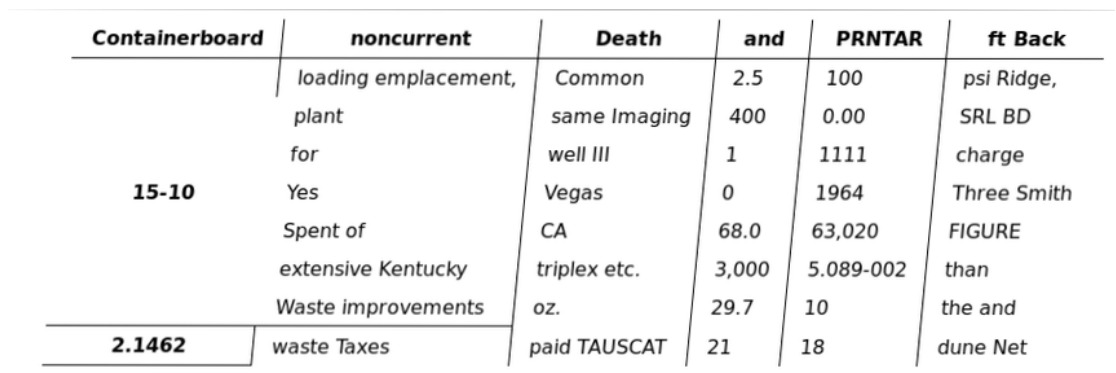
It is important to mention that Qasim et al. [96] published a method to synthetically create camera captured images from the UNLV dataset. An instance of a synthetically created camera-captured image is depicted in Figure 11.
V Evaluation
In this section, we will cover the well known evaluation metrics along with the exhaustive evaluation comparisons of all the quoted methodologies from Section III.
V-A Evaluation Metrics
Before throwing some light on the performance evaluation, it is appropriate to talk about the evaluation metrics first which are adopted to assess the performances of discussed approaches.
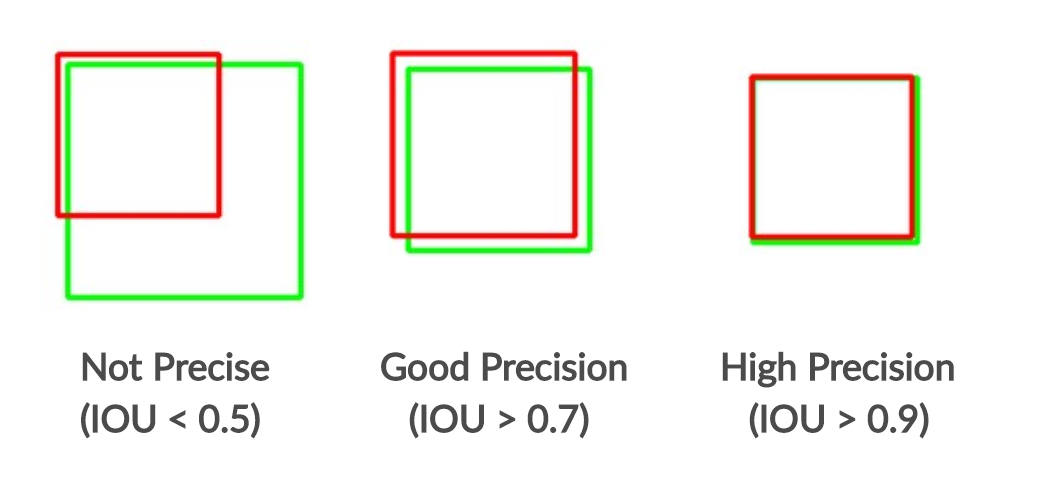
V-A1 Precision
Precision [114] is defined as the percentage of a predicted region that belongs to the ground truth. An illustration of different types of precision is explained in Figure 12. The formula for precision is mentioned below :
| (1) |
V-A2 Recall
Recall [114] is calculated as the percentage of ground truth region that is present in the predicted region. The formula for recall is explained as follows :
| (2) |
V-A3 F-Measure
F-measure [114] is calculated by taking the harmonic mean of precision and Recall . The formula for F-measure is :
| (3) |
V-A4 Intersection Over Union (IOU)
Intersection over union [115] is an important evaluation metric which is regularly employed to determine the performance of object detection algorithms. It is the measure of how much the predicted region is overlapping with the actual ground truth region. It is defined as follows :
| (4) |
V-A5 BLEU score
BLEU (Bilingual Evaluation Understudy) [116] is an evaluation method utilized to compare in various machine translation problems. After comparing the predicted text with the actual ground truth, a score is calculated. The BLEU metric scores the prediction from 0 to 1 where 1 is the optimal score for the predicted text.
V-B Evaluations for Table Detection
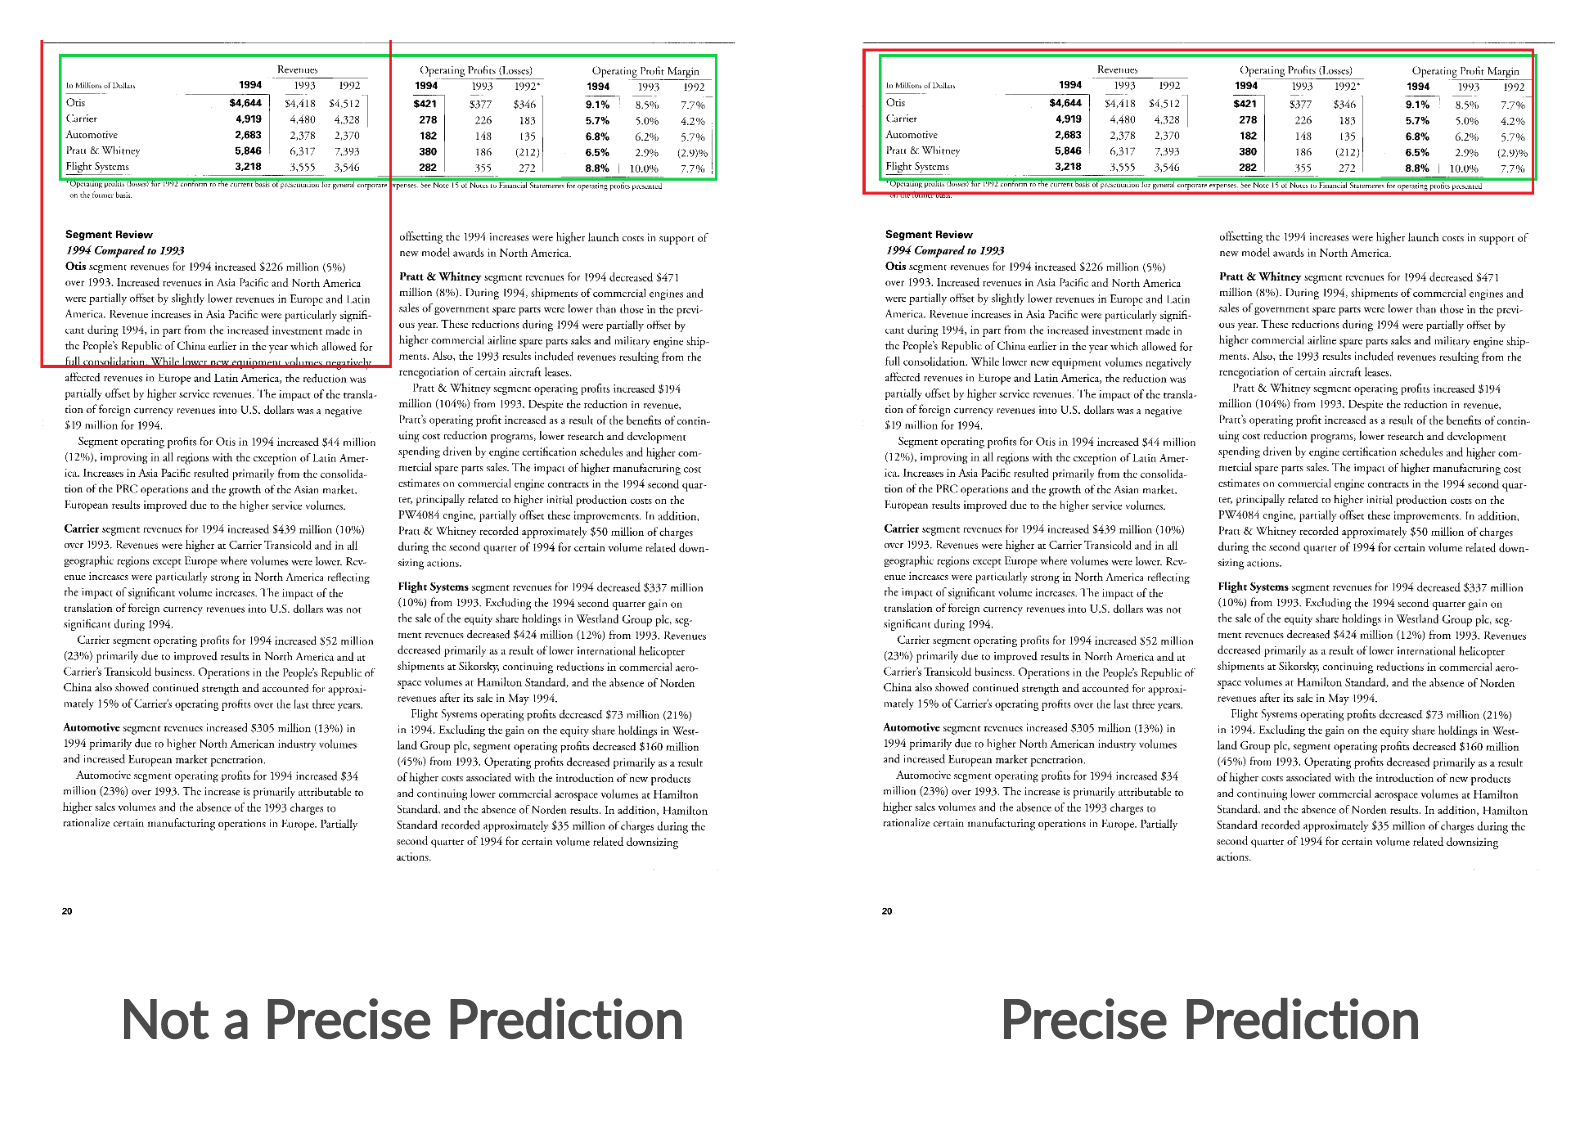
The problem of table detection is to distinguish the tabular area in the document image and regress the coordinates of a bounding box that is classified as a tabular region. Table VI explains the performance comparison of various table detection methods that have been discussed in detail in Section III-A. In most of the cases, the performance of the table detection methods is evaluated on ICDAR-2013 [66], ICDAR-2017-POD [64] and UNLV [2] datasets.
The threshold of Intersection Over Union (IOU) for calculating precision and recall is also defined in Table VI. Figure 13 explains the definition of a precise and imprecise prediction in reference to the task of table detections. Results having the highest accuracies in all respective datasets are highlighted. It is crucial to mention that some of the approaches have not quoted the threshold value for IOU; however, they have compared their results with other methods where the threshold value is defined. Hence, we have considered the same threshold value for those procedures.
We could not incorporate the results of the literature presented by Martin et al. [86] because they have not adopted any standard dataset for the comparison, and compared their novel method with logistic regression [117]. The results demonstrate that their model has surpassed the logistic regression method.
| Literature | Year | Dataset | IOU | Precision | Recall | F-Measure | Method |
| Gelani et al. [44] | 2017 | UNLV | 0.9 | 82.3 | 90.6 | 86.3 | Faster R-CNN (Section III-A1) |
| García et al. [72] | 2019 | UNLV | 0.9 | 48.0 | 49.0 | 49.0 | YOLO (Section III-A1) |
| DeCNT [46] | 2018 | UNLV | 0.5 | 78.6 | 74.9 | 76.7 | Deformable Convolutions (Section III-A1) |
| DeepDeSRT [45] | 2017 | ICDAR-2013 | 0.5 | 97.4 | 96.1 | 96.7 | Faster R-CNN (Section III-A1) |
| Kavasidis et al. [81] | 2018 | ICDAR-2013 | 0.5 | 97.5 | 98.1 | 97.8 | Semantic Image Segmentation ( Section III-A2 ) |
| DeCNT [46] | 2018 | ICDAR-2013 | 0.5 | 99.6 | 99.6 | 99.6 | Deformable Convolutions (Section III-A1) |
| Huang et al. [47] | 2015 | ICDAR-2013 | 0.5 | 100 | 94.9 | 97.3 | YOLO (Section III-A1) |
| TableBank [62] | 2019 | ICDAR-2013 | 0.5 | 96.2 | 96.2 | 96.2 | Faster R-CNN (Section III-A1) |
| TableNet [84] | 2019 | ICDAR-2013 | 0.5 | 96.3 | 96.9 | 96.6 | Fully Convolutional Networks (Section III-A2) |
| CascadeTabNet [48] | 2020 | ICDAR-2013 | 0.5 | 100 | 100 | 100 |
Cascade Mask R-CNN
(Section III-A1) |
| GTE [52] | 2021 | ICDAR-2013 | 0.5 | - | - | 95.7 | Object Detection (Section III-A1) |
| CDeC-Net [49] | 2020 | ICDAR-2013 | 0.5 | 94.2 | 99.3 | 96.8 |
Cascade Mask R-CNN
(Section III-A1) |
| García et al. [72] | 2019 | ICDAR-2013 | 0.6 | 70.0 | 97.0 | 81.0 | Mask R-CNN (Section III-A1) |
| Li et al. [88] | 2019 | ICDAR-2017 | 0.6 | 94.4 | 94.4 | 94.4 | GANs (Section III-A4) |
| DeCNT [46] | 2018 | ICDAR-2017 | 0.6 | 97.1 | 96.5 | 96.8 | Deformable Convolutions (Section III-A1) |
| Huang et al. [47] | 2015 | ICDAR-2017 | 0.6 | 97.8 | 97.2 | 97.5 | YOLO (Section III-A1) |
| Sun et al. [63] | 2019 | ICDAR-2017 | 0.6 | 94.3 | 95.6 | 94.5 | Faster R-CNN (Section III-A1) |
| García et al. [72] | 2019 | ICDAR-2017 | 0.6 | 92.0 | 87.0 | 89.0 | Retina Net (Section III-A1) |
| CDeC-Net [49] | 2020 | ICDAR-2017 | 0.6 | 89.9 | 96.9 | 93.4 |
Cascade Mask R-CNN
(Section III-A1) |
| CascadeTabNet [48] | 2020 | ICDAR-2019 | 0.6 | - | - | 94.3 |
Cascade Mask R-CNN
(Section III-A1) |
| CDeC-Net [49] | 2020 | ICDAR-2019 | 0.6 | 93.9 | 98.0 | 95.9 |
Cascade Mask R-CNN
(Section III-A1) |
| GTE [52] | 2021 | ICDAR-2019 | 0.8 | 96.0 | 95.0 | 95.5 | Object Detection (Section III-A1) |
| Riba et al. [87] | 2019 | RVL-CDIP | 0.5 | 15.2 | 36.5 | 21.5 | Graph Neural Network (Section III-A3) |
| Literature | Year | Dataset | IOU | Average Row/Column | Method | ||
| Precision | Recall | F-Measure | |||||
| DeepDeSRT [45] | 2017 | ICDAR-2013 | 0.5 | 95.9 | 87.3 | 91.4 | Fully Convolutional Networks (Section III-B1) |
| DeepTabStR [50] | 2019 | ICDAR-2013 | 0.5 | 93.1 | 93.0 | 92.9 | Deformable Convolutions (Section III-B4) |
| ReS2TIM [99] | 2019 | ICDAR-2013 | 0.5 | 92.6 | 44.7 | 60.3 | Distance based weight technique (Section III-B2) |
| Siddiqui et al. [45] | 2019 | ICDAR-2013 | 0.5 | 92.5 | 92.7 | 92.3 | Fully Convolutional Networks (Section III-B1) |
| Khan et al. [102] | 2019 | ICDAR-2013 | 0.5 | 96.9 | 90.1 | 93.3 | Bi-directional Recurrent Neural Networks (Section III-B3) |
| TableNet [84] | 2019 | ICDAR-2013 | 0.5 | 92.1 | 89.9 | 90.1 | Fully Convolutional Networks (Section III-B1) |
| Hashmi et al. [51] | 2021 | ICDAR-2013 | 0.5 | 95.4 | 95.6 | 95.5 | Object Detection (Section III-B5) |
| Raja et al. [102] | 2020 | ICDAR-2013 | 0.5 | 92.7 | 91.1 | 91.9 | Object Detection (Section III-B5) |
| Tensmeyer et al. [101] | 2019 | ICDAR-2013 | 0.5 | 95.8 | 94.6 | 95.2 | Dilated Convolutions (Section III-B4) |
| GraphTSR [98] | 2019 | ICDAR-2013 | 0.5 | 88.5 | 86.0 | 87.2 | Fully Convolutional Networks (Section III-B1) |
| Literature | Year | Dataset | F-Measure (0.6) | F-Measure (0.8) | Method |
|---|---|---|---|---|---|
| CascadeTabNet [48] | 2020 | ICDAR-2019 | 43.8 | 19.0 | Object detection (Section III-B5) |
| GTE [52] | 2021 | ICDAR-2019 | 38.5 | - | Object detection (Section III-B5) |
| Zou et al. [94] | 2020 | ICDAR-2019 | 13.1 | 1.1 | Fully Convolutional Networks (Section III-B1) |
Another method by Qasim et al. [96] which is explained in Section III-A3 did not use any well known dataset to evaluate their approach. However, they have tested their approach on the synthetic dataset by using two types of graph neural networks which are [118] and [119]. Along with the graph neural networks, a fully convolutional neural network was used to conduct a fair comparison. After an exhaustive evaluation, the fusion of graph neural network and the convolutional neural network has surpassed all the other methods with a perfect matching accuracy of 96.9. The approach which uses only graph neural networks has delivered perfect matching accuracy of 65.6, which still exceeds the accuracy of the method using only fully convolutional neural networks.
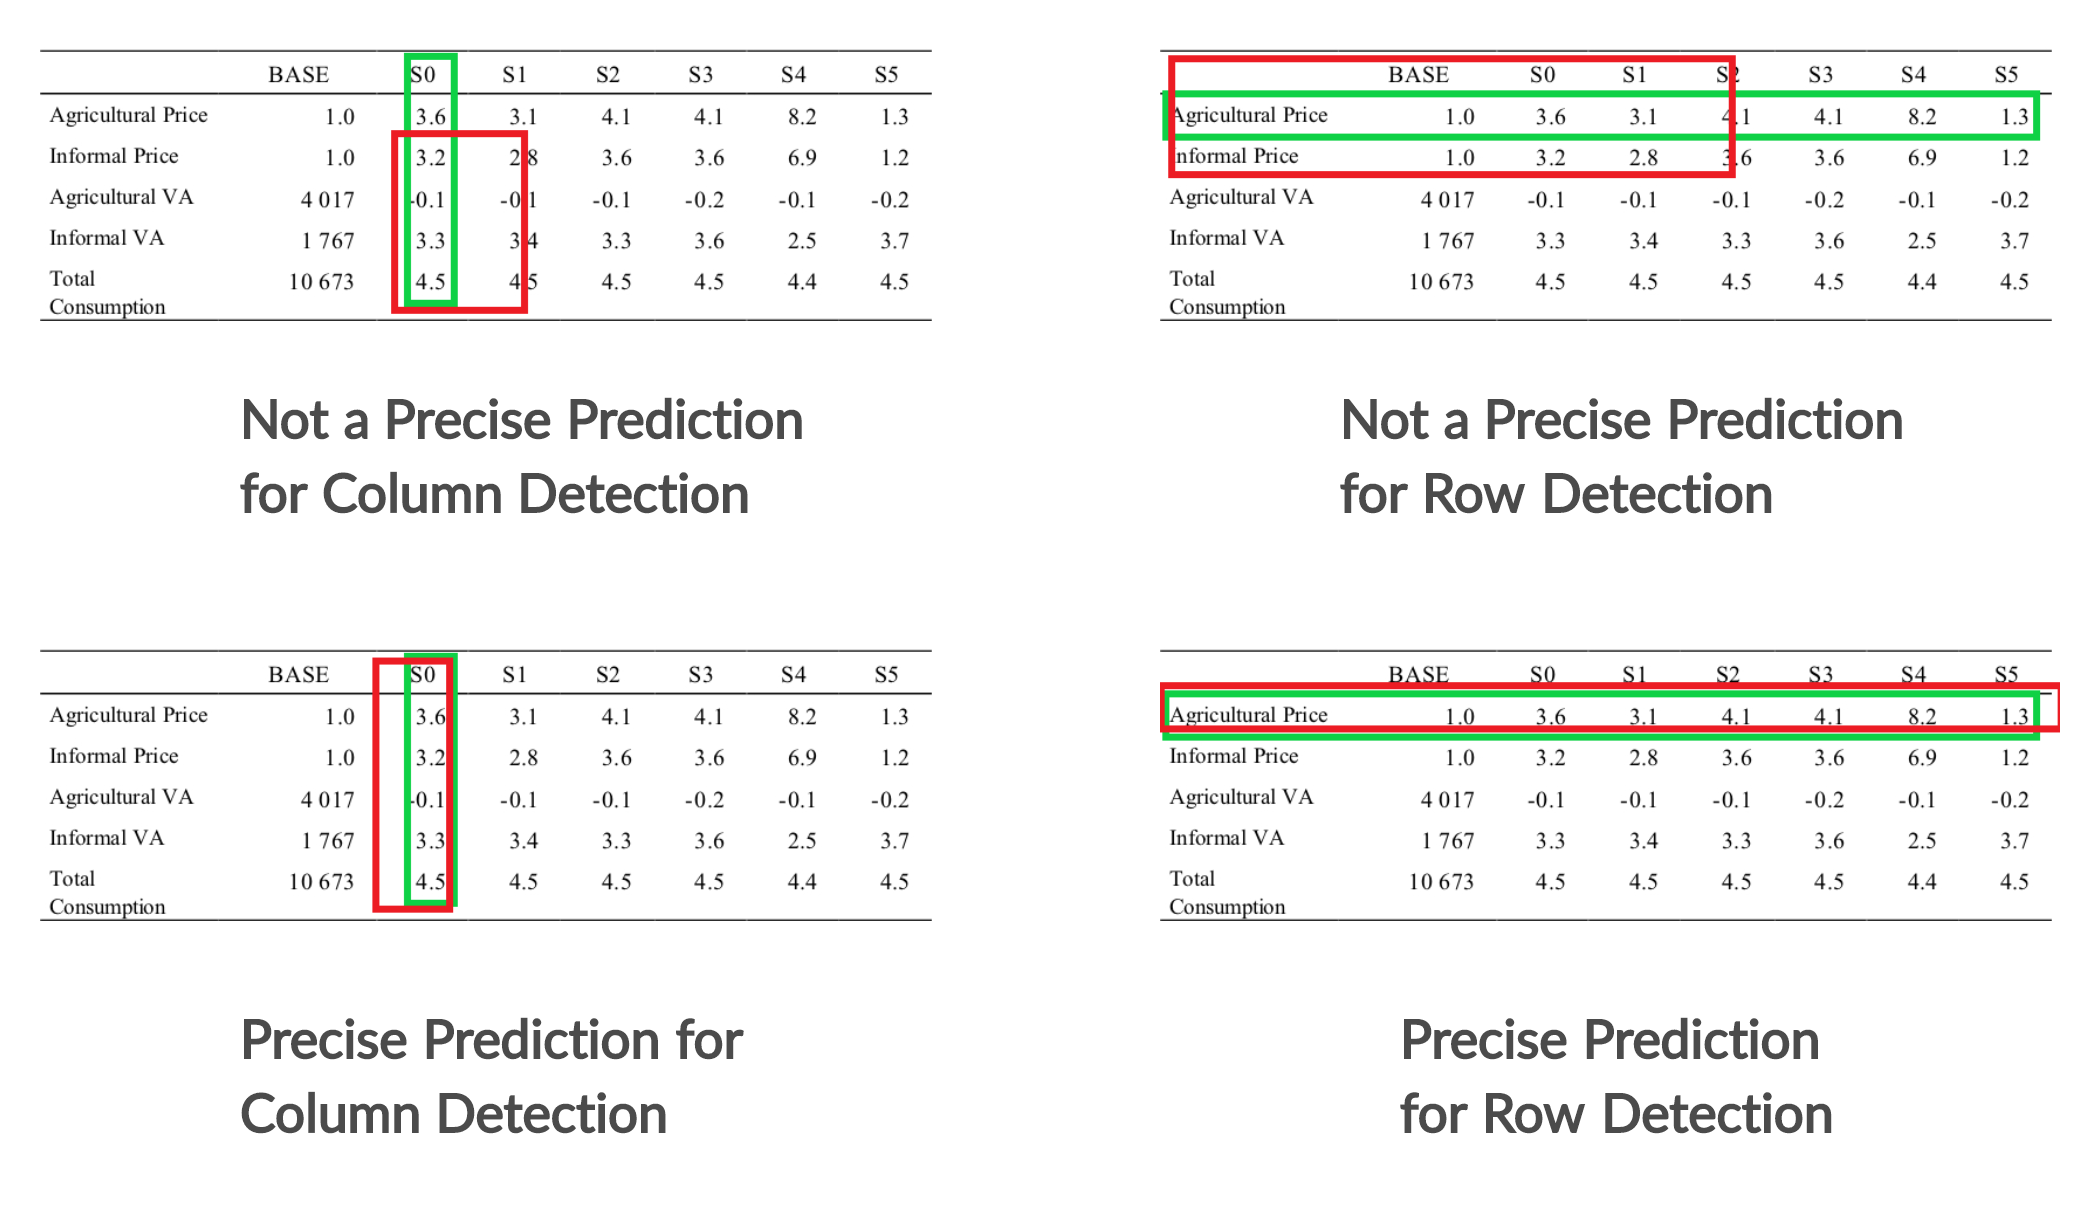
V-C Evaluations for Table Structural Segmentation
The task of table structural segmentation is evaluated based on how accurate the rows or columns of the tables are separated [45, 50, 45]. Figure 14 illustrates the meaning of an imprecise and precise prediction for both of the tasks of the row and column detections. Table VII summarizes the performance comparison of numerous approaches which have executed the task of table structural segmentation on the ICDAR 2013 table competition dataset [66]. The results with the highest accuracies are highlighted in the table. It is important to mention that apart from the methods mentioned in Table VII, there are two other approaches which are discussed in section III-B. We could not incorporate their results in Table VII because the approaches are neither evaluated on any standard dataset nor utilized the standard evaluation metrics. However, their results are explained in the following paragraph.
| Literature | Year | Dataset | Evaluation Metric | Score | Method |
|---|---|---|---|---|---|
| Deng et al. [109] | 2019 | TABLE2LATEX-450K | BLEU | 40.3 | Encoder Decoder Network (Section III-C2) |
| Zhong et al. [32] | 2020 | PubTabNet | TEDS [32] | 88.3 | Encoder Dual Decoder Model (Section III-C1) |
The creators of the TableBank [62] have proposed baseline model for table structure segmentation along with table detection. To examine the performance of their baseline model for table structure recognition on TableBank dataset, they have employed the 4-gram BLEU score [116] as the evaluation metric. The result shows that when their Image-to-Text model is trained on the Word+Latex dataset, it gives the BLEU score of 0.7382 and also generalizes better in all the cases.
V-D Evaluations for Table Recognition
Table recognition consists of both segmenting the structure of tables and extracting the information from the cells. In this section, we will present the evaluations of the couple of approaches that are discussed above in Section III-C.
In the study of challenges in end-to-end neural scientific table recognition, the author Deng et al. [109] have tested their image-to-text model on the TABLE2LATEX-450K dataset. The model obtained exact match accuracy with a BLEU score of 40.33. The authors have also examined the model that how well it identifies the structure of the table. It has been concluded that the model encounters problems in case of complex structures having multi-column (rows).
Another research by Zhong et al. [32] has also carried out experiments on the task of table recognition. To evaluate the observations, they have come up with their own evaluation metric called TEDS in which the similarity is calculated using the same tree edit distance proposed by Pawlik et al. [120]. Their Encoder-Dual-Decoder (EDD) model has beaten all the other baseline models with the TEDS score of on the PubTabNet dataset.
The results of both of the discussed methods are summarized in Table IX. It is important to mention that the presented approaches are not directly comparable to each other because of the disparate datasets and evaluation metrics utilized in these techniques.
VI Conclusion
Table analysis is a crucial and well-studied problem in the area of document analysis community. The exploitation of deep learning concepts have remarkably revolutionized the problem of table understanding and has set new standards. In this review paper, we have discussed some recent contemporary procedures that have applied the notions of deep learning to progress the task of information extraction from tables in document images. In Section III, we have explained the approaches that have exploited deep learning to perform table detection, structure segmentation, and recognition. Figure 5 and Figure 7 illustrate the most and least famous adopted methods for table detection and structure segmentation respectively. We have summarized all the publicly available datasets along with their access information in Table V.
In Tables VI, VII and IX, we have provided an exhaustive performance comparison of the discussed approaches on various datasets. We have discussed that state-of-the-art methods for table detection on well known publicly available datasets have achieved near perfection results. Once the tabular area is detected, there comes a task of structural segmentation of tables and table recognition subsequently. After examining several recent approaches, we believe that there is still room left for improvement in both of these areas.
VII Future Work
While analyzing and comparing miscellaneous methodologies, we have noticed some aspects that should be highlighted so they can be taken care of in future works. For table detection, one of the most exploited evaluation metrics is IOU [45, 46]. The majority of approaches that are discussed in this paper have compared their methods with the previous state-of-the-art methods on the basis of precision, recall, and F-measure [114]. These three metrics are calculated on a specific IOU threshold established by the authors. We strongly believe that the threshold value for IOU needs to be standardized in order to have an impartial comparison. Another important factor that we have seen missing in several research papers is about mentioning the performance time while comparing different methods. In a few cases, semantic segmentation is proven to outperform other methods for table structure segmentation in terms of accuracy. However, the description about execution time is not evident.
So far, traditional approaches have been exploited to detect tables from the camera-captured document images [21]. The power of deep learning methods could be leveraged to improve the state-of-the-art table analysis systems in this domain. Deep learning leverages huge datasets [45]. Recently, large publicly available datasets [62, 98, 32] have been published that provide annotations not only for the table structure extraction but also for table detection. We expect that these contemporary datasets will be tested. The results of table segmentation and recognition methods can be further enhanced by exploiting the blend of various deep learning concepts with recently published datasets. To the best of our knowledge, reinforcement learning [121, 122] has not been investigated in the domain of table analysis but some work exists for information extraction from document images [123]. Nonetheless, it is an exciting and promising future direction for table detection and recognition as well.
References
- [1] S. Sarawagi, Information extraction. Now Publishers Inc, 2008.
- [2] A. Shahab, F. Shafait, T. Kieninger, and A. Dengel, “An open approach towards the benchmarking of table structure recognition systems,” in Proceedings of the 9th IAPR International Workshop on Document Analysis Systems, 2010, pp. 113–120.
- [3] J. Fang, X. Tao, Z. Tang, R. Qiu, and Y. Liu, “Dataset, ground-truth and performance metrics for table detection evaluation,” in 2012 10th IAPR International Workshop on Document Analysis Systems. IEEE, 2012, pp. 445–449.
- [4] Y.-S. Kim and K.-H. Lee, “Extracting logical structures from html tables,” Computer Standards & Interfaces, vol. 30, no. 5, pp. 296–308, 2008.
- [5] H.-H. Chen, S.-C. Tsai, and J.-H. Tsai, “Mining tables from large scale html texts,” in COLING 2000 Volume 1: The 18th International Conference on Computational Linguistics, 2000.
- [6] H. Masuda, S. Tsukamoto, S. Yasutomi, and H. Nakagawa, “Recognition of html table structure,” in The First International Joint Conference on Natural Language Processing (IJCNLP-04), 2004, pp. 183–188.
- [7] C.-Y. Tyan, H. K. Huang, and T. Niki, “Generator for document with html tagged table having data elements which preserve layout relationships of information in bitmap image of original document,” Apr. 6 1999, uS Patent 5,893,127.
- [8] T. Kieninger and A. Dengel, “A paper-to-html table converting system,” in Proceedings of document analysis systems (DAS), vol. 98, 1998, pp. 356–365.
- [9] T. G. Kieninger, “Table structure recognition based on robust block segmentation,” in Document Recognition V, vol. 3305. International Society for Optics and Photonics, 1998, pp. 22–32.
- [10] T. Kieninger and A. Dengel, “Applying the t-recs table recognition system to the business letter domain,” in Proceedings of Sixth International Conference on Document Analysis and Recognition. IEEE, 2001, pp. 518–522.
- [11] F. Cesarini, S. Marinai, L. Sarti, and G. Soda, “Trainable table location in document images,” in Object recognition supported by user interaction for service robots, vol. 3. IEEE, 2002, pp. 236–240.
- [12] A. C. e Silva, “Learning rich hidden markov models in document analysis: Table location,” in 2009 10th International Conference on Document Analysis and Recognition. IEEE, 2009, pp. 843–847.
- [13] C. Cortes and V. Vapnik, “Support-vector networks,” Machine learning, vol. 20, no. 3, pp. 273–297, 1995.
- [14] T. Kasar, P. Barlas, S. Adam, C. Chatelain, and T. Paquet, “Learning to detect tables in scanned document images using line information,” in 2013 12th International Conference on Document Analysis and Recognition. IEEE, 2013, pp. 1185–1189.
- [15] M. Fan and D. S. Kim, “Detecting table region in pdf documents using distant supervision,” arXiv preprint arXiv:1506.08891, 2015.
- [16] D. N. Tran, T. A. Tran, A. Oh, S. H. Kim, and I. S. Na, “Table detection from document image using vertical arrangement of text blocks,” International Journal of Contents, vol. 11, no. 4, pp. 77–85, 2015.
- [17] Y. Wang, I. T. Phillips, and R. M. Haralick, “Table structure understanding and its performance evaluation,” Pattern recognition, vol. 37, no. 7, pp. 1479–1497, 2004.
- [18] G. NAGY, “Hierarchical representation of optically scanned documents,” in Proc. 7th Int. Conf. Pattern Recognition, 1984, pp. 347–349.
- [19] A. Shigarov, A. Mikhailov, and A. Altaev, “Configurable table structure recognition in untagged pdf documents,” in Proceedings of the 2016 ACM Symposium on Document Engineering, 2016, pp. 119–122.
- [20] A. Krizhevsky, I. Sutskever, and G. E. Hinton, “Imagenet classification with deep convolutional neural networks,” Advances in neural information processing systems, vol. 25, pp. 1097–1105, 2012.
- [21] W. Seo, H. I. Koo, and N. I. Cho, “Junction-based table detection in camera-captured document images,” International Journal on Document Analysis and Recognition (IJDAR), vol. 18, no. 1, pp. 47–57, 2015.
- [22] E. R. Dougherty, Electronic imaging technology. SPIE Press, 1999, vol. 60.
- [23] J. C. Handley, “Table analysis for multiline cell identification,” in Document Recognition and Retrieval VIII, vol. 4307. International Society for Optics and Photonics, 2000, pp. 34–43.
- [24] D. Lopresti and G. Nagy, “Automated table processing: An (opinionated) survey,” in Proceedings of the Third IAPR Workshop on Graphics Recognition, 1999, pp. 109–134.
- [25] ——, “A tabular survey of automated table processing,” in International Workshop on Graphics Recognition. Springer, 1999, pp. 93–120.
- [26] R. Zanibbi, D. Blostein, and J. R. Cordy, “A survey of table recognition,” Document Analysis and Recognition, vol. 7, no. 1, pp. 1–16, 2004.
- [27] D. W. Embley, M. Hurst, D. Lopresti, and G. Nagy, “Table-processing paradigms: a research survey,” International Journal of Document Analysis and Recognition (IJDAR), vol. 8, no. 2-3, pp. 66–86, 2006.
- [28] M. F. Hurst, “The interpretation of tables in texts,” Ph.D. dissertation, University of Edinburgh, 2000.
- [29] A. C. e Silva, A. M. Jorge, and L. Torgo, “Design of an end-to-end method to extract information from tables,” International Journal of Document Analysis and Recognition (IJDAR), vol. 8, no. 2-3, pp. 144–171, 2006.
- [30] B. Coüasnon and A. Lemaitre, “Recognition of tables and forms,” 2014.
- [31] S. Khusro, A. Latif, and I. Ullah, “On methods and tools of table detection, extraction and annotation in pdf documents,” Journal of Information Science, vol. 41, no. 1, pp. 41–57, 2015.
- [32] X. Zhong, E. ShafieiBavani, and A. J. Yepes, “Image-based table recognition: data, model, and evaluation,” arXiv preprint arXiv:1911.10683, 2019.
- [33] J. Hu, R. S. Kashi, D. Lopresti, and G. T. Wilfong, “Evaluating the performance of table processing algorithms,” International Journal on Document Analysis and Recognition, vol. 4, no. 3, pp. 140–153, 2002.
- [34] L. Hao, L. Gao, X. Yi, and Z. Tang, “A table detection method for pdf documents based on convolutional neural networks,” in 2016 12th IAPR Workshop on Document Analysis Systems (DAS). IEEE, 2016, pp. 287–292.
- [35] L. Torrey and J. Shavlik, “Transfer learning,” in Handbook of research on machine learning applications and trends: algorithms, methods, and techniques. IGI global, 2010, pp. 242–264.
- [36] Y. Zhu, Y. Chen, Z. Lu, S. Pan, G.-R. Xue, Y. Yu, and Q. Yang, “Heterogeneous transfer learning for image classification,” in Proceedings of the AAAI Conference on Artificial Intelligence, vol. 25, no. 1, 2011.
- [37] B. Kulis, K. Saenko, and T. Darrell, “What you saw is not what you get: Domain adaptation using asymmetric kernel transforms,” in CVPR 2011. IEEE, 2011, pp. 1785–1792.
- [38] C. Wang and S. Mahadevan, “Heterogeneous domain adaptation using manifold alignment,” in IJCAI proceedings-international joint conference on artificial intelligence, vol. 22, no. 1, 2011, p. 1541.
- [39] W. Li, L. Duan, D. Xu, and I. W. Tsang, “Learning with augmented features for supervised and semi-supervised heterogeneous domain adaptation,” IEEE transactions on pattern analysis and machine intelligence, vol. 36, no. 6, pp. 1134–1148, 2013.
- [40] M. Loey, F. Smarandache, and N. E. M Khalifa, “Within the lack of chest covid-19 x-ray dataset: a novel detection model based on gan and deep transfer learning,” Symmetry, vol. 12, no. 4, p. 651, 2020.
- [41] M. Z. Afzal, S. Capobianco, M. I. Malik, S. Marinai, T. M. Breuel, A. Dengel, and M. Liwicki, “Deepdocclassifier: Document classification with deep convolutional neural network,” in 2015 13th international conference on document analysis and recognition (ICDAR). IEEE, 2015, pp. 1111–1115.
- [42] A. Das, S. Roy, U. Bhattacharya, and S. K. Parui, “Document image classification with intra-domain transfer learning and stacked generalization of deep convolutional neural networks,” in 2018 24th International Conference on Pattern Recognition (ICPR). IEEE, 2018, pp. 3180–3185.
- [43] T.-Y. Lin, M. Maire, S. Belongie, J. Hays, P. Perona, D. Ramanan, P. Dollár, and C. L. Zitnick, “Microsoft coco: Common objects in context,” in European conference on computer vision. Springer, 2014, pp. 740–755.
- [44] A. Gilani, S. R. Qasim, I. Malik, and F. Shafait, “Table detection using deep learning,” in 2017 14th IAPR international conference on document analysis and recognition (ICDAR), vol. 1. IEEE, 2017, pp. 771–776.
- [45] S. Schreiber, S. Agne, I. Wolf, A. Dengel, and S. Ahmed, “Deepdesrt: Deep learning for detection and structure recognition of tables in document images,” in 2017 14th IAPR international conference on document analysis and recognition (ICDAR), vol. 1. IEEE, 2017, pp. 1162–1167.
- [46] S. A. Siddiqui, M. I. Malik, S. Agne, A. Dengel, and S. Ahmed, “Decnt: Deep deformable cnn for table detection,” IEEE Access, vol. 6, pp. 74 151–74 161, 2018.
- [47] Y. Huang, Q. Yan, Y. Li, Y. Chen, X. Wang, L. Gao, and Z. Tang, “A yolo-based table detection method,” in 2019 International Conference on Document Analysis and Recognition (ICDAR). IEEE, 2019, pp. 813–818.
- [48] D. Prasad, A. Gadpal, K. Kapadni, M. Visave, and K. Sultanpure, “Cascadetabnet: An approach for end to end table detection and structure recognition from image-based documents,” in Proceedings of the IEEE/CVF Conference on Computer Vision and Pattern Recognition Workshops, 2020, pp. 572–573.
- [49] M. Agarwal, A. Mondal, and C. Jawahar, “Cdec-net: Composite deformable cascade network for table detection in document images,” arXiv preprint arXiv:2008.10831, 2020.
- [50] S. A. Siddiqui, I. A. Fateh, S. T. R. Rizvi, A. Dengel, and S. Ahmed, “Deeptabstr: Deep learning based table structure recognition,” in 2019 International Conference on Document Analysis and Recognition (ICDAR). IEEE, 2019, pp. 1403–1409.
- [51] K. A. Hashmi, D. Stricker, M. Liwicki, M. N. Afzal, and M. Z. Afzal, “Guided table structure recognition through anchor optimization,” arXiv preprint arXiv:2104.10538, 2021.
- [52] X. Zheng, D. Burdick, L. Popa, X. Zhong, and N. X. R. Wang, “Global table extractor (gte): A framework for joint table identification and cell structure recognition using visual context,” in Proceedings of the IEEE/CVF Winter Conference on Applications of Computer Vision, 2021, pp. 697–706.
- [53] S. Raja, A. Mondal, and C. Jawahar, “Table structure recognition using top-down and bottom-up cues,” in European Conference on Computer Vision. Springer, 2020, pp. 70–86.
- [54] R. Girshick, “Fast r-cnn,” in Proceedings of the IEEE international conference on computer vision, 2015, pp. 1440–1448.
- [55] S. Ren, K. He, R. Girshick, and J. Sun, “Faster r-cnn: Towards real-time object detection with region proposal networks,” arXiv preprint arXiv:1506.01497, 2015.
- [56] H. Breu, J. Gil, D. Kirkpatrick, and M. Werman, “Linear time euclidean distance transform algorithms,” IEEE Transactions on Pattern Analysis and Machine Intelligence, vol. 17, no. 5, pp. 529–533, 1995.
- [57] R. Fabbri, L. D. F. Costa, J. C. Torelli, and O. M. Bruno, “2d euclidean distance transform algorithms: A comparative survey,” ACM Computing Surveys (CSUR), vol. 40, no. 1, pp. 1–44, 2008.
- [58] I. Ragnemalm, “The euclidean distance transform in arbitrary dimensions,” Pattern Recognition Letters, vol. 14, no. 11, pp. 883–888, 1993.
- [59] M. D. Zeiler and R. Fergus, “Visualizing and understanding convolutional networks,” in European conference on computer vision. Springer, 2014, pp. 818–833.
- [60] K. Simonyan and A. Zisserman, “Very deep convolutional networks for large-scale image recognition,” arXiv preprint arXiv:1409.1556, 2014.
- [61] M. Everingham, L. Van Gool, C. K. Williams, J. Winn, and A. Zisserman, “The pascal visual object classes (voc) challenge,” International journal of computer vision, vol. 88, no. 2, pp. 303–338, 2010.
- [62] M. Li, L. Cui, S. Huang, F. Wei, M. Zhou, and Z. Li, “Tablebank: Table benchmark for image-based table detection and recognition,” in Proceedings of The 12th Language Resources and Evaluation Conference, 2020, pp. 1918–1925.
- [63] N. Sun, Y. Zhu, and X. Hu, “Faster r-cnn based table detection combining corner locating,” in 2019 International Conference on Document Analysis and Recognition (ICDAR). IEEE, 2019, pp. 1314–1319.
- [64] L. Gao, X. Yi, Z. Jiang, L. Hao, and Z. Tang, “Icdar2017 competition on page object detection,” in 2017 14th IAPR International Conference on Document Analysis and Recognition (ICDAR), vol. 1. IEEE, 2017, pp. 1417–1422.
- [65] J. Dai, H. Qi, Y. Xiong, Y. Li, G. Zhang, H. Hu, and Y. Wei, “Deformable convolutional networks,” in Proceedings of the IEEE international conference on computer vision, 2017, pp. 764–773.
- [66] M. Göbel, T. Hassan, E. Oro, and G. Orsi, “Icdar 2013 table competition,” in 2013 12th International Conference on Document Analysis and Recognition. IEEE, 2013, pp. 1449–1453.
- [67] Z. Cai and N. Vasconcelos, “Cascade r-cnn: Delving into high quality object detection,” in Proceedings of the IEEE conference on computer vision and pattern recognition, 2018, pp. 6154–6162.
- [68] S. Xie, R. Girshick, P. Dollár, Z. Tu, and K. He, “Aggregated residual transformations for deep neural networks,” in Proceedings of the IEEE conference on computer vision and pattern recognition, 2017, pp. 1492–1500.
- [69] Y. Liu, Y. Wang, S. Wang, T. Liang, Q. Zhao, Z. Tang, and H. Ling, “Cbnet: A novel composite backbone network architecture for object detection,” in Proceedings of the AAAI Conference on Artificial Intelligence, vol. 34, no. 07, 2020, pp. 11 653–11 660.
- [70] J. Redmon, S. Divvala, R. Girshick, and A. Farhadi, “You only look once: Unified, real-time object detection,” in Proceedings of the IEEE conference on computer vision and pattern recognition, 2016, pp. 779–788.
- [71] J. Redmon and A. Farhadi, “Yolov3: An incremental improvement,” arXiv preprint arXiv:1804.02767, 2018.
- [72] Á. Casado-García, C. Domínguez, J. Heras, E. Mata, and V. Pascual, “The benefits of close-domain fine-tuning for table detection in document images,” in International Workshop on Document Analysis Systems. Springer, 2020, pp. 199–215.
- [73] K. He, G. Gkioxari, P. Dollár, and R. Girshick, “Mask r-cnn,” in Proceedings of the IEEE international conference on computer vision, 2017, pp. 2961–2969.
- [74] Y. Deng, A. Kanervisto, and A. M. Rush, “What you get is what you see: A visual markup decompiler,” arXiv preprint arXiv:1609.04938, vol. 10, pp. 32–37, 2016.
- [75] W. Liu, D. Anguelov, D. Erhan, C. Szegedy, S. Reed, C.-Y. Fu, and A. C. Berg, “Ssd: Single shot multibox detector,” in European conference on computer vision. Springer, 2016, pp. 21–37.
- [76] T.-Y. Lin, P. Goyal, R. Girshick, K. He, and P. Dollár, “Focal loss for dense object detection,” in Proceedings of the IEEE international conference on computer vision, 2017, pp. 2980–2988.
- [77] J. Wang, K. Sun, T. Cheng, B. Jiang, C. Deng, Y. Zhao, D. Liu, Y. Mu, M. Tan, X. Wang et al., “Deep high-resolution representation learning for visual recognition,” IEEE transactions on pattern analysis and machine intelligence, 2020.
- [78] S. Gao, M.-M. Cheng, K. Zhao, X.-Y. Zhang, M.-H. Yang, and P. H. Torr, “Res2net: A new multi-scale backbone architecture,” IEEE transactions on pattern analysis and machine intelligence, 2019.
- [79] K. Chen, J. Pang, J. Wang, Y. Xiong, X. Li, S. Sun, W. Feng, Z. Liu, J. Shi, W. Ouyang et al., “Hybrid task cascade for instance segmentation,” in Proceedings of the IEEE/CVF Conference on Computer Vision and Pattern Recognition, 2019, pp. 4974–4983.
- [80] L. Gao, Y. Huang, H. Déjean, J.-L. Meunier, Q. Yan, Y. Fang, F. Kleber, and E. Lang, “Icdar 2019 competition on table detection and recognition (ctdar),” in 2019 International Conference on Document Analysis and Recognition (ICDAR). IEEE, 2019, pp. 1510–1515.
- [81] I. Kavasidis, S. Palazzo, C. Spampinato, C. Pino, D. Giordano, D. Giuffrida, and P. Messina, “A saliency-based convolutional neural network for table and chart detection in digitized documents,” arXiv preprint arXiv:1804.06236, 2018.
- [82] F. Yu and V. Koltun, “Multi-scale context aggregation by dilated convolutions international conference on learning representations (iclr) 2016,” 2016.
- [83] P. Krähenbühl and V. Koltun, “Efficient inference in fully connected crfs with gaussian edge potentials,” Advances in neural information processing systems, vol. 24, pp. 109–117, 2011.
- [84] S. S. Paliwal, D. Vishwanath, R. Rahul, M. Sharma, and L. Vig, “Tablenet: Deep learning model for end-to-end table detection and tabular data extraction from scanned document images,” in 2019 International Conference on Document Analysis and Recognition (ICDAR). IEEE, 2019, pp. 128–133.
- [85] J. Long, E. Shelhamer, and T. Darrell, “Fully convolutional networks for semantic segmentation,” in Proceedings of the IEEE conference on computer vision and pattern recognition, 2015, pp. 3431–3440.
- [86] M. Holeček, A. Hoskovec, P. Baudiš, and P. Klinger, “Table understanding in structured documents,” in 2019 International Conference on Document Analysis and Recognition Workshops (ICDARW), vol. 5. IEEE, 2019, pp. 158–164.
- [87] P. Riba, A. Dutta, L. Goldmann, A. Fornés, O. Ramos, and J. Lladós, “Table detection in invoice documents by graph neural networks,” in 2019 International Conference on Document Analysis and Recognition (ICDAR). IEEE, 2019, pp. 122–127.
- [88] Y. Li, L. Gao, Z. Tang, Q. Yan, and Y. Huang, “A gan-based feature generator for table detection,” in 2019 International Conference on Document Analysis and Recognition (ICDAR). IEEE, 2019, pp. 763–768.
- [89] A. W. Harley, A. Ufkes, and K. G. Derpanis, “Evaluation of deep convolutional nets for document image classification and retrieval,” in 2015 13th International Conference on Document Analysis and Recognition (ICDAR). IEEE, 2015, pp. 991–995.
- [90] I. J. Goodfellow, J. Pouget-Abadie, M. Mirza, B. Xu, D. Warde-Farley, S. Ozair, A. Courville, and Y. Bengio, “Generative adversarial networks,” arXiv preprint arXiv:1406.2661, 2014.
- [91] O. Ronneberger, P. Fischer, and T. Brox, “U-net: Convolutional networks for biomedical image segmentation,” in International Conference on Medical image computing and computer-assisted intervention. Springer, 2015, pp. 234–241.
- [92] S. A. Siddiqui, P. I. Khan, A. Dengel, and S. Ahmed, “Rethinking semantic segmentation for table structure recognition in documents,” in 2019 International Conference on Document Analysis and Recognition (ICDAR). IEEE, 2019, pp. 1397–1402.
- [93] O. Russakovsky, J. Deng, H. Su, J. Krause, S. Satheesh, S. Ma, Z. Huang, A. Karpathy, A. Khosla, M. Bernstein et al., “Imagenet large scale visual recognition challenge,” International journal of computer vision, vol. 115, no. 3, pp. 211–252, 2015.
- [94] Y. Zou and J. Ma, “A deep semantic segmentation model for image-based table structure recognition,” in 2020 15th IEEE International Conference on Signal Processing (ICSP), vol. 1. IEEE, 2020, pp. 274–280.
- [95] M. B. Dillencourt, H. Samet, and M. Tamminen, “A general approach to connected-component labeling for arbitrary image representations,” Journal of the ACM (JACM), vol. 39, no. 2, pp. 253–280, 1992.
- [96] S. R. Qasim, H. Mahmood, and F. Shafait, “Rethinking table recognition using graph neural networks,” in 2019 International Conference on Document Analysis and Recognition (ICDAR). IEEE, 2019, pp. 142–147.
- [97] F. Scarselli, M. Gori, A. C. Tsoi, M. Hagenbuchner, and G. Monfardini, “The graph neural network model,” IEEE transactions on neural networks, vol. 20, no. 1, pp. 61–80, 2008.
- [98] Z. Chi, H. Huang, H.-D. Xu, H. Yu, W. Yin, and X.-L. Mao, “Complicated table structure recognition,” arXiv preprint arXiv:1908.04729, 2019.
- [99] W. Xue, Q. Li, and D. Tao, “Res2tim: reconstruct syntactic structures from table images,” in 2019 International Conference on Document Analysis and Recognition (ICDAR). IEEE, 2019, pp. 749–755.
- [100] W. Xue, Q. Li, Z. Zhang, Y. Zhao, and H. Wang, “Table analysis and information extraction for medical laboratory reports,” in 2018 IEEE 16th Intl Conf on Dependable, Autonomic and Secure Computing, 16th Intl Conf on Pervasive Intelligence and Computing, 4th Intl Conf on Big Data Intelligence and Computing and Cyber Science and Technology Congress (DASC/PiCom/DataCom/CyberSciTech). IEEE, 2018, pp. 193–199.
- [101] C. Tensmeyer, V. I. Morariu, B. Price, S. Cohen, and T. Martinez, “Deep splitting and merging for table structure decomposition,” in 2019 International Conference on Document Analysis and Recognition (ICDAR). IEEE, 2019, pp. 114–121.
- [102] S. A. Khan, S. M. D. Khalid, M. A. Shahzad, and F. Shafait, “Table structure extraction with bi-directional gated recurrent unit networks,” in 2019 International Conference on Document Analysis and Recognition (ICDAR). IEEE, 2019, pp. 1366–1371.
- [103] J. Chung, C. Gulcehre, K. Cho, and Y. Bengio, “Empirical evaluation of gated recurrent neural networks on sequence modeling,” arXiv preprint arXiv:1412.3555, 2014.
- [104] S. Hochreiter and J. Schmidhuber, “Long short-term memory,” Neural computation, vol. 9, no. 8, pp. 1735–1780, 1997.
- [105] G. Klein, Y. Kim, Y. Deng, J. Senellart, and A. M. Rush, “Opennmt: Open-source toolkit for neural machine translation,” arXiv preprint arXiv:1701.02810, 2017.
- [106] J. Wang, K. Chen, S. Yang, C. C. Loy, and D. Lin, “Region proposal by guided anchoring,” in Proceedings of the IEEE/CVF Conference on Computer Vision and Pattern Recognition, 2019, pp. 2965–2974.
- [107] F. Yu and V. Koltun, “Multi-scale context aggregation by dilated convolutions,” arXiv preprint arXiv:1511.07122, 2015.
- [108] T. N. Kipf and M. Welling, “Semi-supervised classification with graph convolutional networks,” arXiv preprint arXiv:1609.02907, 2016.
- [109] Y. Deng, D. Rosenberg, and G. Mann, “Challenges in end-to-end neural scientific table recognition,” in 2019 International Conference on Document Analysis and Recognition (ICDAR). IEEE, 2019, pp. 894–901.
- [110] Y. Deng, A. Kanervisto, J. Ling, and A. M. Rush, “Image-to-markup generation with coarse-to-fine attention,” in International Conference on Machine Learning. PMLR, 2017, pp. 980–989.
- [111] S. F. Rashid, A. Akmal, M. Adnan, A. A. Aslam, and A. Dengel, “Table recognition in heterogeneous documents using machine learning,” in 2017 14th IAPR International Conference on Document Analysis and Recognition (ICDAR), vol. 1. IEEE, 2017, pp. 777–782.
- [112] I. Phillips, “User’s reference manual for the uw english/technical document image database iii,” UW-III English/Technical Document Image Database Manual, 1996.
- [113] A. Mondal, P. Lipps, and C. Jawahar, “Iiit-ar-13k: a new dataset for graphical object detection in documents,” in International Workshop on Document Analysis Systems. Springer, 2020, pp. 216–230.
- [114] D. M. Powers, “Evaluation: from precision, recall and f-measure to roc, informedness, markedness and correlation,” arXiv preprint arXiv:2010.16061, 2020.
- [115] M. B. Blaschko and C. H. Lampert, “Learning to localize objects with structured output regression,” in European conference on computer vision. Springer, 2008, pp. 2–15.
- [116] K. Papineni, S. Roukos, T. Ward, and W.-J. Zhu, “Bleu: a method for automatic evaluation of machine translation,” in Proceedings of the 40th annual meeting of the Association for Computational Linguistics, 2002, pp. 311–318.
- [117] D. G. Kleinbaum, K. Dietz, M. Gail, M. Klein, and M. Klein, Logistic regression. Springer, 2002.
- [118] Y. Wang, Y. Sun, Z. Liu, S. E. Sarma, M. M. Bronstein, and J. M. Solomon, “Dynamic graph cnn for learning on point clouds,” Acm Transactions On Graphics (tog), vol. 38, no. 5, pp. 1–12, 2019.
- [119] S. R. Qasim, J. Kieseler, Y. Iiyama, and M. Pierini, “Learning representations of irregular particle-detector geometry with distance-weighted graph networks,” The European Physical Journal C, vol. 79, no. 7, pp. 1–11, 2019.
- [120] M. Pawlik and N. Augsten, “Tree edit distance: Robust and memory-efficient,” Information Systems, vol. 56, pp. 157–173, 2016.
- [121] V. Mnih, K. Kavukcuoglu, D. Silver, A. A. Rusu, J. Veness, M. G. Bellemare, A. Graves, M. Riedmiller, A. K. Fidjeland, G. Ostrovski et al., “Human-level control through deep reinforcement learning,” nature, vol. 518, no. 7540, pp. 529–533, 2015.
- [122] A. G. Barto and R. S. Sutton, “Reinforcement learning,” Handbook of brain theory and neural networks, pp. 804–809, 1995.
- [123] J. Park, E. Lee, Y. Kim, I. Kang, H. I. Koo, and N. I. Cho, “Multi-lingual optical character recognition system using the reinforcement learning of character segmenter,” IEEE Access, vol. 8, pp. 174 437–174 448, 2020.