Pebbles and volatile evolution in the interstellar comet 2I/Borisov
Abstract
The interstellar traveler, 2I/Borisov, is the first clearly active extrasolar comet, ever detected in our Solar system. We obtained high-resolution interferometric observations of 2I/Borisov with the Atacama Large Millimeter/submillimeter Array (ALMA), and multi-color optical observations with the Very Large Telescope (VLT) to gain a comprehensive understanding of the dust properties of this comet. We found that the dust coma of 2I/Borisov consists of compact “pebbles” of radii exceeding 1, suggesting that the dust particles have experienced compaction through mutual impacts during the bouncing collision phase in the protoplanetary disk. We derived a dust mass loss rate of 200 and a dust-to-gas ratio 3. Our long term monitoring of 2I/Borisov with VLT indicates a steady dust mass loss with no significant dust fragmentation and/or sublimation occurring in the coma. We also detected emissions from carbon monoxide gas (CO) with ALMA and derived the gas production rate of . We found that the CO/H2O mixing ratio of 2I/Borisov changed drastically before and after perihelion, indicating the heterogeneity of the cometary nucleus, with components formed at different locations beyond the volatile snow-line with different chemical abundances. Our observations suggest that 2I/Borisov’s home system, much like our own system, experienced efficient radial mixing from the innermost parts of its protoplanetary disk to beyond the frost line of CO.
Planetary systems are born out of interstellar clouds of gas and dust grains, where dust plays an important role in radiative cooling of collapsing clouds as well as serving as seeds for condensation and accretion of the building blocks of planetary bodies. Dust particles are rich in information on their formation and evolution history, such as the transport and collisional processes in protoplanetary disks. However, it is nearly impossible to perform in depth investigations on the dust properties around other stars due to the large distances and faintness of these systems.
Interstellar objects (ISOs) are planetesimals, the building blocks of planets, kicked out of their native planetary systems [1]. Some of these interstellar wanderers eventually pass through our Solar system, providing us rare opportunities to characterize exo-planetesimals in unprecedented detail. The first ISO, 1I/‘Oumuamua, was discovered in 2017 and exhibited a point-like appearance with no sign of cometary activity [2, 3]. In contrast, the second ISO, 2I/ Borisov, which was discovered in August 2019, unambiguously exhibited a coma and tail upon discovery [4]. The detection of typical cometary emissions such as CN (ref.[5]) and C2 (ref.[6]) makes it the first obviously active extrasolar comet ever detected in our Solar system. In addition, this comet is rich in supervolatile CO [7, 8], regardless of its small nucleus [9, 10], which indicates that the nucleus of 2I/Borisov is likely to be pristine.
Solar system comets consist of ices and dust, where the major ice species are H2O, CO, and CO2 (ref.[11]) and the dust generally consists of silicates, oxides, and sulfides, as well as high-molecular weight refractory organics and amorphous carbon materials [12, 13]. When a comet enters the inner solar system, a coma of dust and gas and/or tails of dust and plasma begin to develop around the nucleus due to sublimation of surface ices in the heat of the Sun and the embedded dust particles are dragged out by the expanding gas [14]. In recent years, in-situ observations of comet 67P/Churyumov-Gerasimenko (hereafter 67P) by the ESA Rosetta spacecraft greatly enhanced our understanding of comets. The nucleus of 67P is thought to be a primordial rubble pile[15] and its dust particles have an irregular, fluffy structure [13], with sizes varying widely from 1 to nearly 1 m (ref.[16, 17]). Rosetta measurements suggest that comets in our Solar system formed in a wide region beyond proto-Neptune and were scattered by giant planet migration to their present reservoirs[14].
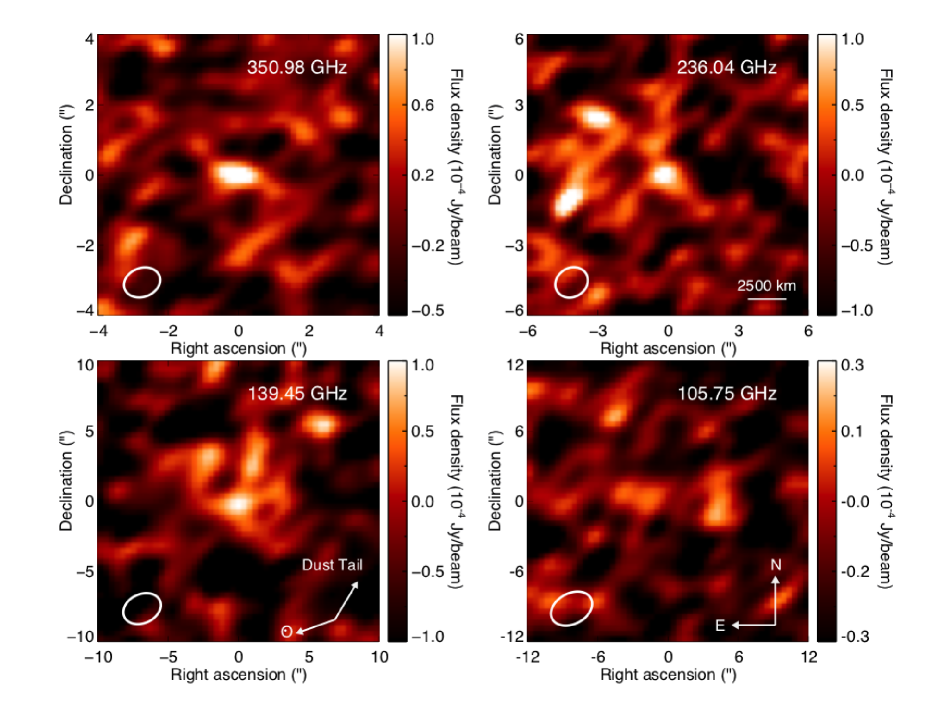
We obtained high angular resolution continuum observations of 2I/Borisov with ALMA in Bands 3 and 4 (2019 Dec. 03) and Bands 6 and 7 (2019 Dec. 02), respectively, which is less than a week before the comet reached perihelion at on 2019 December 8. The ALMA dust continuum images of 2I/Borisov from 850 to 2.84 are shown in Fig. 1. We detected the dust continuum emission at the center of the field of view (FOV) in three out of four bands, at 350 (Band 7), 236 (Band 6) and 139 (Band 4), respectively. In Band 4 and Band 6, there are some non-negligible structures near the center, which could be associated with the comet. However, due to the limited signal-to-noise ratio of these structures, we excluded them from further analysis and only measured the flux at the center of the image within one ALMA beam, where the strongest signal was detected.
We modeled the measured thermal flux of 2I/Borisov, using aggregates of amorphous silicates and amorphous carbon grains (see Methods) [18]. We found that very large, “pebble”-like compact particles of radii are required to reproduce the ALMA photometry. Here we follow the official terminology of the United States Geological Survey (USGS) for which “pebbles” refer to mm- to cm-sized particles [19], which are smaller than those cm- to meter-sized pebbles typically considered in the “pebble accretion” growth of planetesimals [20].
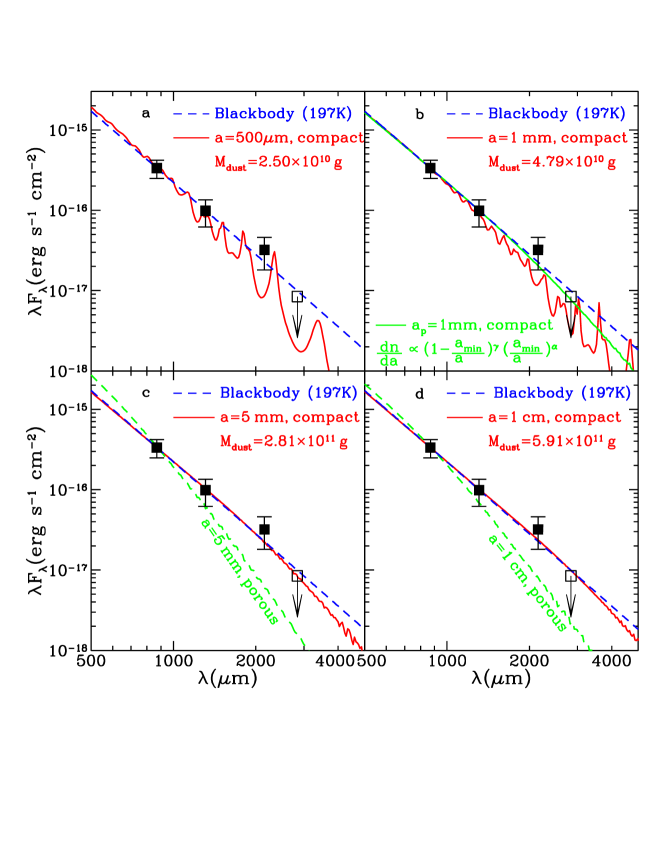
As shown in Fig. 2, smaller particles with or larger porous particles with would emit too little at to account for the ALMA photometry. As a matter of fact, the ALMA photometry closely resembles blackbody emission. In comparison, most Solar system comets exhibit a steeper spectral energy distribution (SED) in the submm and mm wavelength range (e.g., see ref. [21]). To emit like a blackbody, these dust particles have to be much larger than the wavelength (i.e., ; see ref.[22]) which, at the ALMA wavebands, is indicative of mm-sized (or larger) pebbles. These pebbles are in the geometrical optics regime so that their absorption cross sections are essentially constant from the ultraviolet all the way to the submm and mm wavelengths [22]. The dust particles attain an equilibrium temperature of at and their emission spectra are blackbody-like (see Methods). We have also fitted the SED in terms of a Divine-type dust size distribution [23] which also suggests the predominant presence of pebble-like dust particles of (see Fig. 2). Other ground-based optical observations yielded an effective dust radius from 100 up to 3 for 2I/Borisov (Oct. 2018 – May 2019[24], Sept. – Oct. 2019[25], Nov. – Dec. 2019[26]). Hubble Space Telescope (HST) observations of this ISO near its perihelion reveal a slight asymmetry in the dust coma that requires the presence of mm-sized particles [27].
Assuming an effective dust size of 5, we obtained a total dust mass loss of within the ALMA beam (see Fig. 2). Larger pebbles (e.g., ) emit less effectively at the ALMA bands and cannot be well constrained, therefore, our dust mass loss estimate is considered as a lower limit (see discussion in Methods). Adopting a dust velocity of 3 for mm-sized particles around perihelion (ref.[26]) and an effective beam size of 2.8′′ (projected distance of ), we obtained a beam crossing time , in turn, a dust mass loss rate . Similar results were obtained if we considered the Divine-type dust size distribution which peaks at and requires a total dust mass loss of (see Methods).
In complement to the ALMA observations, we also monitored the dust activity of 2I/Borisov with the FOcal Reducer and low dispersion Spectrograph 2 (FORS2) on VLT from November 2019 until March 2020. Using the FORS observations, we measured and calculated the quantities and derived order-of-magnitude dust mass loss rates (see Methods), which are listed in Supplementary Table 2. We note that the dust mass loss rate obtained using ALMA is at least four times higher than the rates derived from optical observations (our FORS observations and ref.[27, 26]). While the -based rates derived from the FORS observations are just order-of-magnitude estimates, it is actually not surprising that the ALMA-based rate considerably exceeds the -based rates. It is well recognized that the bulk of the particulate coma mass is typically carried by large dust particles and optical observations preferentially sample the smaller particles since they are typically more abundant and contribute to a larger fraction of the optical cross-sections than do the mass-dominant larger particles [18].
Our FORS monitoring observations show that the dust mass loss rates only exhibit small variations with respect to heliocentric distances during the monitoring period. Other observations [24, 26] and dynamical dust modelling also indicate that the dust production rate has been quite stable for weeks, possibly months before the observations. We therefore adopted a constant dust production rate of 200 and obtained the total mass loss of during the period between the discovery and the arrival at the perihelion. Adopting a typical bulk density of 500 for the nucleus [28] and assuming uniform erosion of the nucleus surface (with for the nucleus radius; see ref.[10]), we find that a layer of at least 2 was eroded from 2I/Borisov’s surface since it entered the inner Solar system in late August 2019 .
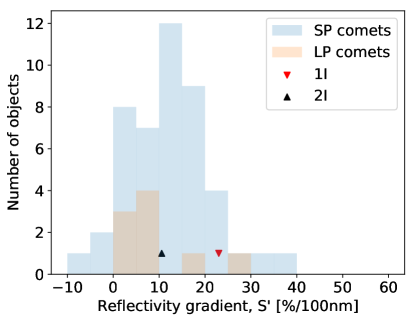
Our spectroscopic and multi-band photometric observations with FORS show that the dust coma of 2I/Borisov appears slightly redder than the Sun in the optical with an average reflectivity , consistent with other studies [10, 29]. In comparison, the surface of 1I/’Oumuamua had a much redder slope of (see ref.[2]), as illustrated in Fig. 3. We found that the dust color and the dust coma profile showed no sign of evolution with time. For cometary dust, the optical color depends mainly on the particle size distribution, rather than on the dust composition [30]. The absence of temporal and spatial color variations indicates that no significant dust fragmentation and/or sublimation from grains occurred in the coma of 2I/Borisov, which is consistent with the lack of icy particles in the coma[31].
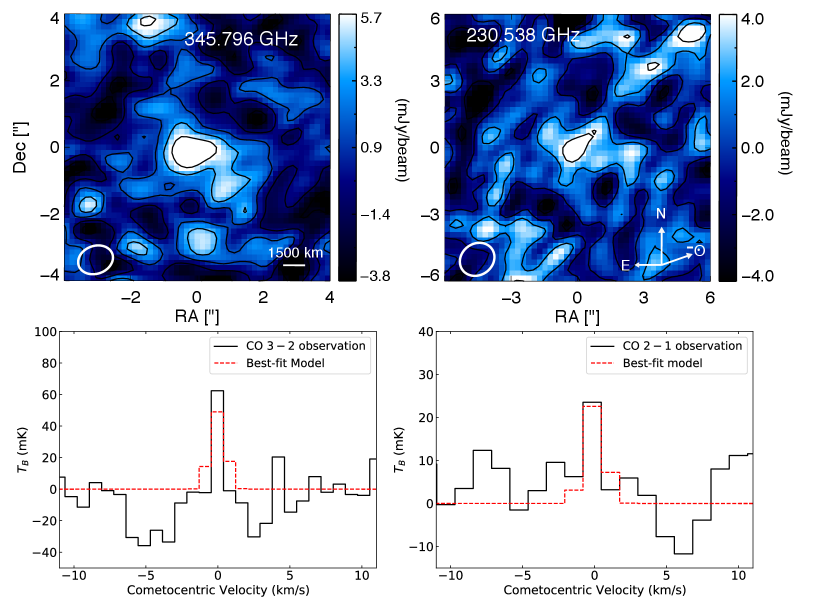
Besides the dust continuum, we also detected gas emission from the carbon monoxide (CO) and transitions in ALMA Bands 6 and 7, respectively (see Fig. 4). The emission was confined to a single spectral channel in each case, centered on the radial velocity of the nucleus. The two CO lines were modeled simultaneously, allowing the temperature and production rate to vary as free parameters until the best fit to the observed spectra was obtained. The best-fitting model gives and . However, the temperature is not well constrained by the observations, with a () error range of 13–181. Using a water production rate on 01 December 2019 (see ref.[33]), we derive a CO/H2O mixing ratio of .
Around perihelion, the water production rate is 30 (see ref.[33]) and the CO production rate is 15–20 (this study; see also ref.[8]). If we assume the CO2 production rate is comparable to that of CO, similar to the case of 67P (ref.[34]), then the total gas production rate is 60–70. Our ALMA observations indicate that the dust mass loss rate is , in turn, the dust-to-gas ratio of 2I/Borisov is . In comparison, comet C/1995 O1 (Hale-Bopp) has (see ref.[21]) and 67P has 0.6–6 (see refs.[35, 16, 36]), while most solar system comets exhibit a dust-to-gas ratio around 1 or less[37, 38]. Theoretical studies have shown that for comets formed through the gravitational collapse of pebble clouds, their dust-to-gas ratios would be in the range of (ref.[39]). The relatively high dust-to-gas ratio of 2I/Borisov is consistent with the scenario of its formation in a collapsing pebble cloud.
While Solar system cometary dust particles are largely comprised of irregular, fluffy aggregates [13, 40], the predominance of compact particles in the coma of 2I/Borisov suggests that the dust particles of this ISO have experienced mutual impacts during the bouncing collision phase in the protoplanetary disk [41, 42], which led to the reduction of the empty space inside the fluffy particles and ultimately restructuring fractal particles into pebbles [42, 16]. The high collision rate suggests that the large dust particles in 2I/Borisov must have formed in the inner protoplanetary disk of its parental star. The compaction of porous particles could also result from the packing forces produced by an anisotropic sublimation of the surface layers of loosely conglomerated fluffy aggregates[43].
Comparing the pre-perihelion CO production rate obtained in this study to other CO production rates obtained post-perihelion[7, 8], it is apparent that the CO sublimation rate of 2I/Borisov varied significantly around perihelion, and is decoupled from the water production. As discussed in refs.[33, 7], the release of water peaked when 2I/Borisov was closest to the Sun. After perihelion, the water production dropped sharply by a factor of 5 in 20 days [33]. In contrast, the CO production rate increased steadily as the comet approached the Sun, and reached the peak about a month after perihelion. The abundance of CO with respect to H2O increased from about 30% (pre-perihelion) to nearly 160% (post-perihelion), making 2I/Borisov the most CO-rich comet observed within 3 of the Sun [7, 8].
The decoupled CO and H2O sublimation pattern as well as the large variation in CO to H2O ratio has been observed previously in solar system comets. For instance, the CO rich comet C/2009 P1 (Garradd) showed H2O production peaking 50 days before perihelion while the CO production rate increased monotonically until 100 days post-perihelion [44]. The asymmetric activity of C/2009 P1 is attributed either to a seasonal effect, where the sublimation is coming from two separate active regions that have different compositions, or to the exposure of different sub-layers of the nucleus, with differing CO/H2O ratios [44]. As discussed earlier, the surface layer of the nucleus of 2I/Borisov had eroded at least two meters when it reached the perihelion. The thickness of eroded materials is comparable to the depth, in the range of 1–10 m, of the devolatilized mantle that is heavily processed by cosmic-ray irradiation or supernova heating [45, 46]. The post-perihelion increase in CO activity could be due to the exposure of the volatile-rich deeper layers as a result of surface erosion. However, unveiling sub-surface fresh materials is not compatible with the steep decline in the post-perihelion water production rate. In addition, our FORS spectroscopic observations found that the production rates of other species, i.e., CN, C2, NH2, also followed the H2O production rate and dropped steadily after perihelion[47].
Rosetta observations of 67P revealed that the peak of water flux was confined to the subsolar latitude either on the northern hemisphere or the southern hemisphere, whereas, the hypervolatile CO2 and CO gases were not specifically originating from the sunlit regions [34]. Two studies based on the HST observations of 2I/Borisov suggest that the sub-solar latitude of the nucleus evolved either from to 0∘ or from to 70∘ between August 2019 and January 2020 [27, 48]. The drastic drop in the water production rate of 2I/Borisov may have been due to the possibility that water sublimation was mainly coming from a confined region on the surface of the nucleus. Post perihelion, this region rotated away from the sun, leading to decreasing water sublimation rates. Consistently, post-perihelion ALMA observations revealed that the source of HCN (possible parent molecule of CN) outgassing was confined to a narrow region in the plane of the sky, whereas CO outgassing was more isotropic [8]. The evolution of CO/H2O ratio is unlikely due to exposing fresh subsurface materials and, therefore, does not represent the pristine abundance ratio. Instead, the large variation in the CO/H2O ratio reflects a heterogeneity of the cometary nucleus, most likely with components formed at different locations beyond the volatile snowline, with differing chemical abundances.
Our ALMA and VLT observations indicate that 2I/Borisov’s home planetary system, much like our own Solar system, had experienced efficient radial mixing from the innermost parts of its protoplanetary disk to beyond the frost line of CO. Among a number of probable mechanisms that have been proposed for the origin of ISOs [3], gravitational interactions between planetesimals in the protoplanetary disk and growing giant planets is favored, as it can explain both the ejection of ISOs from their home systems as well as account for the strong radial transport of materials in the disk [49]. While the most common planets in other exoplanetary systems seem to be super-Earths and mini-Neptunes [50], our study suggests the presence of giant planets in the home system of 2I/Borisov.
Methods
2I/Borisov was observed with ALMA during Cycle 7, under the Director’s Discretionary Time program 2019.A.00002.S. The observations were carried out 5 and 6 days before perihelion for Bands 3 and 4 (UT 2019-12-03) and Bands 6 and 7 (UT 2019-12-02), respectively. Our observations were performed using the C43-2 nominal configuration, spanning baselines 15–161, which provided an angular resolution of () at 350 (109). The flux scale was calibrated with respect to the quasar J1130-1449.
For the continuum observations, we used the largest bandwidth of 7.5, by combining the four 1.875 base-bands in dual-polarization mode. The correlator was configured to observe rotational transitions of CO = 2–1 (230.538) in Band 6 and CO = 3–2 (345.796) in Band 7, with a spectral resolution of 1.128 MHz and a channel spacing of 977 kHz. The data reduction was performed using CASA version 5.6.1-8 and ALMA Pipeline version r42866, and the imaging was performed using the CASA task with natural weighting. Since we were tracking on the comet at a rate (0.03′′/s) throughout the observations, any background sources are expected to be smeared in the final images. As shown in Fig. 1, there are some structures near the center of the image, close to the expected location of the comet. Given the high sensitivity and spatial resolution of ALMA at the time of the observation, it is possible that some dust coma structure can be resolved. However, due to the low signal-to-noise ratio of these features, we can not confirm the extended features are real features. Therefore, we only measure the flux at the very center of each image where the strongest signal was detected.
Due to the wide wavelength coverage, the image resolution/beam size is significantly different (, , , ), as shown in Fig. 1. To make a consistent measurement of the continuum flux over the four bands, we convolved all the continuum images with a fixed resolution element of . We integrated total flux within one FWHM of the resolution element in the re-convolved images. To estimate the noise level, we measured the root mean square (RMS) within one beam at multiple locations that are close to the center for each band, using the CASA viewer task. We then calculated the mean of the measured RMS values as the final noise estimate for each band. The measured total flux as well as the noise in each band is listed in Table 1.
| Band | Freq. | Itime | Flux | RMS | ||
|---|---|---|---|---|---|---|
| (GHz) | (min) | (′′) | () | () | ||
| 7 | 350 | 41 | 3.42.3 | 94 | 25 | 3.8 |
| 6 | 236 | 34 | 3.42.3 | 44 | 15 | 2.9 |
| 4 | 139 | 55 | 3.42.3 | 21 | 7 | 3.0 |
| 3 | 106 | 72 | 3.42.3 | 8 | 6 | 1.3 |
We model the dust thermal emission of 2I/Borisov in terms of cometary dust paricles—porous aggregates of amorphous silicates and amorphous carbon grains [18]—which are commonly used for modeling the dust-scattered sunlight and dust thermal emission of comets [51, 52]. The dust is characterized by (i) size – the radius of the sphere encompassing the entire aggregate (we assume that all grains are spherical in shape), (ii) porosity – the fractional volume of vaccum, and (iii) mixing mass ratio for the amorphous silicate and amorphous carbon constituent grains. We use Mie theory combined with the Bruggman effective medium theory [22] to calculate , the absorption cross sections of spherical porous aggregates of radii at wavelength . We take the dielectric functions of Draine & Lee[53] for amorphous silicate dust and of Li & Greenberg [54] for amorphous carbon dust. We adopt = 0.5, as implied from the mass spectrometry of the dust particles from 67P measured with the Cometary Secondary Ion Mass Analyzer (COSIMA) aboard Rosetta [55]. The chemical composition of the dust grains from Halley as inferred from the impact-ionization time-of-flight mass spectrometry [56] suggested 0.8. We note that, since the observed SED in the ALMA bands closely resembles blackbody emission (see Fig. 2), the exact dust composition is less relevant. Indeed, our calculations show that both pure silicate particles and pure amorphous carbon particles can reproduce the ALMA observations, provided that they are mm-sized (or larger) pebbles.
At a heliocentric distance , a spherical dust particle of radius attains an equilibrium temperature of through balancing the absorption with the emission:
| (1) |
where is the solar radius, is the flux per unit wavelength () at the top layer of the solar atmosphere, and is the Planck function at temperature and wavelength . We note that in eq. 1, the factor 1/2 arises from the “dilution” factor
| (2) |
which measures the factor by which the energy density in the radiation field is reduced as the source of radiation moves to a large distance. At the “surface” of the Sun (i.e., ), it is obvious that = 1/2 (actually a little less because of limb-darkening). At , . Assuming the coma consists of dust particles of a single size and a total mass of , at a comet-Earth distance of , we calculate the dust flux density from
| (3) |
where is the mass density of cometary dust (for compact dust, ; for porous dust of porosity , ; see ref.[57]). We have also modeled the SED in terms of the Divine-type cometary size distribution [23] in the size range of . For such a function, the size distribution peaks at and the area-weighted size distribution is skewed towards larger particles and peaks at . As far as the dust thermal emission is concerned, the area-weighted size peak is more meaningful than since and for dust particles in the geometrical optics limit.
By varying the lower and upper cutoff sizes (, ) as well as the power exponents (, ), close fits to the observed SED are achieved if the dust particles are predominantly mm-sized (or larger). As illustrated in Fig. 2b, with (see ref.[58]), and , compact, spherical dust particles with a Divine-type size distribution peaking at and a total dust mass of could reproduce the ALMA photometry fairly well. In contrast, dust particles with the same size distribution but peaking at emit too little at . Compared with that calculated from dust particles of a single size (also see Fig. 2b), the model emission spectrum from those with the Divine-type size distribution is smooth and does not show the resonant structures. These resonant structures seen in the emission spectra of single-sized particles arise from the interference between the incident and forward-scattered sunlight which results in broad peaks in their absorption cross sections (see ref.[22]). The positions of these interference-caused maxima and minima in the absorption cross sections are size dependent and therefore a size distribution would smear out these resonant structures. Also, the model SED calculated from dust particles with the Divine-type size distribution agrees better with the ALMA photometry since the area-weighted size distribution is skewed to larger particles and peaks at .
Eq.3 clearly shows that, for the model SED to resemble the blackbody-like SED observed by ALMA, the dust absorption cross sections have to be independent of wavelength in the ALMA bands, i.e., the dust particles have to be in the geometrical optics regime in the ALMA bands (and by implication, in shorter wavelengths as well) with 1 and 1, where is the dust complex index of refraction [22]. Under the geometrical optics condition, and from eq.1 we derive , which corresponds to at . The required dust mass linearly increases with the dust size:
| (4) |
where is the flux density observed by ALMA. We note that, for porous dust, the effective index of refraction is reduced and the geometrical optics condition of 1 may not be met even if 1. This is why mm-sized, porous pebbles do not emit like blackbodies and fail to reproduce the observed SED (see Fig. 2). The fits provided by smaller porous particles are even worse since they are even further away from the geometrical optics regime.
We have so far assumed the dust particles to be spherical. However, cometary dust particles often have an irregular shape and fluffy structure [13]. Unfortunately, there is no accurate solution to the absorption and scattering of light by mm-sized, irregular particles. The discrete dipole approximation, a powerful method for modeling the interaction between light and irregular particles, is limited to dust of sizes not much larger than the incident wavelength [59]. Nevertheless, the assumption of spherical shapes (together with the Bruggeman or the Maxwell-Garnett effective medium theories for inhomogeneous grains) is sufficient in modeling the featureless mm and submm thermal continuum emission.
We also note that Rosetta observed that a certain amount of large, decimeter-sized particles emitted from the nucleus eventually fall back onto the surface of 67P (ref.[16]), although the fraction of fall back is currently not well constrained. Given the smaller and lighter nucleus of 2I/Borisov, the cut-off dust size should be larger than decimeters. As discussed earlier, dm sized particles are not sampled by ALMA observations. Therefore, we did not consider the fall-back effect when estimating the total dust mass loss. Our dust mass loss estimate as well as the dust-to-gas ratio are both considered as a lower limit.
The integrated CO line flux is mJy km s-1 beam-1 for CO (which corresponds to a detection significance), and mJy km s-1 beam-1 for ( significance). The CO observations were analyzed using a spherically symmetric coma radiative transfer model[8], expanding with a constant velocity, and subject to photolysis by solar radiation. Our data were of insufficient spectral resolution to determine the gas radial velocity based on the observed emission line profiles, so we adopted an outflow velocity of 0.47, derived from spectrally resolved CO observations by Cordiner et al.[8] on 15–16 December 2019. Spatial filtering of the model coma images by the interferometer was accounted for using the CASA simobserve task, with the same hour angle, observation duration and array configuration as the science observations. Spectra of the two CO lines (extracted from their respective emission peak positions) were modelled simultaneously, allowing the temperature () and production rate () to vary as free parameters until the best fit to the observed spectra was obtained (as determined using the reduced chi-squared statistic). Local thermodynamic equilibrium (LTE) was found to be applicable due to the relatively small ALMA beam size combined with the long lifetime of CO with respect to radiative transitions [8].
2I/Borisov was observed from Paranal using the FOcal Reducer and low dispersion Spectrograph 2 (FORS2) on ESO’s Very Large Telescope (VLT), in service mode, from November 2019 until March 2020. The observation strategy depended on the epoch, serving various purposes: high-precision astrometry (taking a series of short exposures in the filter), deep imaging for studying the coma (stacking a long series of images), and for studying the colour of the object (alternating short images through the , , , , and filters). The journal of the observations is listed in Supplementary Table 1. The data were processed in the standard way using ESO MIDAS software, as described in ref. [60]. The photometric calibration was obtained from field stars appearing in the Pan-STARRS and SDSS databases, using the colour corrections from the original filters to SDSS and Cron-Cousins systems as described in ref. [61]. The uncertainty reported included the dispersion on the photometric zero-points, the noise from the measurement and the error from sky background subtraction.
The magnitudes of the comet were measured through a series of circular apertures, the residual background being estimated from the median of a large region far from the object. The magnitudes measured using a radius aperture are reported in Supplementary Table 2. The magnitudes are converted into , where is the dust reflectivity (i.e., albedo), is the dust filling factor and is the linear radius of the field of view at the comet [62]. An order-of-magnitude dust mass loss rate could be derived from (see ref.[26]) if we specify the dust velocity , the dust mass density , the mean dust size inferred from optical observations, and the dust geometrical albedo :
| (5) |
By taking , , , and (ref. [26, 27]), we derived the dust mass loss rates and listed them in Supplementary Table 2. We note that these are just order-of-magnitude estimates since the optical observations typically probe small, micron-sized dust more effectively than mm-sized dust and the mean dust size of was inferred indirectly from dynamical models [26, 27].
Acknowledgements
We thank Pei-Ying Hsieh, Chentao Yang for help with the ALMA data, Zahed Wahhaj, David Jewitt, Xuejuan Yang and the referees for their very constructive comments. This paper makes use of the following ALMA data: ADS/JAO.ALMA#2019.A.00002.S. ALMA is a partnership of ESO (representing its member states), NSF (USA) and NINS (Japan), together with NRC (Canada), MOST and ASIAA (Taiwan), and KASI (Republic of Korea), in cooperation with the Republic of Chile. The Joint ALMA Observatory is operated by ESO, AUI/NRAO and NAOJ. Based on observations collected at the European Organisation for Astronomical Research in the Southern Hemisphere under ESO program 105.205Q.001. A.L. was supported in part by NSF AST-1816411, HST-AR-15037.001-A, and Chandra TM9-20009X. M.A.C. was supported by the National Science Foundation (under Grant No. AST-1614471) and K.J.M. and J.V.K. were supported by NASA (Grant No. 80NSSC18K0853).
Author contributions statement
B.Y. led the application and organization of the ALMA observations and led the writing of this paper. A.L. performed dust modeling of the ALMA data and assisted in the writing of this paper and the ALMA proposal. O.R.H. analyzed the FORS data and M.A.C. analyzed the CO data. C.S.C. assisted in writing the ALMA proposal and reduced the ALMA data. J.P.W. contributed to ALMA observation design and data interpretation. K.J.M., J.V.K. and E.V. were co-Is on the telescope proposals and commented on the manuscript.
Data availability
This work makes use of ALMA dataset ADS/JAO.ALMA#2019.A.00002.S, which is available for download from the ALMA Science Archive (http://almascience.nrao.edu/aq/) following a 9-month proprietary period. The VLT dataset is available for download from the ESO Science Archive (http://archive.eso.org/eso/esoarchivemain.html), under ESO program ID 2103.C-5068 and 0105.C-0250, PI O.R.H., following a 1-year proprietary period.
Competing interests
The authors declare no competing financial or non-financial interests.
References
- [1] Charnoz, S. & Morbidelli, A. Coupling dynamical and collisional evolution of small bodies:. an application to the early ejection of planetesimals from the Jupiter-Saturn region. \JournalTitleIcarus 166, 141–156 (2003).
- [2] Meech, K. J. et al. A brief visit from a red and extremely elongated interstellar asteroid. \JournalTitleNature 552, 378–381 (2017).
- [3] ’Oumuamua ISSI Team et al. The natural history of ‘Oumuamua. \JournalTitleNature Astronomy 3, 594–602 (2019).
- [4] Guzik, P. et al. Initial characterization of interstellar comet 2I/Borisov. \JournalTitleNature Astronomy 4, 53–57 (2020).
- [5] Fitzsimmons, A. et al. Detection of CN Gas in Interstellar Object 2I/Borisov. \JournalTitleAstrophys. J. Letter 885, L9 (2019).
- [6] Opitom, C. et al. 2I/Borisov: A C2-depleted interstellar comet. \JournalTitleAstron. Astrophys. 631, L8 (2019).
- [7] Bodewits, D. et al. The carbon monoxide-rich interstellar comet 2I/Borisov. \JournalTitleNature Astronomy (2020).
- [8] Cordiner, M. A. et al. Unusually high CO abundance of the first active interstellar comet. \JournalTitleNature Astronomy (2020).
- [9] Jewitt, D. et al. The Nucleus of Interstellar Comet 2I/Borisov. \JournalTitleAstrophys. J. Lett. 888, L23 (2020).
- [10] Hui, M.-T., Ye, Q.-Z., Föhring, D., Hung, D. & Tholen, D. J. Physical Characterization of Interstellar Comet 2I/2019 Q4 (Borisov). \JournalTitleAstron. J. 160, 92 (2020).
- [11] Cochran, A. L. et al. The Composition of Comets. \JournalTitleSpace Science Rev. 197, 9–46 (2015).
- [12] Fray, N. et al. Nitrogen-to-carbon atomic ratio measured by COSIMA in the particles of comet 67P/Churyumov-Gerasimenko. \JournalTitleMon. Not. R. Astron. Soc. 469, S506–S516 (2017).
- [13] Levasseur-Regourd, A.-C. et al. Cometary Dust. \JournalTitleSpace Science Rev. 214, 64 (2018).
- [14] A’Hearn, M. F. Comets: looking ahead. \JournalTitlePhilosophical Transactions of the Royal Society of London Series A 375, 20160261 (2017).
- [15] Davidsson, B. J. R. et al. The primordial nucleus of comet 67P/Churyumov-Gerasimenko. \JournalTitleAstron. Astrophys. 592, A63 (2016).
- [16] Fulle, M. The ice content of Kuiper belt objects. \JournalTitleNature Astronomy 1, 0018 (2017).
- [17] Güttler, C. et al. Synthesis of the morphological description of cometary dust at comet 67P/Churyumov-Gerasimenko. \JournalTitleAstron. Astrophys. 630, A24 (2019).
- [18] Li, A. & Greenberg, J. M. From Interstellar Dust to Comets: Infrared Emission from Comet Hale-Bopp (C/1995 O1). \JournalTitleAstrophys. J. Letter 498, L83–L87 (1998).
- [19] Wentworth, C. K. A Scale of Grade and Class Terms for Clastic Sediments. \JournalTitleJournal of Geology 30, 377–392 (1922).
- [20] Johansen, A. & Lambrechts, M. Forming Planets via Pebble Accretion. \JournalTitleAnnual Review of Earth and Planetary Sciences 45, 359–387 (2017).
- [21] Jewitt, D. & Matthews, H. Particulate Mass Loss from Comet Hale-Bopp. \JournalTitleAstron. J. 117, 1056–1062 (1999).
- [22] Bohren, C. F. & Huffman, D. R. Absorption and scattering of light by small particles (New York: Wiley, 1983).
- [23] Divine, N. et al. The Comet Halley Dust and Gas Environment. \JournalTitleSpace Science Reviews 43, 1 (1986).
- [24] Ye, Q. et al. Pre-discovery Activity of New Interstellar Comet 2I/Borisov beyond 5 au. \JournalTitleAstron. J. 159, 77 (2020).
- [25] Jewitt, D. & Luu, J. Initial Characterization of Interstellar Comet 2I/2019 Q4 (Borisov). \JournalTitleAstrophys. J. Letter 886, L29 (2019).
- [26] Cremonese, G. et al. Dust Environment Model of the Interstellar Comet 2I/Borisov. \JournalTitleAstrophys. J. Letter 893, L12 (2020).
- [27] Kim, Y. et al. Coma Anisotropy and the Rotation Pole of Interstellar Comet 2I/Borisov. \JournalTitleAstrophys. J. Letter 895, L34 (2020).
- [28] Pätzold, M. et al. The Nucleus of comet 67P/Churyumov-Gerasimenko - Part I: The global view - nucleus mass, mass-loss, porosity, and implications. \JournalTitleMon. Not. R. Astron. Soc. 483, 2337–2346 (2019).
- [29] Bolin, B. T. et al. Characterization of the Nucleus, Morphology, and Activity of Interstellar Comet 2I/Borisov by Optical and Near-infrared GROWTH, Apache Point, IRTF, ZTF, and Keck Observations. \JournalTitleAstron. J 160, 26 (2020).
- [30] Kolokolova, L., Jockers, K., Chernova, G. & Kiselev, N. Properties of Cometary Dust from Color and Polarization. \JournalTitleIcarus 126, 351–361 (1997).
- [31] Yang, B. et al. Searching for water ice in the coma of interstellar object 2I/Borisov. \JournalTitleAstron. and Astrophys. 634, L6 (2020).
- [32] Hainaut, O. R., Boehnhardt, H. & Protopapa, S. Colours of minor bodies in the outer solar system. II. A statistical analysis revisited. \JournalTitleAstron. Astrophys. 546, A115 (2012).
- [33] Xing, Z., Bodewits, D., Noonan, J. & Bannister, M. T. Water Production Rates and Activity of Interstellar Comet 2I/Borisov. \JournalTitleAstrophys. J. Letter 893, L48 (2020).
- [34] Läuter, M., Kramer, T., Rubin, M. & Altwegg, K. Surface localization of gas sources on comet 67P/Churyumov-Gerasimenko based on DFMS/COPS data. \JournalTitleMon. Not. R. Astron. Soc. 483, 852–861 (2019).
- [35] Rotundi, A. et al. Dust measurements in the coma of comet 67P/Churyumov-Gerasimenko inbound to the Sun. \JournalTitleScience 347, aaa3905 (2015).
- [36] Choukroun, M. et al. Dust-to-Gas and Refractory-to-Ice Mass Ratios of Comet 67P/Churyumov-Gerasimenko from Rosetta Observations. \JournalTitleSpace Science Reviews 216, 44 (2020).
- [37] Singh, P. D., de Almeida, A. A. & Huebner, W. F. Dust Release Rates and Dust-to-Gas Mass Ratios of Eight Comets. \JournalTitleAstronomical J. 104, 848 (1992).
- [38] Lamy, P. L., Toth, I., Weaver, H. A., A’Hearn, M. F. & Jorda, L. Properties of the nuclei and comae of 13 ecliptic comets from Hubble Space Telescope snapshot observations. \JournalTitleAstronomy and Astrophysics 508, 1045–1056 (2009).
- [39] Lorek, S., Gundlach, B., Lacerda, P. & Blum, J. Comet formation in collapsing pebble clouds. What cometary bulk density implies for the cloud mass and dust-to-ice ratio. \JournalTitleAstron. Astrophys. 587, A128 (2016).
- [40] Mannel, T. et al. Dust of comet 67P/Churyumov-Gerasimenko collected by Rosetta/MIDAS: classification and extension to the nanometer scale. \JournalTitleAstron. Astrophys. 630, A26 (2019).
- [41] Weidenschilling, S. J. Aerodynamics of solid bodies in the solar nebula. \JournalTitleMon. Not. R. Astron. Soc. 180, 57–70 (1977).
- [42] Zsom, A., Ormel, C. W., Güttler, C., Blum, J. & Dullemond, C. P. The outcome of protoplanetary dust growth: pebbles, boulders, or planetesimals? II. Introducing the bouncing barrier. \JournalTitleAstron. Astrophys. 513, A57 (2010).
- [43] Mukai, T. & Fechtig, H. Packing effect of fluffy particles. \JournalTitlePlanetary and Space Science 31, 655–658 (1983).
- [44] Feaga, L. M. et al. Uncorrelated Volatile Behavior during the 2011 Apparition of Comet C/2009 P1 Garradd. \JournalTitleAstron. J. 147, 24 (2014).
- [45] Cooper, J. F., Christian, E. R., Richardson, J. D. & Wang, C. Proton Irradiation of Centaur, Kuiper Belt, and Oort Cloud Objects at Plasma to Cosmic Ray Energy. \JournalTitleEarth Moon and Planets 92, 261–277 (2003).
- [46] Garrod, R. T. Simulations of Ice Chemistry in Cometary Nuclei. \JournalTitleAstrophys. J. 884, 69 (2019).
- [47] Jehin, E. et al. Monitoring of the optical spectrum of comet 2I/Borisov at the VLT. In European Planetary Science Congress, EPSC2020–653 (2020).
- [48] Bolin, B. T. & Lisse, C. M. Constraints on the spin-pole orientation, jet morphology, and rotation of interstellar comet 2I/Borisov with deep HST imaging. \JournalTitleMon. Not. R. Astron. Soc. 497, 4031–4041 (2020).
- [49] Walsh, K. J., Morbidelli, A., Raymond, S. N., O’Brien, D. P. & Mandell, A. M. A low mass for Mars from Jupiter’s early gas-driven migration. \JournalTitleNature 475, 206–209 (2011).
- [50] Batalha, N. M. Exploring exoplanet populations with NASA’s Kepler Mission. \JournalTitleProceedings of the National Academy of Science 111, 12647–12654 (2014).
- [51] Kolokolova, L., Hanner, M. S., Levasseur-Regourd, A. C. & Gustafson, B. Å. S. Physical properties of cometary dust from light scattering and thermal emission, Comets II, 577 (University of Arizona Press, Tucson, 2004).
- [52] Kimura, H., Kolokolova, L., Li, A. & Lebreton, J. Light Scattering and Thermal Emission by Primitive Dust Particles in Planetary Systems, Light Scattering Reviews, 363–418 (Springer, 2016).
- [53] Draine, B. T. & Lee, H. M. Optical properties of interstellar graphite and silicate grains. \JournalTitleAstrophysical Journal 285, 89–108 (1984).
- [54] Li, A. & Greenberg, J. M. A unified model of interstellar dust. \JournalTitleAstron. Astrophys. 323, 566–584 (1997).
- [55] Bardyn, A. et al. Carbon-rich dust in comet 67P/Churyumov-Gerasimenko measured by COSIMA/Rosetta. \JournalTitleMon. Not. R. Astron. Soc. 469, S712–S722 (2017).
- [56] Jessberger, E. K., Christoforidis, A. & Kissel, J. Aspects of the major element composition of Halley’s dust. \JournalTitleNature 332, 691–695 (1988).
- [57] Li, A. & Lunine, J. I. Modeling the Infrared Emission from the HD 141569A Disk. \JournalTitleAstrophys. J. 594, 987–1010 (2003).
- [58] Lasue, J., Levasseur-Regourd, A. C., Hadamcik, E. & Alcouffe, G. Cometary dust properties retrieved from polarization observations: Application to C/1995 O1 Hale Bopp and 1P/Halley. \JournalTitleIcarus 199, 129–144 (2009).
- [59] Draine, B. T. & Flatau, P. J. Discrete-dipole approximation for scattering calculations. \JournalTitleJournal of the Optical Society of America A 11, 1491–1499 (1994).
- [60] Hainaut, O. R. et al. Disintegration of active asteroid P/2016 G1 (PANSTARRS). \JournalTitleAstron. Astrophys. 628, A48 (2019).
- [61] Tonry, J. L. et al. The Pan-STARRS1 Photometric System. \JournalTitleAstrophys. J. 750, 99 (2012).
- [62] A’Hearn, M. F., Schleicher, D. G., Millis, R. L., Feldman, P. D. & Thompson, D. T. Comet Bowell 1980b. \JournalTitleAstron. J. 89, 579–591 (1984).
Supplementary information
—————–
| Date | Filt. | G. lat. | TA | PlAng | STO | PsAng | PsAMV | ||||
|---|---|---|---|---|---|---|---|---|---|---|---|
| UT | [s] | [au] | [au] | [deg] | [deg] | [deg] | [deg] | [deg] | [deg] | ||
| 2019-Nov-24 | 3 | 21 | 2.0318 | 2.1126 | 46.7 | 349.7 | -17.4 | 27.5 | 289.1 | 330.3 | |
| 3 | 60 | ||||||||||
| 3 | 30 | ||||||||||
| 3 | 24 | ||||||||||
| 3 | 45 | ||||||||||
| 2019-Dec-01 | 7 | 50 | 2.0132 | 2.0467 | 43.9 | 354.7 | -16.8 | 28.1 | 289.2 | 329.4 | |
| 2019-Dec-03 | 7 | 50 | 2.0101 | 2.0307 | 43.0 | 356.1 | -16.6 | 28.2 | 289.3 | 329.0 | |
| 2019-Dec-26 | 3 | 21 | 2.0445 | 1.9372 | 29.6 | 12.6 | -11.5 | 28.4 | 292.5 | 322.7 | |
| 3 | 60 | ||||||||||
| 3 | 30 | ||||||||||
| 3 | 24 | ||||||||||
| 3 | 45 | ||||||||||
| 2019-Dec-27 | 21 | 147 | 2.0489 | 1.9369 | 29.0 | 13.3 | -11.2 | 28.4 | 292.7 | 322.4 | |
| 2020-Jan-27 | 28 | 196 | 2.2895 | 2.0441 | 10.1 | 32.9 | -0.55 | 25.4 | 303.9 | 305.7 | |
| 2020-Feb-18 | 28 | 2520 | 2.5560 | 2.2149 | 0.6 | 43.9 | 6.3 | 22.5 | 317.3 | 292.8 | |
| 2020-Feb-19 | 7 | 490 | 2.5696 | 2.2238 | 0.2 | 44.3 | 6.5 | 22.3 | 318.1 | 292.4 | |
| 3 | 600 | ||||||||||
| 3 | 240 | ||||||||||
| 3 | 300 | ||||||||||
| 3 | 450 | ||||||||||
| 2020-Feb-27 | 55 | 4850 | 2.6820 | 2.2983 | -2.2 | 47.7 | 8.5 | 21.2 | 324.5 | 289.0 | |
| 2020-Feb-29 | 112 | 10080 | 2.7111 | 2.3177 | -2.8 | 48.5 | 9.0 | 20.9 | 326.2 | 288.4 | |
| 2020-Mar-01 | 28 | 2520 | 2.7257 | 2.3276 | -3.0 | 48.9 | 9.2 | 20.8 | 327.1 | 288.0 |
| Epoch | ||||||||
|---|---|---|---|---|---|---|---|---|
| (UT) | (%/100) | (m) | () | |||||
| 2019-Nov-24 | 17.97 0.03 | 17.19 0.02 | 16.72 0.02 | 16.29 0.03 | 16.53 0.03 | 11.0 0.9 | 0.63 0.03 | 42 |
| 2019-Dec-01 | 16.69 0.03 | 0.62 0.03 | 41 | |||||
| 2019-Dec-03 | 16.67 0.03 | 0.63 0.03 | 42 | |||||
| 2019-Dec-26 | 18.07 0.03 | 17.29 0.02 | 16.82 0.03 | 16.36 0.03 | 16.63 0.03 | 11.4 1.0 | 0.54 0.03 | 36 |
| 2019-Dec-27 | 16.82 0.03 | 0.54 0.03 | 35 | |||||
| 2020-Jan-27 | 17.22 0.05 | 0.49 0.03 | 32 | |||||
| 2020-Feb-18 | 17.48 0.05 | 0.52 0.03 | 34 | |||||
| 2020-Feb-19 | 18.96 0.03 | 17.95 0.02 | 17.52 0.03 | 16.58 0.03 | 17.40 0.05 | 9.3 3.0 | 0.52 0.02 | 34 |
| 2020-Feb-27 | 17.51 0.05 | 0.58 0.03 | 38 | |||||
| 2020-Feb-29 | 17.62 0.05 | 0.54 0.04 | 36 | |||||
| 2020-Mar-01 | 17.55 0.06 | 0.59 0.04 | 40 |