1 \contribtype2 \thematicarea1 \contactcgescudero@fcaglp.unlp.edu.ar 11institutetext: Facultad de Ciencias Astronómicas y Geofísicas, UNLP, Argentina 22institutetext: Instituto de Astrofísica de La Plata, CONICET–UNLP, Argentina 33institutetext: Instituto de Astronomía, Geofísica y Ciencias Atmosféricas, USP, Brasil
Pixel color-magnitude diagrams of galaxies in the
Fornax cluster using S-PLUS images
Los cúmulos de galaxias son los sistemas ligados gravitacionalmente más grandes del Universo y, como tales, juegan un papel importante en los estudios cosmológicos. Un recurso importante para estudiar sus propiedades de manera estadística es utilizar conjuntos de datos de imágenes homogéneos y de gran cobertura areal que puedan abarcar diversos medioambientes. En este sentido, las imágenes de campo amplio (1.4 grados2) obtenidas por el Southern Photometric Local Universe Survey (S-PLUS) en 12 bandas ópticas, constituyen una valiosa herramienta para ese tipo de estudios. En este trabajo, presentamos un análisis fotométrico de los denominados diagramas color-magnitud pixelados, correspondiente a una muestra de 24 galaxias de diversos tipos morfológicos ubicadas en el cúmulo de Fornax.
Abstract
Galaxy clusters are the largest gravitationally bound systems in the Universe and, as such, play an important role in cosmological studies. An important resource for studying their properties in a statistical manner are homogeneous and large image datasets covering diverse environments. In this sense, the wide-field images (1.4 deg2) obtained by the Southern Photometric Local Universe Survey (S-PLUS) in 12 optical bands, constitute a valuable tool for that type of studies. In this work, we present a photometric analysis of pixel color-magnitude diagrams, corresponding to a sample of 24 galaxies of different morphological types located in the Fornax cluster.
keywords:
surveys — galaxies: clusters: individual (Fornax) — galaxies: photometry1 Introduction
Galaxy clusters are the largest gravitationally bound systems in the Universe and, as such, play an important role in cosmological studies. According to the hierarchical clustering scenario, galaxy clusters continuously grow by accreting individual galaxies, as well as entire galaxy groups. Therefore, they have been regarded as powerful laboratories for studying the physical processes that might have influenced galaxies evolution, such as strong galaxy-galaxy interaction, ram pressure stripping, among others. All these environmental mechanisms result in different morphological properties for cluster and field galaxies. An important resource for studying these properties in a statistical manner are homogeneous and large image datasets covering diverse environments. In this sense, the wide-field images obtained by the Southern Photometric Local Universe Survey (S-PLUS; Mendes de Oliveira et al., 2019) in 12 optical bands, constitute a valuable tool for that type of study (see Section 2 for details).
In this work, we present the pixel color-magnitude diagrams (pCMDs; e.g., Lanyon-Foster et al., 2007) of a sample of 24 galaxies of different morphological types located in the Fornax cluster (d=21.1 Mpc; Blakeslee et al., 2010). Our main goal is to elucidate if this kind of diagrams could be used to detect internal substructures in galaxies and if they could help to carry out a morphological classification of galaxies. According to the distance adopted for Fornax, 1 arcmin corresponds to a scale of 5.81 kpc.
2 S-PLUS and pCMD
S-PLUS is an imaging survey that will cover deg2 in 12 filters, using a robotic 0.8 m-aperture telescope located at the Cerro Tololo Inter-American Observatory (CTIO), Chile. Its wide field camera allows to obtain images of 1.4 1.4 deg2 with a pixel scale of 0.55 arcsec. In addition to the broadband filters , S-PLUS includes 7 narrowband filters centered on the following spectral features: [OII], Ca H+K, H, G-band, Mgb triplet, H and Ca triplet. The characteristics of the survey allow performing an analysis of a large number of objects in a homogeneous manner.
From these photometric data, we built individual pCMDs for 24 galaxies in the Fornax cluster, where each point in these diagrams corresponds to a pixel in the image. However, previously, it was necessary to homogenize the seeing values in the different images and mask the objects near the galaxies, in order to avoid spurious effects in the diagrams. Since the typical seeing value in these images is between 1-2 arcsec, to obtain a pixel scale of the order of the point spread function (PSF), we considered a binning factor of 2. By doing this, we make sure that each pixel is statistically independent of the surrounding pixels, and we improve the signal-to-noise (S/N) ratio in the data. Finally, the flux of each pixel in the 12 bands was converted to apparent magnitude per square arcsec and calibrated to the standard system. We consider the limit at mag arcsec-2 in the diagrams to ensure an S/N5 in each pixel. In this way, it is possible to reach several arcsec of galactocentric radii before the background level begins to affect the diagrams.
3 Morphology
Observing the different pCMDs, a wide range of shapes and features can be seen. However, grouping the galaxies according to their morphological classification de Vaucouleurs et al. (1991), some similarities between the diagrams emerge.
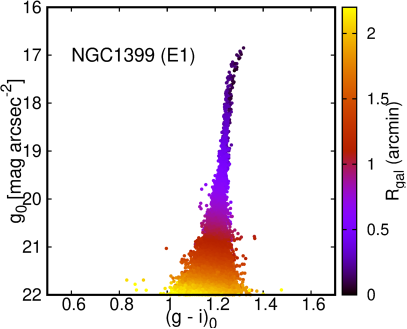
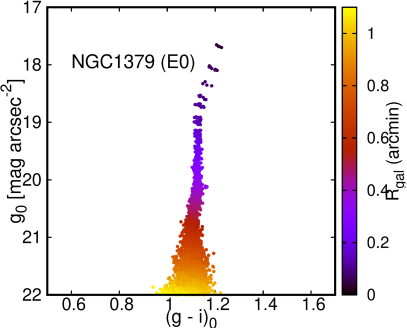
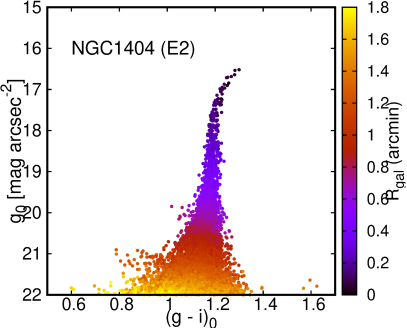
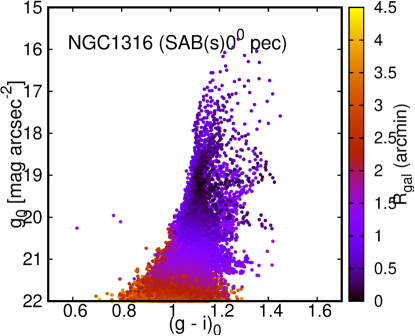
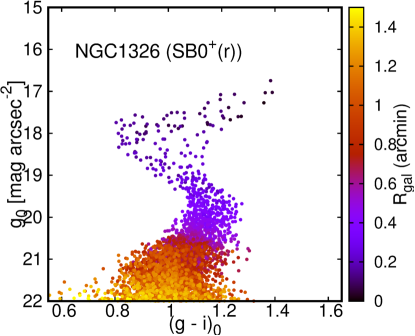
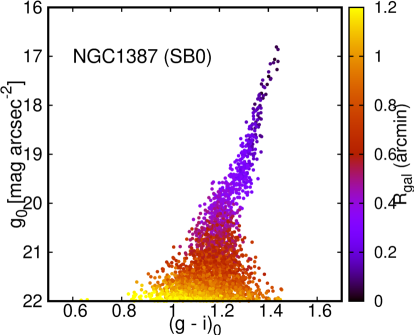
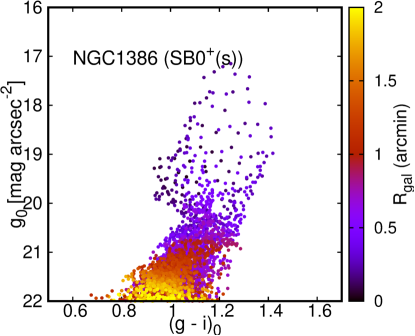
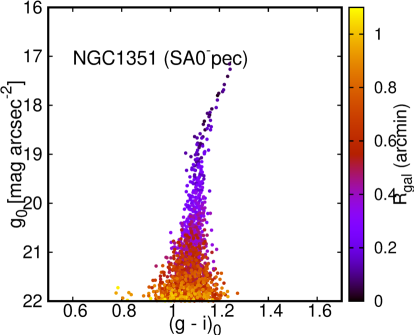
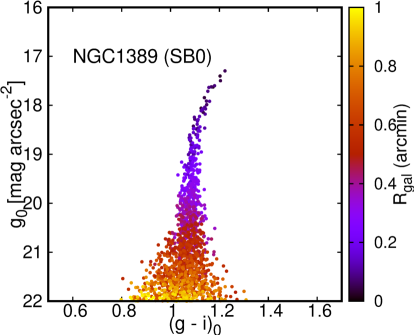
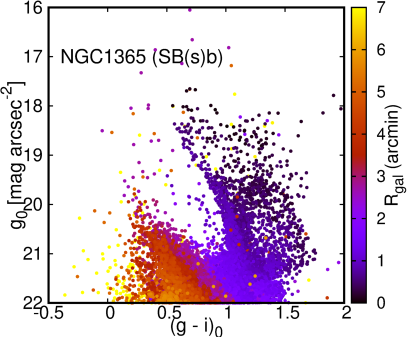
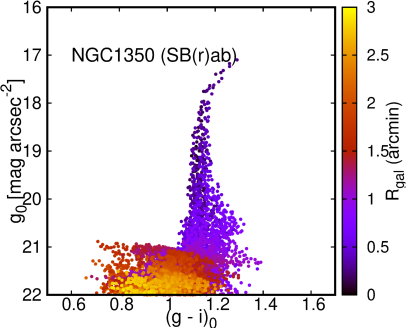
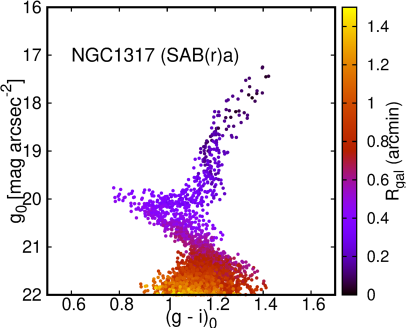
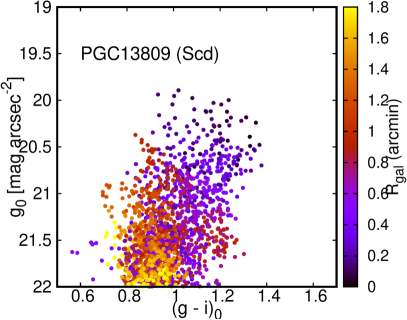
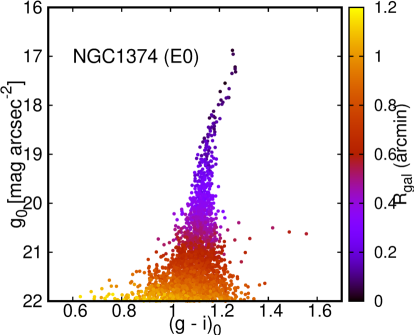
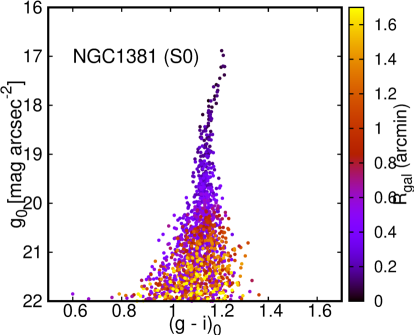
Although the sample analyzed in this work includes 24 galaxies, here we will only present a small group according to morphological type, in order to show the different characteristics among them. In this work, we consider galaxies with M mag in order to obtain a significant number of pixels with S/N5 for each of them. Figures 1, 2 and 3 show the pCMDs for elliptical (E), lenticular (S0) and spiral (S) galaxies, respectively, color-coded according to the distance of each pixel from the galactic center.
At first glance, pCMDs associated to E galaxies (Figure 1) show the same behavior, defining a clear main sequence with average colors mag arcsec-2. This is expected for the E due to their regular structures and the homogeneity in their ages. Furthermore, it is observed that the brightest pixels have slightly redder colors ( mag arcsec-2) compared to the aforementioned sequence.
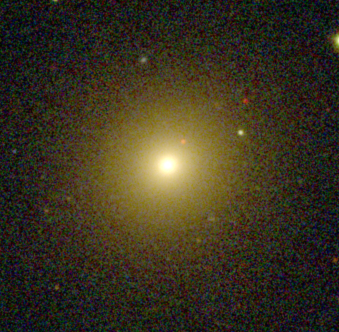
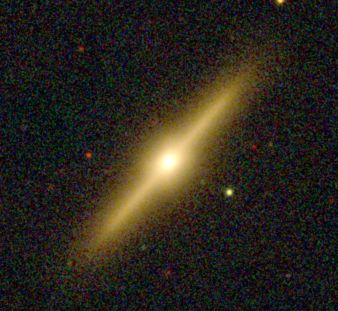
On the other hand, although most of the diagrams of the S0 galaxies (Figure 2) resemble that of the E ones, some of them show complex shapes, such as NGC 1316, NGC 1326, NGC 1386, among others. The different shapes in these diagrams are mainly due to the presence of dust, structures such as bulges, discs, rings, or even star forming regions. It is worth noticing that the pCMDs of NGC 1374, classified as E0, and NGC 1381, classified as S0, are quite similar. We wonder if both galaxies are of the same morphological type, and one of them is misclassified due to a projection/inclination effect. For example, while NGC 1381 is a clear edge-on S0 galaxy, NGC 1374 looks like an elliptical galaxy but it could also be a face-on S0 (Figure 4). Although, in principle, the analysis of its surface brightness profile would allow disentangling its different components, thus being able to determine its morphological type in some cases this analysis is complex and not conclusive.
Finally, in the case of S galaxies (Figure 3), it is observed that their diagrams show more complex structures compared to those of early type galaxies. The pCMDs of spiral galaxies present bluer colors in their outermost pixels ( mag arcsec-2) with respect to their central regions ( mag arcsec-2) and a wider color dispersion. This is due to the presence of star-forming regions, generally associated with spiral arms. Another feature observed in these diagrams is that the color dispersion is influenced by the inclination of the galaxy with respect to the sky plane.


4 Conclusions
Using photometric data from the S-PLUS survey, we built individual pCMDs for 24 galaxies located in the Fornax cluster. By comparing the different diagrams grouped according to their morphological types, certain trends and differences among them are identified. For example, from the particular cases of NGC 1374 and NGC 1381, we wonder if this kind of diagrams could become a powerful tool to clarify dubious morphological classifications, besides allowing the identification of internal substructures.
As future work, we plan to obtain as many pCMDs as possible in Fornax, in order to have a significant statistical sample that will allow us to disentangle the issues mentioned above. In addition, we will explore the ability of these diagrams to provide information on stellar populations in Fornax (e.g., Conroy & van Dokkum, 2016; Lee et al., 2018).
S-PLUS is an international collaboration founded by Universidade de Sao Paulo, Observatório Nacional, Universidade Federal de Sergipe, Universidad de La Serena and Universidade Federal de Santa Catarina. This work was funded with grants from Consejo Nacional de Investigaciones Científicas y Técnicas de la República Argentina, and Universidad Nacional de La Plata (Argentina).
References
- Blakeslee et al. (2010) Blakeslee J.P., et al., 2010, ApJ, 724, 657
- Conroy & van Dokkum (2016) Conroy C., van Dokkum P.G., 2016, ApJ, 827, 9
- de Vaucouleurs et al. (1991) de Vaucouleurs G., et al., 1991, Third Reference Catalogue of Bright Galaxies
- Lanyon-Foster et al. (2007) Lanyon-Foster M.M., Conselice C.J., Merrifield M.R., 2007, MNRAS, 380, 571
- Lee et al. (2018) Lee J.H., et al., 2018, ApJ, 857, 102
- Mendes de Oliveira et al. (2019) Mendes de Oliveira C., et al., 2019, MNRAS, 489, 241