Leveraging Community and Author Context to Explain the Performance and Bias of Text-Based Deception Detection Models
Abstract
Deceptive news posts shared in online communities can be detected with NLP models, and much recent research has focused on the development of such models. In this work, we use characteristics of online communities and authors — the context of how and where content is posted — to explain the performance of a neural network deception detection model and identify sub-populations who are disproportionately affected by model accuracy or failure. We examine who is posting the content, and where the content is posted to. We find that while author characteristics are better predictors of deceptive content than community characteristics, both characteristics are strongly correlated with model performance. Traditional performance metrics such as F1 score may fail to capture poor model performance on isolated sub-populations such as specific authors, and as such, more nuanced evaluation of deception detection models is critical.
1 Introduction
The spread of deceptive news content in online communities significantly erodes public trust in the media Barthel et al. (2016). Most social media users use these platforms as a means to consume news – 71% of Twitter users and 62% of Reddit users – and in general, 55% of Americans get news from online communities such as Facebook, Twitter, and reddit Shearer and Grieco (2019). The scale and speed with which new content is submitted to social media platforms are two key factors that increase the difficulty of how to respond to the spread of misinformation or deceptive news content online, and the appeal of automated or semi-automated defenses or interventions.
Natural language processing (NLP) models that identify deceptive content offer a path towards fortifying online communities, and a significant body of work (§ 2) has produced countless such models for deception detection tasks Rubin et al. (2016); Mitra et al. (2017); Volkova et al. (2017); Rashkin et al. (2017); Karadzhov et al. (2018); Shu et al. (2020). However, evaluation of model performance is typically done in aggregate, across multiple communities, using traditional performance measurements like micro and macro F1-scores. We argue that it is critical to understand model behavior at a finer granularity, and we evaluate nuanced behavior and failure in the context of the populations that may be affected by predictive outcomes.
In this work, we seek to characterize and explain deception detection model performance and biases using the context of social media posts—who posted the content and what community it was posted to. To do so, we compute hundreds of community and author characteristics using information from two fact checking sources.
For a given post, community characteristics detail where a post was submitted to, e.g., How many links to satirical news sources were submitted to the community this post was submitted to? Author characteristics detail who submitted a post, e.g., How many links to satirical news sources has the author recently submitted? Our nuanced evaluation leverages these author and community characteristics to highlight differences in behavior within varying communities or sub-populations, to determine whether the model is reliable in general, or if model failures disproportionately impact sub-populations.
We make use of data from reddit, a popular social news aggregation platform. Reddit is widely used for research Medvedev et al. (2019) due to its large size and public content Baumgartner et al. (2020), and is ideally suited for studying author and community characteristics due to its explicit segmentation into many diverse communities, called “subreddits”, with different sizes, topics, and user-bases.111Although our analyses focus exclusively on posts, our approach can easily be extended to include comments in future work. We chose to focus on posts in the current work as they are the primary point of entry for news links submitted to the platform, with many users simply browsing the ranked previews Glenski et al. (2017) as is consistent with social media platforms where a small subset of users typically contribute most new content van Mierlo (2014); Hargittai and Walejko (2008).
We use post context (community and author characteristics) and content (text features) to address two research questions focused around (1) who posts deceptive news links and (2) where they post differ:
-
1.
What characteristics of post authors are associated with high and low model performance?
-
2.
How does model performance vary across different communities, and does this correlate with characteristics of those communities?
We find that author characteristics are a stronger predictor of high model performance, with the model we evaluate performing especially well on authors who have a history of submitting low factual or deceptive content. We also find that the model performs especially well on posts that are highly accepted by the community, as measured by the community’s votes on those posts.
To our knowledge, we are the first to present a fine-grained evaluation of deception detection model performance in the context of author and community characteristics.
2 Related Work
In the last several years, users have seen a tremendous increase in the amount of misinformation, disinformation, and falsified news in circulation on social media platforms. This seemingly ubiquitous digital deception is in part due to the ease of information dissemination and access on these platforms. Many researchers have focused on different areas of detecting deceptive online content. Glenski and Weninger (2018); Kumar et al. (2017, 2018) examine the behaviors and activities of malicious users and bots on different social media platforms. While others have worked to develop systems to identify fraudulent posts at varying degrees of deception such as broadly classifying suspicious and non-suspicious news Volkova et al. (2017) to further separating into finer-grained deceptive classes (e.g., propaganda, hoax) Rashkin et al. (2017).
Common amongst recent detection methods is the mixed use of machine learning approaches, e.g., Random Forest and state-of-the-art deep learning models, e.g., Hierarchical Propagation Networks Shu et al. (2020). Of the most prevalent are convolutional neural networks (CNNs) Ajao et al. (2018); Wang (2017); Volkova et al. (2017), Long Short Term Memory (LSTM) neural networks Ma et al. (2016); Chen et al. (2018); Rath et al. (2017); Zubiaga et al. (2018); Zhang et al. (2019), and other variants with attention mechanisms Guo et al. (2018); Li et al. (2019). Designing the right model architecture for a task can be very subjective and laborsome. Therefore, we implement the binary classification LSTM model from Volkova et al. (2019) which reported an F1 score of 0.73 when distinguishing deceptive news from credible.
As artificial intelligence or machine learning models are developed or investigated as potential responses to the issue of misinformation and digital deception online, it is key to understand how models treat the individuals and groups who are impacted by the predictions or recommendations of the models or automated systems. For example, the European Union’s GDPR directly addresses the “right of citizens to receive an explanation for algorithmic decisions” Goodman and Flaxman (2017) that requires an explanation to be available for individuals impacted by a model decision. Domains outside of deception detection have shown clear evidence of disproportionate biases against certain sub-populations of impacted individuals, e.g., predictive policing Ensign et al. (2018), recidivism prediction Chouldechova (2017); Dressel and Farid (2018), and hate speech and abusive language identification online Park et al. (2018); Davidson et al. (2019); Sap et al. (2019). The realm of deception detection is another clear area where disparate performance across communities or certain user groups may have significant negative downstream effects both online and offline. In this work, we seek to go beyond traditional, aggregate performance metrics to consider the differing behavior and outcomes of automated deception detection within and across communities and user characteristics.
3 Deception Detection Model
In this work, we focus on a binary classification task to identify posts which link to Deceptive or Credible news sources. We evaluate an existing, LSTM-based model architecture previously published by Volkova et al. (2019) that relies only on text and lexical features. As such, we refer to this model as the “ContentOnly model.”
3.1 Train and Test Data
To replicate the ContentOnly model for our evaluations, we leverage the previously used list of annotated news sources from Volkova et al. (2017) as ground truth. The Volkova annotations consist of two classes: “Credible222This class is denoted “Verified” in Volkova et al. (2017).” and “Deceptive.” To label individual social media postings linked to these news sources, we propagate annotations of each source to all posts linked to the source. Therefore Credible posts are posts which link (via a URL or as posted by the source’s official account) to a Credible news source and Deceptive posts are posts that link to a news source annotated as Deceptive.
In preliminary experiments, we find that model performance improves when Twitter examples are included in training, even when testing exclusively on reddit content. A model trained and tested exclusively on reddit data achieves a test set F1 of 0.577 and we observe a dramatic increase (F1 = 0.725), when we include the Twitter training data. As a result, we focus our analyses using the more robust ContentOnly model trained on both Twitter and reddit examples. As Twitter has no explicit communities equivalent to reddit subreddits, it is not possible to compute the same community characteristics for Twitter content. As such, in the analyses presented in this paper, we focus exclusively on content posted to reddit in the test set.
To gather train and test data, we collect social media posts from Twitter and reddit from the same 2016 time period as annotated by Volkova et al. (2017). For Twitter posts, this resulted in 54.4k Tweets from the official Twitter accounts for news sources that appear in the Volkova annotations. For reddit content, we collected all link-posts that link to domains associated with the labelled news sources from the Pushshift monthly archives of reddit posts333Pushshift archives of reddit data were collected from https://files.pushshift.io/reddit/ Baumgartner et al. (2020), and randomly sample approximately the same number (k) of link-posts as Twitter posts collected.
In order to mitigate the bias of class imbalance on our analyses, these posts were then randomly down-sampled to include an approximately equal number of posts from/linking to deceptive and credible news sources. We divided the resulting data using a random, stratified 80%/20% split to create train and test sets, respectively.
4 Community & Author Characteristics
To evaluate fine-grained model performance and biases, we first quantify the context in which posts are submitted, using community and author characteristics.
4.1 Data for Context Annotations
We compute community and author characteristics by examining the entire post history on reddit for each community and author in the test set. We use annotations from Volkova et al. (described above, § 3.1) and from Media Bias/Fact Check (MBFC), an independent news source classifier. These annotations were compiled by Weld et al. (2021) and made publicly available444https://behavioral-data.github.io/news_labeling_reddit/.
The Volkova et al. annotations provide links to news sources with a categorical label: verified, propaganda, satire, clickbait, conspiracy, and hoax. The MBFC annotations provide links to news sources with a ordinal label for the factualness of the news source (very low, low, mixed, mostly, high, very high) as well as the political bias (extreme left, left, center left, center, center right, right, extreme right). In addition, the MBFC also include a few categorical labels applicable to a subset of news sources: questionable, satire, conspiracy.
4.2 Data Validation
Before using these annotations to compute community and author characteristics, we would like to validate that they represent meaningful and accurate aspects of communities and authors, respectively, and are not strongly influenced by noise in the annotation sources. To do so, we assess the coverage of our context annotations, — i.e., the fraction of potential news links that we were able to label.
In order to consider the coverage relative to the potential news links, we identify a set of domains for which links are definitively not news sources. We identified these non-news links by examining the top 1,000 most frequently linked-to domains across all of reddit and iteratively classified them as non-news based on their domain (e.g., reddit-based content hosting domains such as v.redd.it and i.redd.it, external content hosts such as imgur.com, social sites such as facebook.com and instagram.com, search engines, shopping platforms, music platforms, etc.). Websites which were not in English, were not clearly non-news domains, or which did not fit into a clear category, were included in the set of potential news sources. We imposed these restrictions to mitigate potential downward bias from over-estimating non-news links. Although we do not claim to have an exhaustive coverage of non-news links, non-news links included in the set of potential news links at best underrepresents the coverage which is preferable to overrepresentation.
Encouragingly, coverage for both are fairly stable over time, suggesting that there are no significant influxes of additional, unlabelled news sources (or disappearances of retired news sources) that might be biasing our approach. As the MBFC set contains more news sources, the coverage is greater ( on average) than the Volkova set ().
4.3 Community and Author Characteristics
Using the author and community history collection of posts and the associated MBFC and Volkova et al. annotations, we compute context characteristics for each subreddit community and author that is present in the test set described in § 3.
First, we compute the general activity of each community and author. These characteristics include the total number of posts by each community or author, the total number of removed posts, and similar overall counts that do not consider the nature of the content submitted.
Second, for each of the MBFC and Volkova et al. labels (e.g., ‘Satire’ from Volkova et al. or ‘Right Bias’ from MBFC) we compute absolute and normalized counts of links of each category for each community and author. Normalized counts for each category are computed by dividing the number of links in the category submitted to each subreddit or by each author by the total number of links submitted in any category. This gives, for example, the fraction of links submitted by a author to MBFC High Factual news sources.
Third, for communities, we compute the equality of contributor activity (number of links submitted per contributor) using the Gini coefficient. A community with a Gini coefficient close to 1 would indicate almost all links in that community were submitted by a small fraction of users. On the other hand, a coefficient close to 0 would indicate that all users of the community who submit links submit approximately the same number of links each.
Last, again for communities, we approximate the community acceptance by normalizing the score (upvotes - downvotes) of each post relative to the median score of all posts submitted to the subreddit. A post with a normalized score of 1 received a typical score for the community it was submitted to, whereas a post with a normalized score of 100 received as many upvotes as a typical post and was more widely or strongly positively received by the community.
Each of the community characteristics are computed separately for each month, maximizing temporal detail. However, as the typical reddit user submits far less content each month than the typical subreddit receives, most users’ counts for specific link types (e.g., MBFC Satire) for any individual month will be 0. To reduce sparsity in the data, we use a rolling sum of all posts submitted by the author in the specified month and the five preceding months to compute author characteristics.
5 Evaluation Methodology
Before our evaluation of model performance across different community or author characteristics and settings, we examine the overall performance of the model on aggregate, using macro F1 score, and the variance of performance within communities. A model with strong aggregate performance may have significant variability within sub-communities, especially those which are underrepresented. We also consider the variability of individual predictive outcomes, such as the confidence of predictions, across each class (deceptive and credible news) to examine the differences in model behavior across classes overall. We aim to discover if the model treats all posts, communities, and authors equally, or if there are differences in performance for certain groups that would bias the negative impacts of model error.
5.1 Comparison to Baselines
Next, we frame the performance of the ContentOnly model that classifies posts based on text and linguistic signals relative to naive baselines that randomly classify posts or classify posts based on the typical behavior of authors or communities. To this end, we consider three baseline models.
The Author History Baseline considers the author’s history over the previous 6 months (as was used to calculate author characteristics) and computes the fraction of their links to news sources which are deceptive, as defined by the Volkova et al. annotations. It then predicts if a new submission is deceptive or credible with a biased random coin flip, with a probability of predicting deceptive equal to the author’s recent tendency to submit deceptive news links (i.e., the fraction of news links submitted by the author in the last six months that were linked to deceptive sources).
The Community History Baseline is similar except that it considers the community’s tendency to receive deceptive news. This baseline predicts ‘deceptive’ with a probability equal to the fraction of news links submitted to a given subreddit in the last month that were linked to deceptive sources.
The 50/50 Baseline predicts credible/deceptive with an unbiased 50/50 coinflip. No consideration is placed on the content, community, or author.
We compare the performance of these baselines with that of the ContentOnly model, providing a reference for its performance as well as an indication of the degree to which community and author characteristics alone are predictive of deceptive content.
5.2 Community and Author Context
To better understand how community and author characteristics explain model performance, we compute the Pearson correlation between the value of each characteristic, and the model’s confidence in predicting the true class for each post. We compute these correlations across the all test posts, and across deceptive and credible posts (based on true class value) separately. We also examine factors that explain the model’s performance on entire authors or communities. To do so, we compute similar correlations for author and community characteristics with aggregated author or community F1 scores, respectively.
5.3 Popularity and Community Acceptance
We also examine the relationship between a community’s acceptance of a post, and model performance. We measure community acceptance by normalizing each post’s score (# upvotes - # downvotes) by the median score of a post in that community for the month of submission, to control for the larger number of votes in larger communities. We then compute Pearson’s correlations between normalized score and the ContentOnly model’s confidence that a post belongs to its annotated class – here we use not the models prediction confidence but the confidence for the "true class" given the groundtruth labels. As before, we use Pearson correlations and a significance threshold of 0.05.
6 Results
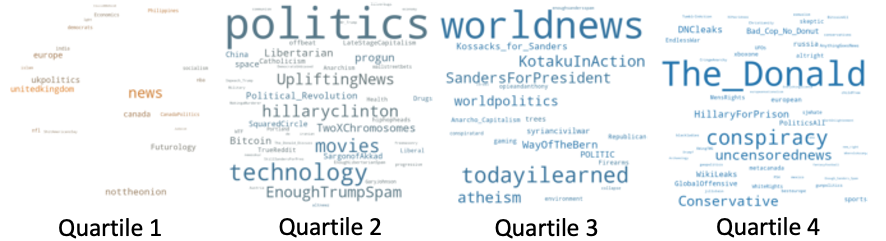
Although the ContentOnly model achieves an overall F1 score on the test set of 0.79, we see that the model performs much better on content from some communities than others (see Figure 2). Figure 1 presents the communities within the test set, partitioned by levels of model performance using the quartiles for the F1 scores. We find that 20% of the communities represented in our test set have F1 , despite an overall test set F1 of almost 0.8.
In the following subsections, we examine how the model’s performance can be explained by community and author characteristics, post popularity, and community acceptance as we seek to understand why the model performs far better on content from some communities than others.
6.1 Comparison to Baselines
We use the community and author history baselines, as well as the 50/50 baseline described in §5.1 to contextualize the performance of the ContentOnly model. Figure 3 presents the distributions of performance across communities for each metric (solid lines) and the overall performance of each model (indicated by the dashed, vertical lines) using three traditional performance metrics: precision, recall, and F1 score. As expected, the ContentOnly model (in blue) dramatically outperforms the 50/50 baseline (in red) on all metrics, and achieves the best performance overall for F1 score (a significant difference in performance, p-value ).
However, the community and author history baselines have very high precision, offset by very poor recall. In comparing the two, the author baseline significantly outperforms the community baseline on precision, recall, and F1 (p-value ). This suggests that an author’s previous activity is a better predictor of whether an author will submit deceptive content in the future than a community’s previous behavior is of whether deceptive content will be submitted to the community in the future. This may be a result of a greater consistency in the behavior of an individual compared to a community where membership may vary over time, if not community attitudes.
6.2 Community and Author Context
In our next analyses, we investigate how community and author characteristics correlate with model confidence. We compute these correlations across the entire test set, as well as for just credible and deceptive posts separately.
We summarize the strongest, significant correlations between community or author context and model confidence in Table 1, using a threshold of at least 0.25 for inclusion. When we examine the author and community characteristics of posts from all classes, the strongest correlation coefficients are all positive, and suggest moderate correlations with stronger model confidence. The four strongest correlations from the author characteristics pertain to the author’s tendency to submit posts linked to questionable or low factual news sources. In contrast, the author’s tendency to link to high factual content is relatively correlated () with weaker model confidence. It is easier for the model to identify deceptive posts submitted by authors who typically submit links to low-quality or deceptive news sources. Similarly, we see moderate correlation between increasing presence of deceptive or low factual news media in the community and model performance. Looking at each class individually, we see the strongest relationships for deceptive posts, with little to no correlation for credible posts.
| All | C Posts | D Posts | ||
| Author’s Links | Bias | |||
| % Center Right Bias | +0.25 | -0.00 | +0.27 | |
| Categorical | ||||
| …. % Propaganda (Volkova) | +0.35 | +0.08 | +0.20 | |
| % Questionable (MBFC) | +0.37 | +0.10 | +0.20 | |
| Factualness | ||||
| % Very Low Factual | +0.33 | +0.07 | +0.29 | |
| Community’s Links | Bias | |||
| # Right Bias | +0.25 | +0.18 | +0.08 | |
| Categorical | ||||
| # Clickbait (Volkova) | +0.25 | +0.17 | +0.06 | |
| # Questionable (MBFC) | +0.26 | +0.18 | +0.08 | |
| Factualness | ||||
| # Very Low Factual | +0.31 | +0.15 | +0.17 | |
| # Low Factual | +0.25 | +0.16 | +0.07 | |
| Inequality | ||||
| Gini Coefficient (# Links) | +0.32 | +0.18 | +0.13 | |
| Post Score | +0.12 | -0.08 | +0.27 |
| Features Positively Correlated with Metric | Features Negatively Correlated with Metric | |||||||
| Community Feature | Author Feature | Community Feature | Author Feature | |||||
| F1-Score | ||||||||
| () Deceptive | 0.80‡ | () Deceptive | 0.85‡ | () High Factual | -0.43‡ | () Mostly Factual | -0.70† | |
| () Deceptive | 0.40‡ | () High Factual | -0.42‡ | |||||
| () Low Factual | 0.39‡ | () Center Bias | -0.36† | |||||
| () V. Low Factual | 0.37† | |||||||
| () Extr. Right Bias | 0.36† | |||||||
| () Mixed Factual | 0.33† | |||||||
| Precision | ||||||||
| () Deceptive | 0.89‡ | () Deceptive | 0.89‡ | () High Factual | -0.33† | () V. High Factual | -0.48† | |
| () Low Factual | 0.48‡ | () Deceptive | 0.33‡ | () High Factual | -0.46† | |||
| () Extr. Right Bias | 0.45‡ | () Center Left Bias | -0.45† | |||||
| () Mixed Factual | 0.44‡ | () Center Bias | -0.40† | |||||
| () V. Low Factual | 0.43‡ | |||||||
| () Deceptive | 0.42‡ | |||||||
| Recall | ||||||||
| () Deceptive | 0.35† | |||||||
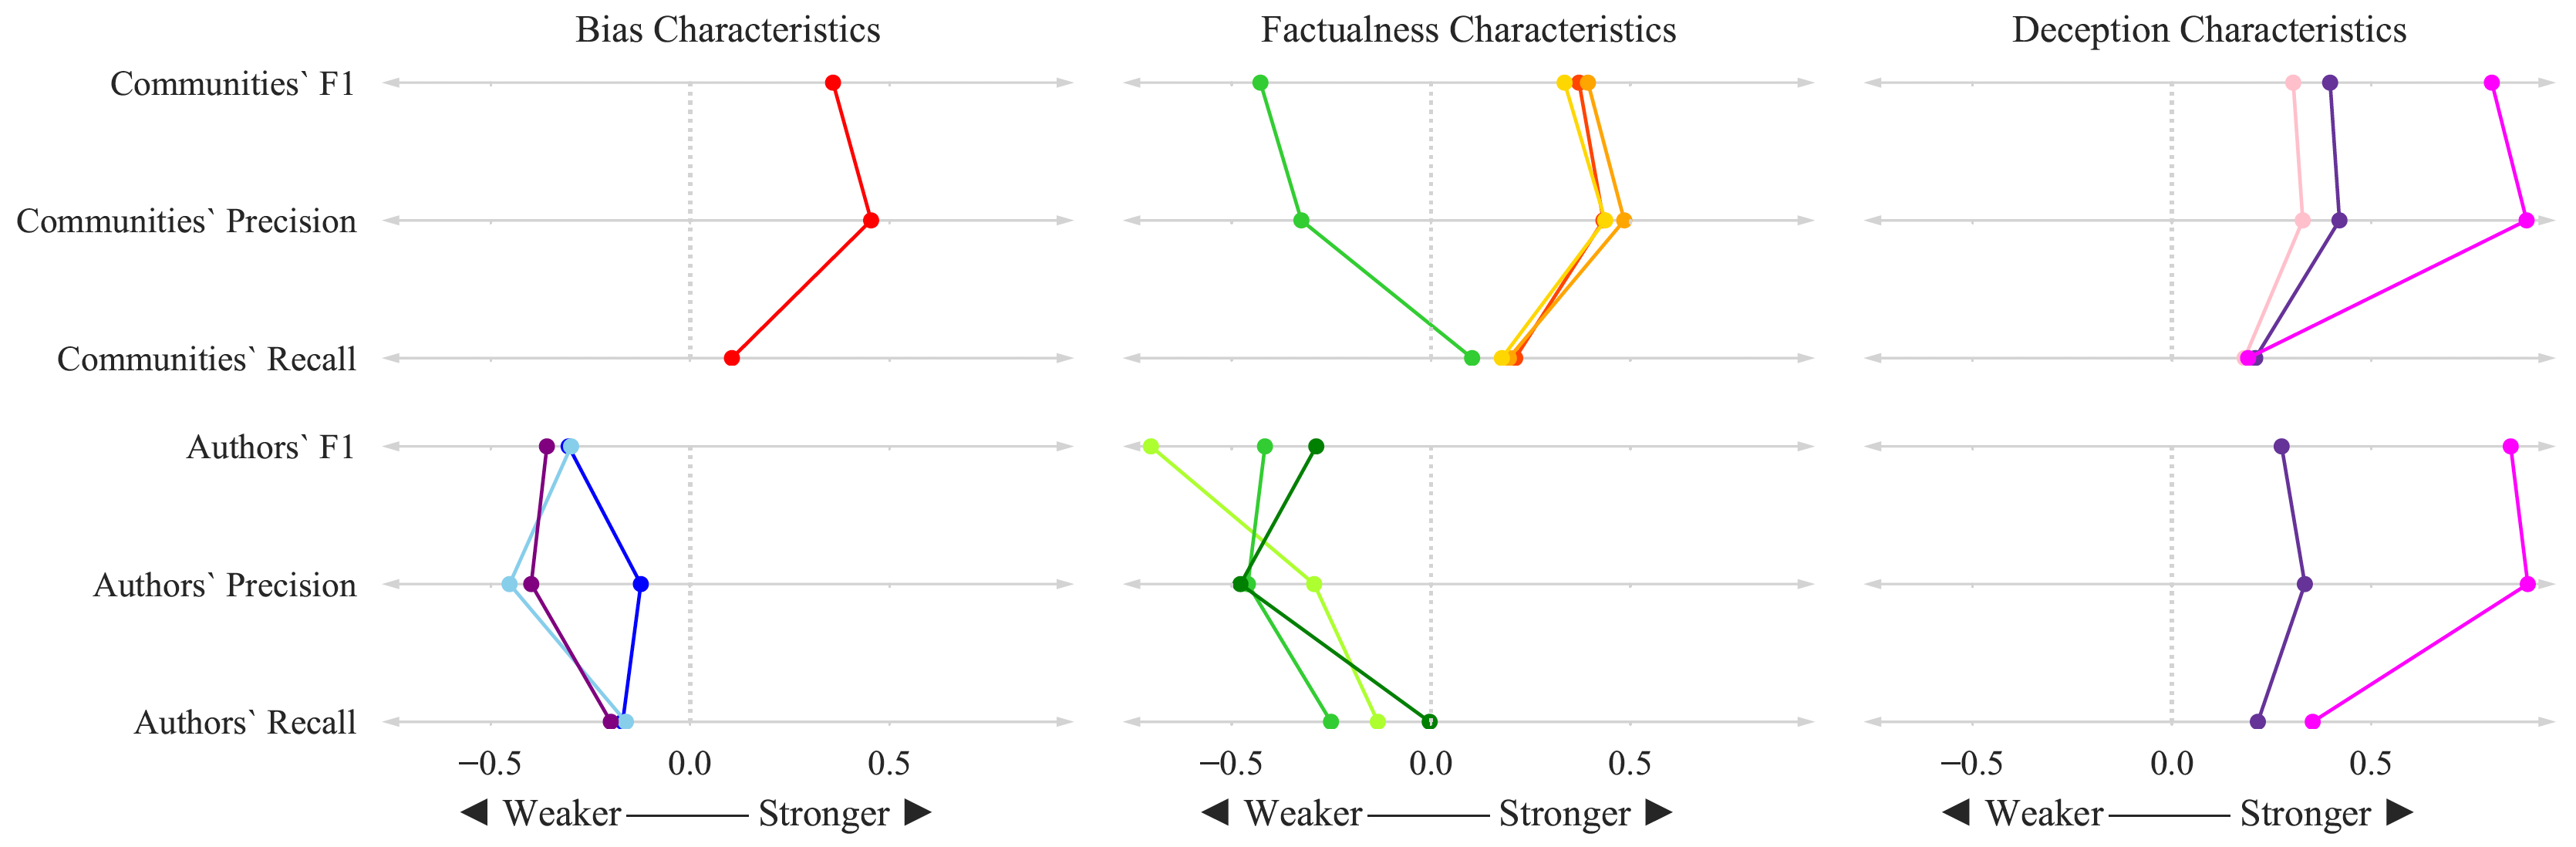
To examine factors that explain the model’s performance in aggregate, we consider performance across individual authors and communities. First, compute performance metrics (precision, recall, and F1 score) for the post across posts by every author, and then correlate these metrics with authors’ characteristics. We repeat this process for communities, as well. Characteristics with at least moderate correlation () are presented in Table 2. Compared to post-level correlations with model confidence, we immediately notice that both aggregated community- and author-level correlations are much stronger, e.g., a maximum correlation value of 0.70 for features derived from all-reddit data, compared to a maximum correlation value of 0.37 for individual posts. This observation suggests that model performance is more strongly correlated with characteristics across entire communities or authors rather than individual posts.
For both authors and communities, the characteristics most strongly correlated with a higher F1 score is the fraction of deceptive content submitted in that community or by that author. These correlations are strongest (0.80 for communities, 0.85 for authors) when we examine just content from the test set, but are still substantial (0.42 and 0.33, respectively) when considering content across all of reddit. Computing the fraction of deceptive posts in the test set for each community/author results in larger fractions than when considering all of reddit, as the test set contains a greater proportion of deceptive posts than reddit in general. We also note that while the characteristics most strongly correlated with F1-Score and Precision are quite similar to one another, there are almost no features which are at least moderately (i.e., ) correlated with recall. This aligns with our findings when comparing the ContentOnly model to baseline performance (§3), where we found that author and community characteristics are more useful for achieving high precision than high recall.
Grouping the characteristics from Table 2 and displaying them visually, as in Figure 4 allows us to easily distinguish the differences between ordinal characteristics such as bias (extreme left to extreme right) and factualness (very low to very high). Across both communities and authors, greater fractions of left bias posts are correlated with weaker model performance, whereas greater fractions of right bias posts are correlated with stronger model performance. Similarly, greater fractions of high factual posts are correlated with weaker performance, while more low factual posts are correlated with stronger model performance.
6.3 Popularity and Community Acceptance
Next, we consider whether our model performs equitably across posts that do and do not gain community acceptance, and across varying levels of popularity. We examine the correlation of each post’s community-normalized score555Normalized by the median score for all posts from the same month in the same subreddit. and the ContentOnly model’s confidence when predicting the true class annotation of the post. For the test set overall, this correlation is +0.094, but is higher for deceptive posts (+0.104) than for credible posts (+0.083). We found that all correlations are significant (p-values ) but the effect is small.
In Table 3, we see that there are no significant correlations greater than .2 for posts with low to moderate community acceptance. However, for the posts most highly accepted by the community (i.e., those in the 9th and 10th deciles), the correlations are both significant and relatively strong. This suggests that in general, the model is more confident on posts that are more accepted by the community, but only for posts that are highly accepted by the community. We also compute the same correlation coefficients for posts linking to credible and deceptive news sources separately, and find the trend is magnified: For posts linking to deceptive sources that are most widely accepted within their given community, community acceptance is highly (+0.51 and +0.4) correlated with greater model confidence. In contrast, for posts linking to credible news sources that are strongly positively received or promoted by the community, the model is actually slightly less confident (correlation coefficient of -.017). This is an important distinction in behavior, particularly for deception detection models that may be leveraged as automated systems to flag deceptive content to investigate or intervene against or as a gate-keeping mechanism to slow the spread of misinformation online.
| All | Credible | Deceptive | |||
|---|---|---|---|---|---|
| More Less | Community Acceptance | Decile 1 | |||
| Decile 2 | |||||
| Decile 3 | |||||
| Decile 4 | |||||
| Decile 5 | |||||
| Decile 6 | |||||
| Decile 7 | |||||
| Decile 8 | |||||
| Decile 9 | |||||
| Decile 10 |
7 Discussion and Conclusions
In summary, we quantify the context of deceptive and credible posts by computing community and author characteristics and use these characteristics, to explain and characterize the performance of an LSTM-based model for deception detection, examining performance variance across communities or users to identify characteristics of sub-populations where the model disproportionately underperforms.
We find that in general, sub-population characteristics are more strongly correlated with aggregate performance, and that, for both communities and authors, the model is more effective at identifying deceptive posts (higher F1 and precision) when the author/community has a greater tendency to submit or receive posts linked to deceptive, low factual, and right biased news sources. In contrast, a greater tendency to submit or receive posts linked to high factual and center biased content are correlated with weaker F1 and precision – the model is more likely to fail when identifying posts submitted to communities or users that engage with more trustworthy news sources.
We also investigate the impact that community acceptance has on model performance, using community-normalized scores to quantify acceptance. We find that, for posts with low to moderator community acceptance, correlations with the model’s confidence that a post belongs to its groundtruth annotation class are small, but for posts that are strongly accepted by the community they are submitted to, acceptance is strongly correlated with increased model confidence for deceptive content, but only moderately correlated with decreased model confidence for credible content. It is important to consider what kinds of failures are most impactful given the specific application of a model. For example, if considering a deception detection model for use as an intervention strategy, it may be more important for a model to have greater reliability when identifying content that gains widespread community acceptance or popularity as we find our ContentOnly model does — this is an important direction of evaluation for researchers in the deception detection domain to consider.
We encourage NLP researchers working in the deception detection space to look beyond overall test-set performance metrics such as F1 score. Although many models achieve high overall F1 score, the performance of these models varies dramatically from community to community. Decisions about model design and training should not be made without considering the intended application of the model. For example, a model tasked with flagging posts for human review may be optimized with a very different precision-recall trade-off than a model tasked with automatically taking entire enforcement actions, such as removing content.
Acknowledgements
This research was supported by the Laboratory Directed Research and Development Program at Pacific Northwest National Laboratory, a multi-program national laboratory operated by Battelle for the U.S. Department of Energy.
References
- Ajao et al. (2018) Oluwaseun Ajao, Deepayan Bhowmik, and Shahrzad Zargari. 2018. Fake news identification on twitter with hybrid cnn and rnn models. In Proceedings of the 9th International Conference on Social Media and Society, pages 226–230. ACM.
- Barthel et al. (2016) Michael Barthel, Amy Mitchell, and Jesse Holcomb. 2016. Many americans believe fake news is sowing confusion.
- Baumgartner et al. (2020) Jason Baumgartner, Savvas Zannettou, Brian Keegan, Megan Squire, and Jeremy Blackburn. 2020. The pushshift reddit dataset.
- Chen et al. (2018) Weiling Chen, Yan Zhang, Chai Kiat Yeo, Chiew Tong Lau, and Bu Sung Lee. 2018. Unsupervised rumor detection based on users’ behaviors using neural networks. Pattern Recognition Letters, 105:226–233.
- Chouldechova (2017) Alexandra Chouldechova. 2017. Fair prediction with disparate impact: a study of bias in recidivism prediction instruments. Big data, 5(2):153–163.
- Davidson et al. (2019) Thomas Davidson, Debasmita Bhattacharya, and Ingmar Weber. 2019. Racial bias in hate speech and abusive language detection datasets. In Proceedings of the Third Workshop on Abusive Language Online, pages 25–35.
- Dressel and Farid (2018) Julia Dressel and Hany Farid. 2018. The accuracy, fairness, and limits of predicting recidivism. Science advances, 4(1):eaao5580.
- Ensign et al. (2018) Danielle Ensign, Sorelle A Friedler, Scott Neville, Carlos Scheidegger, and Suresh Venkatasubramanian. 2018. Runaway feedback loops in predictive policing. In Conference on Fairness, Accountability and Transparency, pages 160–171.
- Glenski et al. (2017) Maria Glenski, Corey Pennycuff, and Tim Weninger. 2017. Consumers and curators: Browsing and voting patterns on reddit. IEEE Transactions on Computational Social Systems, 4(4):196–206.
- Glenski and Weninger (2018) Maria Glenski and Tim Weninger. 2018. How humans versus bots react to deceptive and trusted news sources: A case study of active users. In Proceedings of the IEEE/ACM International Conference on Advances in Social Networks Analysis and Mining (ASONAM). IEEE/ACM.
- Goodman and Flaxman (2017) Bryce Goodman and Seth Flaxman. 2017. European union regulations on algorithmic decision-making and a “right to explanation”. AI magazine, 38(3):50–57.
- Guo et al. (2018) Han Guo, Juan Cao, Yazi Zhang, Junbo Guo, and Jintao Li. 2018. Rumor detection with hierarchical social attention network. In Proceedings of the 27th ACM International Conference on Information and Knowledge Management, pages 943–951. ACM.
- Hargittai and Walejko (2008) Eszter Hargittai and Gina Walejko. 2008. The participation divide: Content creation and sharing in the digital age. Information, Community and Society, 11(2):239–256.
- Karadzhov et al. (2018) Georgi Karadzhov, Pepa Gencheva, Preslav Nakov, and Ivan Koychev. 2018. We built a fake news & click-bait filter: what happened next will blow your mind! arXiv preprint arXiv:1803.03786.
- Kumar et al. (2017) Srijan Kumar, Justin Cheng, Jure Leskovec, and VS Subrahmanian. 2017. An army of me: Sockpuppets in online discussion communities. In Proceedings of the 26th International Conference on World Wide Web, pages 857–866.
- Kumar et al. (2018) Srijan Kumar, Bryan Hooi, Disha Makhija, Mohit Kumar, Christos Faloutsos, and VS Subrahmanian. 2018. Rev2: Fraudulent user prediction in rating platforms. In Proceedings of the Eleventh ACM International Conference on Web Search and Data Mining, pages 333–341. ACM.
- Li et al. (2019) Quanzhi Li, Qiong Zhang, and Luo Si. 2019. Rumor detection by exploiting user credibility information, attention and multi-task learning. In Proceedings of the 57th Annual Meeting of the Association for Computational Linguistics, pages 1173–1179.
- Ma et al. (2016) Jing Ma, Wei Gao, Prasenjit Mitra, Sejeong Kwon, Bernard J Jansen, Kam-Fai Wong, and Meeyoung Cha. 2016. Detecting rumors from microblogs with recurrent neural networks. In Ijcai, pages 3818–3824.
- Medvedev et al. (2019) Alexey N. Medvedev, Renaud Lambiotte, and Jean-Charles Delvenne. 2019. The anatomy of Reddit: An overview of academic research. arXiv:1810.10881 [cs], pages 183–204. ArXiv: 1810.10881.
- Mitra et al. (2017) Tanushree Mitra, Graham P Wright, and Eric Gilbert. 2017. A parsimonious language model of social media credibility across disparate events. In Proceedings of the ACM Conference on Computer Supported Cooperative Work and Social Computing (CSCW), pages 126–145. ACM.
- Park et al. (2018) Ji Ho Park, Jamin Shin, and Pascale Fung. 2018. Reducing gender bias in abusive language detection. In Proceedings of the 2018 Conference on Empirical Methods in Natural Language Processing, pages 2799–2804.
- Rashkin et al. (2017) Hannah Rashkin, Eunsol Choi, Jin Yea Jang, Svitlana Volkova, and Yejin Choi. 2017. Truth of varying shades: Analyzing language in fake news and political fact-checking. In Proceedings of the 2017 Conference on Empirical Methods in Natural Language Processing, pages 2921–2927.
- Rath et al. (2017) Bhavtosh Rath, Wei Gao, Jing Ma, and Jaideep Srivastava. 2017. From retweet to believability: Utilizing trust to identify rumor spreaders on twitter. In Proceedings of the 2017 IEEE/ACM International Conference on Advances in Social Networks Analysis and Mining 2017, pages 179–186. ACM.
- Rubin et al. (2016) Victoria L Rubin, Niall J Conroy, Yimin Chen, and Sarah Cornwell. 2016. Fake news or truth? Using satirical cues to detect potentially misleading news. In Proceedings of NAACL-HLT, pages 7–17.
- Sap et al. (2019) Maarten Sap, Dallas Card, Saadia Gabriel, Yejin Choi, and Noah A Smith. 2019. The risk of racial bias in hate speech detection. In Proceedings of the 57th Annual Meeting of the Association for Computational Linguistics, pages 1668–1678.
- Shearer and Grieco (2019) Elisa Shearer and Elizabeth Grieco. 2019. Americans are wary of the role social media sites play in delivering the news. Pew Research Center.
- Shu et al. (2020) Kai Shu, Deepak Mahudeswaran, Suhang Wang, and Huan Liu. 2020. Hierarchical propagation networks for fake news detection: Investigation and exploitation. In Proceedings of the International AAAI Conference on Web and Social Media, volume 14, pages 626–637.
- van Mierlo (2014) Trevor van Mierlo. 2014. The 1% rule in four digital health social networks: An observational study. Journal of medical Internet Research, 16(2):e33.
- Volkova et al. (2019) Svitlana Volkova, Ellyn Ayton, Dustin L Arendt, Zhuanyi Huang, and Brian Hutchinson. 2019. Explaining multimodal deceptive news prediction models. In Proceedings of the International AAAI Conference on Web and Social Media, volume 13, pages 659–662.
- Volkova et al. (2017) Svitlana Volkova, Kyle Shaffer, Jin Yea Jang, and Nathan Hodas. 2017. Separating facts from fiction: Linguistic models to classify suspicious and trusted news posts on twitter. In Proceedings of the 55th Annual Meeting of the Association for Computational Linguistics (Volume 2: Short Papers), pages 647–653, Vancouver, Canada. Association for Computational Linguistics.
- Wang (2017) William Yang Wang. 2017. “liar, liar pants on fire”: A new benchmark dataset for fake news detection. In Proceedings of the 55th Annual Meeting of the Association for Computational Linguistics (Volume 2: Short Papers), pages 422–426.
- Weld et al. (2021) Galen Weld, Maria Glenski, and Tim Althoff. 2021. Political bias and factualness in news sharing across more than 100,000 online communities.
- Zhang et al. (2019) Qiang Zhang, Aldo Lipani, Shangsong Liang, and Emine Yilmaz. 2019. Reply-aided detection of misinformation via bayesian deep learning. In WWW, pages 2333–2343. ACM.
- Zubiaga et al. (2018) Arkaitz Zubiaga, Elena Kochkina, Maria Liakata, Rob Procter, Michal Lukasik, Kalina Bontcheva, Trevor Cohn, and Isabelle Augenstein. 2018. Discourse-aware rumour stance classification in social media using sequential classifiers. Information Processing & Management, 54(2):273–290.