Magnetoelastic Coupling and Phases in the Skyrmion Lattice Magnet \ceGd2PdSi3 Discovered by High-resolution Dilatometry
Abstract
We report detailed thermodynamic studies on high-quality single crystals of the centrosymmetric skyrmion-hosting intermetallic Gd2PdSi3 by means of high-resolution capacitance dilatometry in fields up to 15 T which are complemented by specific heat and magnetization studies. Our dilatometric measurements show magnetoelastic effects associated with antiferromagnetic order at = 22.3 K and = 19.7 K, as well as strong field effects in an applied magnetic field of 15 T up to 200 K (150 K) for (*, i.e. ). The data allow us to complete the magnetic phase diagram, including a new feature at K below which a new degree of freedom becomes relevant. For the first time, the magnetic B vs. T phase diagram for the *-axis is also reported. Grüneisen analysis shows the onset of magnetic contributions around 60 K, i.e., well above . Uniaxial pressure dependencies of opposite sign, K/GPa and K/GPa, are extracted for the out-of-plane and in-plane directions at . For we obtain K/GPa. In particular we elucidate thermodynamic properties of the recently discovered skyrmion lattice phase and show that it is strongly enhanced by uniaxial pressure.
I Introduction
Ternary intermetallic compounds of the type \ceR2TX3 ( = rare earth, = transition metal, = element of main groups III to V) Hoffmann and Pöttgen (2001); Pan et al. (2013) have been investigated extensively over the past decades, due to their variety of intriguing electronic properties ranging from superconductivity Majumdar and Sampathkumaran (2001), giant magnetoresistance (GMR) Majumdar et al. (2000, 2001); Paulose et al. (2003), ferromagnetism Cao et al. (2010) and incommensurate spin structures Kurumaji et al. (2019); Hirschberger et al. (2020a), phenomena related to Kondo physics and heavy fermions Majumdar et al. (1999); Saha et al. (2000); Majumdar et al. (2002), to non-Fermi-liquid Majumdar et al. (1999) and spin-glass behavior Kaczorowski and Noel (1993); Tien et al. (1997); Li et al. (1999, 2003). This is particularly evident in the title material Gd2PdSi3 where a skyrmion lattice phase featuring giant topological Hall and Nernst effect was discovered recently. Saha et al. (1999); Kurumaji et al. (2019); Hirschberger et al. (2020b)
Most members of the \ceR2PdSi3 family of ternary silicides crystallize in a highly symmetric \ceAlB2-derived hexagonal structure (space group P6/mmm) with triangular lattice layers of magnetic sites sandwiching honeycomb nets of Pd/Si sites. While the Pd and Si ions were originally believed to be distributed statistically Szytuła et al. (1999), an X-ray and neutron diffraction study by Tang et al. showed for \ceHo2PdSi3 that these ions actually order into a superstructure along both in- and out-of-plane directions, while the overall centrosymmetry of the structure is retained Tang et al. (2011). This leads to two nonequivalent sites for the ions, which has been shown to affect the magnetism in an applied magnetic field for \ceEr2PdSi3 Tang et al. (2010). While no structural phase transition has been detected for R = Gd, Tb, Dy, Ho, Er and Tm, most \ceR2PdSi3 compounds show long-range magnetic order at low temperatures Frontzek (2009); Smidman et al. (2019); Mukherjee et al. (2011).
These various ordering phenomena are driven by a delicate interplay of indirect exchange coupling mediated by the conduction electrons, i.e., the Rudermann-Kittel-Kasuya-Yosida (RKKY) interaction, spin-orbit coupling and the influence of crystal field (CF) effects. The Gd3+ ions in Gd2PdSi3, however, with a half-filled shell, have vanishing orbital momentum (J S ) and are not influenced by crystal field effects. Magnetic order, therefore, arises from the RKKY interaction and dipole-dipole interactions. Gd2PdSi3 exhibits two successive phase transitions around = 21 K Hirschberger et al. (2020a) and was found to exhibit a skyrmion lattice (SkL) phase of Bloch-type skyrmions in low magnetic fields applied along the -axis Kurumaji et al. (2019). A number of incommensurate spin structures both in zero-field as well as in higher applied magnetic fields have been identified Hirschberger et al. (2020a) and the phase diagram in fields up to 9 T has been established through resistance and magnetization measurements as well as resonant X-ray scattering Frontzek (2009); Kurumaji et al. (2019); Hirschberger et al. (2020a); Zhang et al. (2020). Single crystal X-ray and neutron diffraction measurements yielded lattice parameters at 300 K (2 K) of = 4.079 Å (4.066 Å) and = 4.098 Å (4.091 Å), i.e. = and = . Tang et al. (2011),FN (4)
Except for these measurements of the lattice parameters, however, there is at present no study on magnetoelastic effects in Gd2PdSi3. Therefore, with a particular focus on the skyrmion lattice phase, we report detailed dilatometric studies of Gd2PdSi3 in a wide range of temperatures and magnetic fields. Our thermal expansion and magnetostriction data show pronounced magnetoelastic coupling and field effects extending up to temperatures of 150 K and above. Moreover, we uncover yet unreported phases and an anomaly in zero-field which appears well below the Néel transitions at = 22.3(5) K and = 19.7(5) K, thereby evidencing competing interactions already in zero-field. We update the magnetic phase diagram for -axis, present for the first time the phase diagram for *-axis, and discuss in detail the thermodynamic properties for . Our results in particular elucidate the skyrmion lattice phase and we show that it is enhanced by uniaxial pressure.
II Experimental Methods
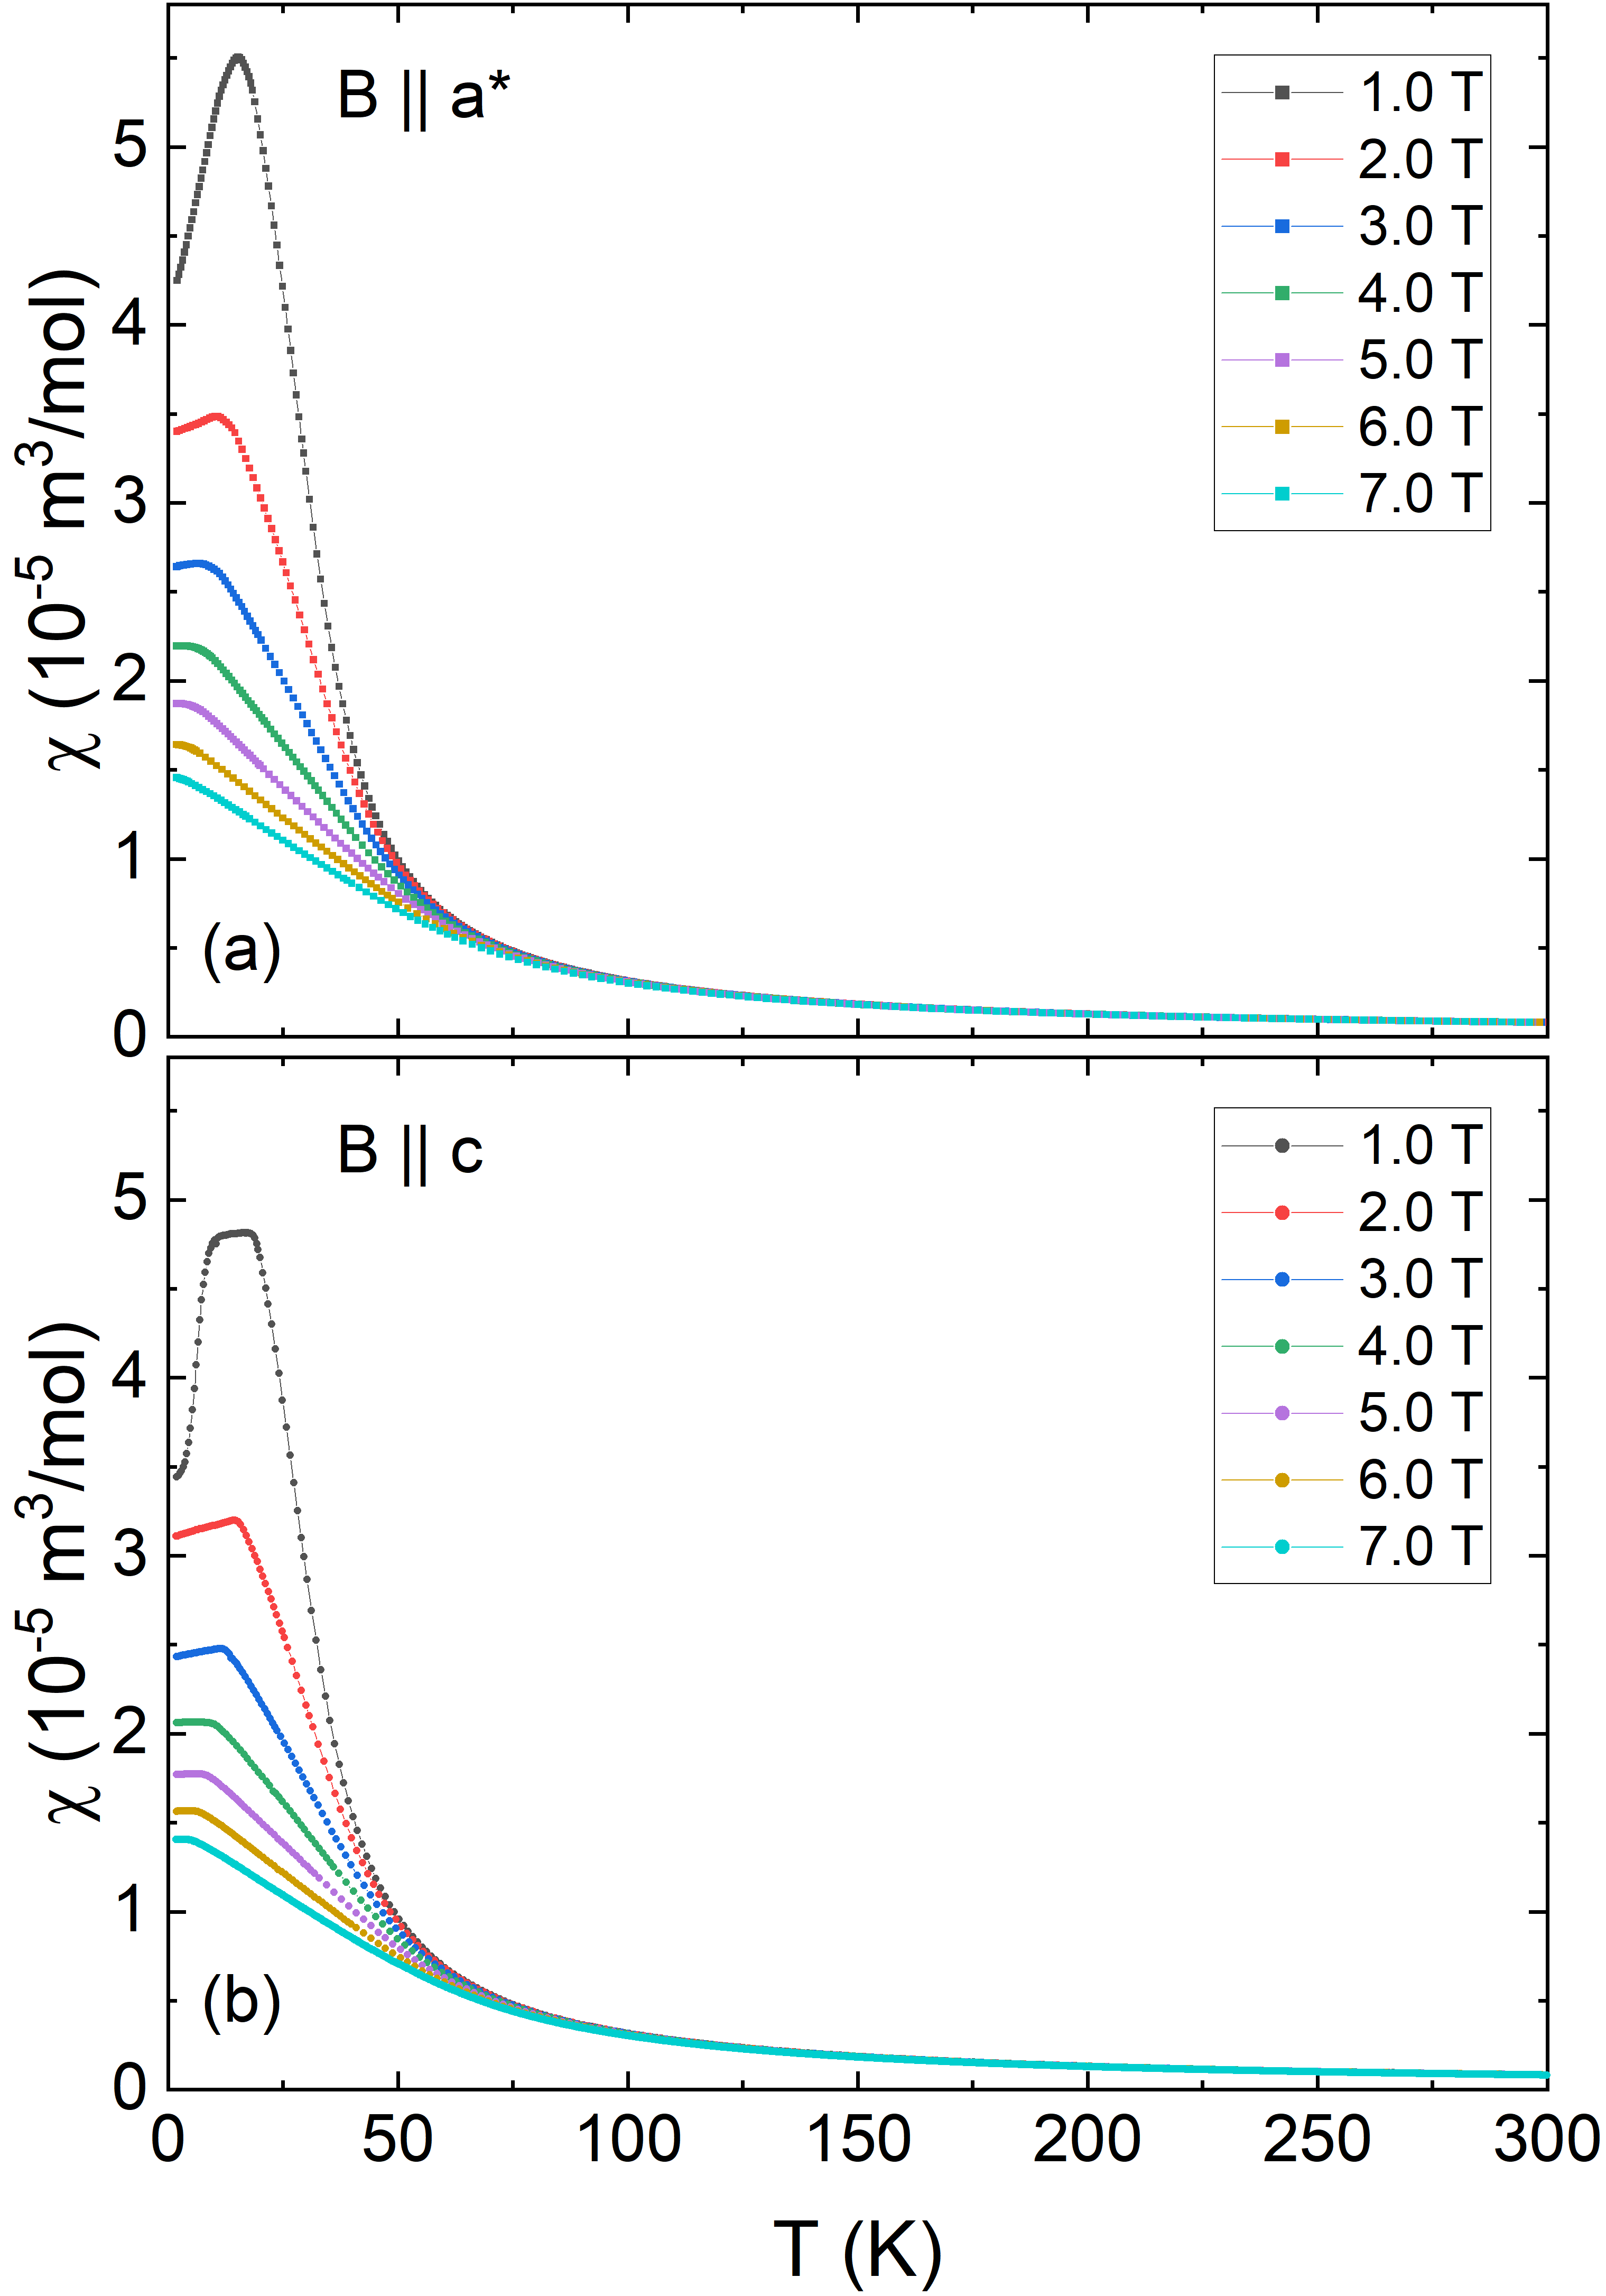
Single crystals of Gd2PdSi3 have been grown by the optical floating-zone method as reported in Ref. [Mazilu, 2006; Xu et al., 2011] and were previously studied by AC susceptibility, neutron diffraction Frontzek (2009), and angle-resolved photoemission spectroscopy Inosov et al. (2009). The magnetization was studied in the temperature regime from 1.8 K to 300 K in magnetic fields up to 7 T in a Magnetic Properties Measurement System (MPMS3, Quantum Design) and up to 14 T in a Physical Properties Measurement System (PPMS, Quantum Design) using the Vibrating Sample Magnetometry (VSM) option. Specific heat measurements were performed on a PPMS-14 using a relaxation method on single crystals of mg (2 K-300 K) and 13.49 mg (0.15 K-3 K). High-resolution dilatometry measurements were performed by means of a three-terminal high-resolution capacitance dilatometer in a home-built setup placed inside a Variable Temperature Insert (VTI) of an Oxford magnet system Küchler et al. (2012); Werner et al. (2017). With this dilatometer, the relative length changes along the crystallographic and * directions, respectively, were studied on an oriented cuboid-shaped single crystal of dimensions mm3. Measurements were performed at temperatures between 2 K and 300 K in magnetic fields up to 15 T, applied along the direction of the measured length changes, and the linear thermal expansion coefficients were derived. In addition, the field-induced length changes were measured at various fixed temperatures between 1.7 K and 200 K in magnetic fields up to 15 T. The longitudinal magnetostriction coefficient was derived from .
III Experimental Results
III.1 Evolution of magnetic order at
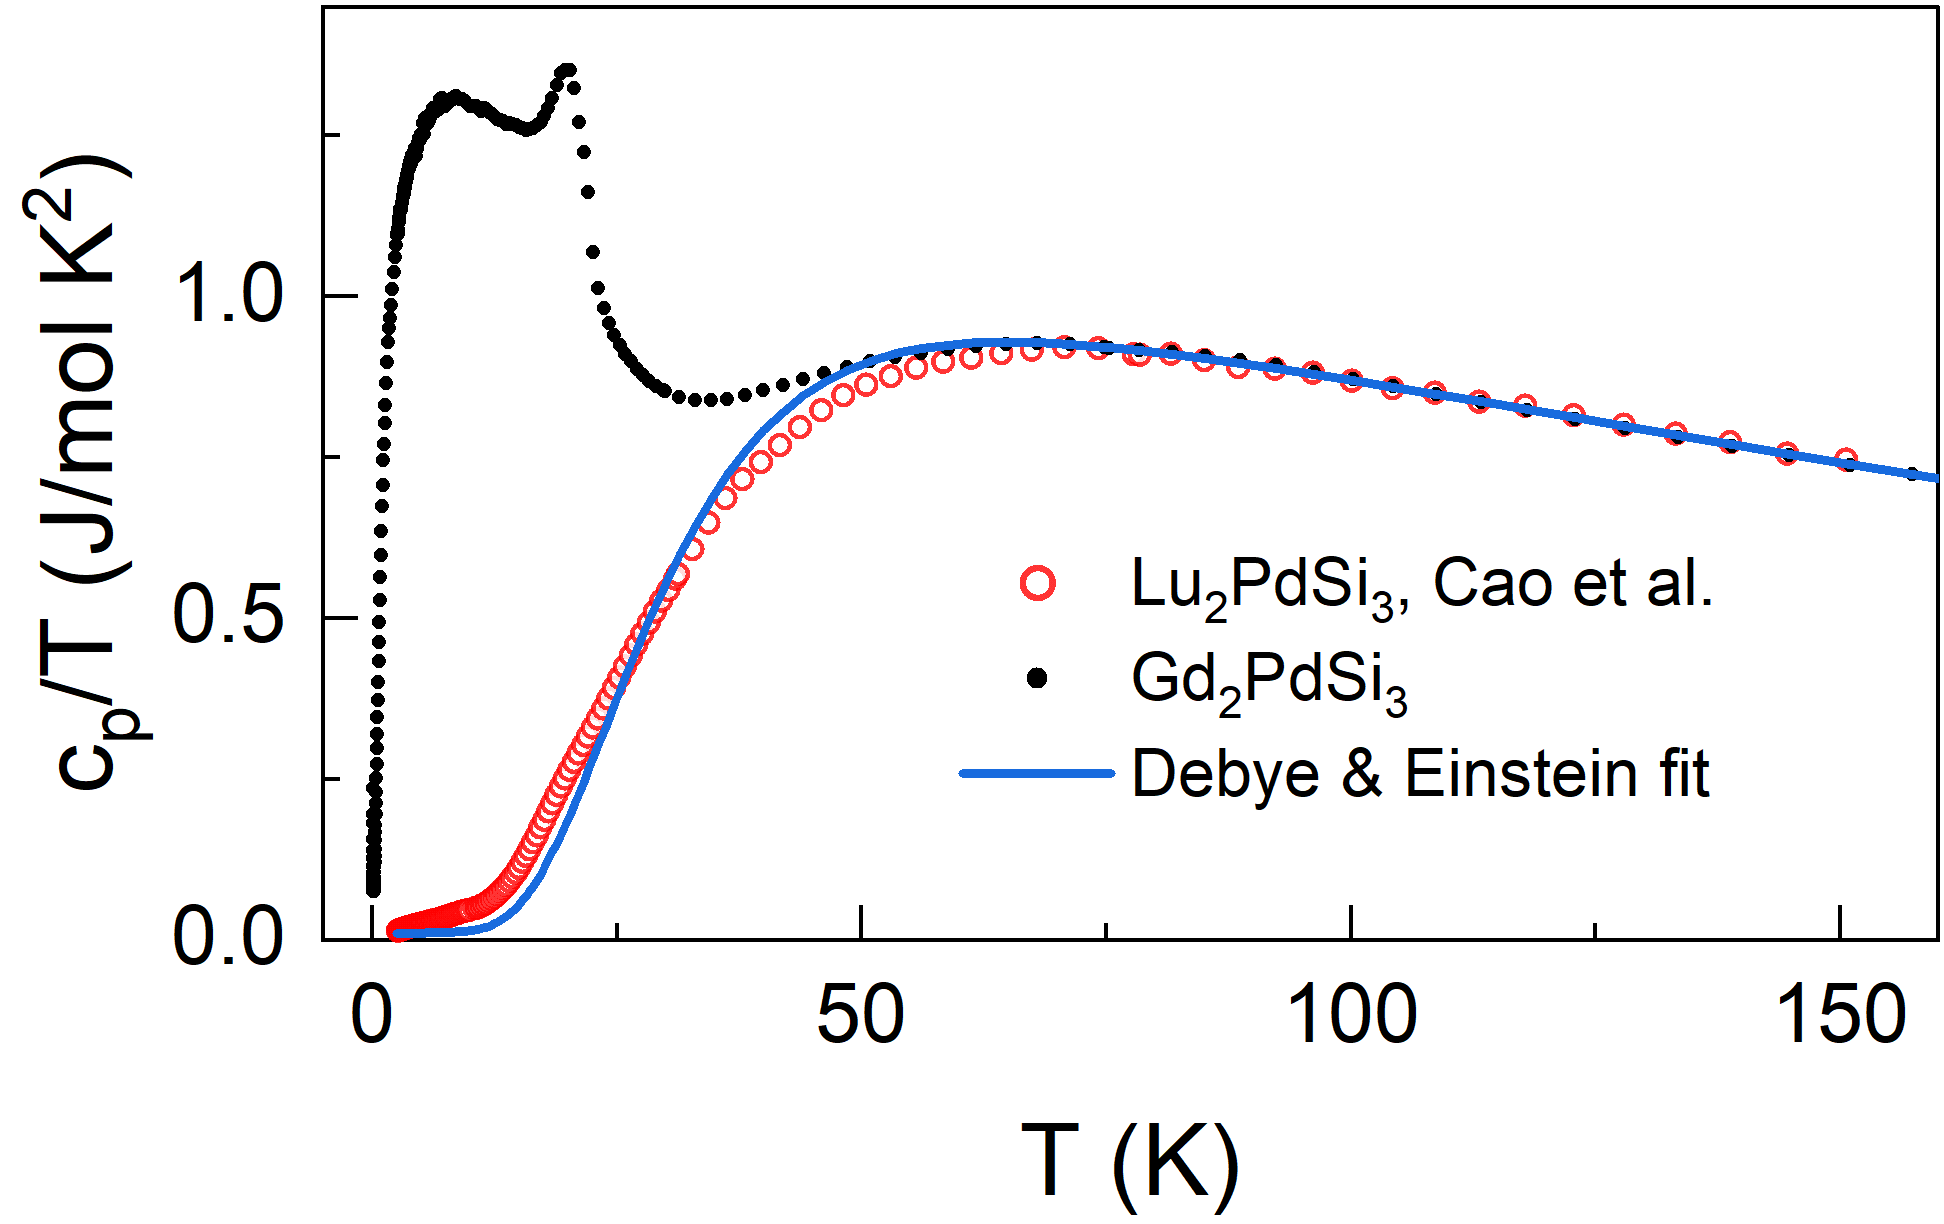
Uniaxial thermal expansion and specific heat show pronounced anomalies around 20 K which are associated with the onset of long-range magnetic order (Fig. 1). Close inspection of the anomalies indicates the proximity of not only one, but two phase transitions around . While the anomaly at = 22.3(5) K is seen as a jump in , the anomaly at = 19.7(5) K (20.3(5) K for the *-axis) is expressed as a peak. This observation confirms the results by Hirschberger et al. of two consecutive phase transitions in zero field Hirschberger et al. (2020a). Beyond these two known transitions, however, our data display a third anomaly indicative of a phase transition which has not been reported for single crystals of Gd2PdSi3. This anomaly, marked by K in the inset of Fig. 1(b), is visible as a broad jump for both directions in which extends between 10 K and 15 K and will be discussed in more detail below.
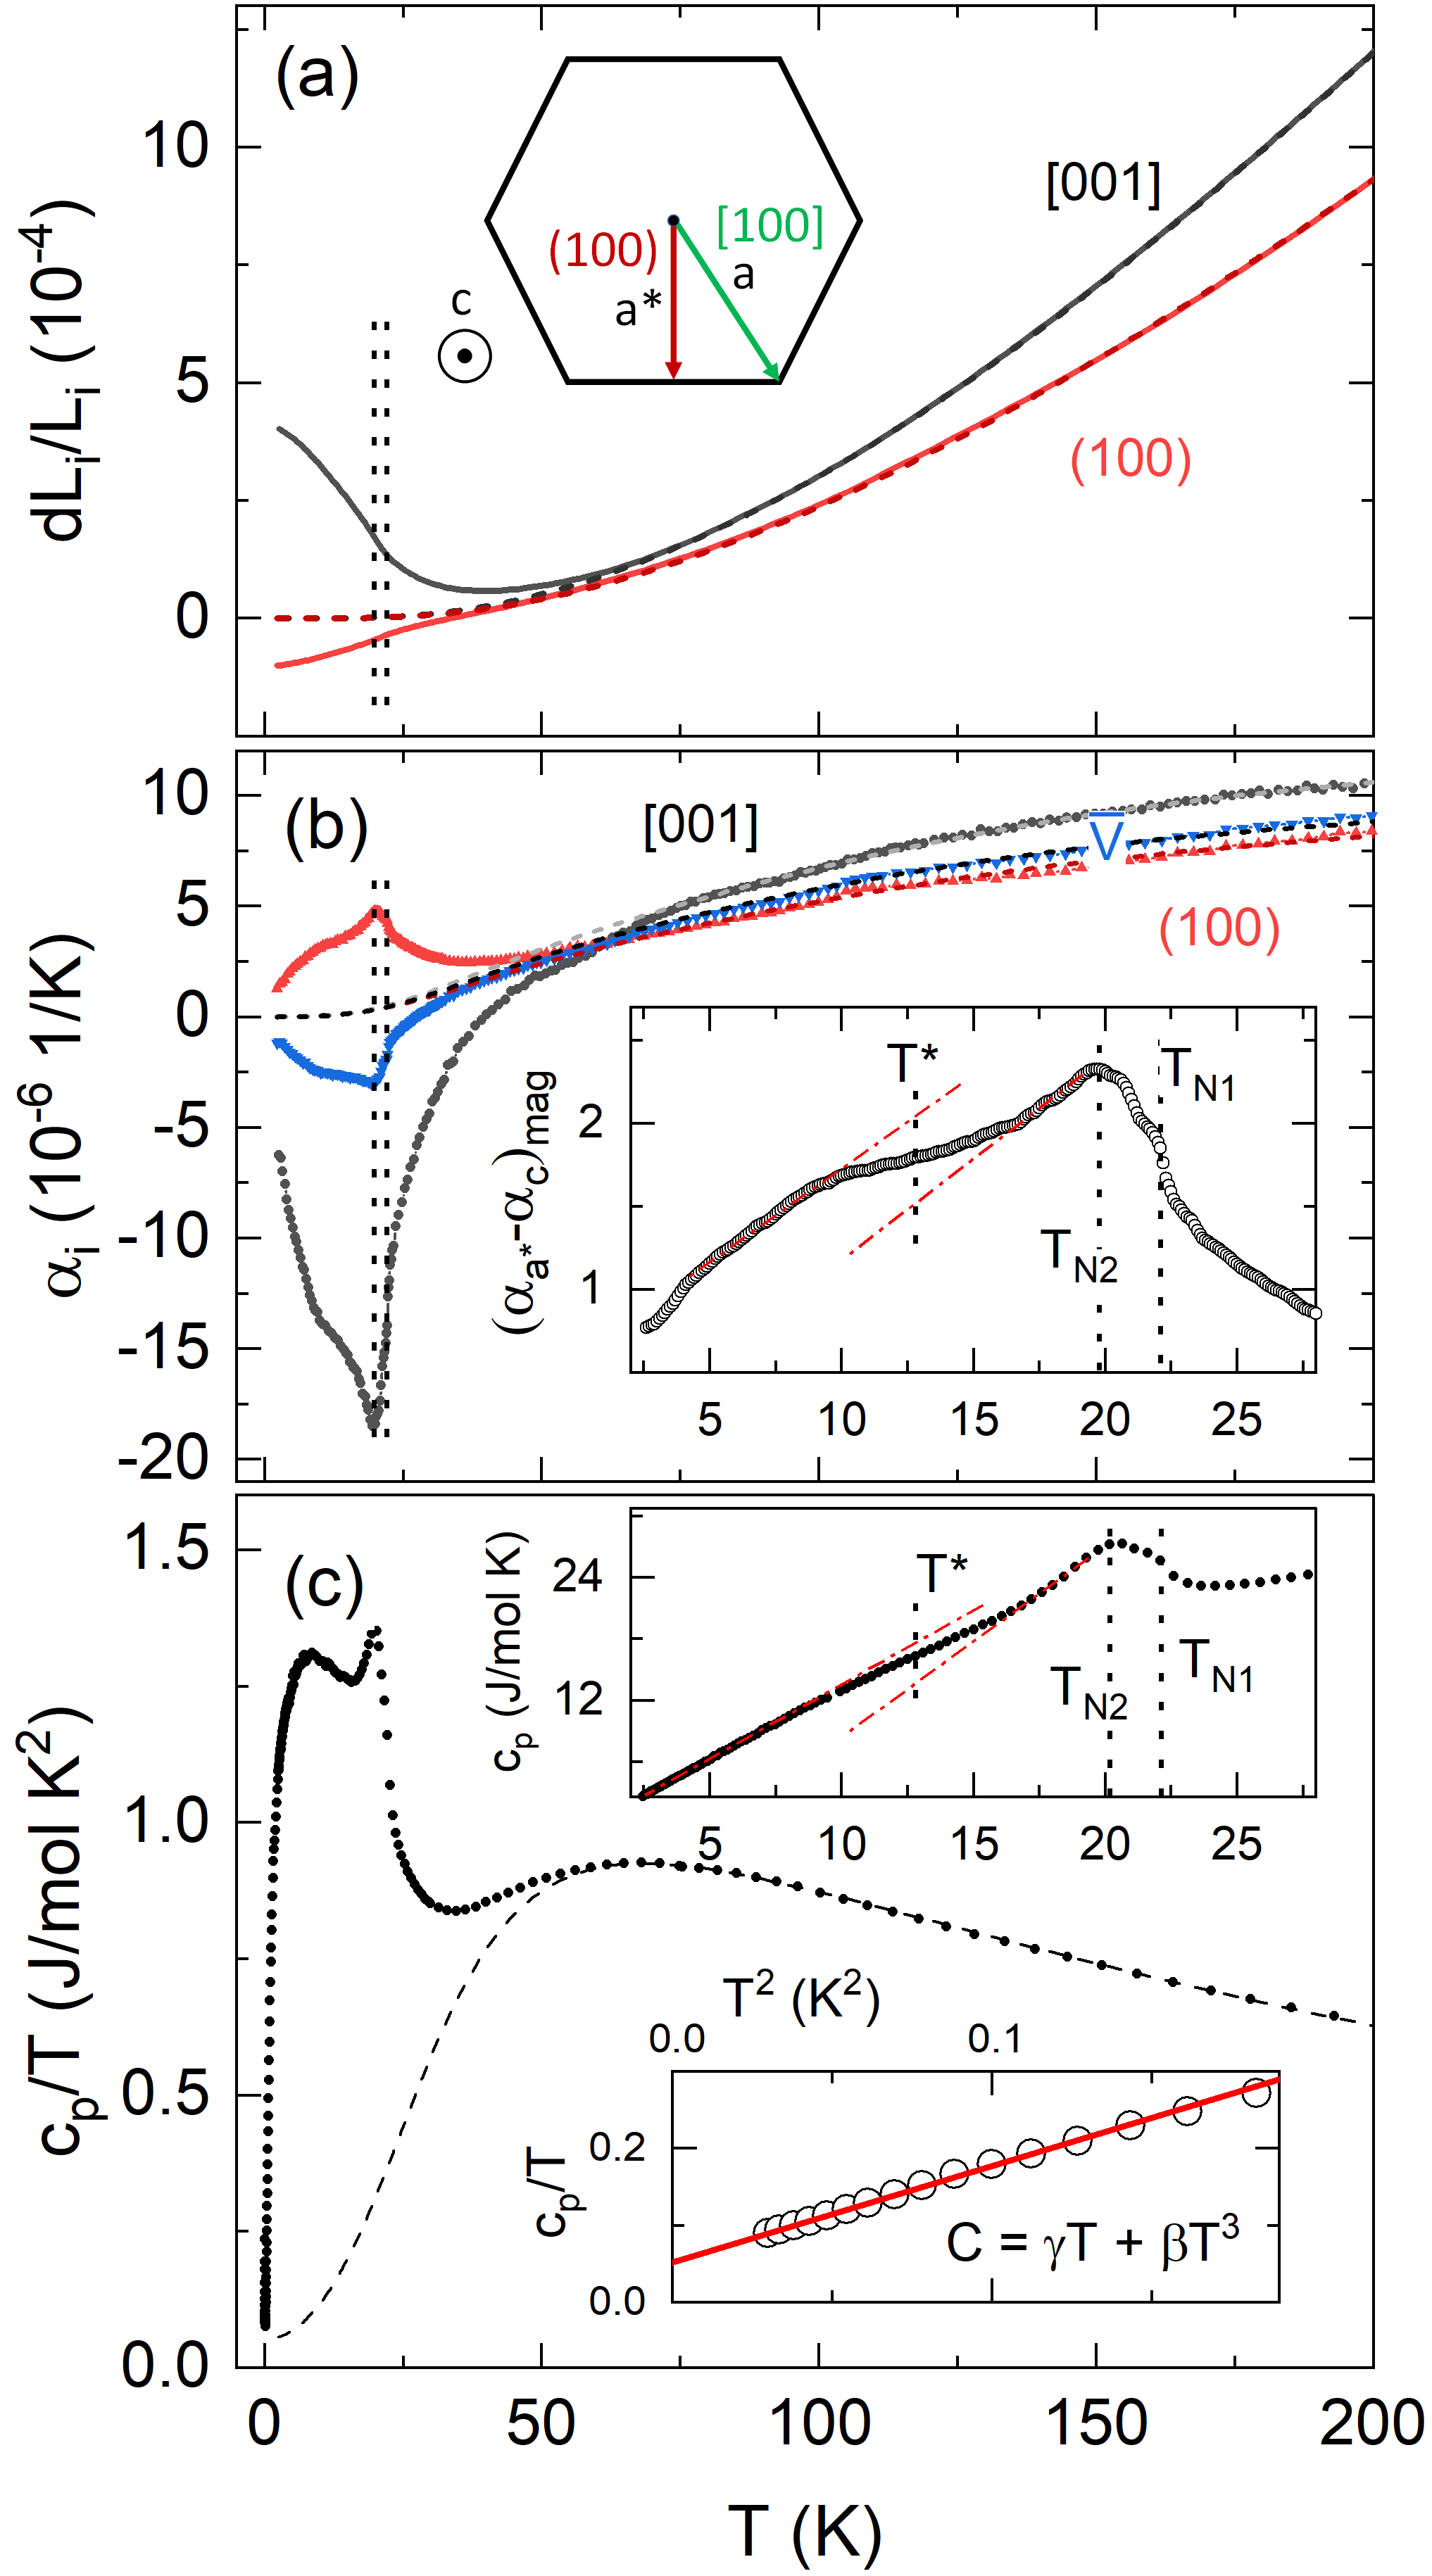
The specific heat data show the three observed features at , and , too (Fig. 1(c)). The shape of the anomalies in is analogous to their shape in . At very low temperatures below about 400 mK a quasi-linear behavior of /T vs. is found (see the inset of Fig. 1(c)) reminding of similar observations in Lu2PdSi3 and Ce2PdSi3. Cao et al. (2013); Saha et al. (2000) In this temperature regime, the data are described well by a linear and a cubic term, i.e., /T . The quasi-linear term is described by an effective Sommerfeld coefficient mJ/(mol K2). This parameter is in between the values obtained for Lu2PdSi3 (6.9 mJ/(mol K2)) and Ce2PdSi3 (108 mJ/(mol K2)), the latter being discussed as evidence of heavy-fermion behaviour. Saha et al. (2000) Whereas phonons can be neglected in this temperature regime, the coefficient J/(mol K4) is rather large and reflects the contribution of low-energy antiferromagnetic excitations.
The dashed lines in Fig. 1 show the phononic and electronic contributions to the relative length changes, thermal expansion coefficients, and specific heat. In order to obtain these contributions, the specific heat of the non-magnetic analog Lu2PdSi3 as reported by Cao et al. Cao et al. (2013) was fitted by phononic Debye and Einstein terms, as well as an electronic term, according to
| (1) |
where is the Sommerfeld coefficient, and are constants, and are the Debye and Einstein functions with the Debye and Einstein temperatures and . The fit to the Lu2PdSi3 specific heat data yields = 213 K, = 454 K, with and . was fixed to the value reported by Cao et al. of 6.93 mJ/(mol K2). Compared to K by Cao et al., extracted from the low temperature regime, our value is slightly larger.
Scaling the Debye and Einstein temperatures by the different masses of Lu and Gd we obtain a scaling factor Tari (2003) of . The specific heat and thermal expansion of Gd2PdSi3 were thus fitted with fixed K and correspondingly K. For the fit to the specific heat, mJ/(mol K2) was also fixed. For the thermal expansion the electronic contribution was negligibly small and therefore omitted, i.e. it was fitted by
| (2) |
with parameters and . The phononic contributions to in Fig. 1(a) were obtained by integrating the background obtained for the respective .
Subtracting the electronic and phononic backgrounds from the specific heat and thermal expansion coefficients yields their respective magnetic contributions which extend up to about 60 K. This agrees with the temperature regime where the magnetization exhibits a non-linear field dependence up to 7 T (see Fig. S1). From /T the changes in magnetic entropy, , above 150 mK are calculated. We obtain a constant J/(mol K) above 60 K, which is 90% of the full expected magnetic entropy of 2 J/(mol K), where is the universal gas constant.
Returning to the thermal expansion data, we see that the anomalies in the thermal expansion coefficients, at and , are of opposite sign for the - and *-axis, indicating opposite pressure dependencies 0 and 0. The volume thermal expansion also indicates a negative hydrostatic pressure dependence 0 for both antiferromagnetic transitions.
The Grüneisen ratio of the thermal expansion coefficient and the specific heat is a valuable quantity to determine the relevant energy scales driving the system and to quantify its pressure dependencies. In the presence of one dominant energy scale , this ratio is independent of temperature and enables the determination of the pressure dependence of , i.e. Gegenwart (2016); Klingeler et al. (2006),
| (3) |
Here, is the molar volume and the index indicates a linear direction or the volume. At , Eq. 3 converts to = ()/. Comparing the magnetic contributions and hence allows to identify temperature regimes where the Grüneisen relation implies only one dominant energy scale while appropriate scaling enables to read off the respective parameter . As shown in Fig. 2, the overall behavior of and is similar except for a distinct jump in at K which is much less pronounced in the magnetic specific heat. In both cases, magnetic contributions start to evolve around 60 K.
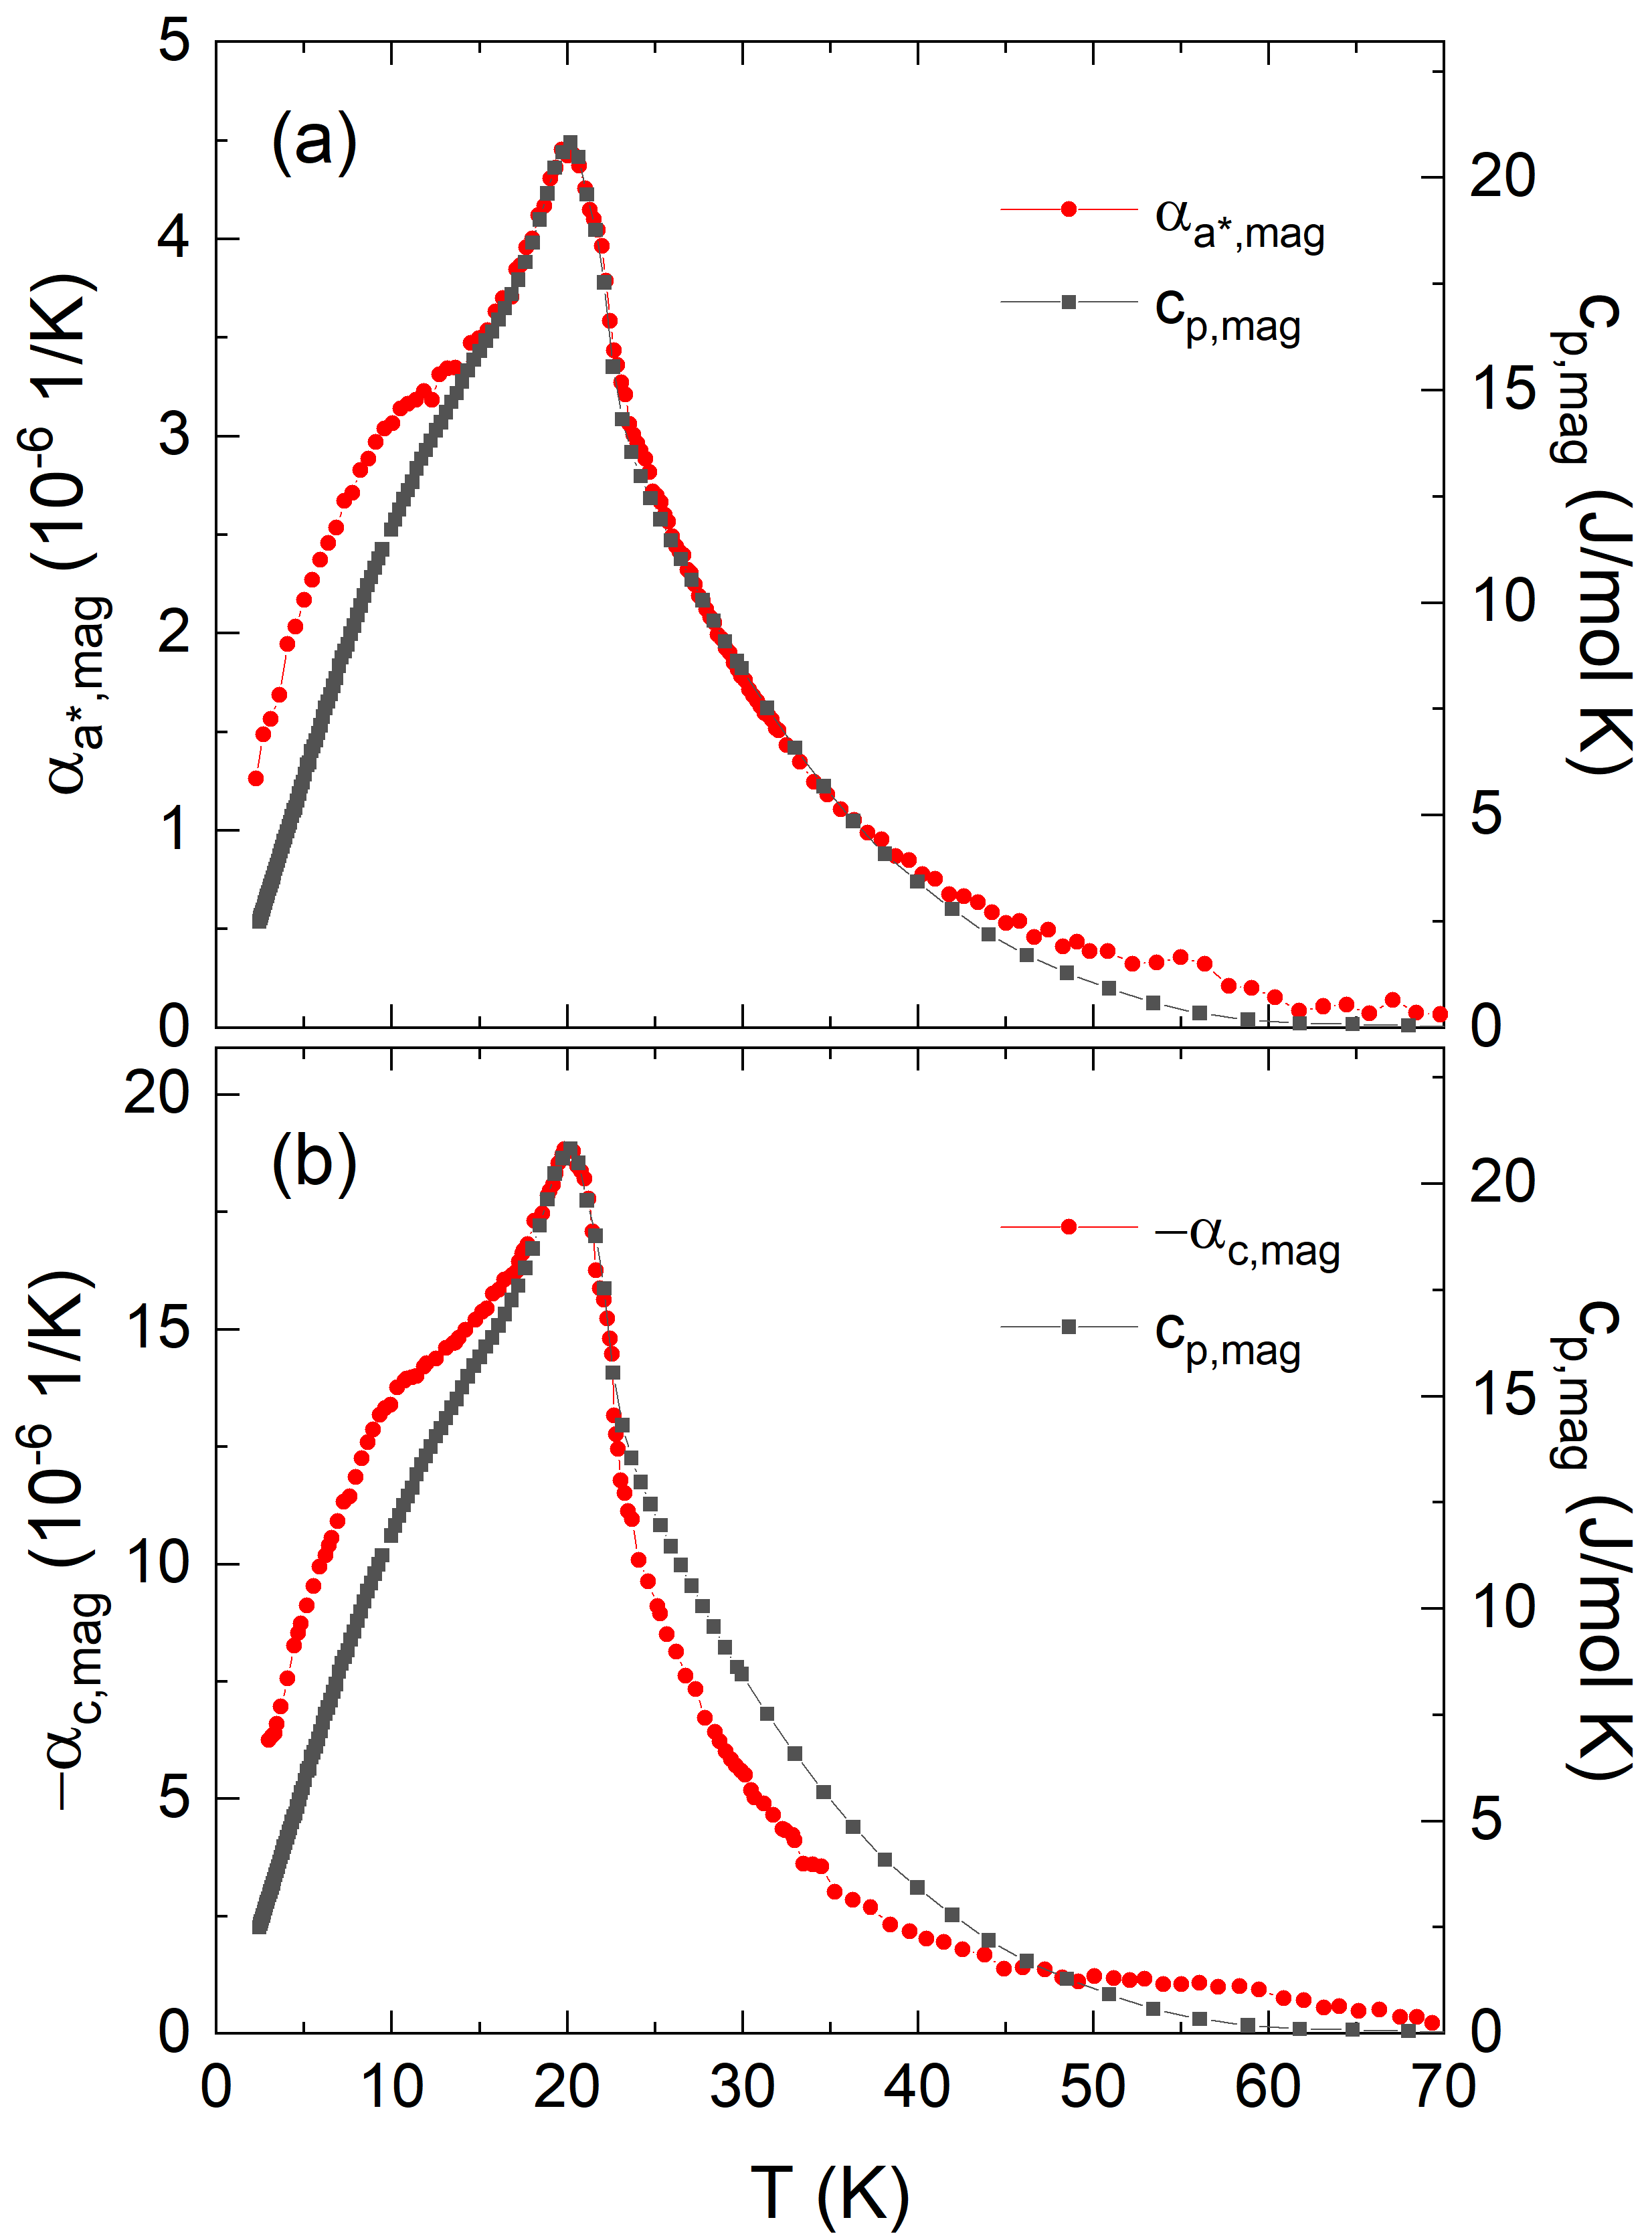
Despite the overall similar behavior, there are differences at higher temperatures, too. While the *-axis shows a nearly perfect overlap between and down to 14 K as shown in Fig. 2(a), we only observe a very good agreement around and for the -axis, in a range from 17 K to about 23 K. We also note that below 14 K our results indicate the failure of Grüneisen scaling rather than the presence of just a different scaling parameter.
Our data, however, clearly imply the presence of a single dominant energy scale at and around the magnetic ordering temperatures and . The obtained Grüneisen parameters amount to mol/J and mol/J. From these values, moderate pressure dependencies are derived, i.e., we obtain negative pressure dependencies K/GPa and K/GPa for uniaxial pressure applied along the -axis. The uniaxial pressure dependencies for *-axis are positive and more than a factor of four smaller, i.e., 0.31(5) K/GPa for and 0.34(5) K/GPa for .
While our data hence evidence that the ordering phenomena at and are governed by the same energy scale, an additional energy scale becomes relevant upon further cooling, around , as proven by the failure of Grüneisen scaling (cf. Fig. 2). Closer inspection of the associated anomalies implies not only a broad jump-like increase in the thermal expansion coefficients but also a less pronounced anomaly in which is visible much more clearly in the / data in Fig. 1c. In an attempt to deduce the anomaly size associated with the respective features we obtain J/(mol K), /K, /K, /K. The changes in magnetization around T∗ are very small for both axes and could not be seen in the isothermal magnetization . However, temperature sweeps of the magnetization in static field evidence a jump in , which is visible for T (0.25 T) for (*) (see SI, Fig. S10(a)). At 0.2 T the jump height amounts to 5.6(1.4)/(f.u. K). Further values are listed in Tab. S7.
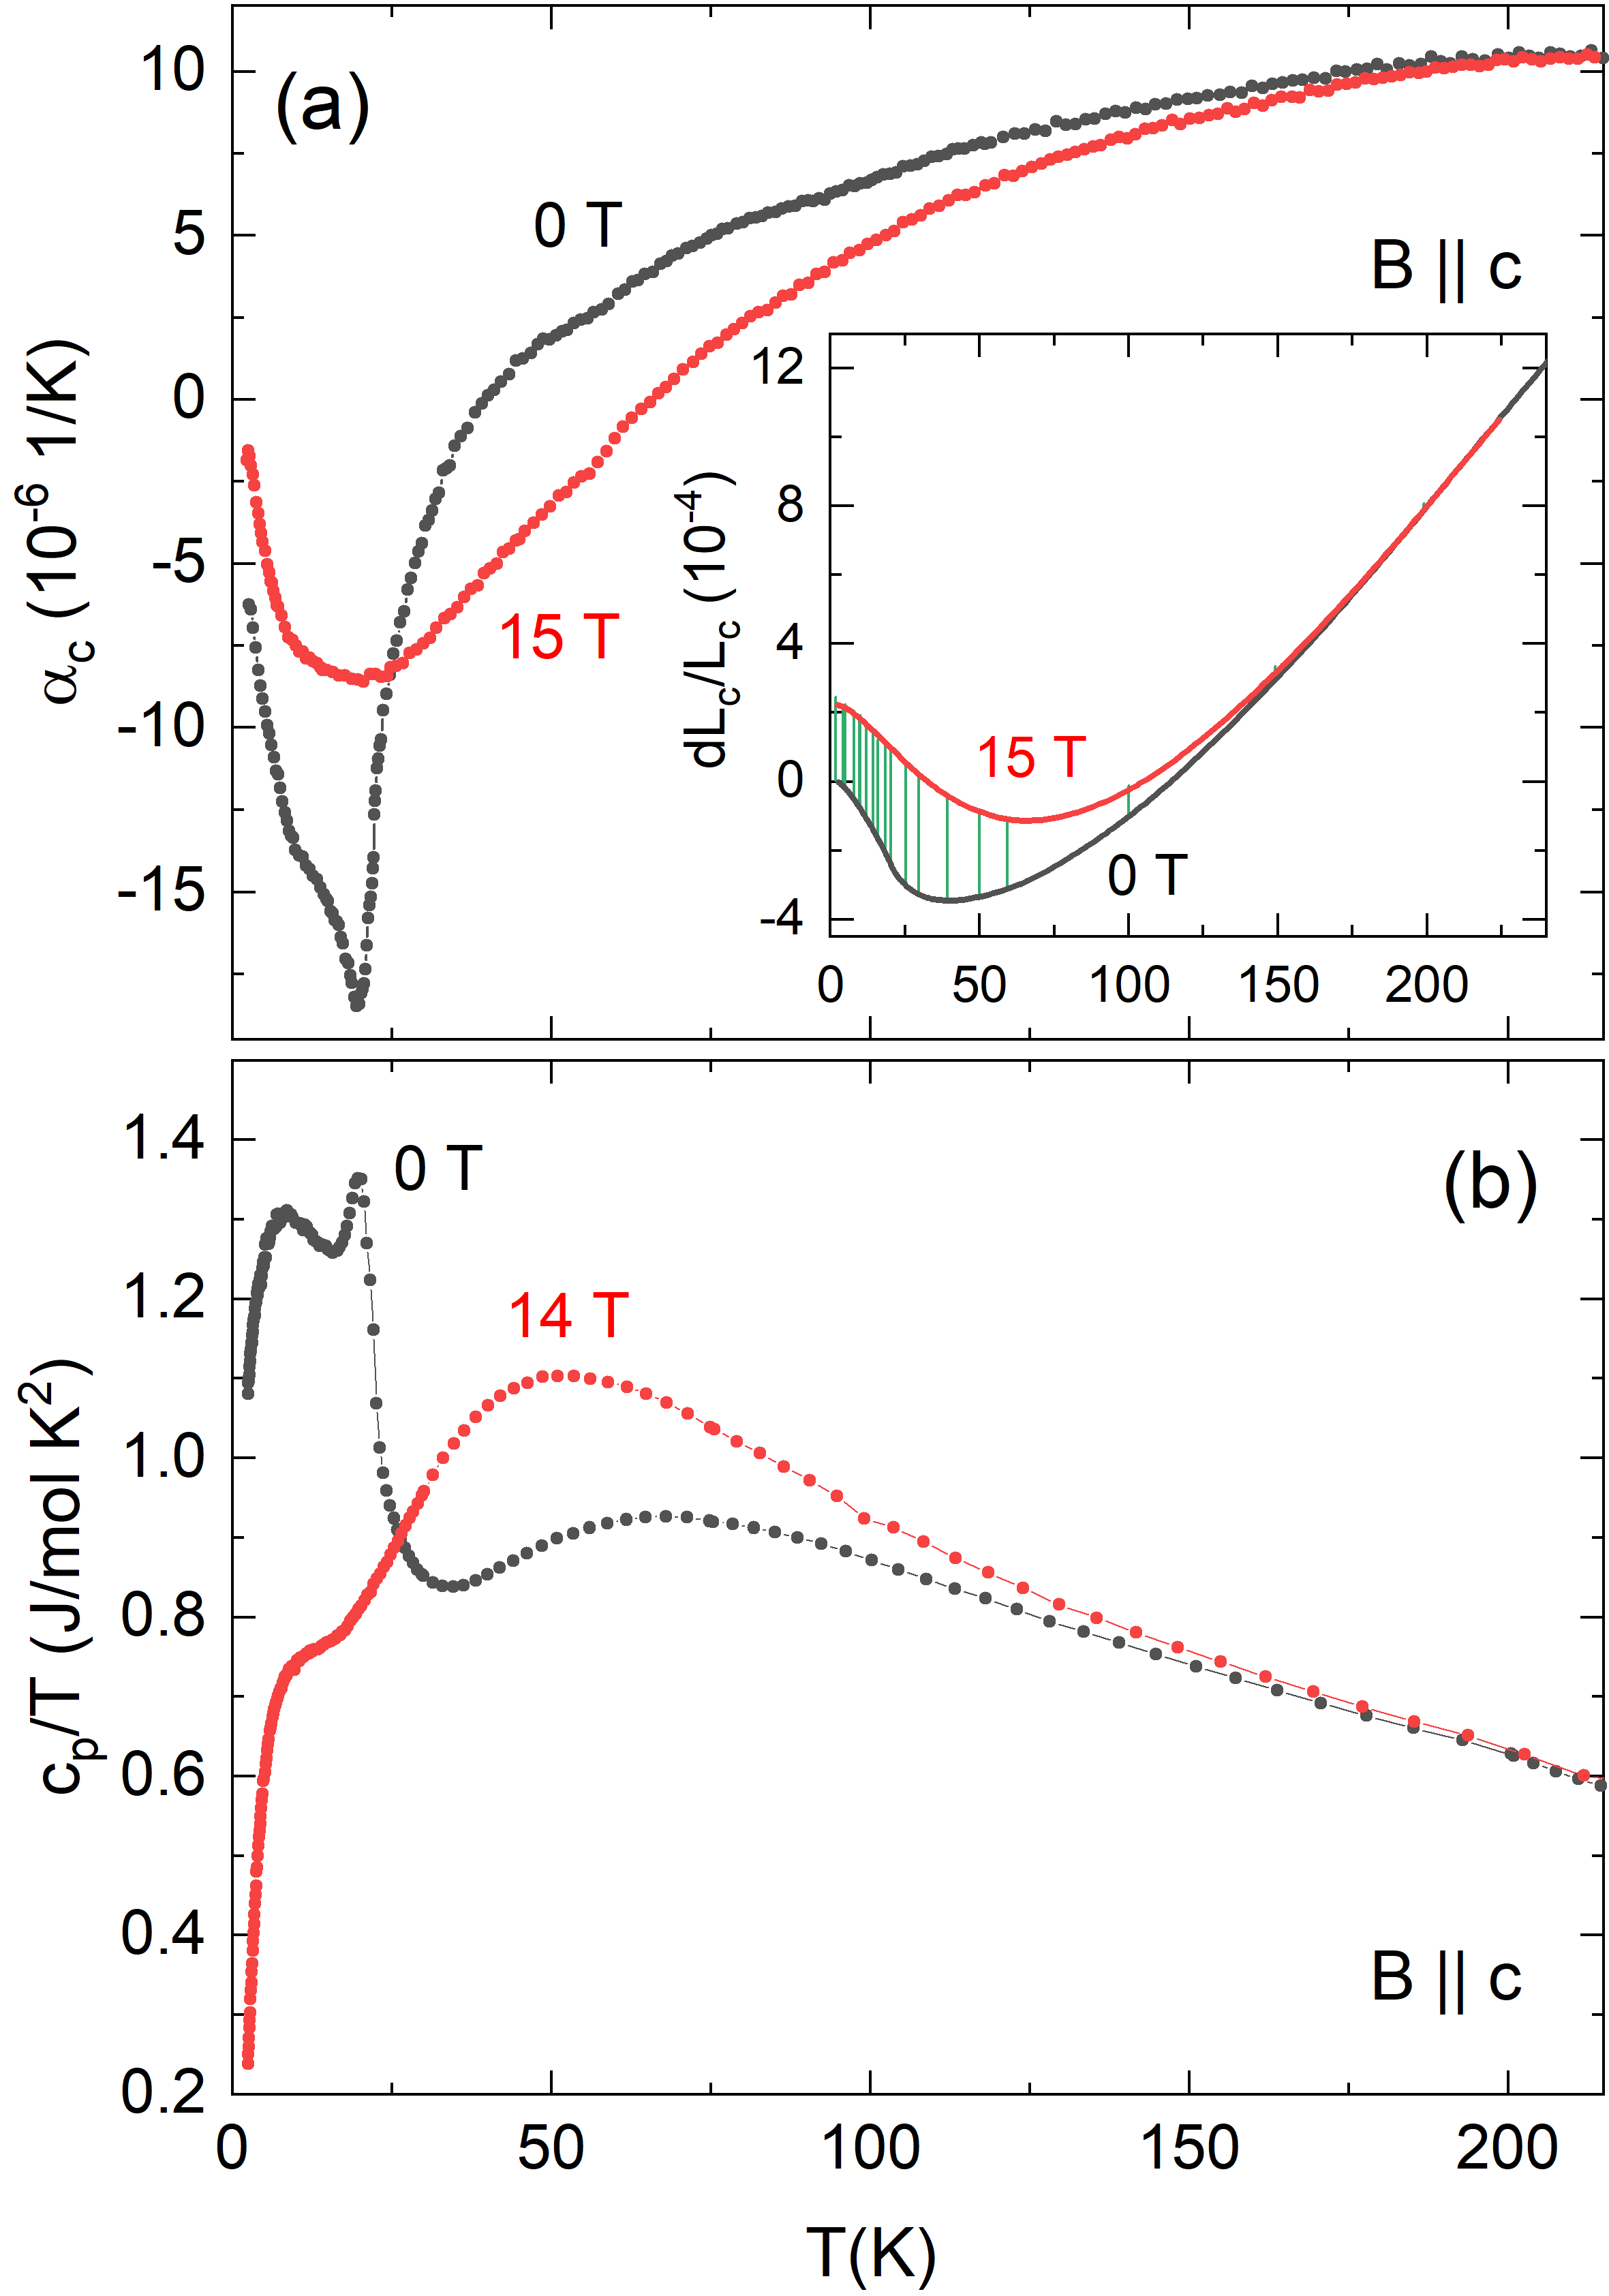
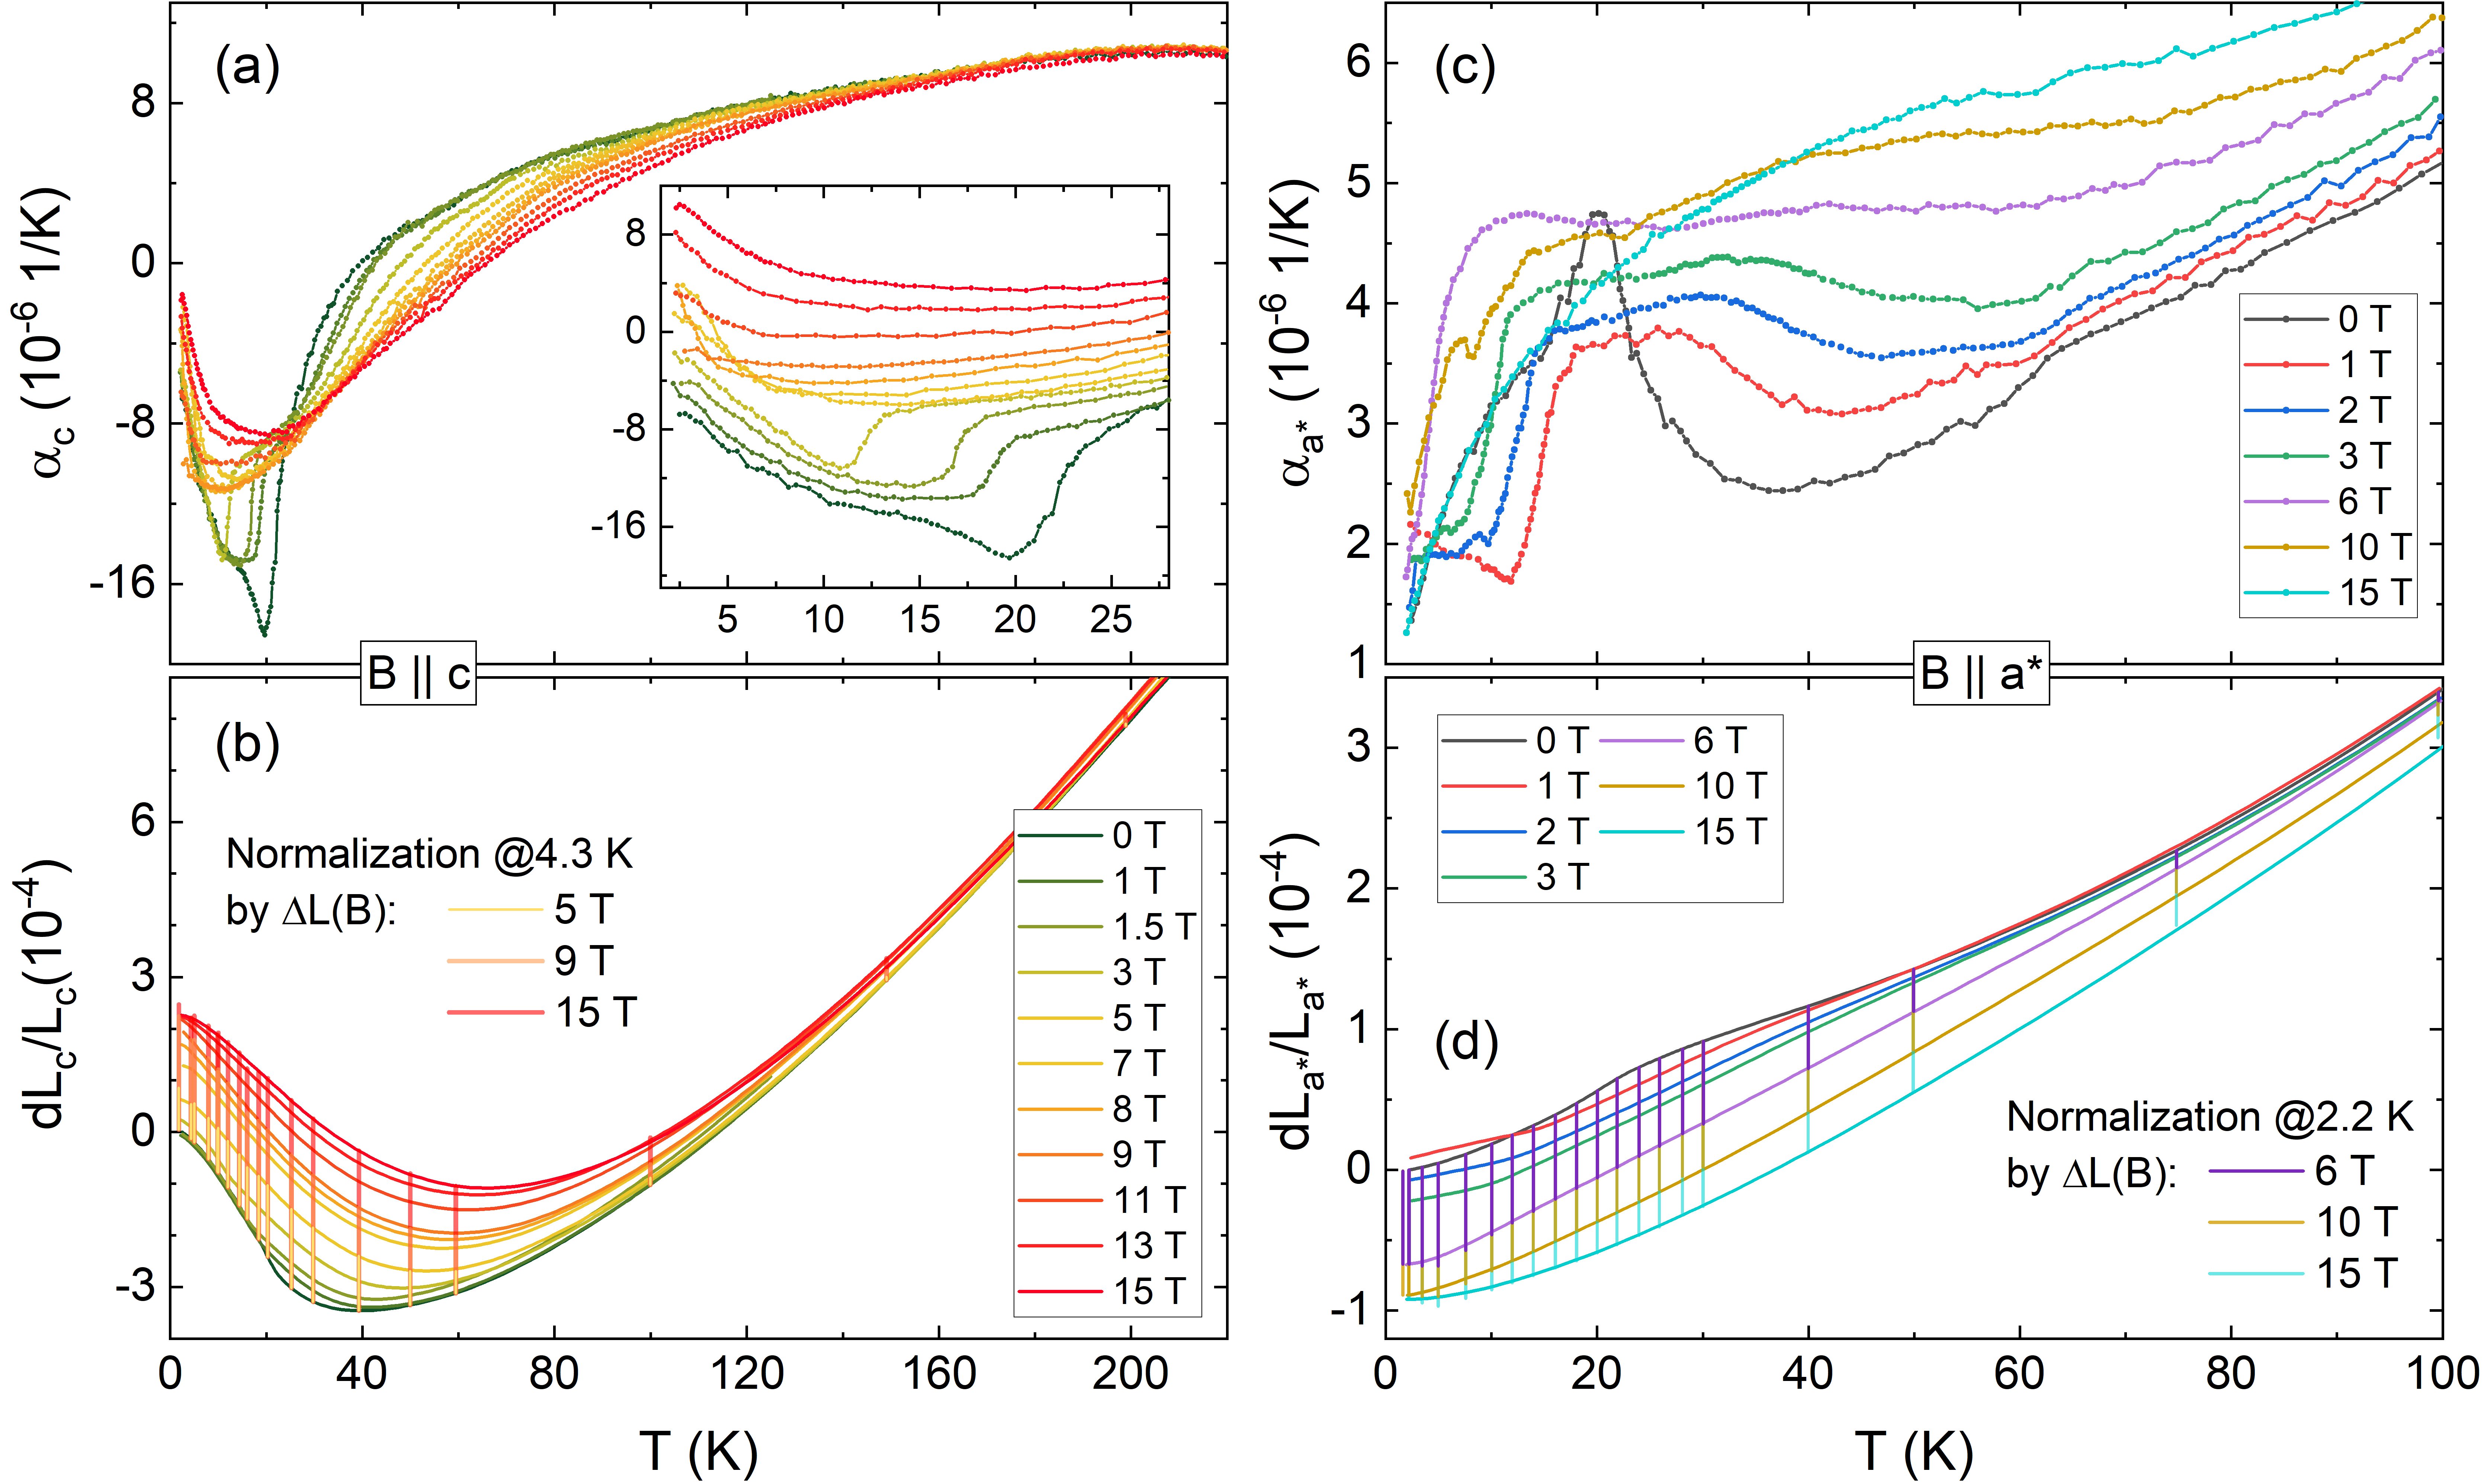
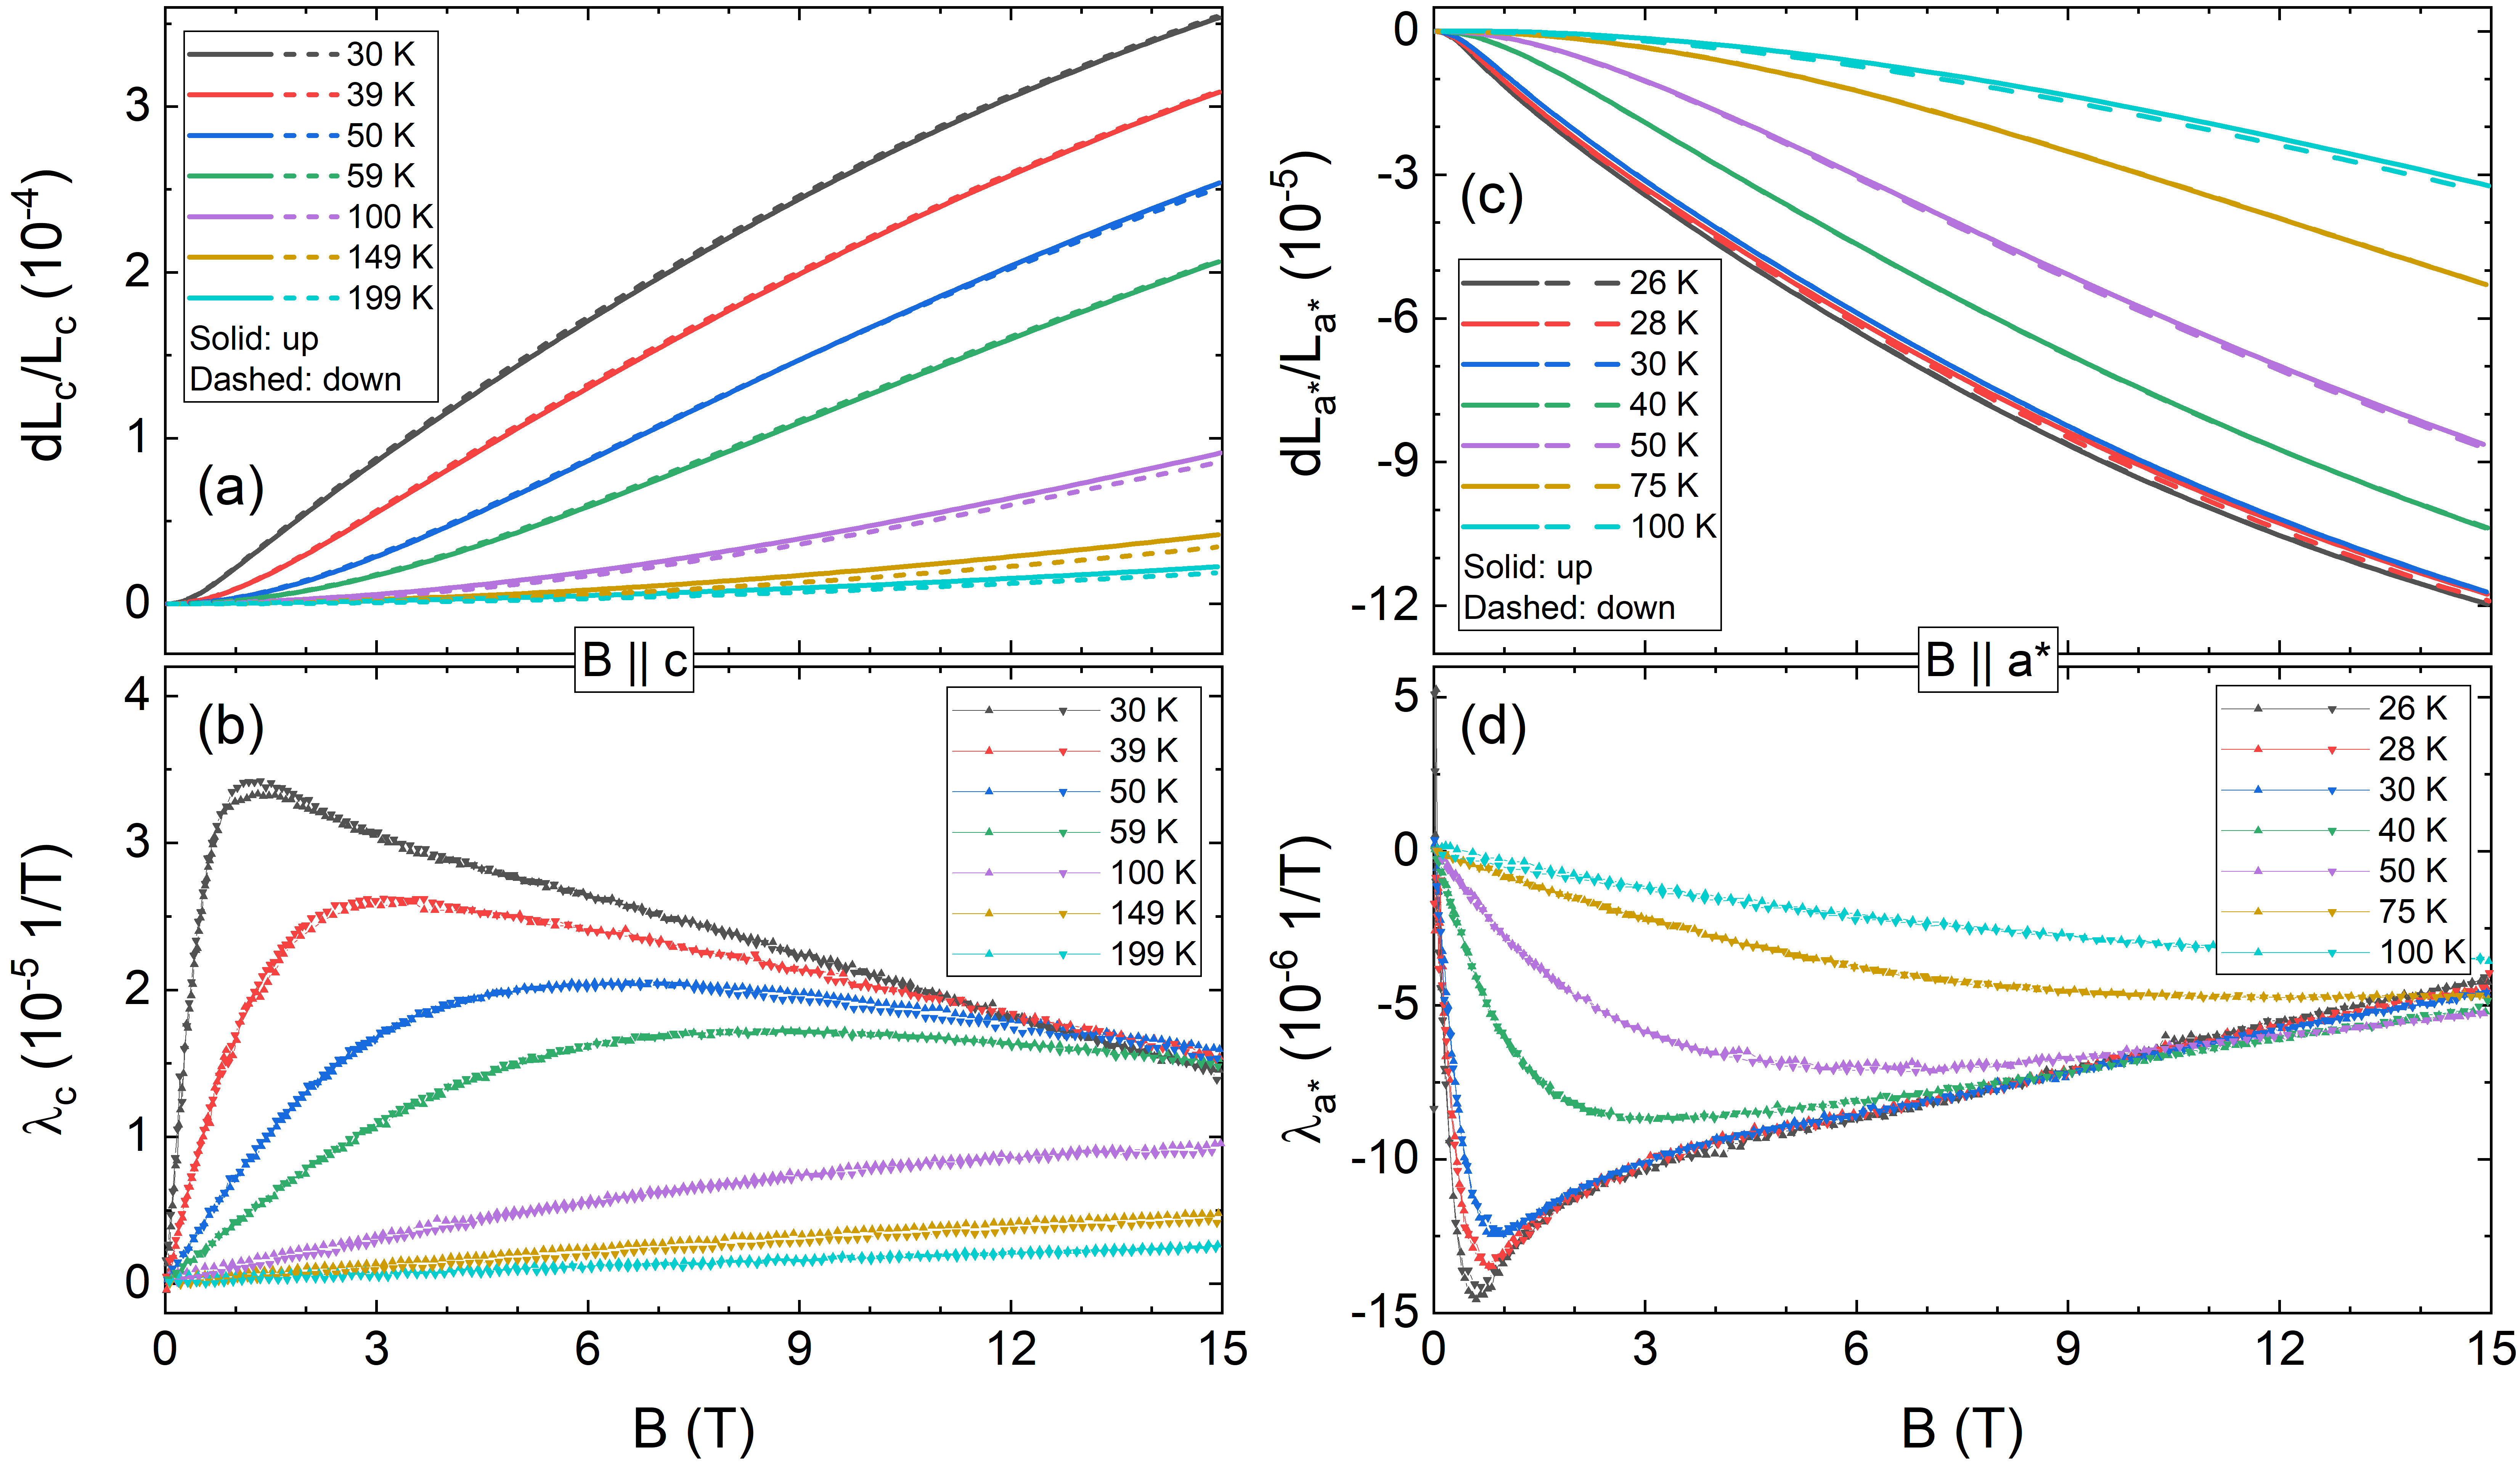
III.2 Thermal Expansion at B 0 and Magnetostriction
The effect of high magnetic fields on the thermal expansion and specific heat is shown in Fig. 3. A number of observations can be made: (1) The sharp features indicating phase transitions are absent at T. (2) Significant entropy is shifted to higher temperatures and, at T, significant field effects are visible at least up to 150 K in all shown quantities, in particular for even up to about 200 K. (3) Magnetostriction from 0 T to 15 T is positive (negative) for the -axis (*-axis), and (4) the temperature region of negative thermal expansion of the -axis extends up to about 65 K at 15 T, compared to 38 K in zero-field. Note, that the magnetostriction data fully agree to the thermal expansion data at T as shown by the (green) vertical lines in the inset of Fig. 3).
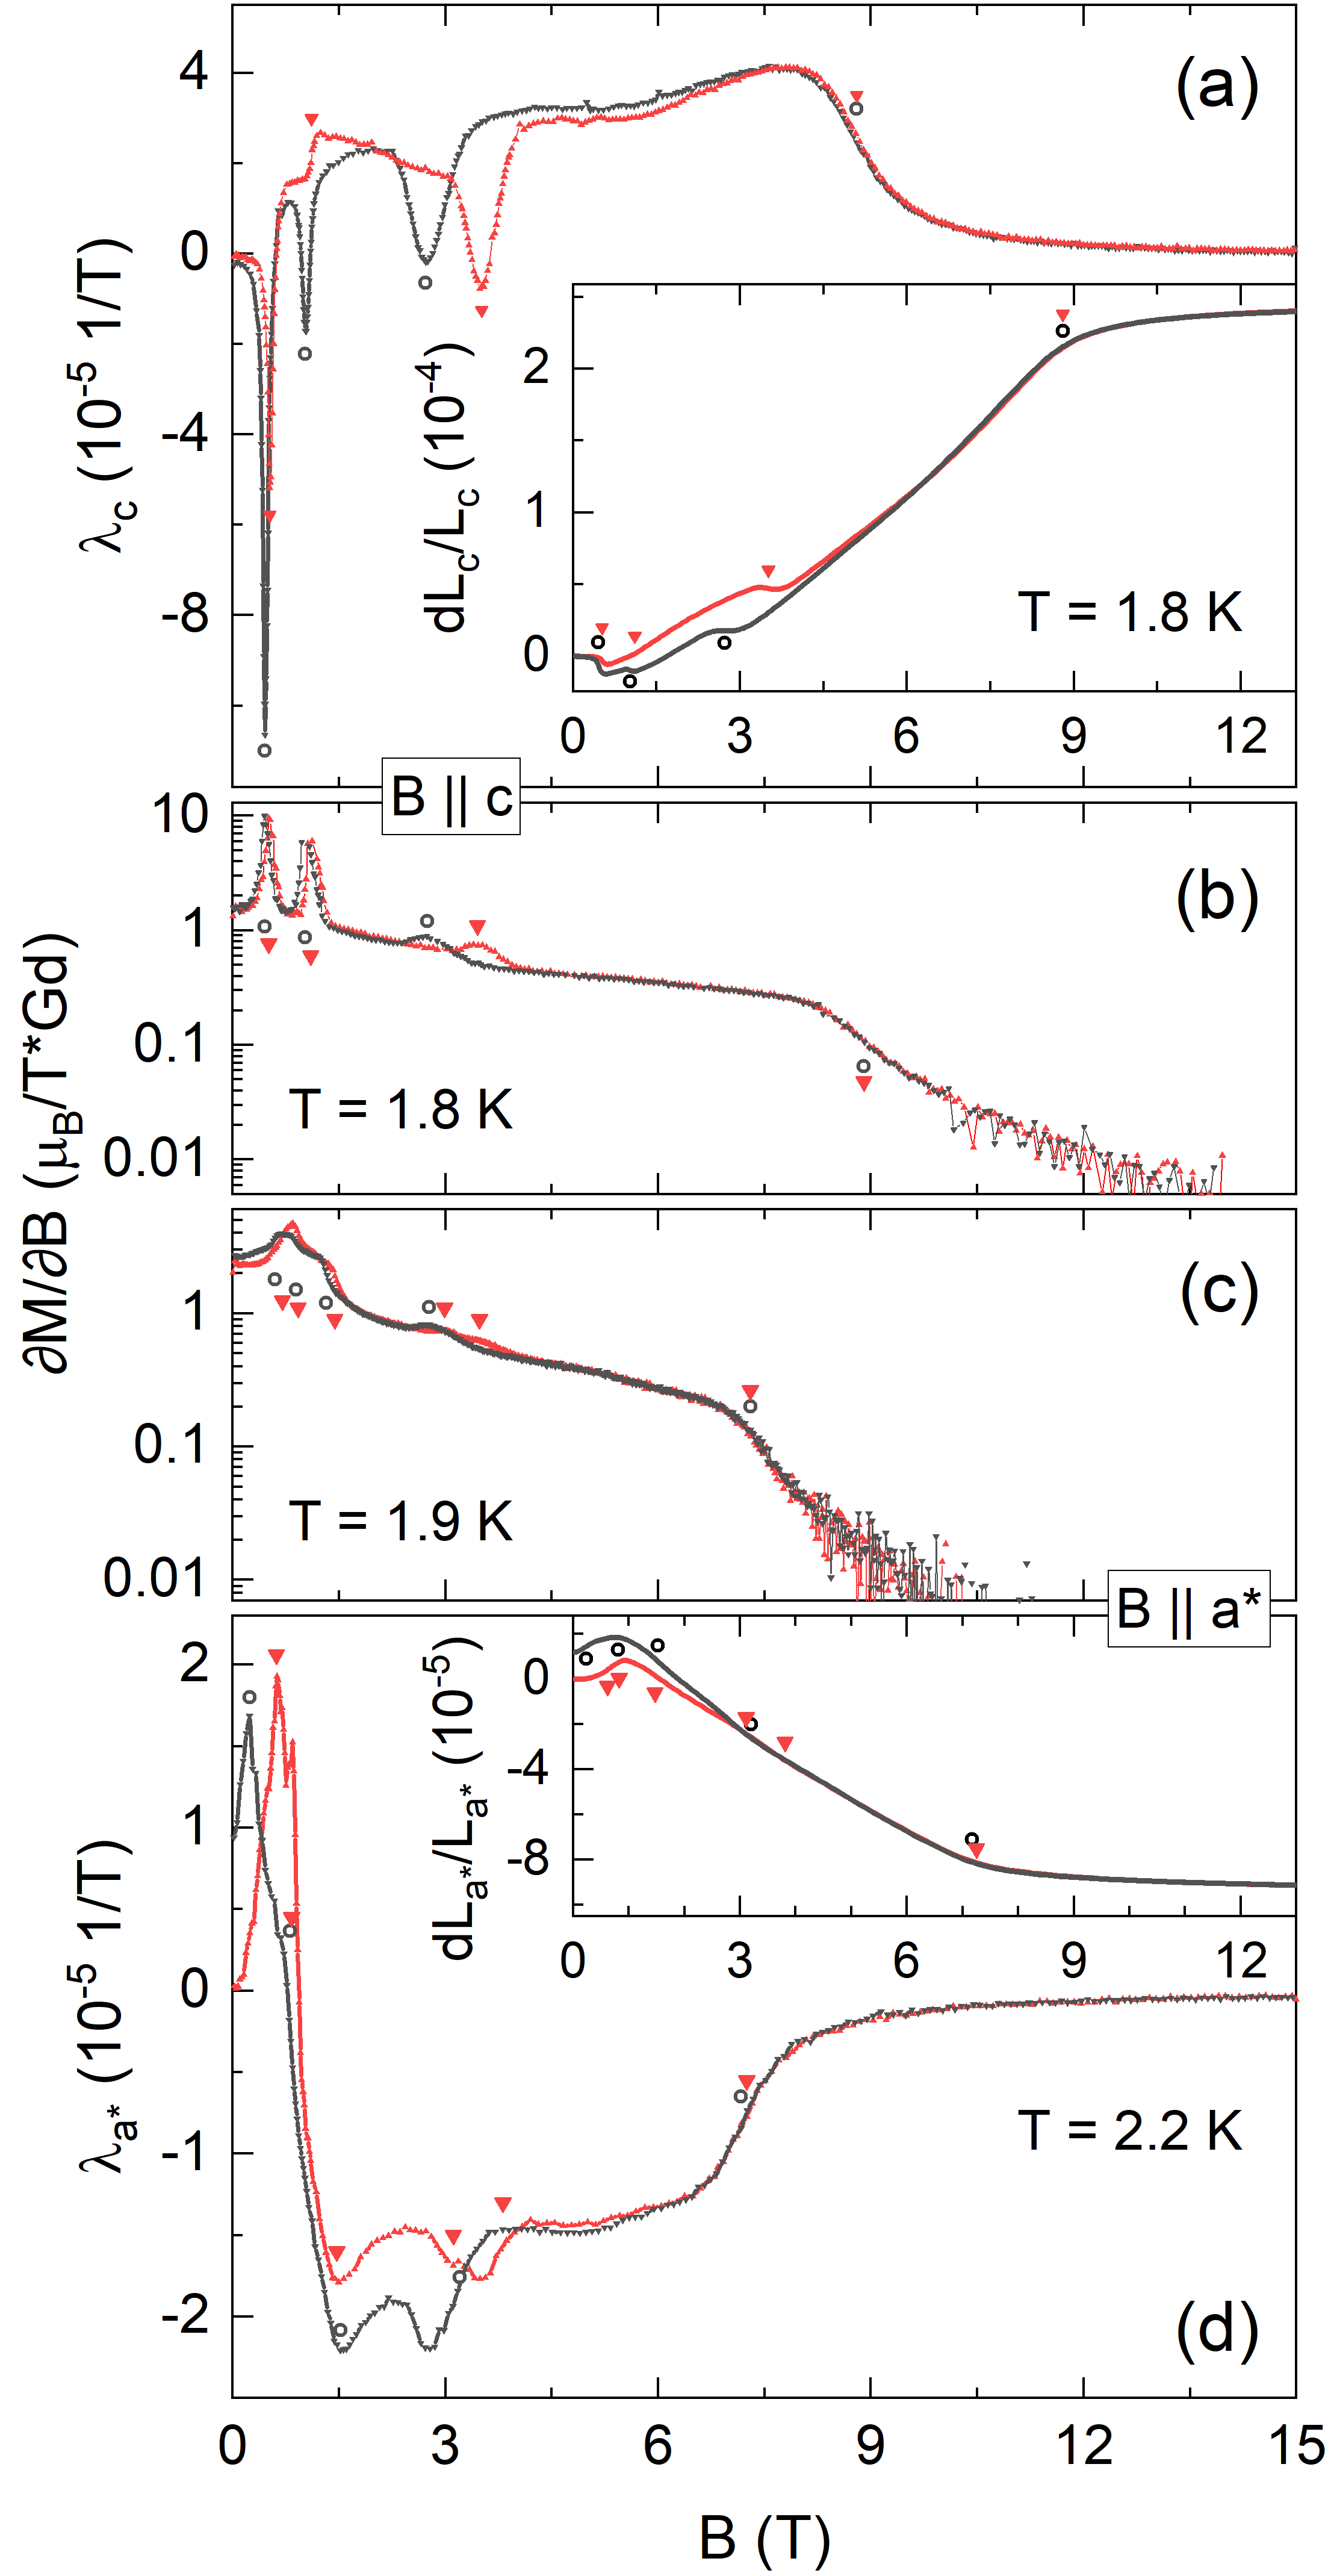
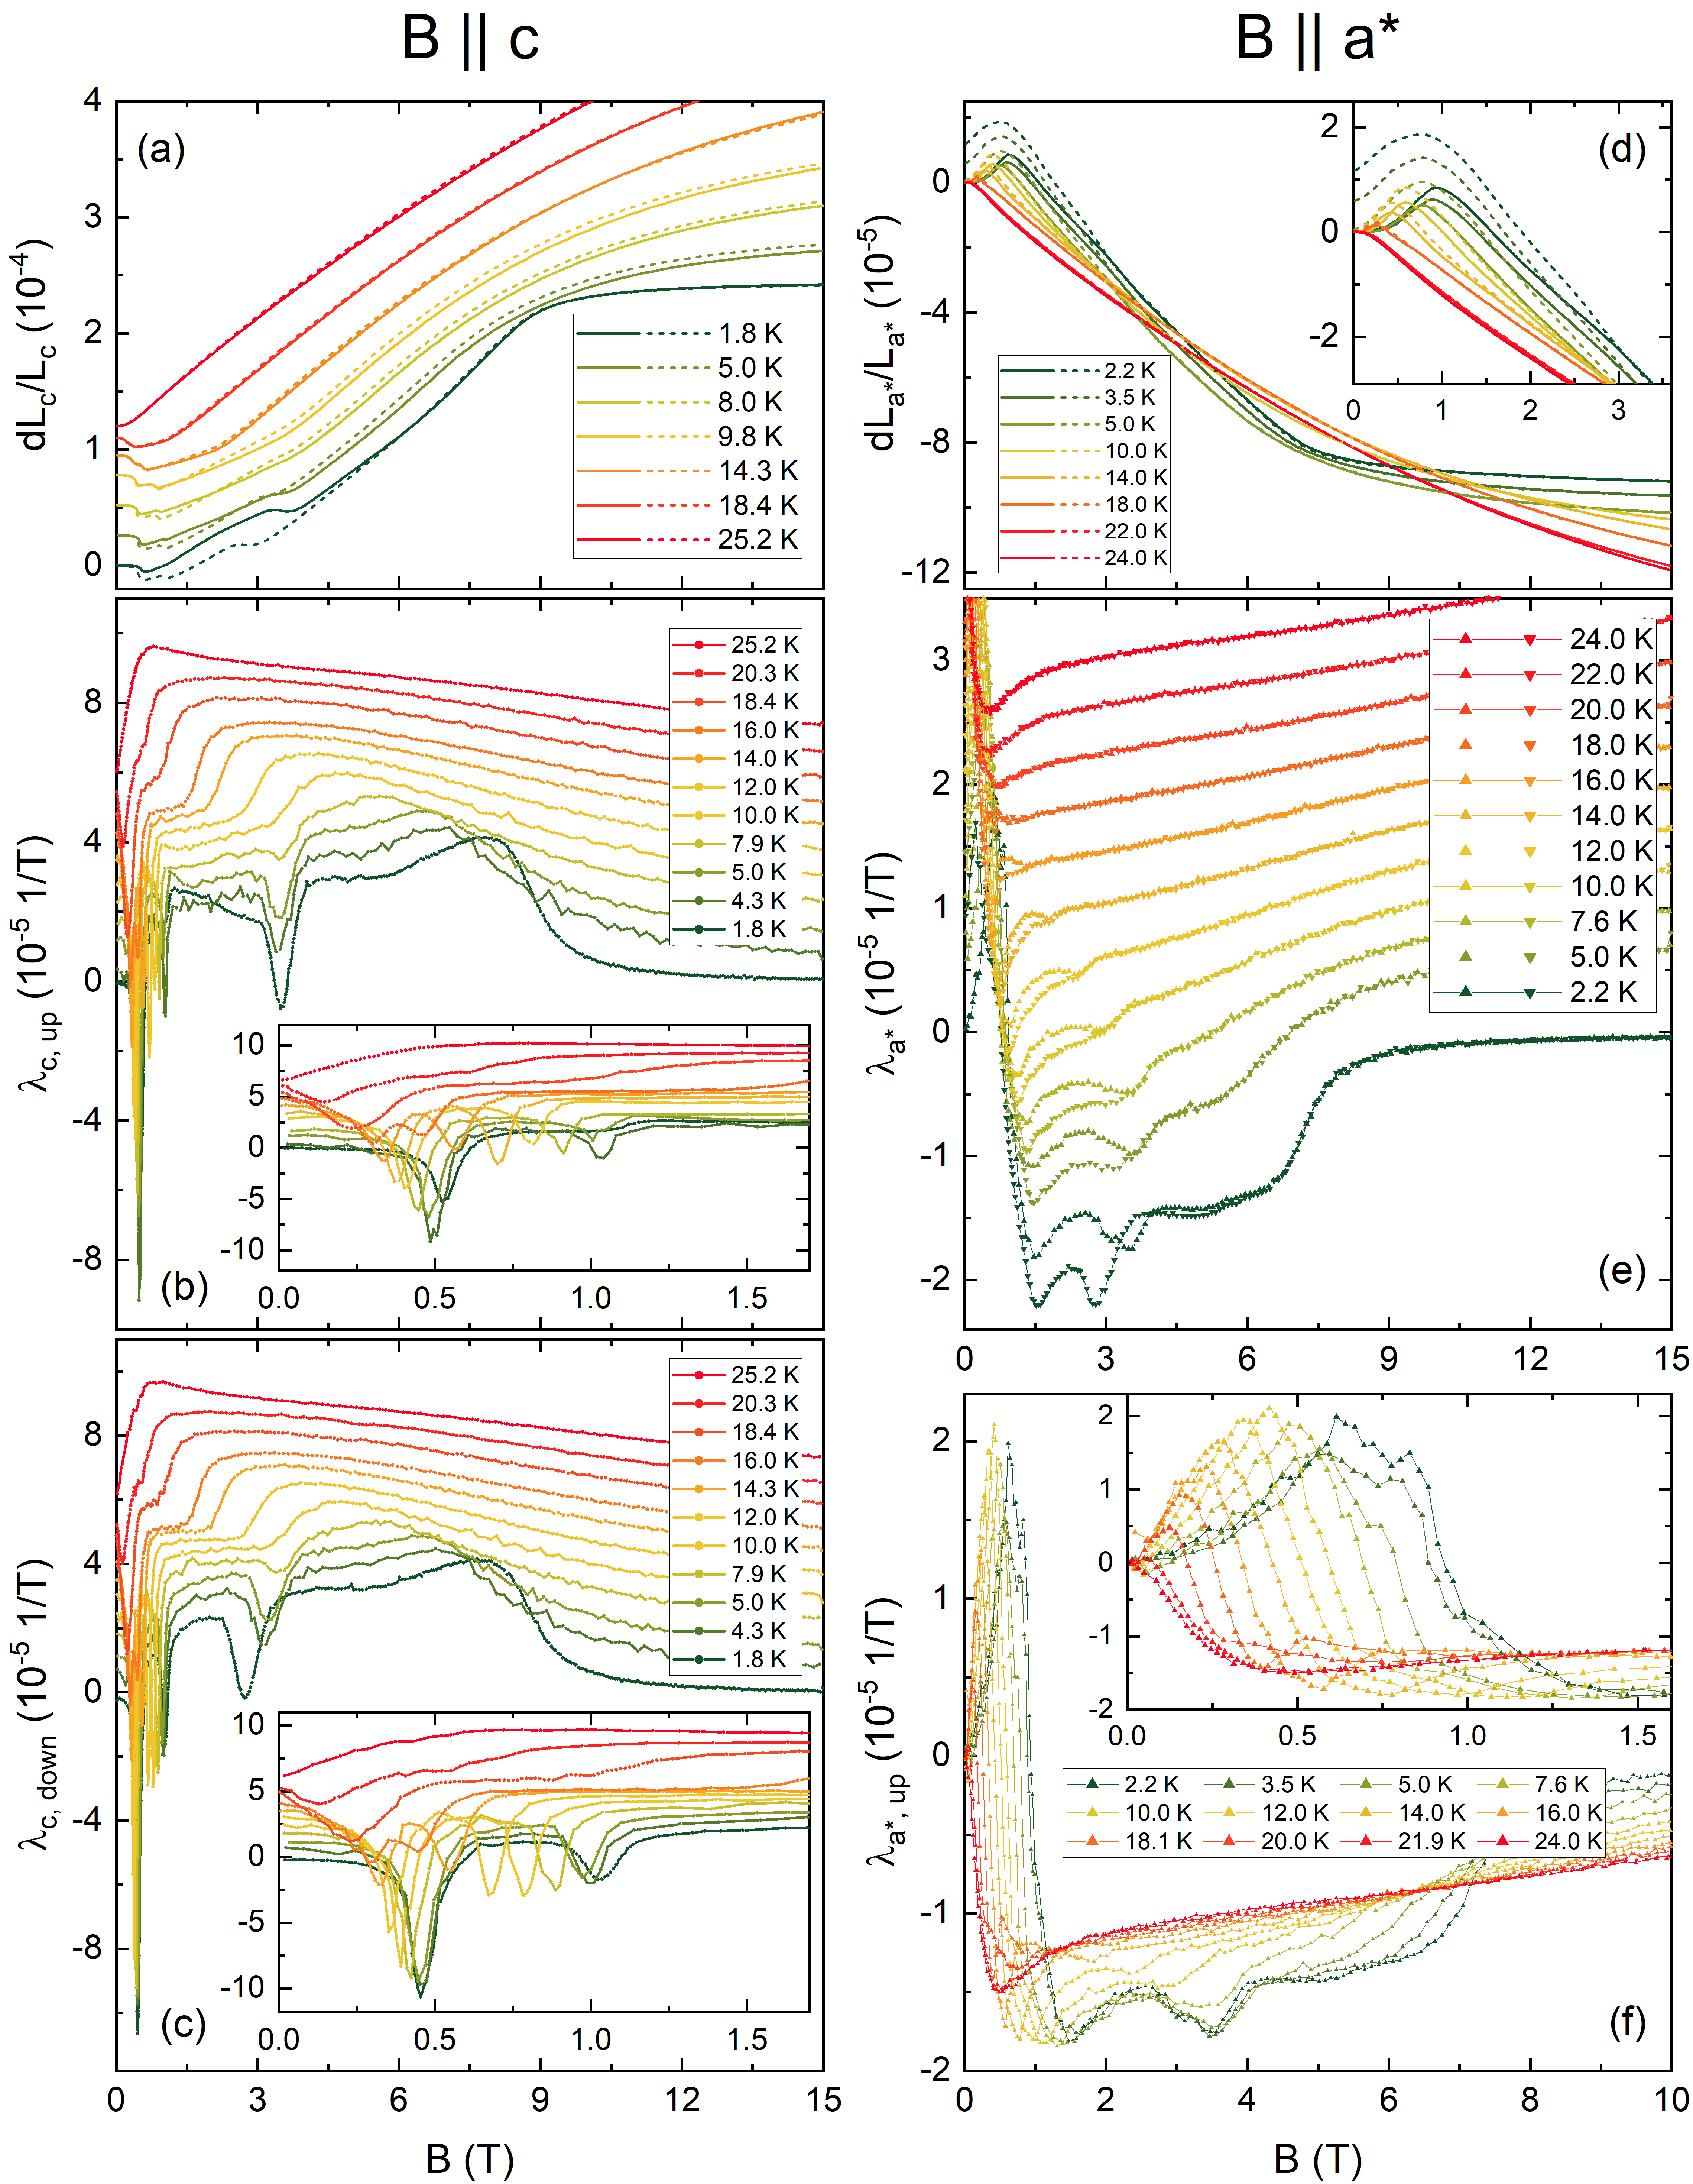
Magnetostriction data at K shown in Fig. 4(a) and (d) further confirm strong magnetoelastic coupling and in addition clearly show the field-induced phase transitions. For comparison the isothermal magnetic susceptibility is also presented on the same field scale for both directions (Fig. 4(b-c)). Considering the data for , four anomalies can be identified (Fig. 4(a)): Up to 3.5 T, there are two sharp peaks in signalling jumps in with only small field-hysteresis, followed by a broad peak with a large hysteresis of 0.8 T. The size of the anomalies for up- and down-sweep differs strongly. All three anomalies indicate discontinuous phase transitions. Corresponding anomalies and hystereses are also visible in the magnetic susceptibility. In addition, there is a broad downward jump in at around 9 T, above which magnetostriction becomes virtually zero which is also reflected by small , i.e., rather full alignment of magnetic moments in field (please note the logarithmic scale in Fig. 4(b) and (c)). The overall region where hysteresis is visible extends from about 6 T down to the lowest fields (see the inset in Fig. 4(a)) but no remanent magnetostriction is visible which would indicate irreversible changes in the sample, e.g., through domain effects. Four features are also visible in for * (Fig. 4(d)). These anomalies are smaller in magnitude, much broader and less well-defined than for the -axis. Similar to the findings for , there is a jump at higher fields, at about 7.3 T, but here of opposite sign. Again, it signals a continuous transition to the saturated phase of vanishing magnetostriction. In contrast to , the magnetostriction measurements (*) feature pronounced remanent magnetostriction below 5 K, i.e., non-zero overall length changes after sweeping the field from 0 T to 15 T and back to 0 T. At 1.8 K, this amounts to . We attribute this observation to the irreversible effects of structural or magnetic domains as seen, e.g., in \ceCoCl2 Kalita et al. (2000), \ceNiCl2 Kalita et al. (2002) and \ceNiTiO3 Dey et al. (2021). Such irreversible domain effects seem to be absent in the measurements along the -axis. The transition between a multidomain and single domain state may thus be fully reversible for . We conclude that hysteresis found for * below 3.5 T is both due to the discontinuous nature of the phase transitions and domain effects.
Both data sets, hence, imply a series of four phase transitions in magnetic field, at K, which is also corroborated by magnetization studies (also see Fig. S7) and agrees to the recently published phase diagram for . Hirschberger et al. (2020a) Following the notations in Refs. [Hirschberger et al., 2020a; Kurumaji et al., 2019] for the phases appearing for , we label the respective phases as IC-1, A, IC-2, DP, and field induced ferromagnetic (fiFM) phase, with IC-1/IC-2 being characterized by incommensurate spin configurations, A by the formation of a skyrmion lattice (SkL), and DP by the depinning of the direction of magnetic moments (see also the phase diagram in Fig. 6). We note, however, that while the magnetostriction data evidence field-driven structural changes, domain effects may obscure the actual phase transitions up to the field and temperature regions at which a single domain state is achieved. In particular, broad peaks in the magnetostriction coefficients as seen in (Fig. 4(b), S4(e) and (f)) do not necessarily indicate the actual phase boundaries, but the peak positions may differ from those found in the magnetization studies, as shown by a phenomenological model by Kalita et al. Kalita et al. (2000). Therefore, for the further thermodynamic analysis of the phase boundaries as well as the construction of the phase diagram, for * we will only consider anomalies in the magnetostriction which can directly be linked to anomalies in isothermal magnetization.
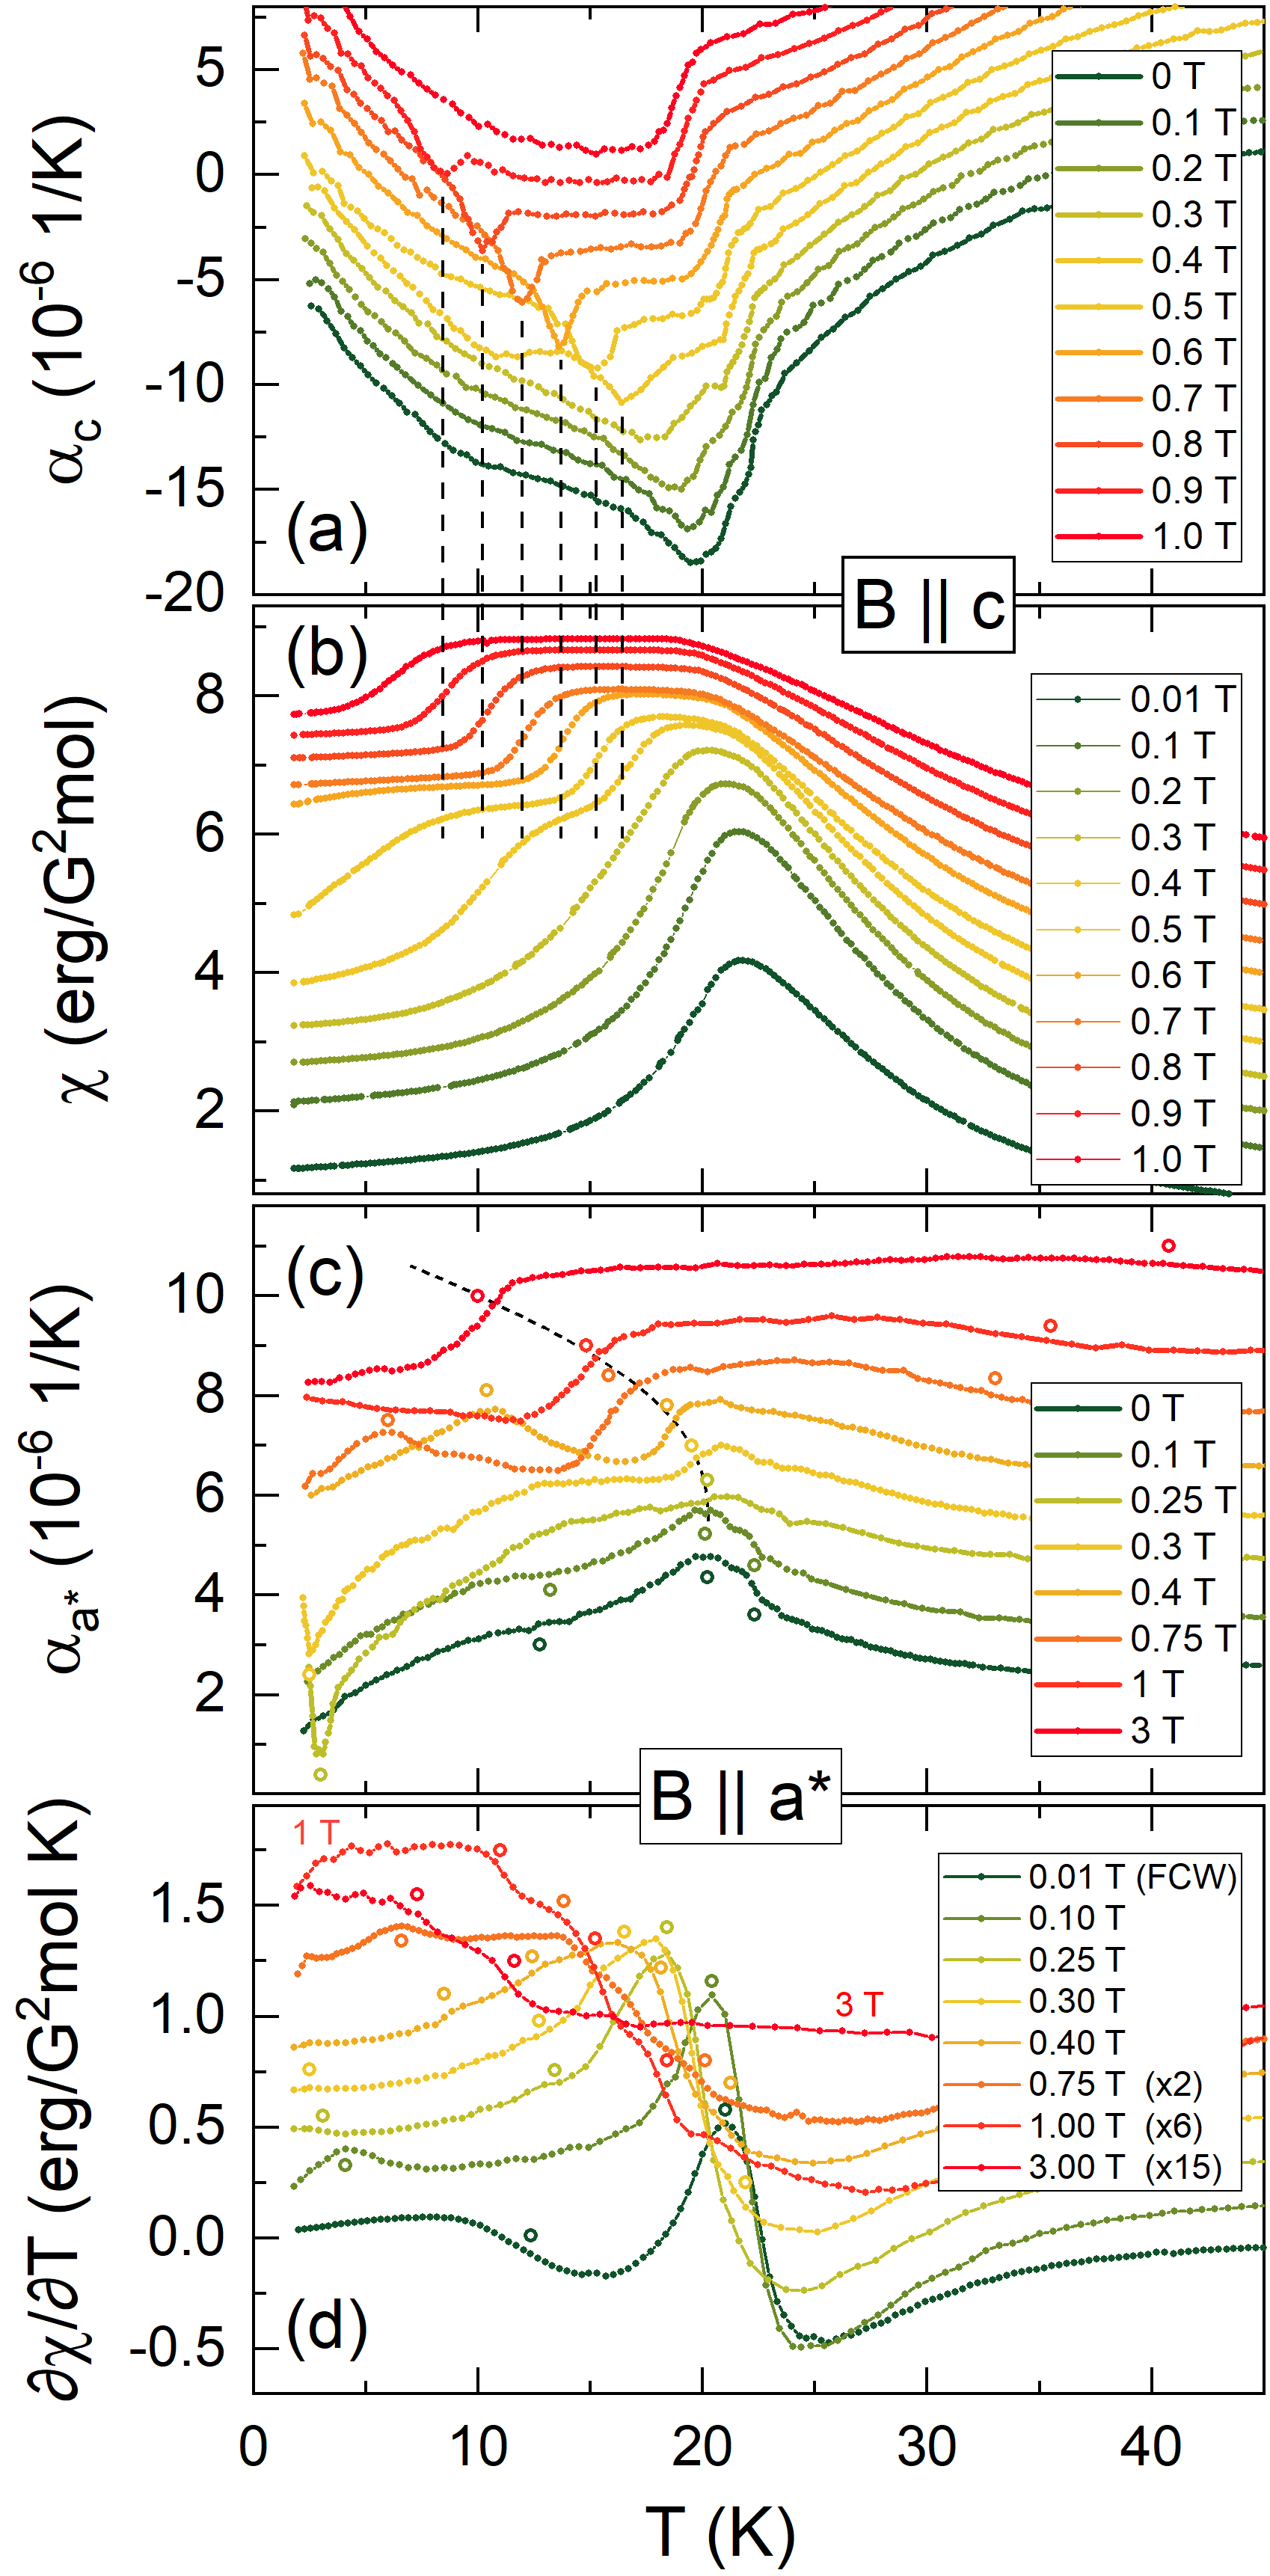
In order to obtain the phase boundaries, we have performed thorough magnetostriction and isothermal magnetization studies at various fixed temperatures as well as corresponding temperature sweeps at fixed magnetic field (see Figs. S4, S5, S7). FN (2) This is demonstrated in Fig. 5, where the thermal expansion coefficients in low fields up to 3 T and the corresponding magnetization data are presented. For (Fig. 5(a) and (b)), the evolution of two different phase boundaries can be traced straightforwardly. Specifically, applying small fields yields a suppression of while the jump at becomes more distinguished. In increasing field is also suppressed to lower temperature, but to a smaller extent (Fig. 5a). Above 0.3 T the peak assigned to at zero-field changes its shape, signaling the transition from the previously reported skyrmion lattice A phase to the IC-2 phase. It is associated with a jump in the static susceptibility from one -independent value to another (Fig. 5(b)). At 0.4 T, a second feature corresponding to the transition from the A phase to the IC-1 phase is visible in both and , while above 0.9 T (1 T for ) all features below are gone. Quantitatively, gradually decreases from 0.91 /Gd3+ at 0.9 T and 8.6 K to 0.36 /Gd3+ at 0.4 T and 16.4 K. The pronounced jump in at corresponds to a kink in the static susceptibility, i.e., a jump in its derivative (see SI, Fig. S7).
As mentioned before, anomalies seen for measurements along the *-axis are in general much weaker and less well-defined than for the -axis. Furthermore, the evolution of anomalies in the thermal expansion and the static susceptibility along the *-axis is even more complex than for (Fig. 5(c) and (d)). In zero-field, the anomaly at is also visible (see Fig. 1, as well as SI, Fig. S10(d) and can be traced up to 0.4 T in . Also, a jump in evolving from can be followed to lower temperatures for increasing fields, corresponding to a jump in . Above 0.6 T this jump splits into two jumps, uncovering an additional phase between the IC-2 and fiFM phases, while we only see one broad jump in .
IV Discussion
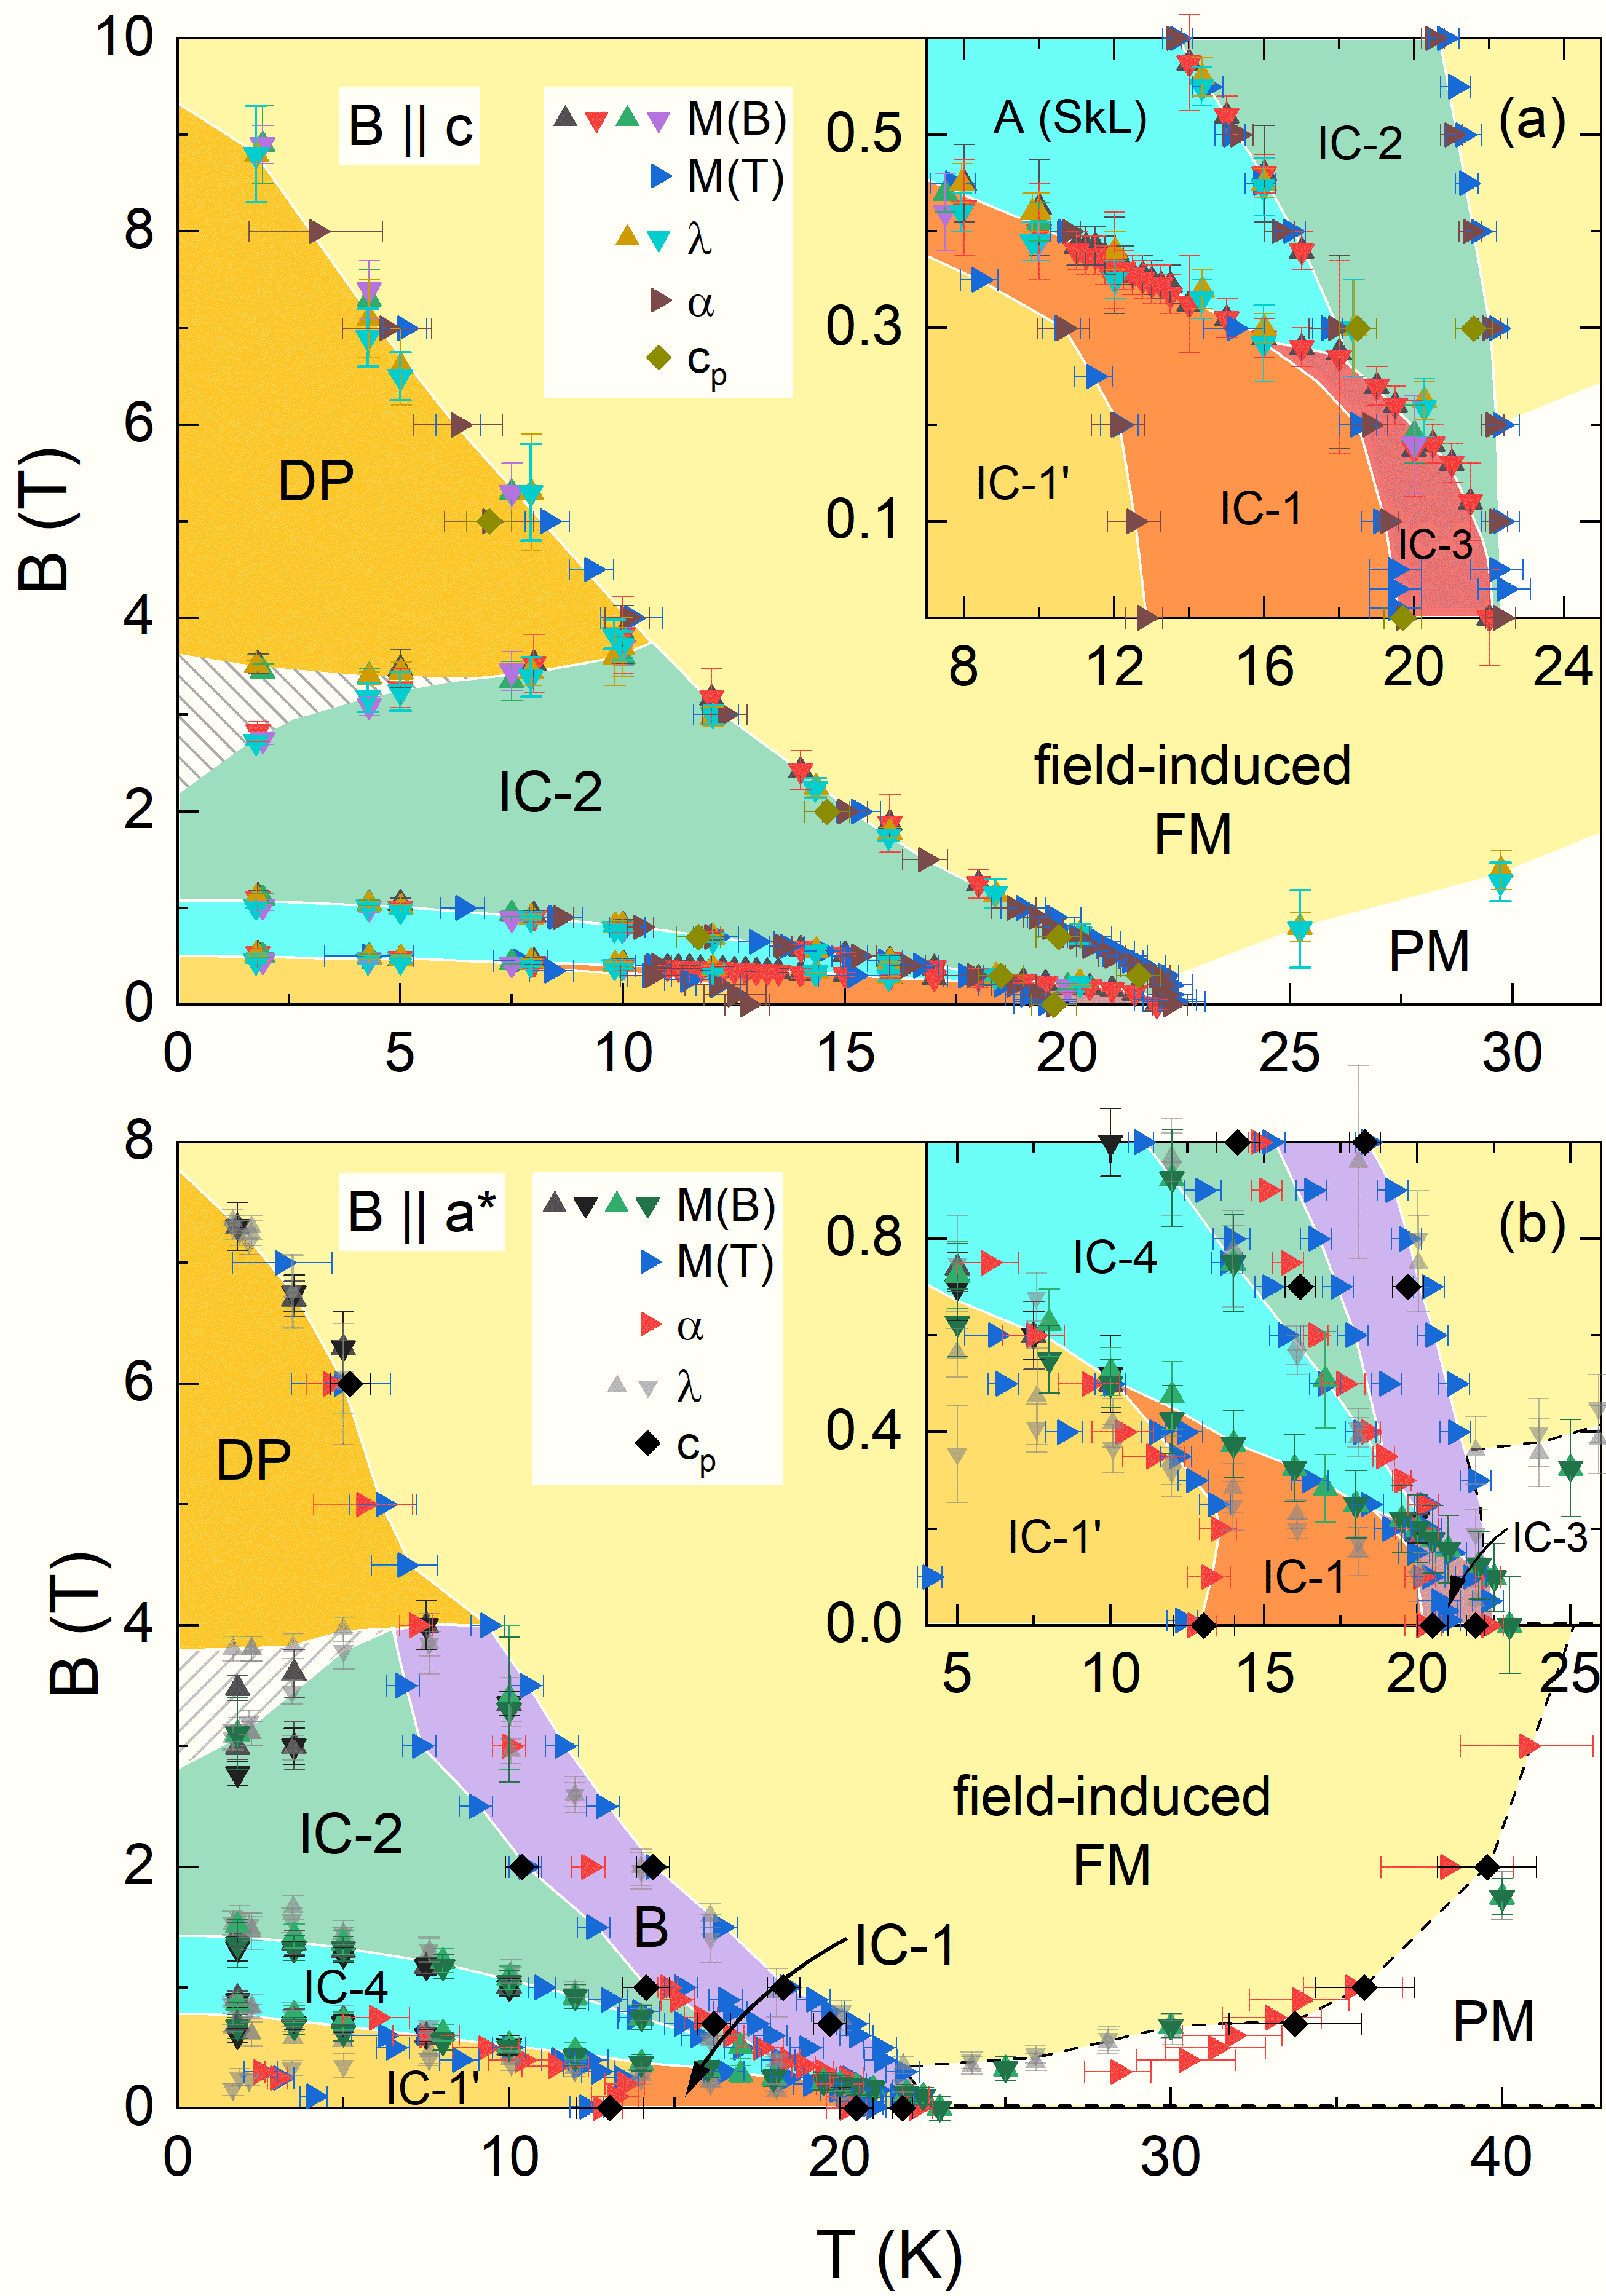
From our detailed dilatometric and thermodynamic data we construct the phase diagrams for the - and *-axes in Fig. 6. While the general features for confirm previous results Kurumaji et al. (2019); Hirschberger et al. (2020a); Zhang et al. (2020), our data evidence two phases in zero-field which were previously unknown: (1) Our isothermal magnetization data between 19 K and 22 K (SI, Fig. S7) clearly indicate that the IC-2 phase does not extend to zero field, but there is a separate pocket closed off by a phase boundary extending from the edge of the A(SkL) phase to = 22.3 K. We label this new phase IC-3, since incommensurate spin structures were previously reported for this temperature regime Kurumaji et al. (2019). (2) Furthermore, the phase boundary at splits the IC-1 phase into IC-1 and IC-1’ (Fig. 1(b) inset). The yet unreported phase diagram for * in general shows a similar behavior, with the critical fields of the IC-1’ and IC-4 phases at lowest temperatures assuming higher values than IC-1’ and the A phase for the -axis. The IC-4 phase appearing for * (see Fig. 6b) reminds of the A(SkL) phase for , however, it was shown previously by angle-dependent resistivity measurements in the *--plane at 2 K that it does not connect to the A(SkL) phase.Hirschberger et al. (2019) The magnetic structure of this phase needs to be clarified by diffraction studies. One major difference between the phase diagrams is seen for *, where the IC-2 phase is not directly adjacent to the field-induced FM phase, but there is an additional phase (labelled B) in between (see Fig. 5(c) and (d)). The B phase is bordered by two jumps both in as well as in .
From the anomalies in the thermal expansion, specific heat and magnetization at the phase boundaries we calculated the uniaxial pressure and field dependence of the critical temperatures and critical fields, as well as the entropy changes at the phase boundaries for -axis. Considering marking a continuous phase transition, the associated jumps in specific heat (), magnetic susceptibility (), and thermal expansion coefficient () are connected with the magnetic field and pressure dependencies of by the Ehrenfest-type relations (see e.g. Ref. [Barron and White, 1999; Klingeler et al., 2005])
| (4) |
and
| (5) |
Using the molar volume m3/mol (see Ref. [Frontzek, 2009]) as well as the anomaly values presented above and in Tab. S7 – for their extraction from the experimental data see the supplement, Fig. S10 – we obtain a moderate uniaxial pressure dependence of K/GPa. In a field of 0.2 T, the field dependence is very small and amounts to only mK/T. At 0.3 T, rises to K/T. These results demonstrate that the IC-1 phase is stabilized both under pressure and applied field at the expense of the IC-1’ phase. Also, from these values we can calculate the expected jump in (), at via
| (6) |
At 0.2 T this yields /(f.u. T), which is well below the resolution limit of our experiment, explaining why our isothermal magnetization studies do not show anomalies at (see SI, Fig. S10). Note, that in an early report on Gd2PdSi3 by Mallik et al. the authors detected a jump in the effective local field B at 15 K by Mössbauer spectroscopy and attributed it to a lower ordering temperature of one of the two Gd sites in Gd2PdSi3. This transition was not detected in any of the later reports on single crystalline samples, but our results presented in this work clearly confirm its presence.
The phase boundaries between the A(SkL), IC-2, and DP phases are of discontinuous nature, exhibiting jumps in the length changes and in the magnetization (i.e., in magnetic moment). Therefore, the Clapeyron equations Barron and White (1999)
| (7) | ||||
| (8) | ||||
| (9) |
apply for the pressure and field dependence of the respective critical temperatures and critical fields . Hence, the observed slopes (see Tab. S1–S4) and the jumps allow us to obtain the associated entropy changes .
For the transition from the incommensurate IC-1’ phase to the skyrmion lattice A phase, a jump Gd accompanies the -axis contraction of at 4.3 K. Applying the above-mentioned thermodynamic relations yields small entropy changes on the order of mJ/mol K and a negative uniaxial pressure dependence of K/GPa. At higher temperatures these values decrease down to mJ/mol K and K/GPa at 16 K (see Tab. S1). At the transition from the skyrmion lattice A phase to the IC-2 phase the -axis also contracts, but these contractions are much smaller ( at 4.3 K) while the jumps in magnetization again roughly correspond to one Bohr magneton per Gd ion (Gd at 4.3 K). Accordingly, this phase boundary shows much smaller pressure dependence, i.e., K/GPa at 4.3 K (see Tab. S2). At the same time, the steeper slope of the phase boundary implies larger changes in entropy of mJ/mol K at 4.3 K which increases to almost mJ/mol K at 16 K. We note that the analysis of anomalies from temperature instead of field sweeps confirms these values (Tab. S3). Looking at higher fields, the slope of the phase boundary from IC-2 to the depinned phase (DP) is very small, changing from a small negative slope below 6 K to a small positive slope above. Considering the measured anomalies Gd at 4.3 K, this yields negligible associated entropy changes (Tab. S4). In contrast, there are pronounced lattice effects ( at 1.77 K) yielding a very large pressure dependence for the phase boundary IC-2 DP.
| Transition | (K) | (T) | (10-6) | (/Gd) | (T/K) | (mJ/mol K) | (K/GPa) | (mT/GPa) |
|---|---|---|---|---|---|---|---|---|
| IC-1 A(SkL) | 4.30.1 | 0.490.02 | –10.81.1 | 1.00.1 | –0.01 | 12513 | –6.10.9 | –5050 |
| A(SkL) IC-2 | 4.30.1 | 1.040.03 | –2.40.3 | 1.00.1 | –0.03 | 36040 | –0.470.07 | –152 |
The results of the thermodynamic analyses are shown in table I as well in tables S1 to S4 in the supplement. In particular, our analysis evidences pronounced negative uniaxial pressure dependencies for all three phase transitions between IC-1/IC-1’, A(SkL), IC-2 and DP at low temperatures. This implies that the IC-1’/IC-1, A(SkL) and IC-2 phases are all destabilized by pressure along the -axis with respect to the higher temperature phases, i.e., the field-induced FM phase – and the paramagnetic phase at low fields – is stabilized.
In particular, our data for provide further information on the skyrmion phase. Both the onset of the SkL phase from incommensurate magnetic order IC-1/IC-1’ and its transition into the incommensurate IC-2 phase are discontinuous in nature. In both cases, transitions are associated with the increase of magnetization by about 1 Gd. Rather flat phase boundaries in the magnetic phase diagram are indicative of comparably small entropy changes. Our quantitative analysis evidences that the evolution of the SkL phase, depending on the temperature, yields an entropy gain of mJ/(mol K) while the entropy jumps at the transition out of the skyrmion phase by 300-600 mJ/(mol K). These values are by far larger than for the chiral magnet \ceMnSi where latent heat at the phase boundaries only amount to a few mJ/(mol K). Bauer et al. (2013) Uniaxial pressure along the -axis significantly enhances the SkL phase as seen by the uniaxial pressure dependencies of the transition temperatures. Specifically, at 4 K there is a rapid decrease of the IC-1/IC-1’ A(SkL) transition temperature K/GPa, leading to an expansion of the A(SkL) phase towards lower temperatures under pressure. At the same time the temperature of the A(SkL) IC-2 transition, i.e. exiting the SkL phase towards higher temperatures, changes by only K/GPa (see tables I and II). Enhancement of skyrmion lattice phases under pressure is also observed in other materials. In the insulating skyrmion system Cu2OSeO3, Levatić et al. report a dramatic enhancement of the skymion pocket under pressure by about 8 K at 0.6 GPa. Levatić et al. (2016) While in Gd2PdSi3 the SkL phase appears at lower temperatures, our results () imply about half of this effect. We also note similar findings to the ones reported at hand in the chiral magnet MnSi Chacon et al. (2015); Nii et al. (2015) where uniaxial pressure along [001] yields a rapid decrease of the onset temperature of the skyrmion phase while the high temperature phase boundary shows a much smaller pressure dependence. FN (3) Recent theoretical studies by Hayami et al. investigated the influence of single-ion anisotropy on the formation and stability of the skyrmion lattice phase. They show that easy-axis anisotropies stabilize magnetic-field-induced skyrmion crystals in frustrated magnetsHayami et al. (2016) and easy-axis (easy-plane) anisotropy substantially increases (decreases) the stable field-range for a Skyrmion lattice. These findings suggest, that the pressure dependencies stabilizing the skyrmion lattice phase in Gd2PdSi3 may originate from small distortions in the local environment of \ceGd leading to an increase of the weak magnetic anisotropy of the Gd moments.
The transition from the depinned phase to the field-induced ferromagnetic phase is of a continuous type. It exhibits a jump in the magnetostriction coefficient (at 1.77 K) and in the derivative of the magnetization /(T Gd) (T = 1.9 K). Using an Ehrenfest relation, the uniaxial pressure dependence of the critical field can be expressed as , which yields T/GPa at 1.77 K, i.e. the depinned phase is stabilized under uniaxial pressure . Similarly, using the anomaly values listed in Tab. S5, we find uniaxial pressure dependencies of the critical field between T/GPa (10 K) and T/GPa (14 K) at the continuous transition IC-2 to fiFM.
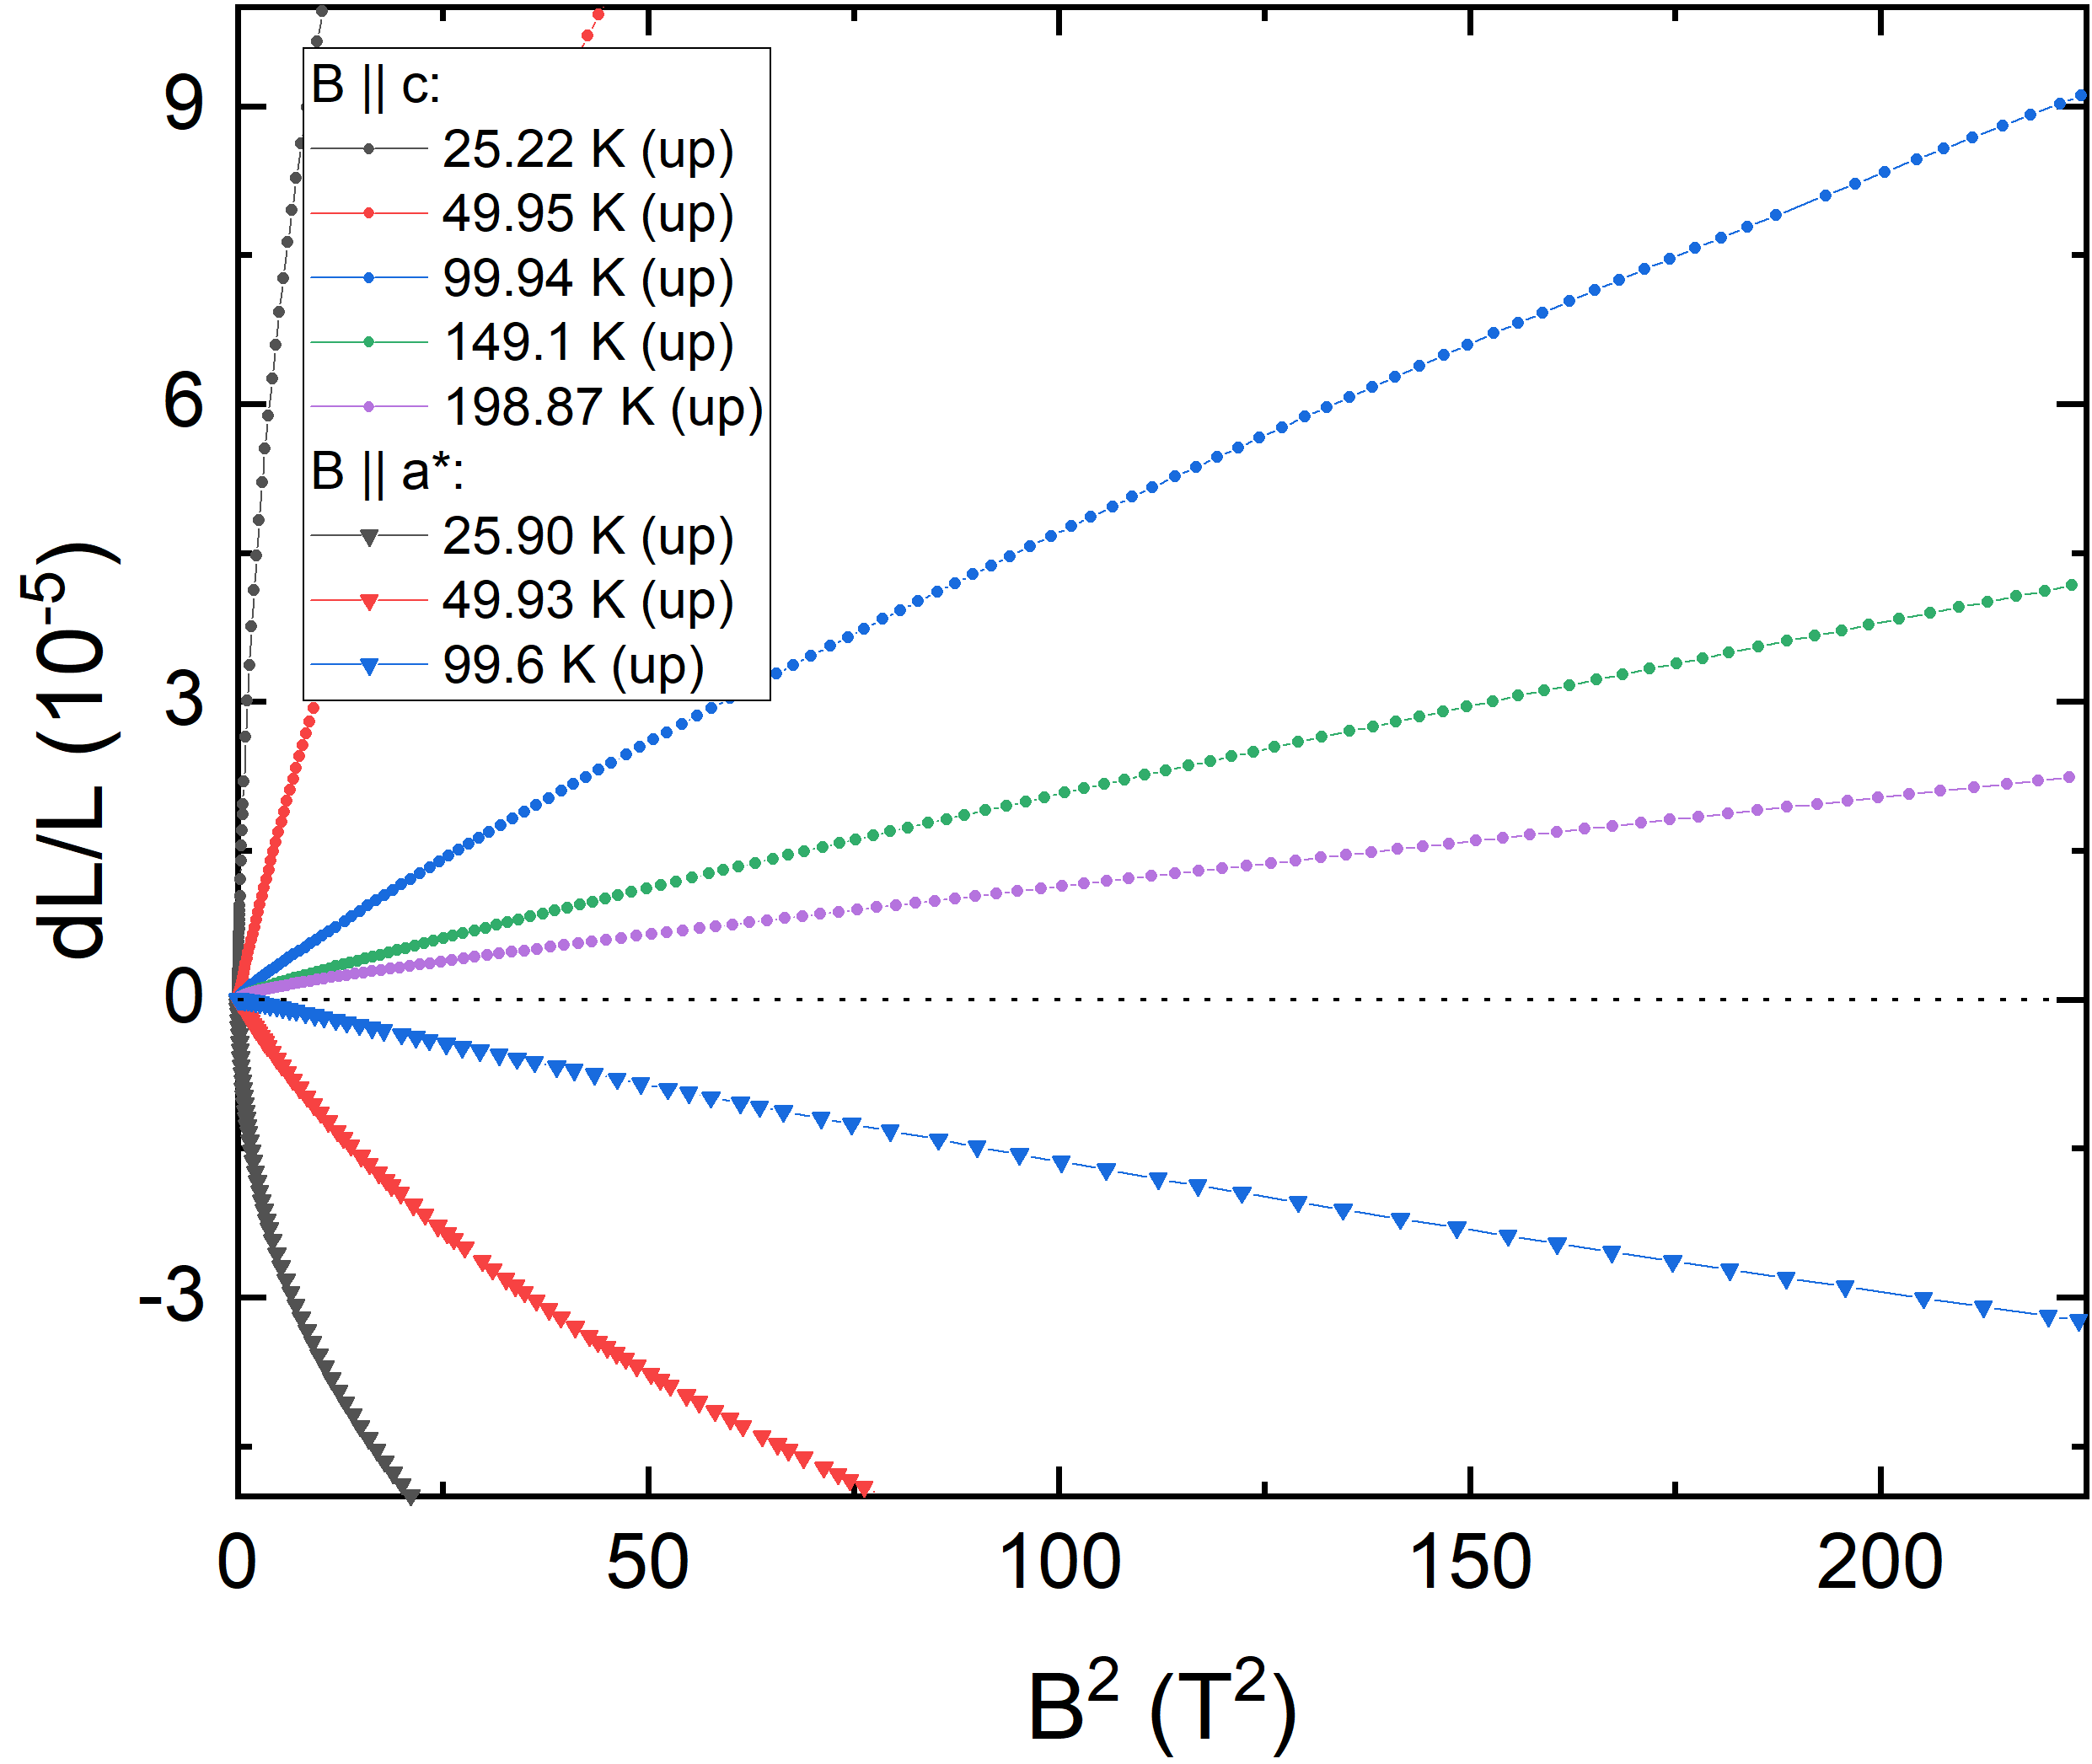
While Gd2PdSi3 shows only moderate frustration, magnetic entropy and length changes are observed up to about 2.7 (60 K), thereby implying the evolution of short range magnetic order in this temperature regime. Effects of fluctuations above in Gd2PdSi3 were observed before in resistivity measurements. Measurements on polycrystalline samples show a well-defined minimum around 45 K Mallik et al. (1998) which was also confirmed in single crystals Saha et al. (1999). A theoretical explanation of this behavior based on the RKKY-interaction in combination with frustration was given by Wang et al.Wang et al. (2016). Grüneisen scaling suggests that these precursor fluctuations are of the IC-1/IC-3 type. Both ordering phenomena are driven by the same dominating energy scale which differs from the one driving IC-1’. As expected for a Gd3+-system, magnetoelastic coupling is moderate. It is, hence, somehow surprising that magnetostriction is large at high temperatures and displays pronounced effects up to 200 K. In addition, despite linear field dependence of the magnetization, magnetostriction does not follow a -law below 200 K (see Fig. S6) as would be expected from the relation in the paramagnetic regime [Johannsen et al., 2005]. Tentatively, magnetostriction above 100 K implies negative uniaxial pressure dependence, , of the magnetic susceptibility while . This observation suggests that antiferromagnetic exchange interactions are strengthened by uniaxial pressure along the -axis and weakened upon application of *. Notably, however, the long-range magnetic ordering temperatures do not follow this trend as which further highlights the complex nature of magnetism in Gd2PdSi3.
V Conclusions
For the first time, high-resolution dilatometry was used to study the interplay between magnetism and the lattice of single crystalline Gd2PdSi3. Strong magnetoelastic coupling and field effects up to high temperatures are found. Pronounced anomalies in the thermal expansion, magnetostriction and magnetization allow us to obtain the magnetic phase diagram. This yields in particular several novel phases for while the B vs. T phase diagram for * has not yet been reported at all in the literature. Grüneisen analysis shows the onset of magnetic contributions well above , and the pressure dependencies of ordering phenomena are obtained. In particular, we find that uniaxial pressure strongly enhances the skyrmion lattice phase.
Acknowledgements
We thank I. Mazilu and Y. Xu for support in the crystal growth. We acknowledge financial support by BMBF via the project SpinFun (13XP5088) and by Deutsche Forschungsgemeinschaft (DFG) under Germany’s Excellence Strategy EXC2181/1-390900948 (the Heidelberg STRUCTURES Excellence Cluster), through project KL 1824/13-1, and within the SFB 463.
References
- Hoffmann and Pöttgen (2001) R.-D. Hoffmann and R. Pöttgen, Zeitschrift für Kristallographie - Crystalline Materials 216, 127 (2001), URL https://doi.org/10.1524/zkri.216.3.127.20327.
- Pan et al. (2013) Z.-Y. Pan, C.-D. Cao, X.-J. Bai, R.-B. Song, J.-B. Zheng, and L.-B. Duan, Chinese Physics B 22, 056102 (2013), URL https://doi.org/10.1088/1674-1056/22/5/056102.
- Majumdar and Sampathkumaran (2001) S. Majumdar and E. V. Sampathkumaran, Physical Review B 63, 172407 (2001), URL https://link.aps.org/doi/10.1103/PhysRevB.63.172407.
- Majumdar et al. (2000) S. Majumdar, E. V. Sampathkumaran, P. L. Paulose, H. Bitterlich, W. Löser, and G. Behr, Physical Review B 62, 14207 (2000).
- Majumdar et al. (2001) S. Majumdar, H. Bitterlich, G. Behr, W. Löser, P. L. Paulose, and E. V. Sampathkumaran, Physical Review B 64, 012418 (2001), URL https://link.aps.org/doi/10.1103/PhysRevB.64.012418.
- Paulose et al. (2003) P. L. Paulose, E. V. Sampathkumaran, H. Bitterlich, G. Behr, and W. Löser, Physical Review B 67, 212401 (2003), URL https://link.aps.org/doi/10.1103/PhysRevB.67.212401.
- Cao et al. (2010) C. D. Cao, R. Klingeler, H. Vinzelberg, N. Leps, W. Löser, G. Behr, F. Muranyi, V. Kataev, and B. Büchner, Physical Review B 82, 134446 (2010), URL https://link.aps.org/doi/10.1103/PhysRevB.82.134446.
- Kurumaji et al. (2019) T. Kurumaji, T. Nakajima, M. Hirschberger, A. Kikkawa, Y. Yamasaki, H. Sagayama, H. Nakao, Y. Taguchi, T. Arima, and Y. Tokura, Science 365, 914 (2019), ISSN 0036-8075, URL https://science.sciencemag.org/content/365/6456/914.
- Hirschberger et al. (2020a) M. Hirschberger, T. Nakajima, M. Kriener, T. Kurumaji, L. Spitz, S. Gao, A. Kikkawa, Y. Yamasaki, H. Sagayama, H. Nakao, et al., Physical Review B 101, 220401(R) (2020a), ISSN 24699969, eprint 2004.05385, URL https://doi.org/10.1103/PhysRevB.101.220401.
- Majumdar et al. (1999) S. Majumdar, M. Mahesh Kumar, R. Mallik, and E. Sampathkumaran, Solid State Communications 110, 509 (1999), ISSN 0038-1098, URL https://www.sciencedirect.com/science/article/pii/S0038109899001040.
- Saha et al. (2000) S. R. Saha, H. Sugawara, T. D. Matsuda, Y. Aoki, H. Sato, and E. V. Sampathkumaran, Physical Review B 62, 425 (2000), URL https://link.aps.org/doi/10.1103/PhysRevB.62.425.
- Majumdar et al. (2002) S. Majumdar, E. V. Sampathkumaran, S. Berger, M. Della Mea, H. Michor, E. Bauer, M. Brando, J. Hemberger, and A. Loidl, Solid State Communications 121, 665 (2002), ISSN 0038-1098, URL https://www.sciencedirect.com/science/article/pii/S0038109802000534.
- Kaczorowski and Noel (1993) D. Kaczorowski and H. Noel, Journal of Physics: Condensed Matter 5, 9185 (1993), URL https://doi.org/10.1088/0953-8984/5/49/020.
- Tien et al. (1997) C. Tien, L. Luo, and J. S. Hwang, Physical Review B 56, 11710 (1997), URL https://link.aps.org/doi/10.1103/PhysRevB.56.11710.
- Li et al. (1999) D. X. Li, A. Dönni, Y. Kimura, Y. Shiokawa, Y. Homma, Y. Haga, E. Yamamoto, T. Honma, and Y. Onuki, Journal of Physics: Condensed Matter 11, 8263 (1999), URL https://doi.org/10.1088/0953-8984/11/42/307.
- Li et al. (2003) D. X. Li, S. Nimori, Y. Shiokawa, Y. Haga, E. Yamamoto, and Y. Onuki, Physical Review B 68, 012413 (2003), URL https://link.aps.org/doi/10.1103/PhysRevB.68.012413.
- Saha et al. (1999) S. R. Saha, H. Sugawara, T. D. Matsuda, H. Sato, R. Mallik, and E. V. Sampathkumaran, Physical Review B 60, 12162 (1999), URL https://link.aps.org/doi/10.1103/PhysRevB.60.12162.
- Hirschberger et al. (2020b) M. Hirschberger, L. Spitz, T. Nomoto, T. Kurumaji, S. Gao, J. Masell, T. Nakajima, A. Kikkawa, Y. Yamasaki, H. Sagayama, et al., Physical Review Letters 125, 076602 (2020b), ISSN 10797114, eprint 1910.06027, URL https://doi.org/10.1103/PhysRevLett.125.076602.
- Szytuła et al. (1999) A. Szytuła, M. Hofmann, B. Penc, M. Ślaski, S. Majumdar, E. V. Sampathkumaran, and A. Zygmunt, Journal of Magnetism and Magnetic Materials 202, 365 (1999), ISSN 0304-8853, URL https://www.sciencedirect.com/science/article/pii/S0304885399004102.
- Tang et al. (2011) F. Tang, M. Frontzek, J. Dshemuchadse, T. Leisegang, M. Zschornak, R. Mietrach, J.-U. Hoffmann, W. Löser, S. Gemming, D. C. Meyer, et al., Physical Review B 84, 104105 (2011), URL https://link.aps.org/doi/10.1103/PhysRevB.84.104105.
- Tang et al. (2010) F. Tang, P. Link, M. Frontzek, A. Schneidewind, W. Löser, and M. Loewenhaupt, Journal of Physics: Conference Series 251, 012004 (2010), URL https://doi.org/10.1088/1742-6596/251/1/012004.
- Frontzek (2009) M. Frontzek, Ph.D. Thesis, Technische Universität Dresden (2009), URL https://nbn-resolving.org/urn:nbn:de:bsz:14-qucosa-24779.
- Smidman et al. (2019) M. Smidman, C. Ritter, D. T. Adroja, S. Rayaprol, T. Basu, E. V. Sampathkumaran, and A. D. Hillier, Physical Review B 100, 134423 (2019), URL https://link.aps.org/doi/10.1103/PhysRevB.100.134423.
- Mukherjee et al. (2011) K. Mukherjee, T. Basu, K. K. Iyer, and E. V. Sampathkumaran, Physical Review B 84, 184415 (2011), URL https://link.aps.org/doi/10.1103/PhysRevB.84.184415.
- Zhang et al. (2020) H. Zhang, Q. Huang, L. Hao, J. Yang, K. Noordhoek, S. Pandey, H. Zhou, and J. Liu, arXiv (2020), ISSN 23318422, eprint 2004.09664.
- FN (4) Here, = (300 K)-(2 K) and analogously.
- Mazilu (2006) I. Mazilu, Ph.D. Thesis, Technische Universität Darmstadt (2006).
- Xu et al. (2011) Y. Xu, M. Frontzek, I. Mazilu, W. Löser, G. Behr, B. Büchner, and L. Liu, Journal of Crystal Growth 318, 942 (2011), ISSN 00220248.
- Inosov et al. (2009) D. S. Inosov, D. V. Evtushinsky, A. Koitzsch, V. B. Zabolotnyy, S. V. Borisenko, A. A. Kordyuk, M. Frontzek, M. Loewenhaupt, W. Löser, I. Mazilu, et al., Physical Review Letters 102, 046401 (2009), ISSN 0031-9007, eprint 0808.2898, URL https://link.aps.org/doi/10.1103/PhysRevLett.102.046401.
- Küchler et al. (2012) R. Küchler, T. Bauer, M. Brando, and F. Steglich, Review of Scientific Instruments 83, 095102 (2012), eprint https://doi.org/10.1063/1.4748864, URL https://doi.org/10.1063/1.4748864.
- Werner et al. (2017) J. Werner, W. Hergett, M. Gertig, J. Park, C. Koo, and R. Klingeler, Physical Review B 95, 214414 (2017), URL https://link.aps.org/doi/10.1103/PhysRevB.95.214414.
- Cao et al. (2013) C. Cao, C. G. F. Blum, T. Ritschel, S. Rodan, L. Giebeler, D. Bombor, S. Wurmehl, and W. Löser, CrystEngComm 15, 9052 (2013), ISSN 14668033.
- Tari (2003) A. Tari, The Specific Heat of Matter at Low Temperatures (Published by Imperial College Press and distributed by World Scientific Publishing Co., 2003), eprint https://www.worldscientific.com/doi/pdf/10.1142/p254, URL https://www.worldscientific.com/doi/abs/10.1142/p254.
- Gegenwart (2016) P. Gegenwart, Rep. Prog. Phys. 79, 114502 (2016), URL https://iopscience.iop.org/article/10.1088/0034-4885/79/11/114502.
- Klingeler et al. (2006) R. Klingeler, J. Geck, S. Arumugam, N. Tristan, P. Reutler, B. Büchner, L. Pinsard-Gaudart, and A. Revcolevschi, Phys. Rev. B 73, 214432 (2006), URL https://link.aps.org/doi/10.1103/PhysRevB.73.214432.
- FN (1) The -scale for was shifted by +0.4 K to match the specific heat anomaly.
- Kalita et al. (2000) V. M. Kalita, A. F. Lozenko, and S. M. Ryabchenko, Low Temperature Physics 26, 489 (2000), eprint https://doi.org/10.1063/1.1306404, URL https://doi.org/10.1063/1.1306404.
- Kalita et al. (2002) V. M. Kalita, A. F. Lozenko, and P. A. Trotsenko, Low Temperature Physics 28, 263 (2002), eprint https://doi.org/10.1063/1.1477360, URL https://doi.org/10.1063/1.1477360.
- Dey et al. (2021) K. Dey, S. Sauerland, B. Ouladdiaf, K. Beauvois, H. Wadepohl, and R. Klingeler, Magneto-structural coupling in ilmenite-type \ceNiTiO3: a combined diffraction and dilatometry study (2021), eprint arxiv:2102.09417.
- (40) For the field-cooled warming protocol, the sample is cooled in the applied field to lowest temperatures and measured during the subsequent warming process.
- FN (2) Magnetization measurements have been performed following the zero-field cooling (ZFC) protocol unless stated otherwise, i.e., the sample was cooled to lowest temperatures before the field was applied and the data were recorded during warming.
- Hirschberger et al. (2019) M. Hirschberger, T. Nakajima, S. Gao, L. Peng, A. Kikkawa, T. Kurumaji, M. Kriener, Y. Yamasaki, H. Sagayama, H. Nakao, et al., Nature Communications 10, 1 (2019), ISSN 20411723, URL http://dx.doi.org/10.1038/s41467-019-13675-4.
- Barron and White (1999) T. H. K. Barron and G. K. White, Heat Capacity and Thermal Expansion at Low Temperatures, The International Cryogenic Monograph Series (Kluwer Academic / Plenum Publishers, 1999).
- Klingeler et al. (2005) R. Klingeler, B. Büchner, S.-W. Cheong, and M. Hücker, Physical Review B 72, 104424 (2005), URL https://link.aps.org/doi/10.1103/PhysRevB.72.104424.
- Bauer et al. (2013) A. Bauer, M. Garst, and C. Pfleiderer, Physical Review Letters 110, 177207 (2013), URL https://link.aps.org/doi/10.1103/PhysRevLett.110.177207.
- Levatić et al. (2016) I. Levatić, P. Popčević, V. Šurija, A. Kruchkov, H. Berger, A. Magrez, J. S. White, H. M. Rønnow, and I. Živković, Scientific reports 6, 21347 (2016), ISSN 2045-2322, URL https://pubmed.ncbi.nlm.nih.gov/26892190https://www.ncbi.nlm.nih.gov/pmc/articles/PMC4759555/.
- Chacon et al. (2015) A. Chacon, A. Bauer, T. Adams, F. Rucker, G. Brandl, R. Georgii, M. Garst, and C. Pfleiderer, Physical Review Letters 115, 267202 (2015), URL https://link.aps.org/doi/10.1103/PhysRevLett.115.267202.
- Nii et al. (2015) Y. Nii, T. Nakajima, A. Kikkawa, Y. Yamasaki, K. Ohishi, J. Suzuki, Y. Taguchi, T. Arima, Y. Tokura, and Y. Iwasa, Nature Communications 6, 8539 (2015), ISSN 2041-1723, URL https://doi.org/10.1038/ncomms9539.
- FN (3) For MnSi, this also holds for pressure along [111] and [110]. From our data, only uniaxial pressure effects are accessible so that a comparison for the other directions cannot be made.
- Hayami et al. (2016) S. Hayami, S.-Z. Lin, and C. D. Batista, Physical Review B 93, 184413 (2016), URL https://link.aps.org/doi/10.1103/PhysRevB.93.184413.
- Mallik et al. (1998) R. Mallik, E. V. Sampathkumaran, M. Strecker, and G. Wortmann, Europhysics Letters 41, 315 (1998), ISSN 02955075.
- Wang et al. (2016) Z. Wang, K. Barros, G.-W. Chern, D. L. Maslov, and C. D. Batista, Physical Review Letters 117, 206601 (2016), URL https://link.aps.org/doi/10.1103/PhysRevLett.117.206601.
- Johannsen et al. (2005) N. Johannsen, A. Vasiliev, A. Oosawa, H. Tanaka, and T. Lorenz, Physical Review Letters 95, 017205 (2005), URL https://link.aps.org/doi/10.1103/PhysRevLett.95.017205.
Supplementary Material:
Magnetoelastic Coupling and Phases in the Skyrmion Lattice Magnet \ceGd2PdSi3 Discovered by High-resolution Dilatometry
| IC-1/IC-1’ A(SkL) – -axis: Relevant quantities, entropy changes and uniaxial pressure dependencies | |||||||
| T (K) | Bc (T) | (10-6) | (/Gd) | (T/K) | (mJ/mol K) | (K/GPa) | (T/GPa) |
| 1.77 | 0.520.02 | –7.30.8 | 1.000.10 | –0.01135 | 12613 | –4.10.6 | –0.0460.007 |
| 4.3 | 0.490.02 | –10.81.1 | 0.990.10 | –0.01133 | 12513 | –6.10.9 | –0.0690.010 |
| 5.01 | 0.480.02 | –8.90.9 | 0.990.10 | –0.01151 | 12713 | –4.90.7 | –0.0560.008 |
| 7.94 | 0.450.02 | –8.40.9 | 0.950.10 | –0.01318 | 14014 | –4.20.6 | –0.0560.008 |
| 9.83 | 0.420.02 | –8.70.9 | 0.810.08 | –0.01499 | 13514 | –4.60.7 | – 0.0680.010 |
| 9.99 | 0.420.02 | –7.20.8 | 0.810.08 | –0.01516 | 13714 | –3.70.6 | –0.0560.008 |
| 12.02 | 0.380.02 | –7.00.7 | 0.750.08 | –0.01783 | 14915 | –3.30.5 | –0.0590.009 |
| 14.35 | 0.340.02 | –4.50.5 | 0.520.05 | –0.02260 | 13114 | –2.40.4 | –0.0550.008 |
| 16 | 0.300.02 | –2.40.3 | 0.400.04 | –0.02505 | 11011 | –1.50.2 | –0.0380.006 |
| IC-3 IC-2 – -axis: Relevant quantities, entropy changes and uniaxial pressure dependencies | |||||||
| 18.39 | 0.300.04 | –92 | 0.240.03 | –0.1 | 27040 | –2.30.6 | –0.230.06 |
| 20.27 | 0.230.04 | –3.80.4 | 0.210.05 | -0.04 | 9430 | –2.90.8 | –0.120.03 |
| A(SkL) IC-2 – -axis: Relevant quantities, entropy changes and uniaxial pressure dependencies | |||||||
| T (K) | Bc (T) | (10-6) | (/Gd) | (T/K) | (mJ/mol K) | (K/GPa) | (T/GPa) |
| 1.77 | 1.110.03 | 0 | 0.950.10 | –0.028 | 30030 | 0 | 0 |
| 4.3 | 1.040.03 | –2.40.3 | 1.010.11 | –0.031 | 36040 | –0.470.07 | –0.0150.002 |
| 5.01 | 1.010.02 | –1.40.2 | 1.000.10 | –0.033 | 37040 | –0.270.04 | –0.0090.002 |
| 7.94 | 0.910.02 | –2.50.3 | 0.990.10 | –0.041 | 45050 | –0.400.06 | –0.0160.003 |
| 9.83 | 0.820.02 | –5.10.5 | 0.980.10 | –0.048 | 52060 | –0.690.10 | –0.0330.005 |
| 9.99 | 0.820.02 | –2.90.3 | 0.980.10 | –0.048 | 53060 | –0.390.06 | –0.0190.003 |
| 12.02 | 0.70.02 | –5.90.6 | 0.930.10 | –0.057 | 59060 | –0.700.10 | –0.0400.006 |
| 14.35 | 0.560.02 | –5.90.6 | 0.750.08 | –0.069 | 58060 | –0.720.11 | –0.0500.007 |
| 16 | 0.450.02 | –4.00.4 | 0.660.07 | –0.079 | 58060 | –0.490.07 | –0.0390.006 |
| 18.39 | 0.230.02 | -0.095 | |||||
| A(SkL) IC-2 – -axis: Relevant quantities, entropy changes and uniaxial pressure dependencies | ||||||
|---|---|---|---|---|---|---|
| (T) | (K) | (dL/L) (10-6) | (/Gd) | (K/T) | Scalc (mJ/mol K) | (K/GPa) |
| 0 | 19.70.5 | no SkL | ||||
| 0.1 | 19.30.3 | no SkL | –4.8 | |||
| 0.2 | 18.80.5 | no SkL | –8.1 | |||
| 0.3 | 17.90.7 | no SkL | –10.8 | |||
| 0.4 | 16.40.4 | –5.01.0 | 0.360.04 | –13.0 | 31040 | –1.20.3 |
| 0.5 | 15.30.4 | –7.41.0 | 0.540.04 | –14.8 | 41040 | –1.30.2 |
| 0.6 | 13.60.3 | –7.00.7 | 0.700.04 | –16.0 | 49030 | –1.020.12 |
| 0.7 | 12.00.3 | –5.10.5 | 0.770.04 | –16.7 | 51030 | –0.700.08 |
| 0.8 | 10.40.3 | –2.70.3 | 0.860.04 | –17.0 | 56030 | –0.340.04 |
| 0.9 | 8.600.3 | –1.30.1 | 0.910.04 | –16.7 | 61030 | –0.150.02 |
| IC-2 DP – -axis: Relevant quantities, entropy changes and uniaxial pressure dependencies | |||||||
|---|---|---|---|---|---|---|---|
| T (K) | Bc (T) | (10-6) | (/Gd) | (T/K) | (mJ/mol K) | (K/GPa) | (T/GPa) |
| 1.77 | 3.510.05 | –17.11.7 | 0.080.03 | –0.040.04 | 1616 | –8080 | –1.40.6 |
| 4.3 | 3.440.05 | –12.22 | 0.080.04 | –0.0140.014 | 77 | –130130 | –0.90.4 |
| 5.01 | 3.440.10 | –11.80.4 | 0.070.03 | –0.0080.008 | 33 | –250250 | –1.00.6 |
| 7.94 | 3.450.15 | –63 | 0.0440.018 | 0.0180.009 | -43 | 10080 | -0.90.6 |
| IC-2 fiFM – -axis: Relevant quantities, entropy changes and uniaxial pressure dependencies | ||||
|---|---|---|---|---|
| T (K) | Bc (T) | (10-6/T) | (/(T Gd)) | (T/GPa) |
| 9.99 | 3.70.1 | 152 | –0.150.03 | -0.70.2 |
| 12.02 | 3.00.1 | 172 | –0.190.03 | -0.60.2 |
| 14.35 | 2.30.1 | 192 | –0.250.03 | -0.50.1 |
| DP fiFM – -axis: Relevant quantities, entropy changes and uniaxial pressure dependencies | ||||
|---|---|---|---|---|
| T (K) | Bc (T) | (10-5/T) | (/(T Gd)) | (T/GPa) |
| 1.77 | 8.80.5 | –4.71.0 | –0.1590.018 | 1.90.5 |
| 4.3 | 7.940.4 | –1.91.0 | –0.0940.009 | 1.30.7 |
| 5.01 | 6.60.4 | –1.41.0 | –0.0740.018 | 1.20.9 |
| 7.94 | 6.480.6 | –0.70.4 | –0.0650.018 | 0.60.4 |
| IC-1 IC-1’ – -axis | ||||||
|---|---|---|---|---|---|---|
| B | Tc | |||||
| (T) | (K) | (10-6) | (J/mol K) | (10/f.u. K) | (K/GPa) | (K/T) |
| 0 | 12.80.7 | 4.10.5 | –2.70.5 | –1.40.3 | ||
| 0.2 | 12.150.5 | 2.70.4 | –1.80.4 | –5.61.4 | –1.30.4 | –0.0370.013 |
| 0.25 | 11.450.5 | –114 | ||||
| 0.3 | 10.60.5 | 0.90.3 | –0.60.3 | –166 | –1.10.7 | –0.280.18 |
| 0.35 | 8.40.5 | –207 | ||||