Exceptional field dependence of antiferromagnetic magnons in LiFePO4
Abstract
Low-energy magnon excitations in magnetoelectric LiFePO4 have been investigated by high-frequency high-field electron spin resonance spectroscopy in magnetic fields up to T and frequencies up to GHz. For magnetic fields applied along the easy magnetic axis, the excitation gap softens and vanishes at the spin-flop field of T before hardening again at higher fields. In addition, for we observe a resonance mode assigned to excitations due to Dzyaloshinskii-Moriya (DM)-interactions, thereby evidencing sizable DM interaction of eV in LiFePO4. Both the magnetisation and the excitations up to high magnetic fields are described in terms of a mean-field theory model which extends recent zero field inelastic neutron scattering results. Our results imply that magnetic interactions as well as magnetic anisotropy have a sizeable quadratic field dependence which we attribute to significant magnetostriction.
I Introduction
There is a variety of experimental techniques to probe and elucidate spin dynamics in magnetically ordered materials, among them inelastic neutron scattering (INS), resonant inelastic X-ray scattering (RIXS), Raman- and terahertz spectroscopy, or high-frequency electron spin resonance spectroscopy (HF-ESR). While probing the same low-temperature magnetic excitations aiming at establishing the magnetic Hamiltonian for a material, the experiments are complementing each other as, e.g., different sample size, resolution, energy and reciprocal space regimes, or magnetic fields are accessible. One illustrative example is BiFeO3 where INS Jeong et al. (2012); Matsuda et al. (2012); Xu et al. (2012), terahertz-spectroscopy Talbayev et al. (2011); Nagel et al. (2013); Fishman et al. (2015), HF-ESR Ruette et al. (2004) and Raman Cazayous et al. (2008); Rovillain et al. (2010) data have lead to a conclusive view and established the microscopic spin Hamiltonian. Our current work on LiFePO4 highlights not only the strength of antiferromagnetic resonance (AFMR) studies to probe low-energy magnetic excitations but also illustrates how microscopic parameters can change upon application of high magnetic fields, e.g., by magnetostrictive effects.
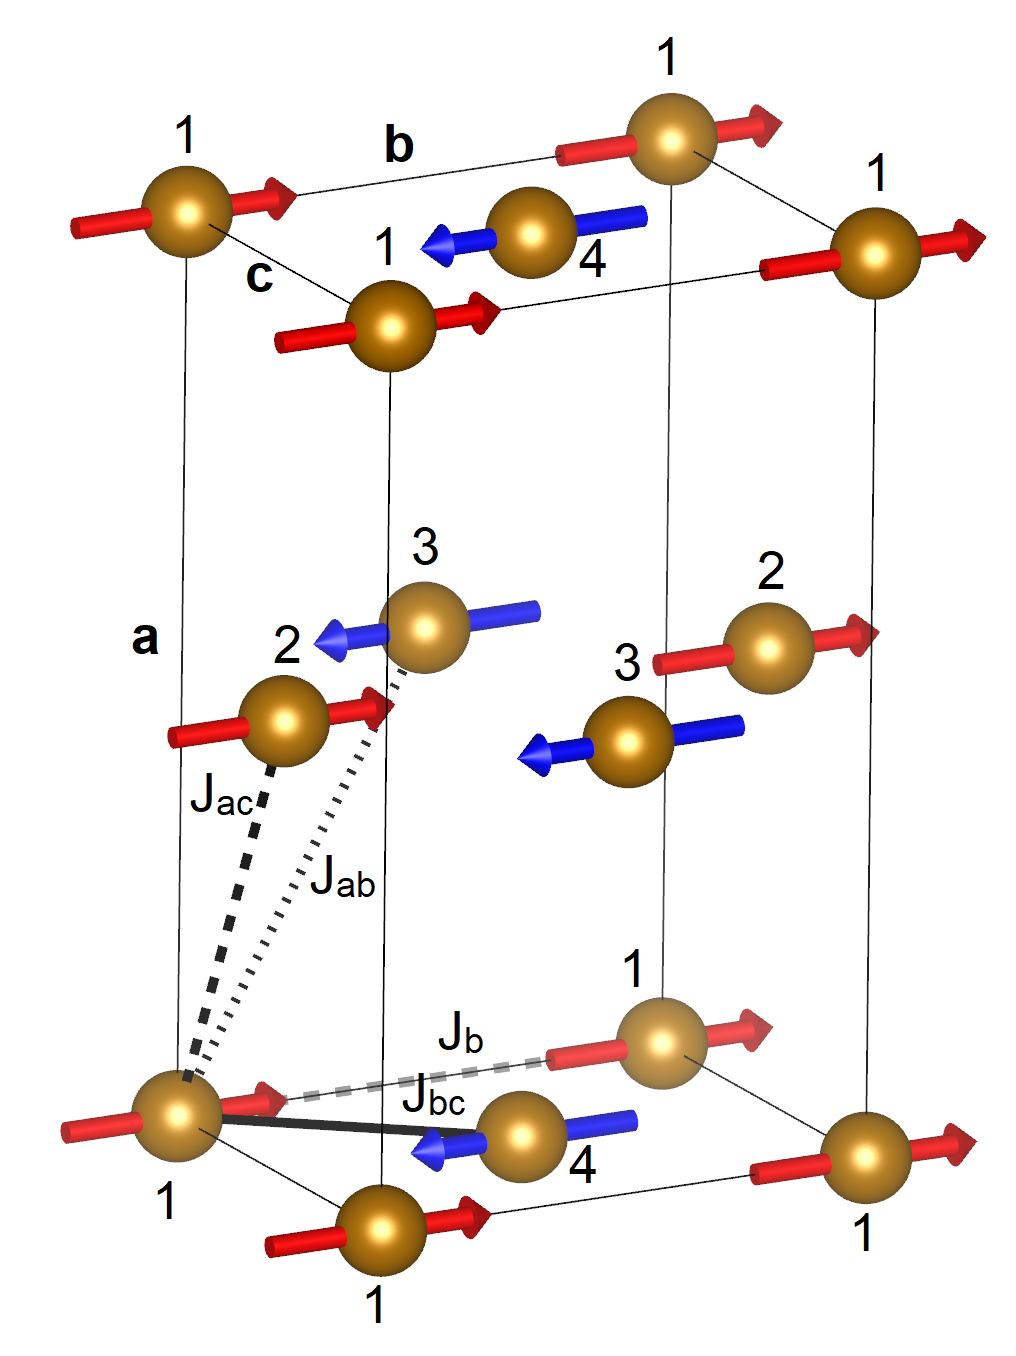
Due to intriguing magnetoelectric properties Zimmermann et al. (2009); Rivera (1994); Van Aken et al. (2008, 2007); Vaknin et al. (2004); Toft-Petersen et al. (2015), spin excitations in olivine-type lithium orthophosphates LiPO4 ( = Mn, Fe, Co, Ni) have been measured by various experiments. While for LiMnPO4 and LiNiPO4, complementing investigations by INS, THz- and Raman-spectroscopy enabled to establishing microscopic spin models, for LiCoPO4 and LiFePO4 comprehensive models are, however, still missing. Among the above mentioned olivine-type phosphates, LiMnPO4 shows the smallest magnetocrystalline anisotropy as probed by ESR in the paramagnetic phase and around the antiferromagnetic (AFM) ordering temperature Arčon et al. (2004). Inelastic neutron scattering revealed accordingly small magnon excitation gaps of GHz and GHz in the ordered phase Li et al. (2009a). Raman data corroborated a microscopic spin model which together with INS results led to a robust set of magnetic parameters Calderon Filho et al. (2015). A similar picture evolves for LiNiPO4 from Raman and INS data where low energy spin excitation gaps of GHz and THz were found Fomin et al. (2002); Jensen et al. (2009); Toft-Petersen et al. (2011); Li et al. (2009b). Infrared absorption spectroscopy confirm the INS results Peedu et al. (2019) and recent Raman scattering results provide an independent experimental confirmation of previously obtained exchange parametersRigitano et al. (2020). In contrast, a conclusive model for LiCoPO4 is still under debate which might be due to the strong magnetoelectric effect in this material Rivera (1994). Spin excitations in LiCoPO4 have been studied extensively both by INS Vaknin et al. (2002); Tian et al. (2008, 2010) and infrared-absorption spectroscopy Kocsis et al. (2019, 2018). It was revealed that the excitation gaps in the center of the Brillouin zone are THz and THz. Here, we report on LiFePO4 where previous investigations of low energy spin excitations have been performed by Raman spectroscopy Paraguassu et al. (2005) and INS Li et al. (2006); Yiu et al. (2017); Toft-Petersen et al. (2015). The zero-field spin configuration based on Refs. Toft-Petersen et al., 2015 and Yiu et al., 2017 is shown in Fig. 1. While the magnetic moments are pointing mainly along the crystallographic -axis, there is also a small canting which indicates the presence of Dzyaloshinsky-Moriya interaction Toft-Petersen et al. (2015). The INS reports agree that the relevant exchange interactions are all antiferromagnetic and that the dominant interaction is (see Fig. 1) but the exact values differ significantly. 111Note, that does not significantly affect the AFMR model at and hence is omitted in the Hamiltonian Eq. 1. Furthermore, the INS results can not explain the static magnetic properties in magnetic fields at low-temperature, as a spin-flop-like transition at T is not reproduced by the INS model.
To clarify these issues and to investigate the spin-flop transition in more detail we performed high-frequency/high-field electron spin resonance spectroscopy (HF-ESR) studies on LiFePO4. Our study reveals the presence of low-energy magnon modes around the spin-flop field. Both the softening of these magnon modes towards and the magnetisation are described by means of a mean-field theory model which, while based on the INS model, employs field dependent values of magnetic interaction and magnetic anisotropy. In addition, we find direct evidence for finite DM interactions. The estimated size of the DM interaction is eV. Measurements at higher temperatures reveal the disappearance of the resonances already well below the antiferromagnetic ordering temperature.
II Experimental
Single crystals of LiFePO4 were grown by the high-pressure optical floating-zone method as reported in detail in Ref. [Neef et al., 2017]. High-frequency electron spin resonance spectroscopy (HF-ESR) experiments in pulsed fields up to 50 T and magnetization studies up to 58 T were performed at the Dresden High Magnetic Field Laboratory (HLD). The HF-ESR data were obtained using VDI modular transmitters (product of Virginia Diodes Inc., USA) as sub-mm radiation sources and InSb hot-electron bolometer as a radiation detector. The experiments have been performed at frequencies between 65 and 1100 GHz. However, at 750 GHz 1100 GHz, there is strong magnetic field-independent microwave absorption, possibly due to non-magnetic excitation, which does not allow to obtain reliable data in this frequency regime. Magnetization studies employed a coaxial pick-up coil system; the magnetization data were calibrated using data, obtained in static fields at 5 T (see Ref. [Werner et al., 2019]).
III Results
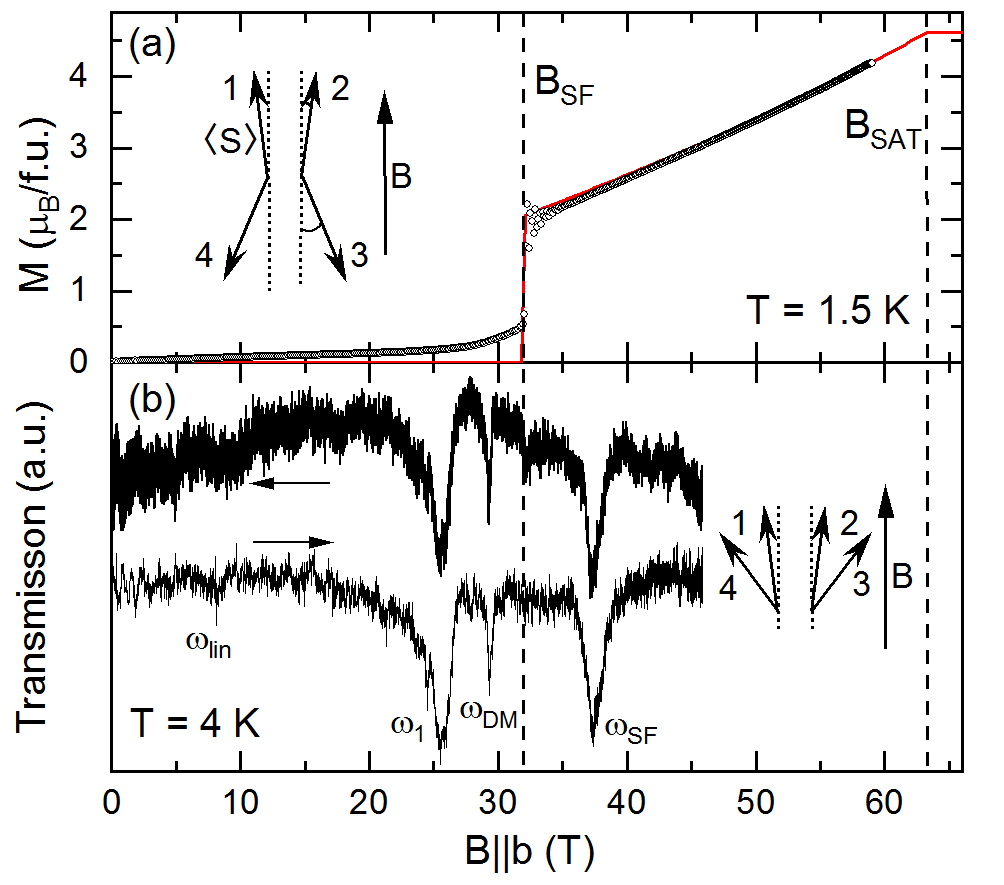
Long-range antiferromagnetic order in LiFePO4 single crystals studied at hand Neef et al. (2017) evolves at = 50.0(5) K with the crystallographic -axis being the magnetic easy axis. Magnetic fields applied along the magnetic easy axis of LiFePO4 leads to a jump in magnetization at around T and a rather linear behavior above the metamagnetic transition, see Fig. 2a. While this behavior strongly reminds on a typical spin-reorientation transition, extrapolating of the high-field magnetization to zero field does not yield the origin of the graph but gives a finite field value which shows that it is not an ordinary spin-flop transition. To investigate this transition in more detail in particular in the dynamic regime, we measured low-energy spin excitations in this magnetic field range. One of the HF-ESR transmission spectra, measured at K and a frequency of GHz, is shown in Fig. 2b. The spectrum features four absorption peaks. The two most prominent resonances and at T and T are almost symmetric to the spin-flop transition and show similar intensity. An additional sharp but less intense resonance is observed slightly below the spin-flop field at T. The fourth peak appears at T. It shows only weak intensity and belongs to a linear-in-field resonance branch which has an extrapolated zero-field gap of GHz and an effective -value of . By removing a thin surface layer of the sample the relative intensity of this resonance as compared to the other ones weakens significantly which indicates that it is associated with surface defects.
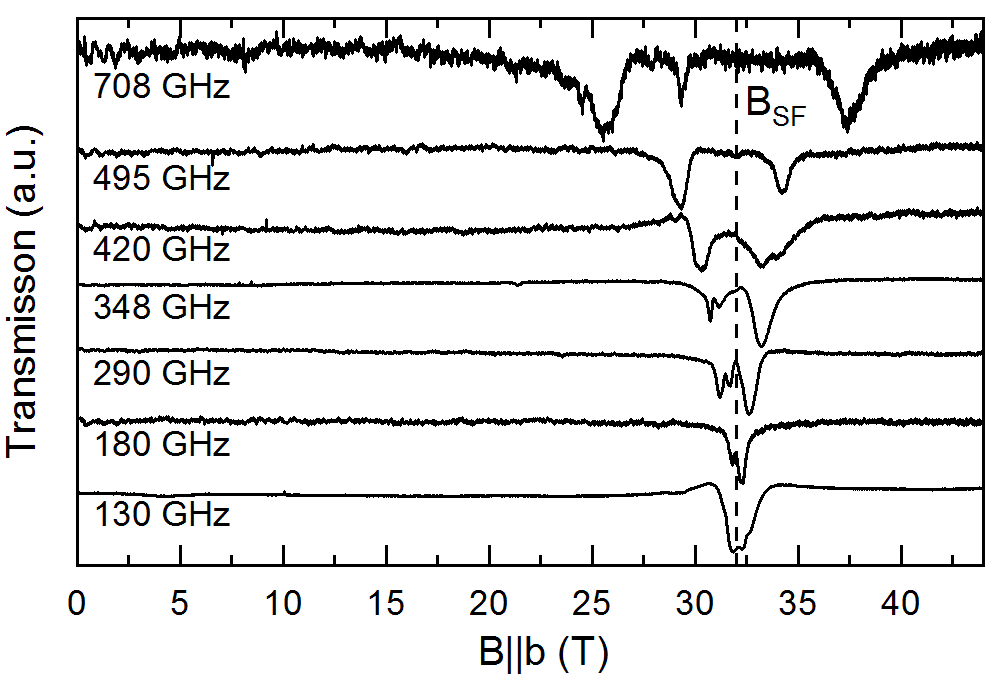
From inelastic neutron scattering it is known that the magnon excitation gaps at zero field in the Brillouin zone center amount to GHz and GHz Li et al. (2006); Toft-Petersen et al. (2015); Yiu et al. (2017). The fact that we observe resonances at GHz as shown in Fig. 2b hence already implies the presence of a resonance branch which is softened by fields -axis. Further progression of softening can be seen in Fig. 3 where the evolution of the resonances at lower frequencies is presented. The data show that splitting of the two main resonance features and shrinks with decreasing frequency and both peaks merge at lowest frequencies under study. At GHz, only one resonance at the position of the spin-flop field is observed, which indicates complete closing of the excitation gap, i.e., complete softening of the resonance branch. This behaviour is typical for a spin-flop transition which evolves when the external magnetic field compensates the effective field acting on the magnetic sublattice pointing in the direction opposite to the external magnetic field. In addition to softening and merging of the split resonances and , the data show that the resonance completely vanishes with decreasing frequency and cannot be observed below GHz.
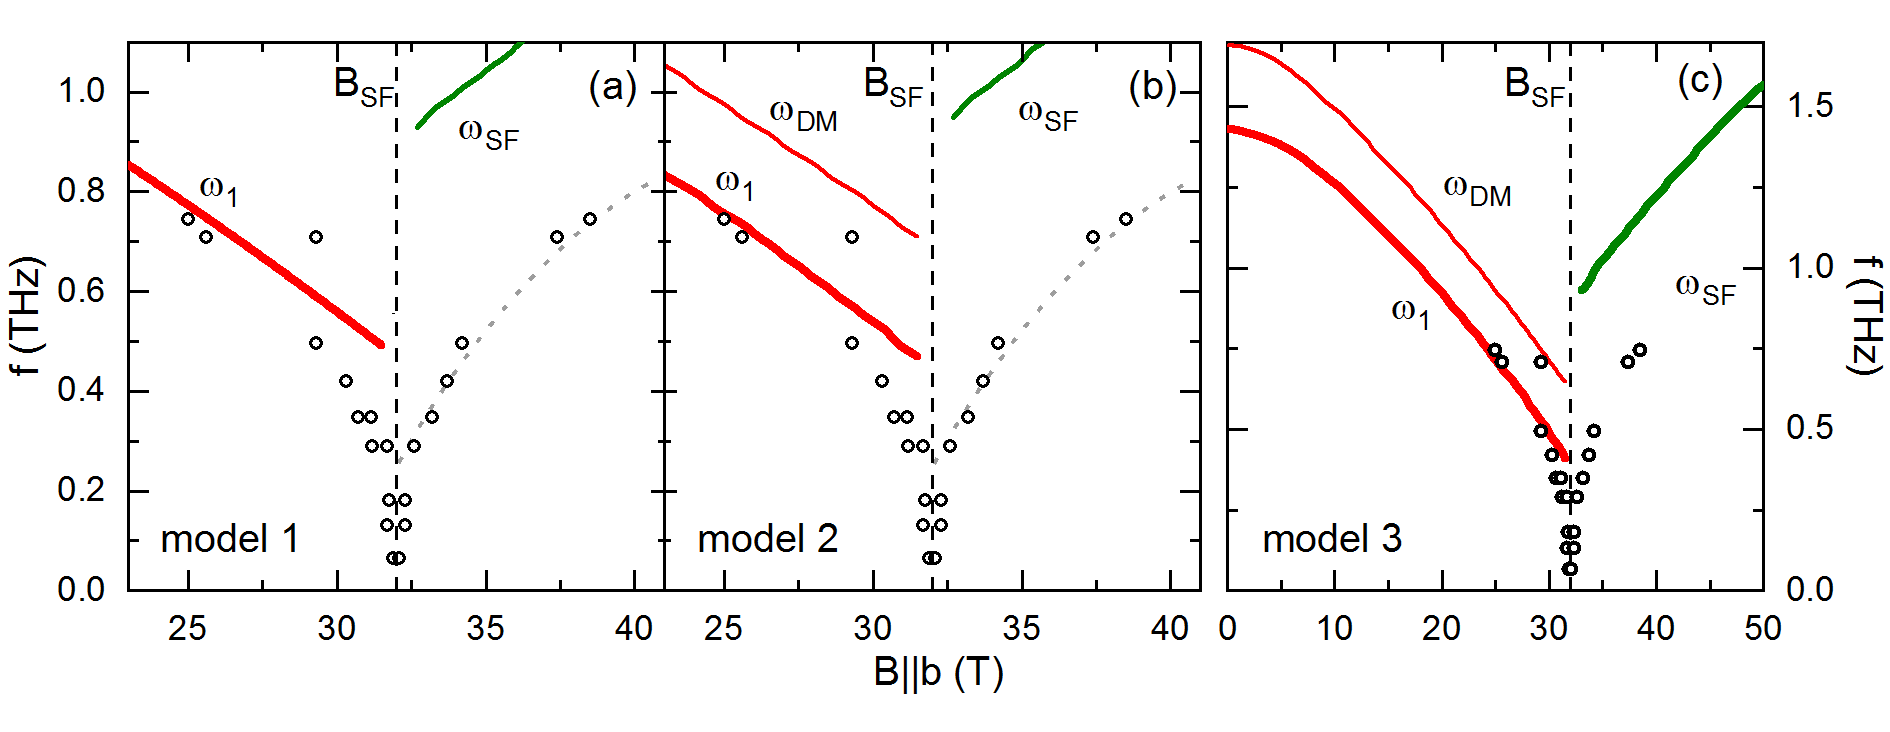
Collecting the resonance fields in a field vs. frequency plot (see Fig. 4) evidences that the magnon gaps not only close but the resonance branches and exhibit a pronounced curvature when approaching . In general, softening of the gaped antiferromagnetic resonance (AFMR) modes is expected but the very strong suppression of the resonance branch is by far not covered by AFMR models Nagamiya (1951, 1954) with fixed zero-field splittings , and spin-flop field . We recall the large size of as compared to . Specifically, the standard AFMR model would result in the effective -factor of which is unreasonably large and does not match to obtained from analysis of high-temperature magnetic susceptibility data Werner et al. (2019). Hence, one has to conclude that parameters obtained at zero magnetic field, i.e., single-ion anisotropy and exchange interaction , do not describe the experimental results obtained at high magnetic field. The presence of pronounced magnetoelastic effects and associated strong magnetostrictive length changes in LiFePO4 Werner et al. (2019) however already suggests that microscopic parameters are supposed to be magnetic field dependent. We attribute the apparent failure of the zero-field parameter-based model to field dependence of microscopic parameters and will present an appropriate model in the following.
The spin Hamiltonian presented below extends the one used to describe recent INS data Toft-Petersen et al. (2015) by magnetic fields applied along the -direction and magnetic field dependent exchange interaction and anisotropy parameters. Specifically, a four magnetic sublattice model is assumed, as indicated in Fig. 1. The sublattices are coupled via the exchange interactions , and . Note, that does not significantly affect the results at and hence is omitted in the Hamiltonian Eq. 1. Interactions along the crystallographic directions are neglected in our model, because these interactions couple one sublattice to itself. In addition to the exchange interactions we add an orthorhombic anisotropy term as well as Dzyaloshinskii–Moriya (DM) interaction between the sublattices 1-2 and 3-4. As a minimal model to describe the field dependence, for the exchange interactions and the single-ion anisotropy we assume a quadratic magnetic field dependence of the form and . The Hamiltonian for one unit cell hence reads:
| (1) |
Here, , is the -th component of the sublattice spin (j = 1…4), and is the DM interaction. 222 is the thermal average of the spin, so that the magnetisation reads . The value of the -factor is fixed to as determined from the high-temperature magnetic susceptibility Werner et al. (2019). To obtain the magnetization along the -direction, firstly the spin structure is determined by numerically minimizing the Hamiltonian 1 and then the components of the spins in -direction are calculated. The undetermined parameters in this Hamiltonian are the magnetic field dependencies , and the strength of the DM interaction . The best fitting results for these free parameters to describe the experimental magnetisation data (see Fig. 2) are T-2, T-2, and for the DM interaction an upper boundary of meV is obtained. Note, that including further terms to the Hamiltonian Eq. (1) or/and assuming higher order terms in the field dependencies of the microscopic parameters will yield quantitative changes while the qualitative scenario of remains robust. Even better fittings can be obtained if a stronger magnetic field dependence, T-2 and T-2, for and are assumed. 333The resulting field dependencies quantitatively depend on the actual microscopic parameters at T which are taken from Ref. Toft-Petersen et al. (2015). However such a strong magnetic field dependence would lead to a change of the easy axis at high fields which is not indicated by the data. We hence restricted the parameter range to small changes of and with magnetic fields while excluding strong changes of spin orientation and spin structure. It should be noted, that small DM interactions do not change the spin configuration of the lower-field phase . While DM interactions tempt to cant spins of sublattices 1 and 2 with respect to each other, the presence of large anisotropy suppresses canting. In contrast, dynamic response is changed drastically by DM interactions as additional resonances appear.
To simulate the excitations of Hamiltonian 1, the Landau–Lifshitz–Gilbert equation (the spin equation of motion)
| (2) |
is solved Hillebrands and Ounadjela (2003). It includes the gyromagnetic factor and the effective magnetic fields acting on the spins of the -th sublattice. The effective field is composed of the static mean-field and the microwave field. Damping is considered by the parameter . For the calculations, we chose sufficiently large to solve the differential equation, but small enough to leave the position of the resonances unchanged within the resolution of the simulation. To match our experiment, the equation of motion (Eq. 2) is solved for unpolarized microwaves in Faraday-geometry. To generate the resonance field vs. frequency diagram, constant frequency cuts are generated and the maxima in absorption are taken as resonance points which reflects the experimental field sweeps.
| Model 1 | Model 2 | Model 3 | |
|---|---|---|---|
| 1.56 | 1.56 | ||
| 0 | 0.15 | 0.15 |
A simulation of the system, with the best fit parameters of the magnetization measurement and neglecting DM interactions (model 1 in Table 1) yields the resonance branches, and , shown in Fig. 4a. While the simulation describes the resonance branch below well, it fails to reproduce its behavior in the direct vicinity of the critical field. It also completely misses the presence of the resonance and fails to reproduce the resonance branch . Note, that gaps of the resonance branches around are due to sizable mean-fields, which are mainly caused by the fact that the magnetocrystalline anisotropy is large compared to the exchange interactions. In particular, the experimentally observed absence of excitation gaps at is inconsistent with the spin Hamiltonian parameters determined from INS at zero magnetic field. In order to cover the resonance by the model, DM interaction is introduced, which has been previously suggested to be of finite but small size in zero magnetic field and was hence neglected in the simulation of the spin dynamics probed by INS Toft-Petersen et al. (2015); Yiu et al. (2017). The best simulation, which takes into account the position of as well as the ratio of intensities of and is achieved by meV (see Table 1 model 2). As shown in Fig. 4b, considering the DM term indeed yields both the resonance branches and . Similar to model 1, the simulated results however differ from the experimental data in the vicinity of . In the flopped phase no additional resonance is observed, however the resonance branch is slightly shifted to higher energies as compared to model 1.
In order to further improve the model by employing field dependent microscopic parameters, we introduce magnetic field dependence of (see Table 1 model 3). Magnetic field -dependence of with does not change the simulated magnetisation shown in 2, because for small DM interactions and the spins are confined to the ab-plane. In addition, also and are only affected insignificantly for fields well below . While, there are clear changes around the spin-flop transition leading a good description of the modes in this field range, too. We obtain the magnetic field dependence T-2 of which was derived by restricting for all magnetic fields.
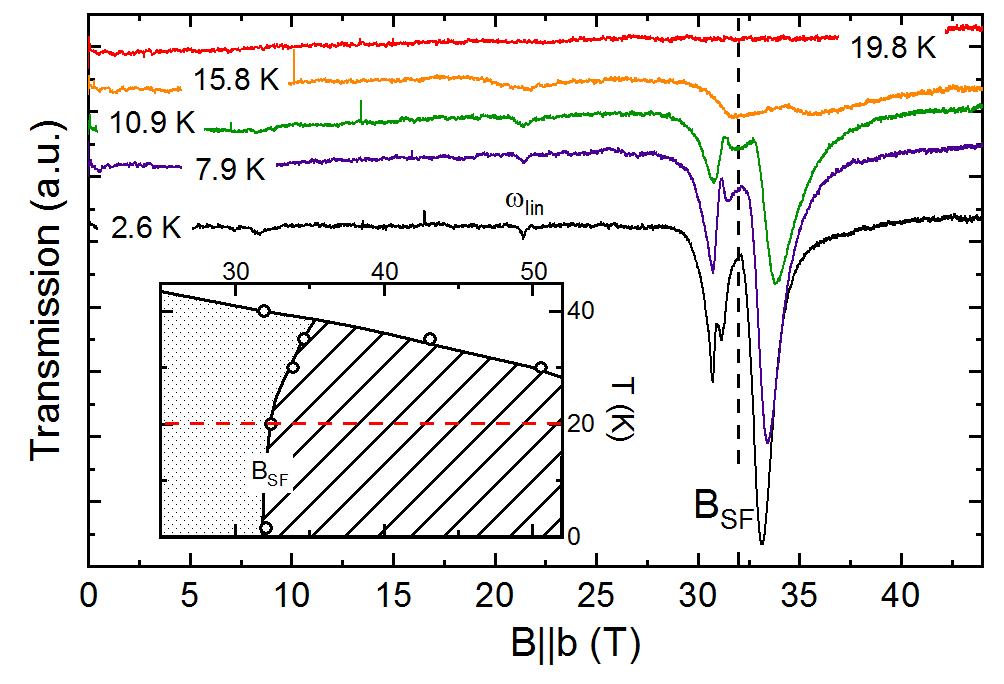
Transmission spectra at a fixed frequency, presented in Fig. 5, show the dependence of the resonances discussed above upon increasing the temperature. At K the resonances and are visible. The resonance shows an additional splitting at this temperature. With increasing temperature the intensity of the peaks diminishes. While the position and half width of do not significantly change upon heating, the resonance shifts with temperature to higher fields and broadens significantly. At K the resonance has completely vanished while remains as a broad feature similar to a feature at . At K, no resonance is observed up to T.
IV Discussion
The experimental data are well described by the used models for magnetic field . In particular, the presence of sizable DM interaction is evidenced by the presence of . Introducing magnetic field-dependent parameters yields an excellent description of the field dependence of AFMR modes and resolves the quantitative contradiction between zero-field gap as detected by INS and the actual value of . To be specific, the extended model shown in Fig. 4 reproduces both the experimentally observed and resonance features and the bending on the former when approaching . The field-dependence of microscopic parameters is motivated by the presence of pronounced magnetostrictive effects in LiFePO4 Werner et al. (2019). While the presence of DM interaction was suggested recently, it has neither been directly evidenced experimentally yet nor quantified in the dynamic response probed by INS Toft-Petersen et al. (2015); Yiu et al. (2017). Analysis of our high-field ESR data yields eV. Note, that this value can not straightforwardly extrapolated to zero magnetic field as our analysis implies the above mentioned field dependence of spin Hamiltonian parameters. In contrast to excellent description of the AFMR modes below , all applied models fail to quantitatively reproduce the observed resonances above . One may speculate that the spin structure in the high-field phase is not a purely reoriented one but further differs from the ground state. In addition, the spin-flop transition might be accompanied by structural distortions. Such distortions could change the anisotropy or the exchange interactions not in the continuous manner, assumed here, but rather abruptly. This is somehow corroborated by the fact that the spectra presented in Fig. 5 indeed show that the resonances below and above are clearly different regarding the spectral weight. In addition, while, at GHz, does not shift upon heating, there is a clear temperature dependence of which shifts to higher fields. This suggests a decrease of internal fields upon heating while for constant internal mean-fields are evidenced. Notably, in contrast to our experimental findings, conventional mean-field theory would suggest a shift of to lower fields upon heating Nagamiya (1954). We also note that rather large modulations of exchange interactions or anisotropy at phase boundaries and resulting changes in the magnon spectra have been previously observed by HF-ESR in other compounds, e.g. in HgCr2O4Kimura et al. (2011a), CuFeO2 Kimura et al. (2011b), CdCr2O4 Kimura et al. (2015), or Cu(pz)2(ClO4)2 Povarov et al. (2013).
The disappearance of the resonances at K is somehow surprising, because the measurement takes place well in the long-range antiferromagnetically ordered phase as illustrated by the dashed red line in the phase diagram (see the inset of Fig. 5). Specifically, the phase diagram indicates no phase transition or any feature separating a region where AFMR modes are detected in the vicinity of (i.e., below the dashed line in the inset of Fig. 5) from the one without observable features. We recall that the antiferromagnetic order parameter in LiFePO4 is only very weakly temperature dependent up to K and it only marginally depends on small fields in related materials LiMnPO4 and LiCoPO4 Li et al. (2006); Toft-Petersen et al. (2015); Tian et al. (2010); Toft-Petersen et al. (2012); Fogh et al. (2017). We also note that there are only very small changes of the magnetisation between K and K at any given field up to T, i.e., the uniform susceptibility is rather constant in this temperature and field range. Note, however, that the slope of the phase boundary () starts to increase above 20 K which may indicate that the presence of fluctuations or of competing interactions is associated with the disappearance of the AFMR resonances. From an experimental point of view, there are two obvious reasons which can lead to no observable resonance at GHz. These are (1) enormous broadening, leading to resonances indistinguishable from the background and (2) shift of the resonance branches above the measured frequency regime. Following the tendency of spectra up to K, both options are very unlikely. Alternatively, one may consider excitations which change the length of the spin, which is in our model constant. In Ref. Yiu et al., 2017 such resonances, there called hybrid excitations, are found by inelastic neutron scattering at GHz in zero magnetic field. If such excitations exist, a spectral shift of intensity from the conventional magnon excitations to spin stretching modes could take place at higher temperatures around the spin-flop transition. However, our ESR data do not show any sign of such hybrid excitation.
In order to further clarify the magnetic field dependence of anisotropy parameters and DM interaction, measurements in the terahertz regime will be needed. We hence suggest to study the resonance branch which exhibits zero field splitting of GHz Yiu et al. (2017), as this branch is particularly sensitive to changes of . While, below T, only weakly depends on as shown in Fig. 4c, the slope of is significantly affected. Recent THz-absorption spectroscopy data on other olivine-structured phosphates show divers behavior. In LiCoPO4, two modes are observed in zero magnetic fields which split into four modes upon application of magnetic field along the easy axis, two of which being suppressed and two stabilised in the fields Kocsis et al. (2018, 2019). All four branches show rather linear field dependence of similar absolute slope, i.e., similar effective -factor. In contrast, low-lying excitation branches in LiNiPO4 are non-linear already at relatively small magnetic fields applied along the easy magnetic axis Peedu et al. (2019).
We finally note that our bare experimental data do not unambiguously tell whether the observed modes are classical antiferromagnetic resonances, i.e., whether they are only magnetic dipole active, or whether they are electromagnons and can be excited by oscillating electrical fields, too. As illustrated, e.g., by the example of multiferroic TbMnO3, electromagnons and antiferromagnetic resonances can coexist Pimenov et al. (2009) which in principle cannot be excluded for LiFePO4 in magnetic fields, either. However, the magnetic structure of LiFePO4 implies at least two AFMR branches which presence at zero field was confirmed by INS. Attributing to AFMR is further corroborated by the fact that follows the magnetisation which is expected for an antiferromagnetic resonance. In additon, the magnetoelectric effect is comparably small in LiFePO4 and there is no electric order which further motivates attributing the observed modes to the expected AFMR ones.
IV.1 Summary
We report antiferromagnetic magnon excitations in LiFePO4 in high fields around the spin flop transition. The data reveal closing of the energy gap exactly at and hardening the AFMR modes for higher fields. An additional mode below is assigned to DM interaction which size is estimated to eV. The mean-field theory model obtained from previous zero-field INS data only describes the field dependence of the magnon modes and of the magnetisation if exchange interactions and magnetocrystalline anisotropy are considered to change with magnetic field. This also holds for the value of the spin-flop field. The AFMR modes disappear at around 20 K, i.e., well in the long-range AFM ordered phase, which might suggest the presence of spin fluctuations or competing interactions.
Acknowledgements.
The project is supported by Deutsche Forschungsgemeinschaft (DFG) through KL 1824/13-1 and the Heidelberg STRUCTURES Excellence Cluster (EXC2181/1-390900948). Funding by BMBF via project SpinFun (project 13XP5088) is gratefully acknowledged. We acknowledge the support of the HLD at HZDR, member of the European Magnetic Field Laboratory (EMFL). S.Z. and A.P. acknowledge the support of DFG through ZV 6/2-2.References
- Jeong et al. (2012) J. Jeong, E. Goremychkin, T. Guidi, K. Nakajima, G. S. Jeon, S.-A. Kim, S. Furukawa, Y. B. Kim, S. Lee, V. Kiryukhin, et al., Physical Review Letters 108, 077202 (2012).
- Matsuda et al. (2012) M. Matsuda, R. S. Fishman, T. Hong, C. Lee, T. Ushiyama, Y. Yanagisawa, Y. Tomioka, and T. Ito, Physical Review Letters 109, 067205 (2012).
- Xu et al. (2012) Z. Xu, J. Wen, T. Berlijn, P. M. Gehring, C. Stock, M. B. Stone, W. Ku, G. Gu, S. M. Shapiro, R. Birgeneau, et al., Physical Review B 86, 174419 (2012).
- Talbayev et al. (2011) D. Talbayev, S. Trugman, S. Lee, H. T. Yi, S.-W. Cheong, and A. Taylor, Physical Review B 83, 094403 (2011).
- Nagel et al. (2013) U. Nagel, R. S. Fishman, T. Katuwal, H. Engelkamp, D. Talbayev, H. T. Yi, S.-W. Cheong, and T. Rõõm, Physical Review Letters 110, 257201 (2013).
- Fishman et al. (2015) R. S. Fishman, J. H. Lee, S. Bordács, I. Kézsmárki, U. Nagel, and T. Room, Physical Review B 92, 094422 (2015).
- Ruette et al. (2004) B. Ruette, S. Zvyagin, A. P. Pyatakov, A. Bush, J. Li, V. Belotelov, A. Zvezdin, and D. Viehland, Physical Review B 69, 064114 (2004).
- Cazayous et al. (2008) M. Cazayous, Y. Gallais, A. Sacuto, R. De Sousa, D. Lebeugle, and D. Colson, Physical Review Letters 101, 037601 (2008).
- Rovillain et al. (2010) P. Rovillain, R. De Sousa, Y. Gallais, A. Sacuto, M. Méasson, D. Colson, A. Forget, M. Bibes, A. Barthélémy, and M. Cazayous, Nature materials 9, 975 (2010).
- Zimmermann et al. (2009) A. S. Zimmermann, B. B. Van Aken, H. Schmid, J.-P. Rivera, J. Li, D. Vaknin, and M. Fiebig, The European Physical Journal B 71, 355 (2009).
- Rivera (1994) J.-P. Rivera, Ferroelectrics 161, 147 (1994).
- Van Aken et al. (2008) B. B. Van Aken, J.-P. Rivera, H. Schmid, and M. Fiebig, Physical Review Letters 101, 157202 (2008).
- Van Aken et al. (2007) B. B. Van Aken, J.-P. Rivera, H. Schmid, and M. Fiebig, Nature 449, 702 (2007).
- Vaknin et al. (2004) D. Vaknin, J. L. Zarestky, J.-P. Rivera, and H. Schmid, Physical Review Letters 92, 207201 (2004).
- Toft-Petersen et al. (2015) R. Toft-Petersen, M. Reehuis, T. B. Jensen, N. H. Andersen, J. Li, M. D. Le, M. Laver, C. Niedermayer, B. Klemke, K. Lefmann, et al., Physical Review B 92, 024404 (2015).
- Arčon et al. (2004) D. Arčon, A. Zorko, P. Cevc, R. Dominko, M. Bele, J. Jamnik, Z. Jagličić, and I. Golosovsky, Journal of Physics and Chemistry of Solids 65, 1773 (2004).
- Li et al. (2009a) J. Li, W. Tian, Y. Chen, J. L. Zarestky, J. W. Lynn, and D. Vaknin, Physical Review B 79, 144410 (2009a).
- Calderon Filho et al. (2015) C. Calderon Filho, P. Gomes, A. García-Flores, G. Barberis, and E. Granado, Journal of Magnetism and Magnetic Materials 377, 430 (2015).
- Fomin et al. (2002) V. Fomin, V. Gnezdilov, V. Kurnosov, A. Peschanskii, A. Yeremenko, H. Schmid, J.-P. Rivera, and S. Gentil, Low Temperature Physics 28, 203 (2002).
- Jensen et al. (2009) T. B. S. Jensen, N. B. Christensen, M. Kenzelmann, H. Rønnow, C. Niedermayer, N. H. Andersen, K. Lefmann, M. Jiménez-Ruiz, F. Demmel, J. Li, et al., Physical Review B 79, 092413 (2009).
- Toft-Petersen et al. (2011) R. Toft-Petersen, J. Jensen, T. B. S. Jensen, N. H. Andersen, N. B. Christensen, C. Niedermayer, M. Kenzelmann, M. Skoulatos, M. D. Le, K. Lefmann, et al., Physical Review B 84, 054408 (2011).
- Li et al. (2009b) J. Li, T. B. Jensen, N. H. Andersen, J. L. Zarestky, R. W. McCallum, J.-H. Chung, J. W. Lynn, and D. Vaknin, Physical Review B 79, 174435 (2009b).
- Peedu et al. (2019) L. Peedu, V. Kocsis, D. Szaller, J. Viirok, U. Nagel, T. Rõõm, D. G. Farkas, S. Bordács, D. Kamenskyi, U. Zeitler, et al., Physical Review B 100, 024406 (2019).
- Rigitano et al. (2020) D. Rigitano, D. Vaknin, G. Barberis, and E. Granado, Physical Review B 101, 024417 (2020).
- Vaknin et al. (2002) D. Vaknin, J. Zarestky, L. Miller, J.-P. Rivera, and H. Schmid, Physical Review B 65, 224414 (2002).
- Tian et al. (2008) W. Tian, J. Li, J. W. Lynn, J. L. Zarestky, and D. Vaknin, Physical Review B 78, 184429 (2008).
- Tian et al. (2010) W. Tian, J. Li, H. Li, J. W. Lynn, J. L. Zarestky, and D. Vaknin, Journal of Physics: Conference Series 251, 012005 (2010).
- Kocsis et al. (2019) V. Kocsis, S. Bordács, Y. Tokunaga, J. Viirok, L. Peedu, T. Rõõm, U. Nagel, Y. Taguchi, Y. Tokura, and I. Kézsmárki, Physical Review B 100, 155124 (2019).
- Kocsis et al. (2018) V. Kocsis, K. Penc, T. Rõõm, U. Nagel, J. Vít, J. Romhányi, Y. Tokunaga, Y. Taguchi, Y. Tokura, I. Kézsmárki, et al., Physical Review Letters 121, 057601 (2018).
- Paraguassu et al. (2005) W. Paraguassu, P. Freire, V. Lemos, S. Lala, L. Montoro, and J. M. Rosolen, Journal of Raman Spectroscopy: An International Journal for Original Work in all Aspects of Raman Spectroscopy, Including Higher Order Processes, and also Brillouin and Rayleigh Scattering 36, 213 (2005).
- Li et al. (2006) J. Li, V. O. Garlea, J. L. Zarestky, and D. Vaknin, Physical Review B 73, 024410 (2006).
- Yiu et al. (2017) Y. Yiu, M. D. Le, R. Toft-Petersen, G. Ehlers, R. J. McQueeney, and D. Vaknin, Physical Review B 95, 104409 (2017).
- Momma and Izumi (2011) K. Momma and F. Izumi, Journal of Applied Crystallography 44, 1272 (2011).
- Neef et al. (2017) C. Neef, H. Wadepohl, H.-P. Meyer, and R. Klingeler, Journal of Crystal Growth 462, 50 (2017).
- Werner et al. (2019) J. Werner, S. Sauerland, C. Koo, C. Neef, A. Pollithy, Y. Skourski, and R. Klingeler, Physical Review B 99, 214432 (2019).
- Nagamiya (1951) T. Nagamiya, Progress of Theoretical Physics 6, 342 (1951).
- Nagamiya (1954) T. Nagamiya, Progress of Theoretical Physics 11, 309 (1954).
- Hillebrands and Ounadjela (2003) B. Hillebrands and K. Ounadjela, Spin dynamics in confined magnetic structures I, vol. 83 (Springer Science & Business Media, 2003).
- Kimura et al. (2011a) S. Kimura, M. Hagiwara, T. Takeuchi, H. Yamaguchi, H. Ueda, Y. Ueda, and K. Kindo, Physical Review B 83, 214401 (2011a).
- Kimura et al. (2011b) S. Kimura, T. Fujita, N. Nishihagi, H. Yamaguchi, T. Kashiwagi, M. Hagiwara, N. Terada, Y. Sawai, and K. Kindo, Physical Review B 84, 104449 (2011b).
- Kimura et al. (2015) S. Kimura, Y. Sawada, Y. Narumi, K. Watanabe, M. Hagiwara, K. Kindo, and H. Ueda, Physical Review B 92, 144410 (2015).
- Povarov et al. (2013) K. Y. Povarov, A. I. Smirnov, and C. P. Landee, Physical Review B 87, 214402 (2013).
- Toft-Petersen et al. (2012) R. Toft-Petersen, N. H. Andersen, H. Li, J. Li, W. Tian, S. L. Bud’ko, T. B. Jensen, C. Niedermayer, M. Laver, O. Zaharko, et al., Physical Review B 85, 224415 (2012).
- Fogh et al. (2017) E. Fogh, R. Toft-Petersen, E. Ressouche, C. Niedermayer, S. L. Holm, M. Bartkowiak, O. Prokhnenko, S. Sloth, F. W. Isaksen, D. Vaknin, et al., Physical Review B 96, 104420 (2017).
- Pimenov et al. (2009) A. Pimenov, A. Shuvaev, A. Loidl, F. Schrettle, A. Mukhin, V. Travkin, V. Y. Ivanov, and A. Balbashov, Physical Review Letters 102, 107203 (2009).