Abstract
Interdisciplinary research is fundamental when it comes to tackling complex problems in our highly interlinked world, and is on the rise globally. Yet, it is unclear why — in an increasingly competitive academic environment — one should pursue an interdisciplinary career given its recent negative press. Several studies have indeed shown that interdisciplinary research often achieves lower impact compared to more specialized work, and is less likely to attract funding. We seek to reconcile such evidence by analyzing a dataset of research grants awarded between and from the seven national research councils in the UK. We compared the research performance of researchers with an interdisciplinary funding track record with those who have a specialized profile. We found that the former dominates the network of academic collaborations, both in terms of centrality and knowledge brokerage; but such a competitive advantage does not immediately translate into impact. Indeed, by means of a matched pair experimental design, we found that researchers who transcend between disciplines on average achieve lower impacts in their publications than the subject specialists in the short run, but eventually outperform them in funding performance, both in terms of volume and value. Our results suggest that launching an interdisciplinary career may require more time and persistence to overcome extra challenges, but can pave the way for a more successful endeavour.
Introduction
Interdisciplinary research is increasingly regarded as the key to tackle contemporary complex societal challenges and to stimulate scientific innovation [1, 2, 3]. As high-impact discoveries often occur at the intersection of disciplines [4, 5], scientists have become more engaged in research areas that transcend the boundaries between traditional fields [6, 7], and increasingly collaborate across such boundaries [8].
A higher uptake in interdisciplinary research has been widely reported across academia [9], as there is now a much greater level of knowledge transfer between subjects among researchers [10]. Yet, these trends are somewhat intriguing when one looks at the evidences available on research outcomes, which suggest that – more often than not – interdisciplinary research may be an unrewarding enterprise in today’s highly competitive academic environment. In fact, it is only interdisciplinary work based on proximal combinations of different fields that achieves recognition and impact (as quantified by accrued citations), whereas distal combinations are usually perceived as too risky or heterodox [11]. Similarly, interdisciplinary research is often associated with lower citation rates [12, 13] together with lower funding success [14].
With such seemingly gloomy prospects on interdisciplinary research, we asked if those who pursue this line of work share the same fate? Namely, we compared the career progressions of researchers with a track record of research funding that can be unambiguously classified as either interdisciplinary or monodisciplinary. We examined data detailing more than research grants funded between and by the seven discipline-based UK national research councils (collectively form the bulk of the largest public funding body in the UK), which provide funding to universities and academic institutions to undertake research across a broad spectrum of fields, including arts and humanities, biology, economics, engineering and physics, medicine, environmental sciences and astronomy (Table S1).
Through network analysis, we discovered that researchers who study across different disciplines play a crucial role of knowledge brokers in the academic collaboration network, bridging the gap between subjects and researchers that may otherwise remain disconnected. Such a role pays off in the long run. By means of a matched pair experimental design we found that, despite achieving comparatively lower impact, interdisciplinary researchers outperform their discipline-specific peers in funding performance, both in terms of the number of grants and their funding size. Our findings help explain the continuous drive on interdisciplinary research, and provide insights on its role in the modern research funding landscape that may be useful to researchers and funding bodies alike.
Evolution of cross-council behaviors
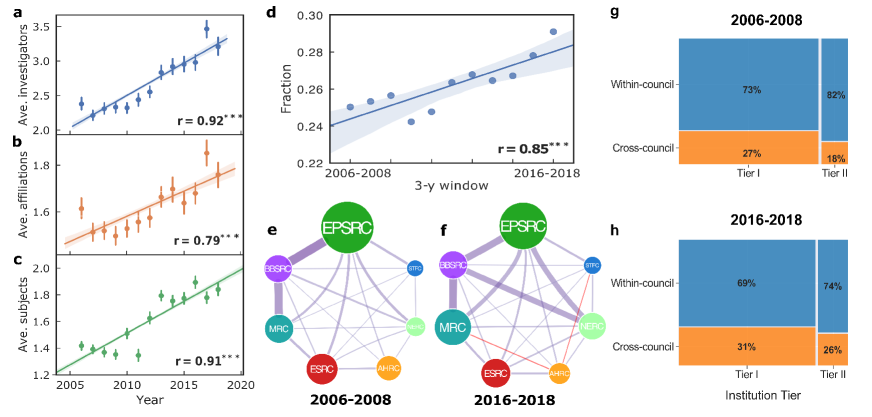
Between and , the average team size increased over time, with team composition becoming more cross-institutional (Fig. 1a-b). This demonstrates an increasing trend of collaborative science in the UK funding landscape, which is consistent with rising teamwork and multi-institutional research in scientific publications [15, 16, 17]. A funded project can be associated with one or more research subjects out of possible subjects. The level of cross-disciplinarity showed an upward trajectory (Fig. 1c), with nearly half of funded projects () being related to at least two research subjects. This finding is consistent with the general shift towards more cross-disciplinary research [1].
The increased inter-linkage among different research subjects in funded projects implies that some research projects may fall into the remits of more than a single research council, which can potentially lead to more funding opportunities for researchers who perform cross-disciplinary research. To examine this, we divided the investigators into two groups: cross-council investigators and within-council investigators. The former are those who have obtained funding from at least two different research councils; while the latter are those who have received funding from one research council only. A sliding window of three years was used to examine how the two groups of investigators evolved over time. Starting with , we shifted the sliding window year by year and obtained a total of time slices. As expected, the fraction of cross-council investigators shows a marked increase, from around in 2006-2008 to in 2016-2018 (Fig. 1d).
To better understand how this rise in cross-council investigators alters the funding landscape, we constructed a co-activity network whereby nodes represent research councils. Two councils share a link if they have supported the same investigator, and a link is weighted by the number of investigators who have obtained grants from both the connected councils. Starting with the 2006-2008 window (Fig. 1e), cross-council investigators are most commonly found between BBSRC and EPSRC, and between BBSRC and MRC, while the numbers are noticeably lower between other research councils. A decade later (2016-2018 window), the co-activity network becomes fully connected (Fig. 1f) with two new links connecting AHRC with MRC, and STFC, respectively. In addition, the numbers of cross-council investigators between BBSRC and NERC, and between EPSRC and NERC soar by and , respectively. These shifts in the funding landscape appear to be the response to the UKRI policy to support research across council boundaries and enhance the culture of multidisciplinary research [18].
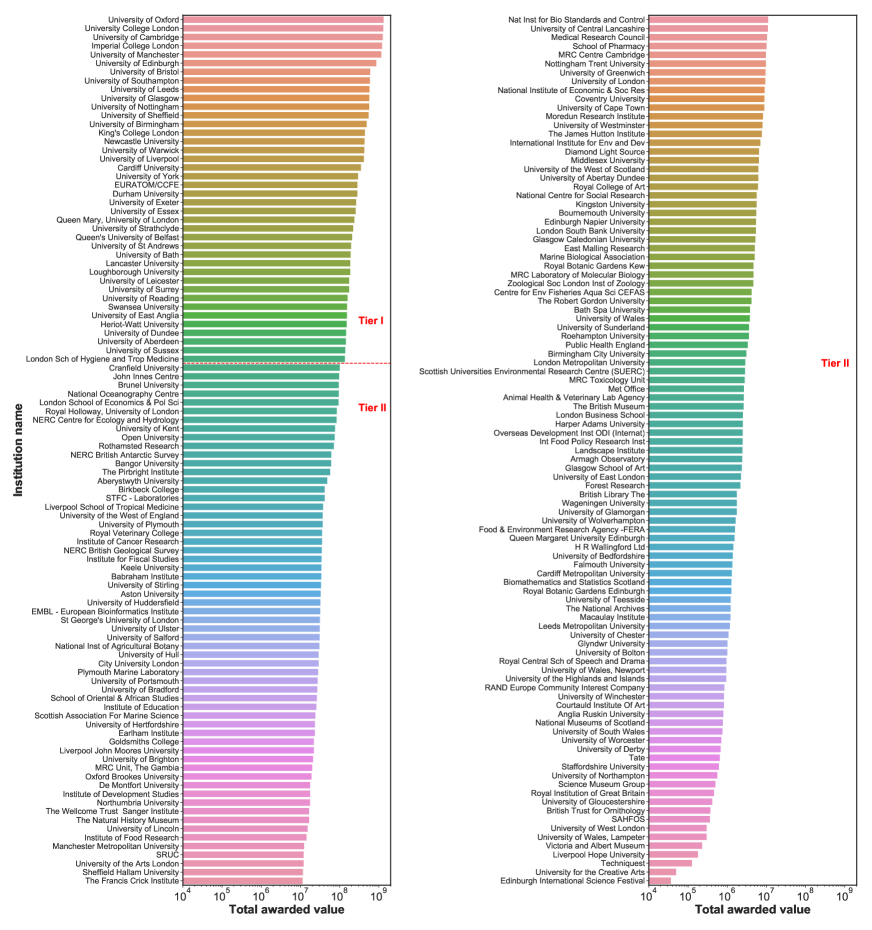
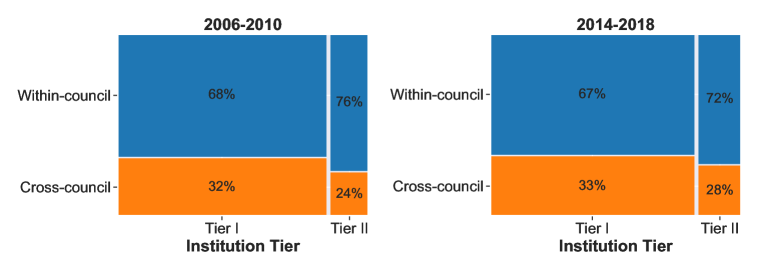
Elite institutions have been found to be prime recipients of research funding, as they are key in orchestrating collaborations [19] and generating research outputs [20, 21]. We considered the total amount of funding received by institutions between and as a proxy of their national rank, and examined the level of cross-council activities among their investigators. For the sake of simplicity, institutions are grouped into two tiers, with the top tier consisting of institutions (Tier I) that have received a higher than average total funding over the aforementioned years period, and the remaining institutions forming the bottom tier (Tier II). There are noticeably more cross-council investigators in top tier institutions (Fig. 1g-h and Fig. S4), in line with previous findings on the governing role on research innovation among top institutions [22]. Interestingly, the proportion of cross-council investigators in the bottom tier shows a bigger increase, from to , which is twice of the top tier (with an increase from to ).
Structural advantage in the collaboration network
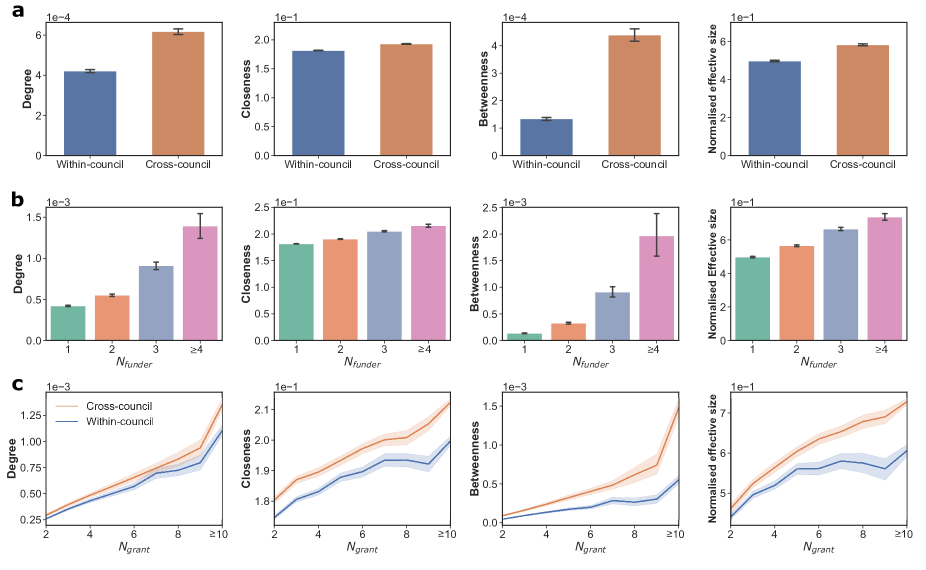
Our results have shown that interdisciplinary research is undoubtedly gaining momentum, with more cross-council investigators emerging across the University sector. To better understand this shift in collaborative science, we examined research partnerships among investigators and studied the roles played by the cross-council and within-council groups. Here, network nodes are the investigators, and two investigators are connected if they have partnered in one or more research projects.
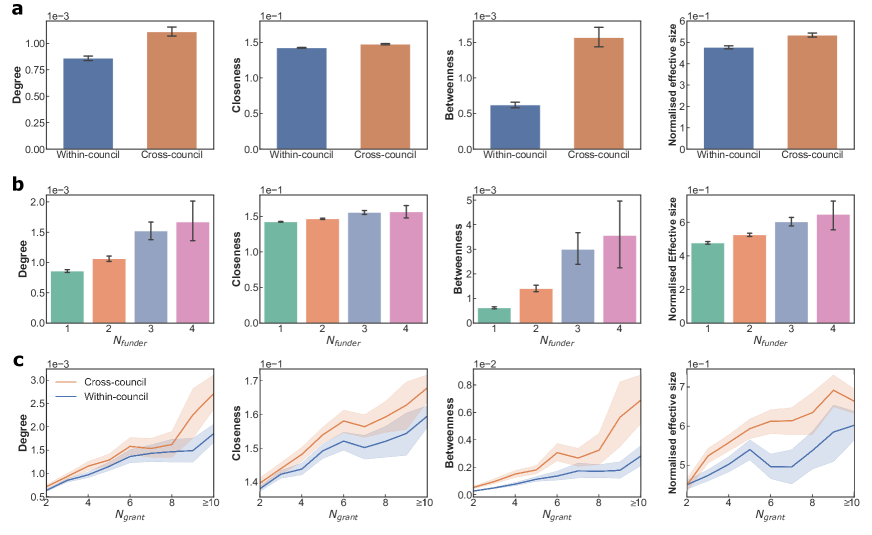
Cross-council investigators consistently show a much broader collaborative practice with a much higher average degree (Fig.2a). They are also more likely to occupy prime locations or gateways for information dissemination, as demonstrated by both a higher closeness and betweenness centrality. Indeed, we found that cross-council investigators are much more likely to be brokers of information – as they are characterized by a higher average effective network size [23] – suggesting they play a central role in establishing partnerships. Overall, the more diversified their funding source, the more advantageous their network position appears to be (Fig.2b). By comparing the two groups of investigators with respect to their number of grants, our results on network metrics show systematic differences in their collaboration patterns (Fig.2c), and the differences are most apparent among the more successful investigators.
Research outcomes and scientific impact
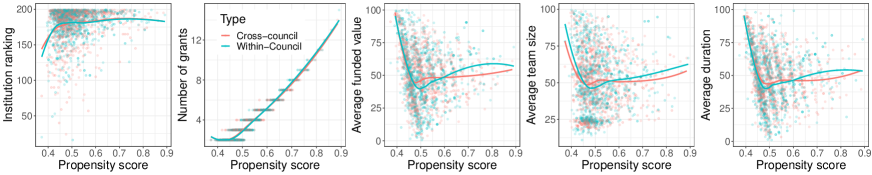
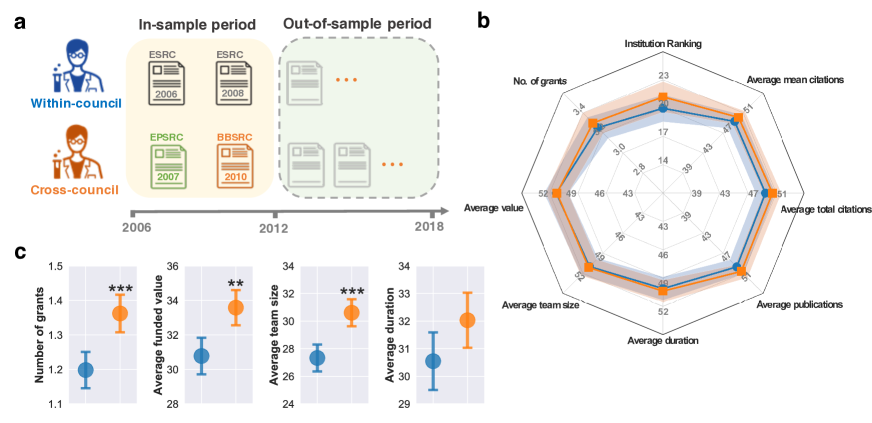
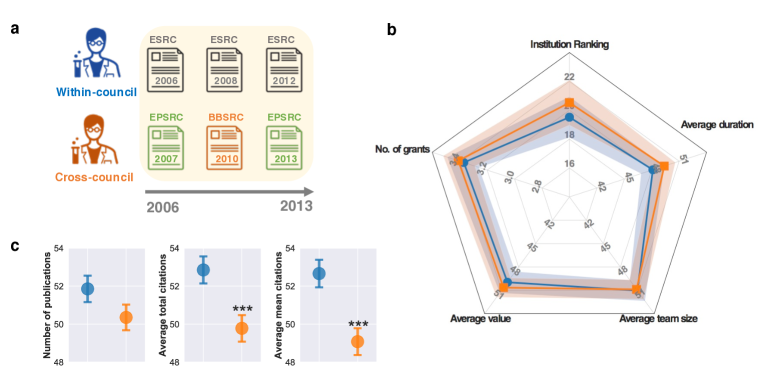
Is there a detectable difference between the cross-council and within-council investigators in terms of research outcomes and scientific impact? To address this question, we needed to control for the bias caused by confounding factors identified, so that the observed differences in research outcomes and scientific impact between the two groups can be more confidently ascribed to interdisciplinarity (i.e., cross-council funding behaviour). Here, we performed a propensity score matching analysis [24] whereby an investigator’s career profile is characterised by five confounding factors, namely the institutional ranking (measured by the total amount of funding received by the PI’s institution), the number of grants awarded to a given PI, and their average funding value per grant, team size and project duration. The last three factors have been adjusted to account for variations in values in different disciplines, and over time (Section S6 and Fig. S11). A cross-council investigator is then paired with a within-council investigator if the two share a comparable career profile between and (Fig. 3a), thereby eliminating the effect of these confounding factors on the phenomena under investigation (Fig. 3b and Fig. S12). The analysis yields a total of pairs of cross-council and within-council PIs.
For each matched pair of PIs, we compared their research performance based on the achievements reported in their grants awarded during and (but omitted projects that go beyond as the achievements reported would be incomplete), including the average number of papers reported per project, the average number of total citations received per grant, and the average number of citations received per paper per grant. Again, these metrics have been normalized across the different disciplines, and over time (Section S6). We observed that while the two groups of investigators produced more or less the same number of publications, cross-council investigators clearly received less citations in general than their within-council counterparts (Fig.3c middle and bottom and Table S2), both in terms of total citations (t-test, p=) and mean citations (t-test, p=), which is consistent with findings in prior studies [6, 13].
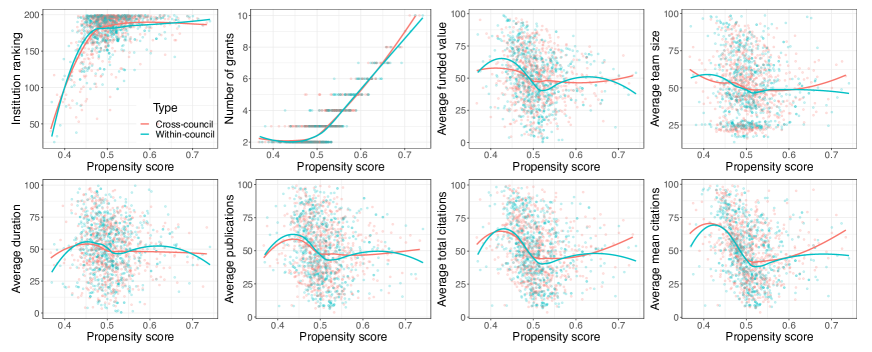
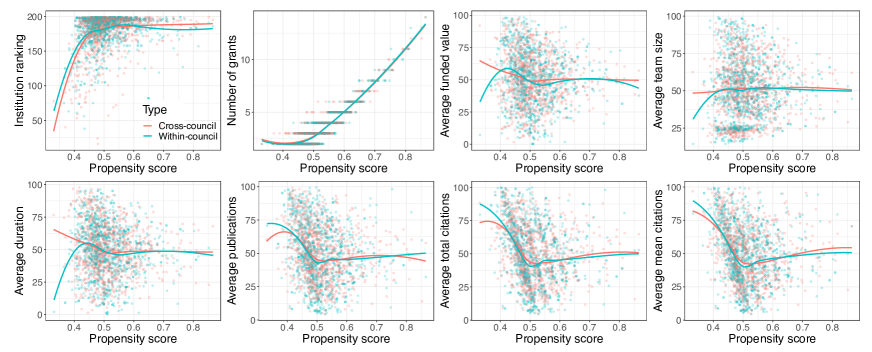
Long-term funding trajectory
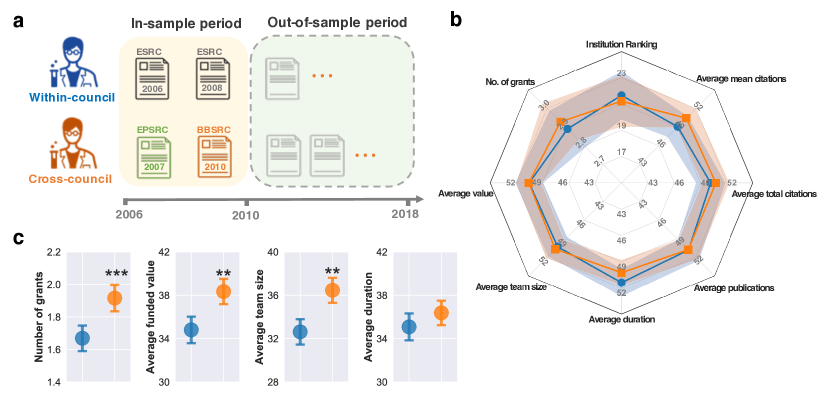
We finally compared the funding trajectory of cross-council investigators to that of within-council investigators. We referred to 2006-2010 as the in-sample period where investigators are paired, and 2011-2018 as the out-of-sample period in which funding performance of each pair of investigators is compared (Fig. 4a). On this occasion, the pairing was done by not only matching their career profiles but also their research performance (i.e., reported achievements in grants described in the previous section, Fig. 4b and Fig. S13), yielding investigator pairs. The cross-council investigator group outperformed their within-council counterparts, as demonstrated by the notable gains in the number of grants and their value; as well as the average team size (Fig. 4c, Table S3). For the sake of robustness, we repeated our analyses across different measurement time periods, and the same conclusions have been reached (Fig. S14 and Fig. S15). These findings are important as they uncover previously unknown positive aspects of an interdisciplinary research career, providing a much needed optimistic outlook for those who wish to pursue this line of work [14].
Discussion
In this paper, we compared the careers of interdisciplinary investigators with those who are tied to a fixed discipline. In line with other findings on the rise of interdisciplinary research [9, 10], we found that the fraction of cross-council investigators increased steadily during our period of observation. We also found that cross-council investigators sit more centrally than their peers in the academic collaboration network, which in turn provides them with considerable competitive advantage in terms of knowledge brokerage opportunities, but such a competitive advantage does not immediately merit a higher academic impact in their publications.
There are a number of possible reasons for the comparatively lower impact of projects led by cross-council investigators. It is reasonable to argue that their role as a knowledge broker leads to considerable costs – both in terms of building collaborative relationship and establishing a common language to communicate across disciplines [25] – which may indirectly suppress their productivity. Also, despite a lack of consensus on its overall impact (see, e.g., [26, 27]), a number of studies have shown that interdisciplinary research tends to garner recognition over longer periods of time compared to more specialized research [6, 28]. In this respect, we ought to acknowledge that our results may partially be due to the duration covered by our available data, which constrained our analyses to quantifying impact with citations received within years of publication. It is plausible that our conclusions about impact may be different over longer time periods. This limitation notwithstanding, our findings suggest that it may be very challenging for a junior researcher to launch an independent interdisciplinary academic career. Indeed, all current practices of academic impact evaluation are to some extent influenced by citation-based bibliometric indicators [29] and, therefore, may be stacked against junior interdisciplinary researchers receiving citations at a slower pace (see, e.g., [30]).
However, and more importantly, the main result of our study shows that cross-council investigators eventually outperformed their peers in terms of funding. This result is robust and statistically significant across different dimensions, with respect to the number of funded grants, the average funded value and the average team size per grant awarded. Although at face value this may seem to contradict previous findings on the lower funding success rate of interdisciplinary research [14], we believe that this is not necessarily the case. Our results primarily focus on the funding performance of investigators in terms of volume and value – not of grant proposals – and do not speak to their success rate, as data about rejected proposals were not available to us. It is therefore possible that interdisciplinary investigators in our data may still encounter a lower success rate, although this would directly imply that they submit proposals in much larger numbers than their peers.
All in all, we believe that the more plausible explanation for our findings is that indeed interdisciplinary investigators develop – on average – a better ability to attract funding in the long run. Squaring this with their lower impact in the short run suggests that interdisciplinary investigators may be ‘late bloomers’ who tend to achieve success over a longer period of time; however, there are indications that their more diversified research portfolios could give them an edge in securing long-term tenure [31].
Methods
Data sets
We collected research projects conducted between and from UK Research and Innovation (UKRI), which includes the grants information from seven national discipline-based research councils, namely AHRC, BBSRC, ESRC, EPSRC, MRC, NERC and STFC (see Section S1). The basic information for each research council has been summarized in Table S1. The research grants cover the full spectrum of academic disciplines from the medical and biological sciences to astronomy, physics, chemistry and engineering, social sciences, economics, environmental sciences and the arts and humanities, which enables us to comprehensively investigate the research and innovation in the UK. For each research project, we recorded the information of the title, abstract, the start date and end date, principal investigator (PI) and co-investigators (CI), fund value, lead/collaborating institutions and scientific outcomes (i.e., publications). Grant was considered to be awarded to the PI and the affiliation of the PI. Information on how the overall funding of a given grant was divided among the rest of the investigators (and their affiliations) was not made available. Among them, there are research projects that have been classified with at least one research subject (a total of subjects). All the research projects, investigators and institutions have been assigned with unique IDs, which eliminates the problem of name disambiguation.
For each research grant, all related papers published are recorded with the information of title and DOI. This provides the possibility for us to link the UKRI research grant database with the Microsoft Academic Graph (MAG) database by precisely matching the titles and DOI of the publications in two databases. MAG is a database consisting of large amount of scientific publications, their citation records, dates of publication, information regarding the authorship, publication venues and more. More importantly, the dataset specifies the keywords for each paper, as well as the position of each such keyword in a field-of-study hierarchy, the highest level of which is comprised of disciplines. Therefore, this connection between the two datasets not only offers us additional information about each paper, it also allows us to trace citations of each publication within the MAG and how these citations compare with other papers published in the same year and discipline. In the end, we matched a total of publications and calculated their accumulated citations 5 years after publication.
Evolution of cross-council behavior
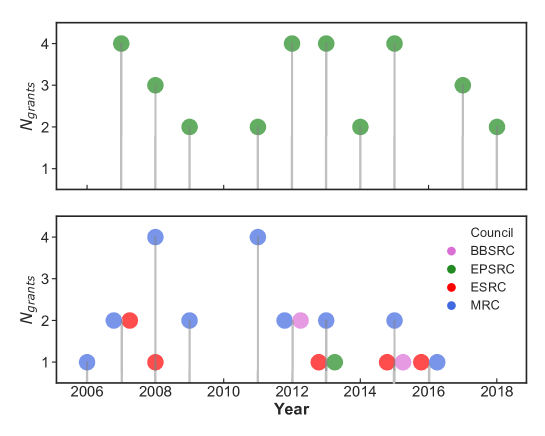
In the sliding window analysis, only investigators with at least two research grants have been tracked. We have excluded those with one research grant only as they will distort the number of within-council investigators. Fig. S1 illustrates the grant history of a cross-council investigator and a within-council investigator. Although the two investigators have obtained the same number of research grants throughout the studied period, their funding trajectories from the research councils can be strikingly different.
Collaboration network
The collaboration network was constructed by referring project partnerships between investigators between and . In this network, nodes are investigators (PIs or CIs), and a link refers to a project partnership between two nodes. Research grants comprising only one investigator (i.e. only the PI) have been excluded from the network. We extracted the Largest Connected Component (LCC) of the collaboration network which consists of of the investigators.
We then performed a node-level network analysis on all the investigators who are in the LCC, and only included those with at least research grants during the studied period. In total, we obtained cross-council investigators and within-council investigators. To further test whether this structural advantage exists across different time periods, we examined the collaboration network in the first 5-y window (2006-2010) and last 5-y window (2014-2018) of the available period, and found that our conclusions remain unchanged (see Fig.S9 and Fig.S10).
Normalized effective size
The normalized effective size of node ’s ego network measures to which extent each of the first neighbours of is non-redundant with respect to the other neighbours. Formally, for the case of unweighted and undirected graphs, the normalized effective size of a node can be defined as [23]:
| (1) |
where is the degree of the node and is its clustering coefficient. This indicator can vary from to with when the neighborhoods of are fully connected, and taking its largest value when is the center of a star, and there are no links among its collaborators. Generally, the larger the value of , the less connected the neighborhood of is, and consequently, the higher the brokerage opportunities for investigator . Investigators acting as brokers, on the one hand, tend to exhibit weak ties with their collaborators, on the other, are likely to gain exposure to a greater variance and novelty of information and link people with different ideas and perspectives [32, 33].
Propensity score matching
To avoid the potential bias of covariates among PIs in the cross-council and within-council groups, we performed the propensity score matching analysis based on multi-variable logistic regression models, which is a statistical technique typically used to infer causality in observational studies [24]. Propensity scores (PSs) are defined as the predicted probability of being a cross-council PI conditional upon a set of observed covariates. Cross-council PIs are matched to within-council PIs based on their PSs in one-to-one ratio, using a nearest-neighbor algorithm within a caliper of 0.01 on the probability scale. After the matching, the characteristics of cross-council and within-council groups in all observed covariates are statistically indistinguishable, with standardized differences , t-tests p-value for the sample means, and Kruskal–Wallis tests p-value for the entire distributions.
References
- [1] Ledford, H. How to solve the world’s biggest problems. Nature 525, 308 (2015).
- [2] Rylance, R. Grant giving: Global funders to focus on interdisciplinarity. Nature 525, 313–315 (2015).
- [3] Sun, Y. & Latora, V. The evolution of knowledge within and across fields in modern physics. Sci. Rep. 10, 12097 (2020).
- [4] Szell, M., Ma, Y. & Sinatra, R. A nobel opportunity for interdisciplinarity. Nat. Phys. 14, 1075–1078 (2018).
- [5] Thurner, S., Liu, W., Klimek, P. & Cheong, S. A. The role of mainstreamness and interdisciplinarity for the relevance of scientific papers. PLoS one 15, e0230325 (2020).
- [6] Van Noorden, R. Interdisciplinary research by the numbers. Nature 525, 306–307 (2015).
- [7] Ma, Y. & Uzzi, B. Scientific prize network predicts who pushes the boundaries of science. Proc. Natl. Acad. Sci. U.S.A. 115, 12608–12615 (2018).
- [8] Brown, R. R., Deletic, A. & Wong, T. H. Interdisciplinarity: How to catalyse collaboration. Nature 525, 315 (2015).
- [9] Battiston, F. et al. Taking census of physics. Nat. Rev. Phys. 1, 89–97 (2019).
- [10] Zeng, A. et al. Increasing trend of scientists to switch between topics. Nat. Commun. 10, 1–11 (2019).
- [11] Yegros-Yegros, A., Rafols, I. & D’Este, P. Does interdisciplinary research lead to higher citation impact? the different effect of proximal and distal interdisciplinarity. PLoS One 10, e0135095 (2015).
- [12] Levitt, J. M. & Thelwall, M. Is multidisciplinary research more highly cited? a macrolevel study. J. Assoc. Inf. Sci. Technol. 59, 1973–1984 (2008).
- [13] Pan, L. & Katrenko, S. A Review of the UK’s Interdisciplinary Research Using a Citation-based Approach (Elsevier, 2015).
- [14] Bromham, L., Dinnage, R. & Hua, X. Interdisciplinary research has consistently lower funding success. Nature 534, 684–687 (2016).
- [15] Guimera, R., Uzzi, B., Spiro, J. & Amaral, L. A. N. Team assembly mechanisms determine collaboration network structure and team performance. Science 308, 697–702 (2005).
- [16] Wuchty, S., Jones, B. F. & Uzzi, B. The increasing dominance of teams in production of knowledge. Science 316, 1036–1039 (2007).
- [17] Jones, B. F., Wuchty, S. & Uzzi, B. Multi-university research teams: Shifting impact, geography, and stratification in science. Science 322, 1259–1262 (2008).
- [18] Stokstad, E. A research behemoth is born in britain. Science 359, 1319–1319 (2018).
- [19] Torres-Olave, B., Brown, A. M., Franco Carrera, L. & Ballinas, C. Not waving but striving: research collaboration in the context of stratification, segmentation, and the quest for prestige. J. High. Educ. 91, 275–299 (2020).
- [20] Li, W., Aste, T., Caccioli, F. & Livan, G. Early coauthorship with top scientists predicts success in academic careers. Nat. Commun. 10, 1–9 (2019).
- [21] Way, S. F., Morgan, A. C., Larremore, D. B. & Clauset, A. Productivity, prominence, and the effects of academic environment. Proc. Natl. Acad. Sci. U.S.A. 116, 10729–10733 (2019).
- [22] Ma, A., Mondragón, R. J. & Latora, V. Anatomy of funded research in science. Proc. Natl. Acad. Sci. U.S.A. 112, 14760–14765 (2015).
- [23] Latora, V., Nicosia, V. & Panzarasa, P. Social cohesion, structural holes, and a tale of two measures. J. Stat. Phys. 151, 745–764 (2013).
- [24] Ho, D. E., Imai, K., King, G. & Stuart, E. A. Matching as nonparametric preprocessing for reducing model dependence in parametric causal inference. Political Anal. 15, 199–236 (2007).
- [25] Goring, S. J. et al. Improving the culture of interdisciplinary collaboration in ecology by expanding measures of success. Front. Ecol. Environ. 12, 39–47 (2014).
- [26] Larivière, V., Haustein, S. & Börner, K. Long-distance interdisciplinarity leads to higher scientific impact. PLoS One 10 (2015).
- [27] Leahey, E., Beckman, C. M. & Stanko, T. L. Prominent but less productive: The impact of interdisciplinarity on scientists’ research. Adm. Sci. Q. 62, 105–139 (2017).
- [28] Wang, J., Thijs, B. & Glänzel, W. Interdisciplinarity and impact: Distinct effects of variety, balance, and disparity. PLoS One 10, e0127298 (2015).
- [29] Moher, D. et al. Assessing scientists for hiring, promotion, and tenure. PLoS Biol. 16, e2004089 (2018).
- [30] Rafols, I., Leydesdorff, L., O’Hare, A., Nightingale, P. & Stirling, A. How journal rankings can suppress interdisciplinary research: A comparison between innovation studies and business & management. Res. Policy 41, 1262–1282 (2012).
- [31] Franzoni, C. & Rossi-Lamastra, C. Academic tenure, risk-taking and the diversification of scientific research. Ind. Innov. 24, 691–712 (2017).
- [32] Burt, R. S. Structural holes: The social structure of competition (Harvard university press, 2009).
- [33] Ahuja, G. Collaboration networks, structural holes, and innovation: A longitudinal study. Adm. Sci. Q. 45, 425–455 (2000).
- [34] Wasserman, S., Faust, K. et al. Social network analysis: Methods and applications, vol. 8 (Cambridge university press, 1994).
- [35] Radicchi, F., Fortunato, S. & Castellano, C. Universality of citation distributions: Toward an objective measure of scientific impact. Proc. Natl. Acad. Sci. U.S.A. 105, 17268–17272 (2008).
- [36] Althouse, B. M., West, J. D., Bergstrom, C. T. & Bergstrom, T. Differences in impact factor across fields and over time. J. Assoc. Inf. Sci. Technol. 60, 27–34 (2009).
- [37] Sinatra, R., Wang, D., Deville, P., Song, C. & Barabási, A.-L. Quantifying the evolution of individual scientific impact. Science 354, aaf5239 (2016).
Data availability
The UKRI funding data used in the paper are publicly accessible and can be downloaded via https://www.ukri.org. The publication and citation data are available via Microsoft Academic (https://academic.microsoft.com).
Code availability
The code for used to perform pair matching is available at https://github.com/benmiroglio/pymatch. All other codes used in this study are available from the corresponding author upon reasonable request.
Acknowledgements
We thank Xiancheng Li for sharing the MAG data. V.L. acknowledges the support for this research from the Leverhulme Trust Research Fellowship “CREATE: the network components of creativity and success”.
Author contributions
All authors designed research; Y.S. analyzed the empirical data and performed research; Y.S., G.L., A.M., and V.L. analysed data and wrote the paper.
Competing interests
The authors declare that they have no competing interests.
Supplementary Information for:
Interdisciplinary researchers attain better performance in funding
Ye Sun1, Giacomo Livan2,∗, Athen Ma3, Vito Latora1,4,5,6
1School of Mathematical Sciences, Queen Mary University of London, London E1 4NS, UK
2Department of Computer Science, University College London, London WC1E 6EA, UK
3School of Electronic Engineering and Computer Science, Queen Mary University of London, London E1 4NS, UK
4Dipartimento di Fisica ed Astronomia, Università di Catania and INFN, 95123, Catania, Italy
5The Alan Turing Institute, The British Library, London NW1 2DB, UK
6Complexity Science Hub Vienna (CSHV), Vienna, Austria
∗Corresponding author. Email: g.livan@ucl.ac.uk.
S1 Basic information for seven research councils
This study referred to the data of research grants from seven national discipline-based research councils, which cover almost the full spectrum of research subjects in UK:
-
1.
Arts Humanities Research Council (AHRC) funds independent research across a wide-range of Arts and Humanities subjects;
-
2.
Biotechnology and Biological Sciences Research Council (BBSRC) funds research in plants, microbes, animals, tools and technology underpinning biological research;
-
3.
Economic and Social Research Council (ESRC) funds research and training on social and economic issues;
-
4.
Engineering and Physical Sciences Research Council (EPSRC) funds research and training in engineering and the physical sciences;
-
5.
Medical Research Council (MRC) supports research across the biomedical spectrum;
-
6.
Natural Environment Research Council (NERC) funds research, survey, training and knowledge transfer in the environmental sciences;
-
7.
Science and Technology Facilities Council (SFTC) operates large scale science and engineering research facilities, and funds research mainly in astronomy, particle physics, space science and nuclear physics.
Table. S1 summarizes the basic information for each research council, including the number of awarded research grants, the total funded value, the number of investigators and institutions involved, and the number of research subjects. EPSRC is the largest funding body that provides the largest number and amount of research funding, while the smallest research funder is AHRC, providing less than one-tenth of EPSRC’s funding. In addition, EPSRC, MRC and ESRC are the top three research councils that involve the largest number of investigators.
S2 Robustness check for increasing cross-council behavior
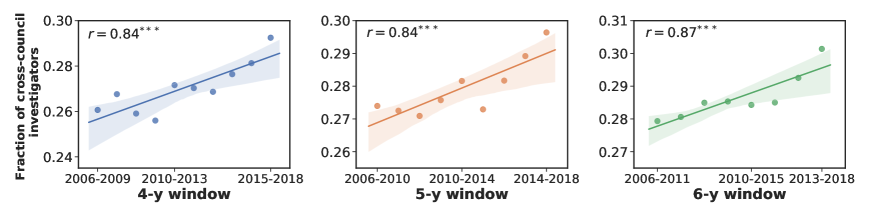
To test whether our results only hold for 3-y sliding time window, we varied the lengths of time windows using 4-y, 5-y and 6-y. The increasing trend of cross-council behaviors is statistically significant regardless of the window lengths (Fig. S2).
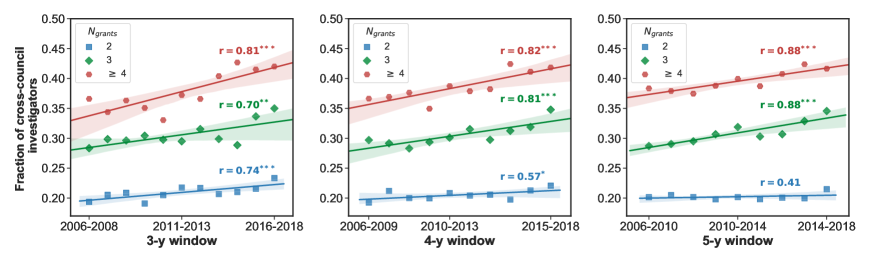
Furthermore, we also validated whether our results are robust when controlling for the investigators with similar number of research grants. We separated the investigators in each time window into three groups, i.e., groups of investigators who received two, three, and more than three research grants, and then calculated the fraction of cross-council investigators in each group and time period. The fractions of cross-council investigators in each group show a similar rising pattern over time (Fig. S3), and the increase rates are slightly higher for the group of investigators who have obtained more number of research grants.
S3 Basic features of research institutions
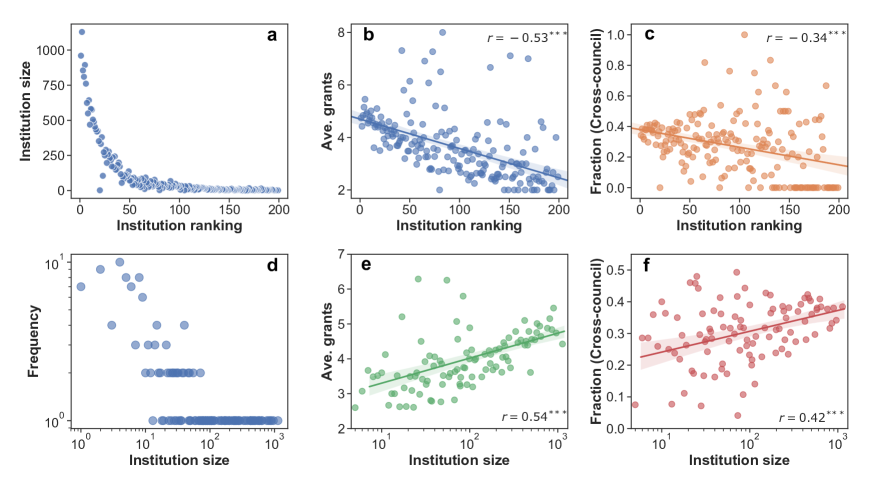
To examine the characteristics of institutions, we quantified the institution size by the total number of distinct investigators who have obtained at least one research grant under the institution, and institution ranking by the total amount of research grants awarded to an institution between and . Institutions with less than funded research projects during the above period have been excluded, and there are a total of considered research institutions. We found that the number of investigators is very heterogeneously distributed among institutions (Fig. S4a), with elite institutions having a higher number of funded investigators and most other institutions having very few funded investigators. Fig. S4b reveals that the average number of research grants received per investigator is negatively correlated with one’s institutional ranking. Fig. S4c further illustrates that there is a negative correlation between the institutional ranking and the fraction of cross-council investigators, indicating that the investigators in elite institutions are more likely to secure funding from different research councils. This is probably because the leading institutions have stronger capacity to conduct research across various scientific domains.
Similarly, from the perspective of institution size, we found that most institution sizes are small, with only a few elite institutions with a high reputation having a large number of funded researchers (Fig. S4d). Also, both the average number of grants obtained by each investigator and the fraction of cross-council investigators positively correlate with the size of their affiliations (Fig. S4e-f), indicating that the investigators in large institutions averagely have obtained more research grants, and have more opportunities and resources to secure funding from different research councils.
S4 Robustness check for different window lengths and institution stratification
To ensure that our results are not affected by selection of time window length, here we considered two 5-y compared period and repeated all our analysis. For the two tiers of institutions (Fig. S5), we found that the institutions in Tier I have higher proportion of cross-council investigators than that in Tier II in both 5-y time windows (Fig. S6), suggesting that the investigators in top institutions are generally more likely to secure research funding from different research councils. On the other hand, it is shown that Tier II institutions have a relatively higher growth rate in the fraction of cross-council investigators (with an increase from to ), which is four times greater than that in Tier I institutions (from to ).
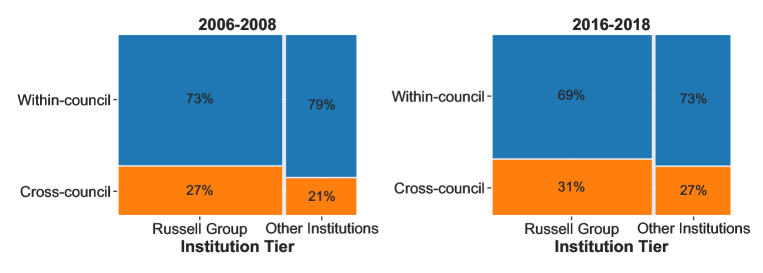
Moreover, to test if the results would be affected by the approach of institution stratification, we also tried to classify the institutions into two groups based on whether they belong to the Russell Group. In total, the Russell Group includes top universities in the UK, all of which have a strong reputation for academic achievement. We can see that in both two 3-y periods, the proportions of cross-council investigators in Russell Group are relatively higher than that in the group of other institutions (Fig. S7). Similarly, we also found that the group of other institutions exhibits a higher growth rate, by a factor of , while the Russell Group represents a lower growth rate, with an increase of .
S5 Evolution of collaboration networks and consistent structural advantage for cross-council investigators
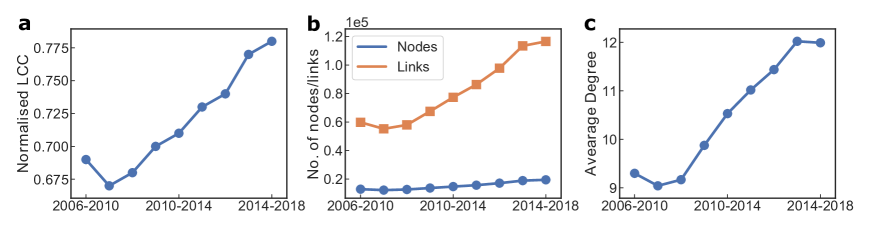
To examine the evolution of the collaboration network, we used a sliding window of five years within which we aggregated all the partnerships occurring in the research projects. Starting in , we shifted the sliding the window in one-year increments, and obtained a total of time slices between and . We found that the normalized size of the largest connected component (LCC) increased steadily with time (Fig. S8a), reflecting better interconnectivity among different local scientific communities in the funding landscape. Note that the normalized size of LCC is obtained by dividing the size of the LCC by the total number of nodes. Moreover, the number of links in the collaboration network of each time slice grows much faster than the number of nodes (Fig. S8b). The average degree of collaboration networks shows a significant increase over periods, indicating that the investigators tend to build a much broader collaboration(Fig. S8c).
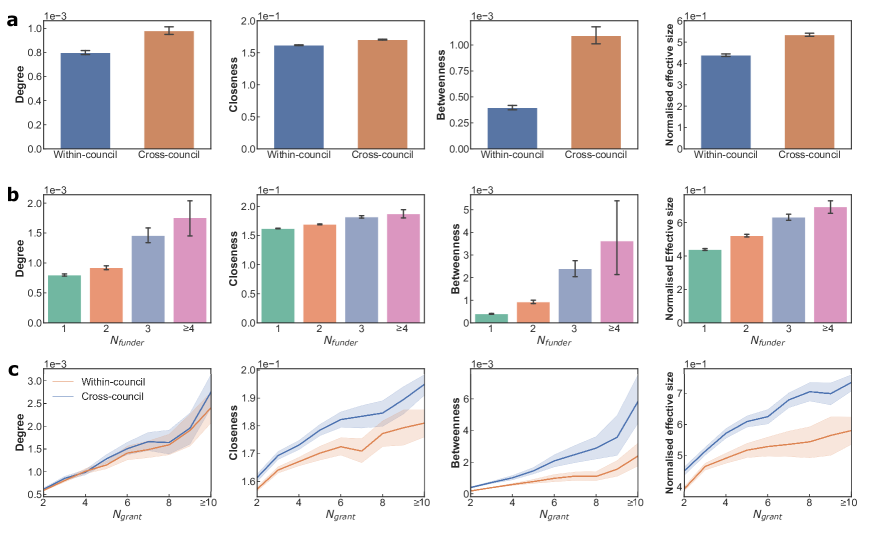
Furthermore, we checked whether the structural advantage of cross-council investigators exists in different time windows. We constructed a collaboration network and examined the network using two 5-y time windows, namely the first 5-y window (2006-2010) and the last 5-y window (2014-2018), respectively. There are of the investigators connected in the LCC in 2006-2010, and of that in 2014-2018. Through the network analysis in the LCCs, we calculated four node-level metrics, namely, degree centrality, closeness centrality, betweenness centrality and normalized effective size (see Materials and Methods). The definitions of three representative centrality measures are characterised as follows:
-
(i)
Degree centrality. The normalized degree [34] centrality of node is defined as:
(2) where is the degree (number of links) of node . The degree centrality values are normalized by dividing by the maximum possible degree in the LCC where is the total number of nodes in LCC.
-
(ii)
Closeness centrality. The closeness centrality [34] of a node is defined as the reciprocal of the average shortest path distance to over all reachable nodes in the LCC:
(3) where is the shortest-path distance between and , and is the number of nodes that can reach . Closeness centrality of a node reflects the overall distance between that node and the rest of the nodes in the network.
-
(iii)
Betweenness centrality. The betweenness centrality [34] of node is defined as follows:
(4) where is the set of nodes in LCC, is the total number of shortest paths between nodes and , and is the number of shortest paths between and that actually go through . If ,, and if .
We then quantitatively compared the structural position difference between the cross-council and within-council investigators in terms of these four metrics. In general, we found that, in both two compared periods, cross-council investigators consistently outperform the within-council investigators in terms of network centrality and brokerage power, where the conclusions remain the same as in the main text (Fig.S9 and Fig.S10).
S6 Quantifying PIs’ funding performance and outcomes
S6.1 Grant-related features and their adjustments across councils and years
In this section, we enumerated the six attributes of research grants that are considered in our study, followed by the percentile adjustments of these attributes over discipline-based research councils and years. Here, we introduce the following notations:
-
1.
: The funded value of grant .
-
2.
: The time duration of grant .
-
3.
: The number of investigators in grant .
-
4.
: The number of papers funded by the grant :
(5) where denotes the set of papers that funded by grant .
-
5.
: The total normalized citations that grant accumulates from the funded papers years after its publication:
(6) where represents the normalized citations that paper accumulates years after publication.
-
6.
: The average normalized citations that grant accumulates from the funded papers years after its publication:
(7)
Many studies have shown that: (i) the number of received citations fluctuate greatly in different disciplines, and (ii) the average number of citations per paper changes over time [35, 36, 37]. Thus, we here followed the authoritative approach [35] and normalized the citations of each paper by the average citations of all papers belonging to the same year and discipline (including scientific disciplines in Microsoft Academic Graph (MAG) dataset).
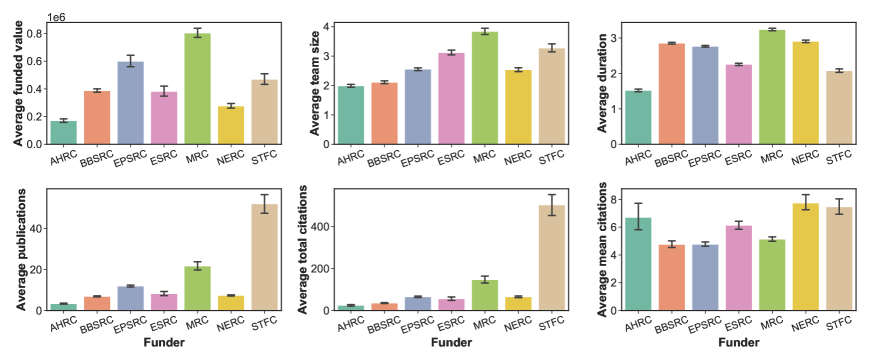
Fig. S11 illustrates that the six attributes of research projects vary greatly among different councils, especially in terms of average funded value and average number of reported publications. For instance, the average number of publications per grant in is nearly fifteen times larger than that in . In order to fairly compare grant properties and research outcomes across different research council and year, we adjusted these features by calculating their percentile rank relative to the values in the same council and year. More formally, let denote the percentile rank of a considered feature value of grant relative to a list of grants in the same council and year, where . For example, means that of the observed grant value are below the given value of grant ; Similarly, indicates that of grant team size are smaller than that of the given grant . In this way, the attributes of research grants awarded by different research councils and years are comparable.
S6.2 PIs’ Funding performance and research outcomes
After obtaining the features of research grants, we then quantify the funding performance and research outcomes for any given principal investigators based on their involved grants in an observing period. Here, we introduce the following notations:
-
1.
: The number of grants obtained by principal investigator :
(8) where denotes the set of research grants that obtained by investigator in a given time period.
-
2.
: The institution ranking of principal investigator . Here, we measure institutions’ ranking based on their total awarded amounts of funding from and . We only consider the institutions at least receiving research grants during the period, and there are a total of scientific institutions.
-
3.
: The average percentile features of grants obtained by principal investigator :
(9) where , referring to the six attributes of research grants mentioned above. For example, indicates the average percentile funded value across research grants received by principal investigator . Similarly, the average percentile of total normalized citations per project led by investigator is defined as .
Based on these metrics, we compared research outcomes and performance in funding between each paired investigators.
| Research Council | Abbr. | |||||
|---|---|---|---|---|---|---|
| Arts and Humanities Research Council | AHRC | |||||
| Biotechnology and Biological Sciences Research Council | BBSRC | |||||
| Engineering and Physical Sciences Research Council | EPSRC | |||||
| Economic and Social Research Council | ESRC | |||||
| Medical Research Council | MRC | |||||
| Natural Environment Research Council | NERC | |||||
| Science and Technology Facilities Council | STFC |
| Dependent variables: research outcomes and scientific impact | |||
| Average papers | Average total citations | Average mean citations | |
| Cross-council | |||
| Institution ranking | |||
| Number of grants | |||
| Average funded value | |||
| Average team size | |||
| Average duration | |||
| Constant | |||
| No. of pairs | |||
| Adjusted | |||
| Dependent variables: funding performance in out-of-sample period | ||||
| Number of grants | Average funded value | Average team size | Average duration | |
| Cross-council | ||||
| Institution ranking | ||||
| Number of grants | ||||
| Average funded value | ||||
| Average team size | ||||
| Average duration | ||||
| Average publications | ||||
| Average total citations | ||||
| Average mean citations | ||||
| Constant | ||||
| No. of pairs | ||||
| Adjusted | ||||