VERITAS Observations of the Galactic Center Region at Multi-TeV Gamma-Ray Energies
Abstract
The Galactic Center (GC) region hosts a variety of powerful astronomical sources and rare astrophysical processes that emit a large flux of non-thermal radiation. The inner 375 pc 600 pc region, called the Central Molecular Zone (CMZ), is home to the supermassive black hole Sagittarius A*, massive cloud complexes, and particle accelerators such as supernova remnants. We present the results of our improved analysis of the very-high-energy (VHE) gamma-ray emission above 2 TeV from the GC using 125 hours of data taken with the VERITAS imaging-atmospheric Cherenkov telescope between 2010 and 2018. The central source VER J1745–290, consistent with the position of Sagittarius A*, is detected at a significance of 38 standard deviations above the background level , and we report its spectrum and light curve. Its differential spectrum is consistent with a power law with exponential cutoff, with a spectral index of , a flux normalization at 5.3 TeV of , and cutoff energy of TeV. We also present results on the diffuse emission near the GC, obtained by combining data from multiple regions along the GC ridge which yield a cumulative significance of . The diffuse GC ridge spectrum is best fit by a power law with a hard index of 2.19 0.20, showing no evidence of a cutoff up to 40 TeV. This strengthens the evidence for a potential accelerator of PeV cosmic rays being present in the GC. We also provide spectra of the other sources in our field of view with significant detections, composite supernova remnant G0.9+0.1 and HESS J1746–285.
1 Introduction
The Galactic Center (GC) is host to numerous potential sites of particle acceleration, including the supermassive (; Schödel et al., 2002; Ghez et al., 2003, 2005; Gillessen et al., 2009) black hole Sagittarius A* (hereafter Sgr A*), supernova remnants (SNRs), and pulsar wind nebulae (PWNe). The GC also contains dense molecular clouds, constituting the Central Molecular Zone (CMZ Morris & Serabyn, 1996). Very-high-energy (VHE; GeV) gamma-ray emission has been detected from the direction of the GC with imaging-atmospheric Cherenkov telescopes (IACTs; Tsuchiya et al., 2004; Kosack et al., 2004; Aharonian et al., 2004; Albert et al., 2006; Archer et al., 2014), leading to important discoveries in high-energy astrophysics and constraints on models for particle dark matter (van Eldik, 2015).
Sources of VHE gamma rays include the strong central source VER J1745–290, coincident with both Sgr A* and PWN 359.95–0.04 (Archer et al., 2016), composite SNR G0.9+0.1 (Aharonian et al., 2005), and an unidentified source variously identified as VER 1746–289 (Archer et al., 2014, 2016; Ahnen et al., 2017) or HESS J1746–285 (Abdalla et al., 2018a). There is also diffuse emission that extends along the Galactic plane (Aharonian et al., 2006c; Archer et al., 2016; Abramowski et al., 2016; Ahnen et al., 2017; Abdalla et al., 2018a). The spectrum of VER J1745–290 (which we consider to be the same object as HESS 1745–290) has a photon index , and exhibits a break at TeV (Albert et al., 2006; Aharonian et al., 2009; Archer et al., 2016), while the diffuse emission spectrum has with no break or cutoff up to tens of TeV (Aharonian et al., 2006a; Abramowski et al., 2016).
The origin of the GC VHE emission remains undetermined, due in part to source confusion and the limitations of current instruments. The source of VER J1745–290 may be Sgr A* (Atoyan & Dermer, 2004; Aharonian & Neronov, 2005; Chernyakova et al., 2011; Ballantyne et al., 2011; Fatuzzo & Melia, 2012; Kusunose & Takahara, 2012; Fujita et al., 2017; Rodríguez-Ramírez et al., 2019) or PWN G359.95-0.04 (Wang et al., 2006; Hinton & Aharonian, 2007), with which it is spatially coincident (Acero et al., 2010). Other possible origins include the annihilation of dark matter particles (Horns, 2005; Bergström et al., 2005b, a; Profumo, 2005; Aharonian et al., 2006b; Belikov et al., 2012; Cembranos et al., 2012, 2013; Gammaldi et al., 2016) or a population of millisecond pulsars (Bednarek & Sobczak, 2013; Bartels et al., 2016; Guépin et al., 2018). The mechanism of gamma-ray emission may be predominantly due to hadronic processes, where relativistic protons interact with gas and subsequently produce gamma rays through neutral pion decay (Aharonian & Neronov, 2005; Chernyakova et al., 2011; Ballantyne et al., 2011; Fatuzzo & Melia, 2012; Linden et al., 2012; Guépin et al., 2018), leptonic processes where gamma rays are produced when electrons and positrons undergo inverse Compton scattering off a radiation field (Atoyan & Dermer, 2004; Hinton & Aharonian, 2007; Kusunose & Takahara, 2012; Lacroix et al., 2016), or a combination of processes (hybrid scenario), where leptons produce high energy, but not VHE, gamma rays (Guo et al., 2013). Both the correlation of VHE emission with the CMZ and the lack of a cutoff in the diffuse spectrum support a hadronic scenario, capable of explaining both VER J1745–290 and the diffuse emission (Aharonian et al., 2006a; Linden et al., 2012; Abramowski et al., 2016). Measurement of the diffuse spectrum by H.E.S.S. up to energies of tens of TeV with no evidence of a cutoff has also been interpreted as evidence for the existence of PeV protons within the central 10 parsecs of the Galactic Center, accelerated by Sgr A* (Abramowski et al., 2016). While cosmic rays are known to extend up to PeV energies (e.g. Hörandel, 2003), few, if any, accelerators of PeV cosmic rays, or ‘PeVatrons’, have been clearly established (e.g. Abramowski et al., 2016; Abeysekara et al., 2020). Discovering the nature of PeVatrons in our Galaxy is thus a particularly important step in understanding the origins of cosmic rays.
In addition to the spectra and morphology of the astrophysical sources detected, their variability also constrains models of VHE emission. Correlated variability in different wavebands would suggest a common origin, while variability timescales can constrain the nature of the acceleration mechanism (Ballantyne et al., 2011) or the size of the emission region. To date, no variability has been detected in the TeV emission from the direction of Sgr A* (Albert et al., 2006; Aharonian et al., 2009; Ahnen et al., 2017), suggesting a differing origin of the VHE radiation from the variable IR and X-ray emission (Wang et al., 2006).
In the neighboring high-energy waveband, an excess at the GC peaking near 3 GeV has been detected by Fermi-LAT (Atwood et al., 2009; Ackermann et al., 2017). Proposed explanations include unresolved point sources (e.g. Abazajian, 2011; Brandt & Kocsis, 2015; Bartels et al., 2016; Lee et al., 2016; Macias et al., 2018; Buschmann et al., 2020), annihilation of dark matter particles (e.g. Hooper & Goodenough, 2011; Daylan et al., 2016; Leane & Slatyer, 2019), or injection of electrons or protons into the interstellar medium (e.g. Chernyakova et al., 2011; Petrović et al., 2014; Carlson & Profumo, 2014; Gaggero et al., 2015; Malyshev et al., 2015). Certain models have signatures at TeV energies as well (e.g. Yusef-Zadeh et al., 2013).
In this work, we expand upon previous VERITAS analyses of the Galactic Center using additional data, taken between 2010 and 2018, and using improved analysis techniques. We extend the measured spectrum of the central source VER J1745–290 to 40 TeV, and present new limits on its VHE variability. We report the first VERITAS spectrum of the diffuse Galactic ridge emission spanning to in galactic longitude. We also provide spectra and positions for G0.9+0.1 and HESS J1746–285.
2 Data and Methodology
2.1 Overview of GC Observations and Analysis
The Very Energetic Radiation Imaging Telescope Array System (VERITAS) is a ground-based array of four 12-meter IACTs located at the Fred Lawrence Whipple Observatory in Amado, Arizona at coordinates N, W and at an altitude of 1268 m above sea level. Between 2010 April and 2018 June, VERITAS accumulated 155 hours of data-quality assessed observations of the GC region. After time cuts and dead-time corrections are applied, the total exposure is approximately 125 hours; an additional 40 hours compared to Archer et al. (2016).
Due to the location of VERITAS, the GC can only be observed at large zenith angles (LZA) between 59 and 66 degrees. Observing at LZA increases an IACT’s effective area and minimum energy threshold, compared to smaller zenith angles (Sommers & Elbert, 1987; Konopelko et al., 1999). The thicker atmosphere along the line of sight results in the gamma-ray-initiated electromagnetic particle cascades (“air showers”) originating further away from the telescopes, on average. The air shower images thus appear fainter due to the light spreading out as well as additional atmospheric attenuation, raising the energy threshold to about 2 TeV for the GC analysis. The larger distance and zenith angle of LZA air showers also result in larger Cherenkov light pools, increasing the effective area at to about four times greater than the effective area at a smaller zenith angle of for energies above 10 TeV. LZA observations also introduce various biases into gamma ray reconstruction and require specialized analysis methods to correct them.
To estimate the arrival directions of air showers, we use an improved version of the displacement method (e.g. Akerlof et al., 1991; Buckley et al., 1998; Lessard et al., 2001; Şentürk, 2011). The standard geometric method (e.g. Hofmann et al., 1999; Krawczynski et al., 2006), which uses the intersection of the air shower images’ major axes recorded in each telescope, performs poorly at zenith angles greater than (Archer et al., 2014). At LZA, the telescope separation in the plane perpendicular to the shower axis shrinks due to projection effects, and the larger effective area results in greater impact distances between the shower core and telescopes on average. Both of these effects reduce the viewing angle differences of the telescopes, causing the major axes to be closer to parallel, thereby increasing the uncertainty in the estimated arrival direction. The displacement method does not rely on stereo information, and instead estimates the distance between the source position and a shower image centroid (the disp parameter) based on Monte-Carlo simulations of gamma-ray showers. Various implementations of the displacement method have been applied to LZA observations of the GC previously (Kosack et al., 2004; Archer et al., 2014, 2016). Our new method uses the same simulations and image parametrization as the standard VERITAS displacement method implementation (Aliu et al., 2012; Archer et al., 2014), but uses boosted decision trees (BDTs) to estimate the disp parameter instead of lookup tables. We use BDTs with gradient boosting, as implemented in the Toolkit for MultiVariate data Analysis (Hoecker et al., 2007) with ROOT (Antcheva et al., 2009).
BDTs have also been shown to improve energy reconstruction (Albert et al., 2008) and gamma-hadron separation power (Ohm et al., 2009; Krause et al., 2017; Abdalla et al., 2018c) for IACT data. We use the BDT method for energy reconstruction as well, and find that it reduces the energy bias and improves the energy resolution by approximately 10% in LZA analyses. The results were validated on Crab Nebula data to ensure the spectrum was consistent with expectations (Buchovecky, 2019).
2.2 Gamma-Hadron Separation
IACTs observe optical Cherenkov radiation from air showers initiated by both gamma rays and hadrons. Instrument sensitivity benefits from the ability to distinguish gamma-ray showers from the substantial background of hadronic showers, in a process termed “gamma-hadron separation” (e.g. Krawczynski et al., 2006). The standard method of gamma-hadron separation compares the values of an event’s mean-scaled stereo Hillas parameters (Hillas, 1985) to fixed parameter ranges (“cuts”), outside of which events are considered cosmic-ray-like and are excluded from the analysis. LZA observations result in distributions of stereo parameters that differ in shape from standard observations for which the standard optimal fixed cut values were found. To improve gamma-hadron separation, optimal cut values that maximize sensitivity for LZA data are found, using 20 hours of data taken on the Crab Nebula with a distribution of zenith angles that closely matches the GC dataset. The statistical significance of the Crab Nebula was found using the ring-background method (RBM; Berge et al., 2006), varying the cut values for mean-scaled width (MSW), mean-scaled length (MSL), and size. The optimized LZA fixed cuts were then validated on a separate 25 hours of LZA Crab Nebula data (Buchovecky, 2019). We find that the LZA-optimized cuts provide a roughly 10% gain in sensitivity, compared to the standard cuts.
2.3 Acceptance
The acceptance, or relative detection efficiency, is approximately radially symmetric across the VERITAS field of view. Since the acceptance is non-uniform, acceptance-weighted exposure times are used in calculations of gamma-ray excess and significance (Li & Ma, 1983; Spengler, 2015). The radial acceptance function depends only on the angular distance between the tracking position of the telescope pointing and the reconstructed event position. A zenith acceptance correction is also applied, following the procedure described in (Zitzer & VERITAS Collaboration, 2017). This zenith correction to the acceptance map is especially important at large zenith angles, where deviations from the uncorrected radially symmetric map can exceed 10%.
2.4 Source Localization
Locations of point sources are determined by fitting a two-dimensional model of the VERITAS point spread function (PSF) plus a constant to an acceptance-corrected excess map. The PSF at LZA is better described by the radial King function (Read et al., 2011) than a two-dimensional Gaussian. The King function is given by
| (1) |
where is the probability density of the reconstructed event position, is the radial distance from the source position, and and are free parameters. Values of and are derived from simulated point-source data, yielding and . The resulting 68% containment radius of the PSF model is . In our analysis of the data, position fits are conducted in the Galactic coordinate plane, and are performed out to a radius of .
2.5 Spectral Models
Differential flux spectra are calculated in discrete energy bins for a region around the source using the reflected region method (RRM; Aharonian et al., 2001) for background estimation. Power law (PL), exponentially cutoff power law (ECPL), and smoothly broken power law (BPL) fits to the binned spectral points are explored. The PL model is defined as
| (2) |
where is the differential spectral index and is the flux normalization at energy . The ECPL is defined as
| (3) |
where the additional parameter is the cutoff energy. The BPL is defined as
| (4) |
where and are the spectral indices before and after the break energy .
3 Results
3.1 Significance Map of the Galactic Center
The map of statistical significance for events above 2 TeV of the inner of the GC region is shown in the top panel of Figure 1. The positional uncertainties of HESS J1745–290, G0.9+0.1, VER J1746–289, and HESS J1746–285 are indicated. The color scale, which represents statistical significance, is limited to because the peak significance is over and would obscure the remaining structure of diffuse emission. Strong diffuse emission is visible along the Galactic ridge, extending about in each direction from the center. The map of excess gamma-ray counts (corrected for acceptance) detected by VERITAS is shown in the middle panel of Figure 1. Contours of CS line emission and HCCCN emission, which trace dense gas, are also shown. There is an appearance of a moderate correlation between the diffuse emission and dense gas.
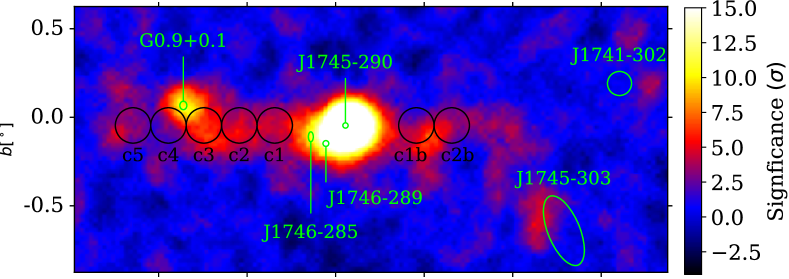
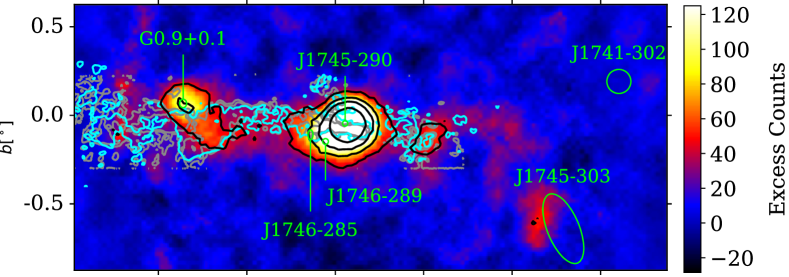
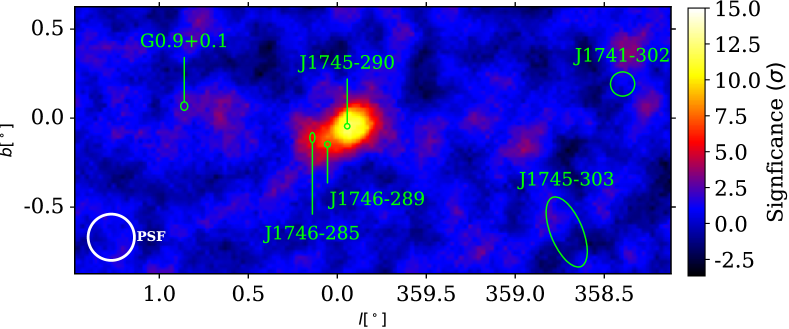
The significance map for events above 10 TeV is shown in the bottom of Figure 1. Aside from the central emission, the strongest signal comes from HESS J1746–285.
4 VER J1745–290
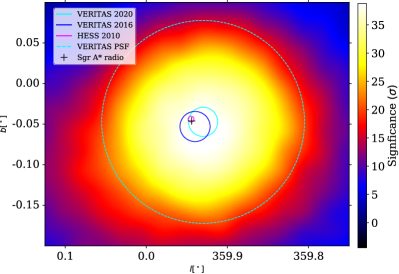
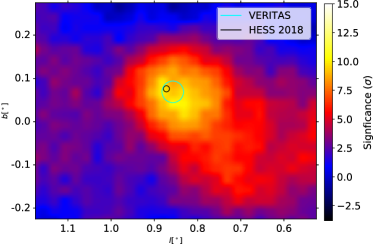
A significance map showing the central emission around VER J1745–290 in greater detail is shown in Figure 2. The RBM analysis of VER J1745–290 yields a statistical significance of , compared to the previous result of found in Archer et al. (2016). A total excess of 426 gamma-ray-like events above 2 TeV was detected in the circular signal region centered on the nominal position of Sgr A*, (l, b) = (, ) (Reid & Brunthaler, 2004).
The best-fit position of VER J1745–290 is (l, b) = (, ), with uncertainties in and of . The uncertainty is dominated by a systematic uncertainty of , which is larger at LZA than at higher elevations (Archer et al., 2016). This position is consistent with the previous position of VER J1745–290 (Archer et al., 2016), the H.E.S.S. position of HESS J1745–290 from Acero et al. (2010), and the radio position of Sgr A*. The approximate distance of G359.95–0.04’s tail from Sgr A* is about , and the mean position of G359.95–0.04 is slightly farther away, as its head is about away from Sgr A* (Wang et al., 2006). Excluding either source as a candidate for the central emission requires a smaller angular uncertainty, which may be achieved by CTA in the future with a point-source localization accuracy of less than (Acharya et al., 2019).
4.1 Spectrum
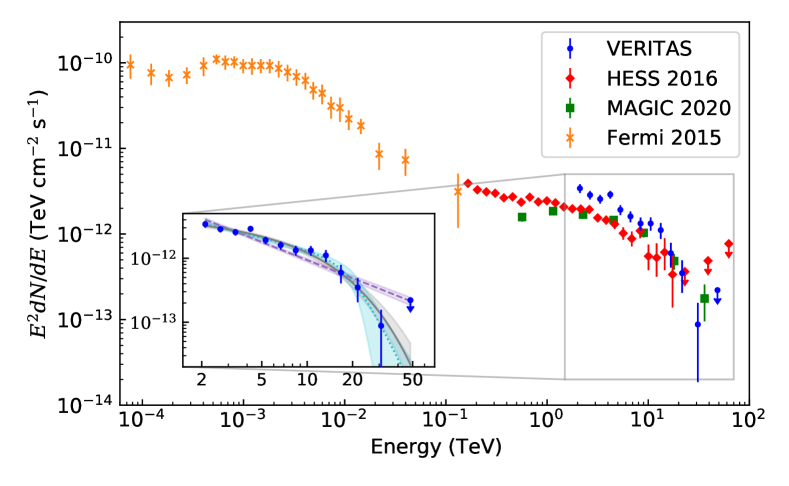
The differential energy spectrum of VER J1745–290 is shown in Figure 3. Also shown for comparison are the differential energy spectra of the central source, coincident with the position of Sgr A*, as measured by H.E.S.S. (Abramowski et al., 2016), MAGIC (Acciari et al., 2020), and Fermi-LAT (Malyshev et al., 2015). The binned spectral data are given in Table A1. The events were extracted from the same signal region used in the RBM analysis and include a small amount of contamination from the diffuse emission and HESS J1746–285. The energy threshold for this analysis is 1.9 TeV, and the highest significant energy bin has an upper edge of 39.8 TeV. Fit parameters and statistical uncertainties for all functions are included in Table 1, as well as the chi-squared value and degrees of freedom (/d.o.f) for each fit. The systematic uncertainties for the flux normalization and power law index are conservatively estimated to be about 40% (Archer et al., 2016). The ECPL and BPL provide adequate fits to the data based on their -values, while the PL does not. Since the BPL does not provide a substantially better fit than the ECPL with an additional parameter, we consider the ECPL to provide the best spectral fit. The ECPL fit gives a harder spectral index of below the cutoff, compared to the BPL index of . The flux normalization of the ECPL, , is also higher than that of the BPL, . The cutoff energy of the ECPL, TeV, is consistent with the break energy of the BPL, TeV. The ECPL spectral index and cutoff energy are consistent with H.E.S.S. (Abramowski et al., 2016) and MAGIC (Acciari et al., 2020) measurements, while our flux normalization is slightly higher, though not significantly when systematic uncertainties are accounted for. The decorrelation energy, the energy at which the correlation between the flux normalization and spectral index parameters is minimized, is 5.3 TeV.
The Fermi-LAT spectrum is best-fit by a BPL with a break energy at around 2 GeV. The index after the break energy, , is steeper than the spectrum at very high energies, suggesting that the emissions at GeV and TeV energies are produced by different mechanisms or different populations of particles.
The integral flux above 1 TeV assuming the ECPL model is , which is roughly 10% of the Crab Nebula flux in the same energy range.
Using a distance from the GC to the Earth of 7.86 kpc (Boehle et al., 2016), the total VHE luminosity above 1 TeV is approximately erg s-1. This is consistent with the lower end of the estimate in Genzel et al. (2010).
| Models | ( ) | (TeV) | /d.o.f. | -value | ||
|---|---|---|---|---|---|---|
| PL | N/A | N/A | 31.9/10 | 0.00042 | ||
| ECPL | N/A | 6.84/9 | 0.65 | |||
| BPL | 5.68/8 | 0.68 |
4.2 Flux Variability
Light curves of the integral flux above 2 TeV and 5 TeV of J1745–290 are shown in Figure 4. The semi-annually binned light curves are fluxes in time bins effectively 1.5 months in duration, corresponding to approximately half of the VERITAS observing season of the GC. A daily binned light curve of the integral flux above 2 TeV is also shown. Bins with low statistics, defined as fewer than 4 counts in either the signal or background region, are excluded.
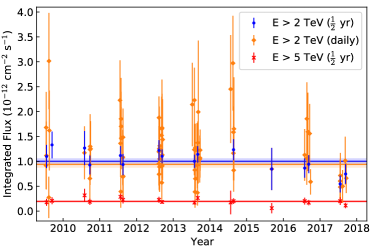
The best-fit means of the light curves are calculated as the uncertainty-weighted means of the flux points. The best-fit mean of the semi-annually binned light curve of flux above TeV is . The fit’s /d.o.f. is 16.64/15, corresponding to a -value of 0.34, consistent with a constant flux hypothesis. For the semi-annually binned light curve of flux above TeV, the best-fit mean is with a /d.o.f. is 20.94/15, corresponding to a -value of 0.14, also consistent with a constant flux. For the daily light curve of flux above TeV, the best-fit mean is , with a /d.o.f. of 70.1/71, corresponding to a -value of 0.51, consistent with a constant flux. A typical night of data has a one-hour exposure, and produces a 95% flux upper limit of , above 2 TeV. The light curve shows no sign of long-term flaring or variability on month timescales, for either energy range. The apparent decrease in fluxes in the last several time bins, while not statistically significant, may be due to the degradation of the VERITAS mirrors and photodetectors, which will be addressed in a forthcoming publication.
Emission models in which gamma rays are emitted close to the event horizon of Sgr A* predict variability on timescales ranging from minutes to hours (e.g. Aharonian & Neronov, 2005). To investigate variability on the timescale of a day, a light curve was also calculated with daily bins. The /d.o.f. for this fit is 42.3/52, corresponding to a -value of 0.83, consistent with no variability.
5 Analysis of Diffuse Ridge Emission
The analysis of the diffuse emission from the GC ridge uses multiple signal regions along the Galactic plane. The regions used are the same as the seven circular regions used by Abramowski et al. (2016), and are shown in Figure 1. Regions are first analyzed individually using the RRM to get the number of events in the signal and background regions, as well as event energies, exposure times, effective areas, and acceptances. Exclusion regions are devised for each telescope pointing direction to prevent background regions from being used by more than one signal region. The results from all regions are then combined to calculate the significance and spectrum. Observations where the telescope pointing direction is more than from the signal region are excluded from the analysis of that region, due to the large relative uncertainty of the effective area at such offsets.
The map of excess counts in the CMZ from this analysis can be seen in the middle panel of Figure 1. The cumulative statistical significance of excess signal after combining the data from the seven circular regions is . An overlay of radio contours from CS line emission (Tsuboi et al., 1999) and HCCCN emission (Jones et al., 2011) are also shown in Figure 1; these are two of the most effective known tracers of dense gas material and have a visible correlation with the diffuse gamma-ray emission in the region.
5.1 Spectrum
The binned spectral data for the differential energy spectrum of the diffuse ridge emission are given in Table A2. The best fit to our data is a PL with spectral index and flux normalization at 5.3 TeV. The PL provides a good fit, with a /d.o.f. of 6.03/5, corresponding to a -value of 0.30. While no significant spectral cut-off is found, consistent with Abdalla et al. (2018a), the 95% confidence level lower bound on the ECPL’s cutoff energy, assuming a spectral index fixed at , is 10.3 TeV, consistent with the cutoff observed by Acciari et al. (2020). Letting the spectral index vary in the cutoff energy upper limit calculation results in unphysically hard spectral indices. This calculation neglects the effect of pair absorption, which would presumably shift the cutoff energy higher (Porter et al., 2018).
The point sources contaminate some of the diffuse signal regions. To estimate this contribution, we model the 2D excess count map, using King functions for the point sources, and using for the diffuse ridge emission the velocity-integrated CS map times a 2D Gaussian of width centered at the GC, as in Abdalla et al. (2018a), convolved with the VERITAS PSF. The amplitudes of each source component are derived simultaneously from a fit to the correlated excess count map. Model counts can then be summed in the relevant signal regions for a source, with the fraction of counts coming from other sources constituting the estimated contamination level. We find that the point sources VER J1745–290, G0.9+0.1, and HESS J1746–285 have an estimated contribution to our total integrated flux measurement of the diffuse ridge emission of approximately 10%.
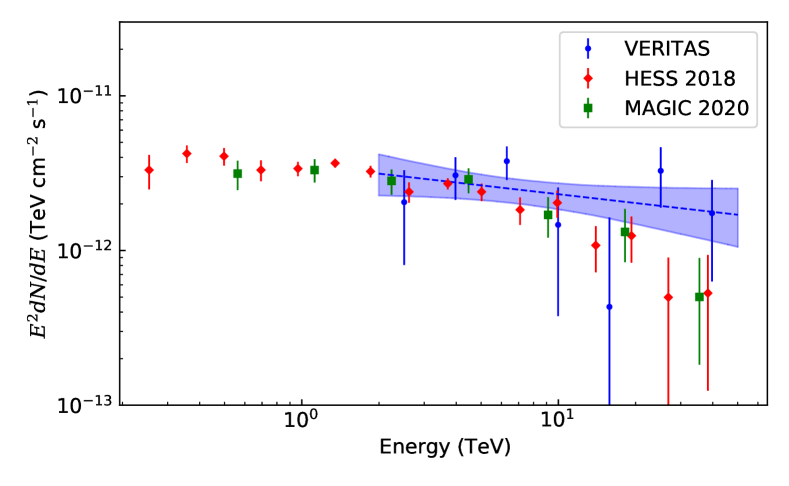
The H.E.S.S. (Abdalla et al., 2018a) and MAGIC (Acciari et al., 2020) measurements of the diffuse ridge spectrum model larger regions than what we use in our analysis. In order to compare our spectra, we can scale up our spectrum to estimate what would be measured in the signal region used by Abdalla et al. (2018a); the flux in this region is also comparable to the measurement of Acciari et al. (2020). Using the same 2D map of the diffuse emission used in the contamination calculation, we calculate the expected flux in the rectangular Abdalla et al. (2018a) signal region, and in the regions used in the present analysis, finding a ratio of 2.7. The scaled diffuse ridge emission differential energy spectrum (that is, the spectrum we measure times 2.7) is shown in Figure 5, with the H.E.S.S. (Abdalla et al., 2018a) and MAGIC (Acciari et al., 2020) spectra.
The spectral index found in this analysis is consistent with the H.E.S.S. index of (Abdalla et al., 2018a) and MAGIC index of , which supports the assumption that the diffuse emission across the ridge all comes from a common mechanism. The index is also harder than the cosmic ray spectrum at Earth, which has an index of about 2.6 to 2.7 at these same energies (Tanabashi et al., 2018), suggesting that the cosmic ray spectrum near the GC is harder than that measured near the Earth. The lack of a significant cut-off in the diffuse ridge emission spectrum is consistent with the presence of a PeVatron Abramowski et al. (2016), though a cutoff below 1 PeV is not excluded by our data. Using the parameterization and assumptions of Kelner & Aharonian (2008), we find that the proton spectrum providing the best fit to our gamma-ray spectrum is a PL with index , and that for an ECPL proton spectrum with spectral index equal to 2.3, the 95% lower limit on the cutoff energy is 0.08 PeV. This index is consistent with Abramowski et al. (2016), who found that their spectrum was best fit using a power-law proton spectrum with index .
With greater statistics, the relationship between the spectral index and distance from the Galactic Center could be studied, which could give an indication of the composition of cosmic rays responsible for the diffuse emission. For example, if protons are primarily responsible for the diffuse emission, a lack of softening in the spectrum as distance from the Galactic Center increases would be observed, as high-energy protons do not lose their energy as fast as electrons during diffusion. Investigations into any potential variability of the flux of diffuse emission could also provide more information about the emission mechanism and possible past activity in the region.
6 Other Sources in the CMZ
In this VERITAS analysis, we studied multiple additional point sources in the CMZ. These include the SNR G0.9+0.1, HESS J1746–285, and H.E.S.S. sources J1745–303 and J1741–302.
6.1 SNR G0.9+0.1
The second brightest VHE point source we identify in the GC region is VER J1747–281, which is associated with the composite SNR G0.9+0.1. A close-up significance map of G0.9+0.1 is shown in Figure 6. G0.9+0.1 is detected with a significance of at the best-fit position of (l, b) = (, ). The statistical and systematic uncertainty on each coordinate are and , respectively.
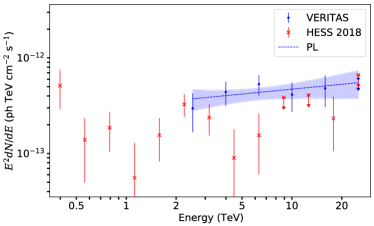
The differential energy spectrum of SNR G0.9+0.1 is shown in Figure 7, with the H.E.S.S spectrum (Abdalla et al., 2018c). The best fit to the joint spectrum is a PL with a spectral index of and flux normalization of at 5.3 TeV. The PL provides a good fit, with a /d.o.f. of 2.28/3, corresponding to a -value of 0.52.
6.2 HESS J1746–285
Archer et al. (2016) identified an excess in their significance map adjacent to VER J1745–290 which they named VER J1746–289, indicated in Figure 1. The position of VER J1746–289 is inconsistent with the positions of nearby sources HESS J1746–285 (Abdalla et al., 2018a) and MAGIC J1746.4–2853 (Ahnen et al., 2017). The position reported by Archer et al. (2016) is biased due to not accounting for the diffuse ridge emission, so we proceed using the position of HESS J1746–285, due to the more detailed modeling done by Abdalla et al. (2018a).
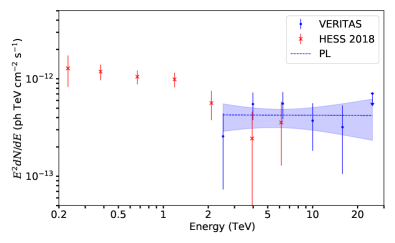
The differential energy spectrum extracted from a region around the position of HESS J1746–285 is shown in Figure 8, with the corresponding intrinsic spectrum from Abdalla et al. (2018a). Our spectrum includes contributions from the central source and the diffuse emission. The best fit to the joint spectrum is a PL with a spectral index of and flux normalization of at 5.3 TeV. The PL provides an adequate fit, with a /d.o.f. of 1.21/3, corresponding to a -value of 0.75. H.E.S.S. and MAGIC find consistent, though softer spectral indices of and , respectively (Abdalla et al., 2018a; Acciari et al., 2020). Following a similar procedure to the diffuse ridge emission contamination calculation, we find that other sources have an estimated contribution to our total integrated flux measurement of HESS J1746–285 of approximately 50%, inhibiting comparisons to the H.E.S.S. and MAGIC results.
The source’s position coincides with a Fermi-LAT source (4FGL J1746.4-2852; Abdollahi et al., 2020) and the Galactic radio arc (Yusef-Zadeh et al., 1984, 2004), as noted by Archer et al. (2016). An extrapolation of the log-parabolic spectrum of 4FGL J1746.4-2852 lies well below our VHE spectrum, suggesting a different origin of the emission, even if the sources are associated. Pohl (1997) proposed that inverse-Compton scattering of far infrared radiation by electrons in the radio arc may be responsible for the MeV to GeV emission, and this scenario may produce TeV emission as well. (Abdalla et al., 2018a) consider PWN candidate G0.13–0.11 (Wang et al., 2002) to be the most likely counterpart.
6.3 HESS J1741–302 and HESS J1745–303
The extended H.E.S.S. sources HESS J1745–303 and HESS J1741–302 fall within the FoV of VERITAS GC observations. HESS J1745–303 is located at Galactic coordinates (l, b) = (, ), which is near in proximity to the shell-like SNR G359.1–0.5. Emission from J1745303 is consistent with the model in which the particles accelerated to high energies by the SNR interact with dense matter. While some excess signal is seen by VERITAS near HESS J1745–303 (with a statistical significance of about ), it is not strong enough to usefully characterize the source. Little excess is seen in the HESS J1741–302 region, however the acceptance this far from Sgr A* is around half of the maximum acceptance.
7 Summary and Conclusions
| Source | Best Spectral Fit | Fit Parameters | Conclusions |
|---|---|---|---|
| VER J1745–290 | power law with | Consistent with PWN because of | |
| exponential cutoff | TeV | cutoff and lack of variability | |
| Diffuse emission | power law |
Consistent with a hadronic
accelerator to PeV energies |
|
| SNR G0.9+0.1 | power law | Consistent with SNR | |
| HESS J1746–285 | power law | Unidentified |
A summary of results from this analysis is shown in Table 2. The results are a major improvement over previous VERITAS papers on the GC region due to the use of additional data and advanced analysis techniques. The estimated positions of the VHE point sources detected by VERITAS in this analysis are consistent with previous results, from both VERITAS and H.E.S.S. The positional uncertainty of the central source VER J1745–290 is too large to exclude Sgr A East or G359.95–0.04 as counterparts to the source.
Increased statistics on the high end of the energy spectrum of VER J1745–290 show evidence of a cutoff or break energy around 10 TeV, consistent with H.E.S.S. and MAGIC Abdalla et al. (2018a); Acciari et al. (2020). A cutoff is predicted by leptonic models such as inverse-Compton models (e.g. Aharonian & Neronov, 2005), plerion models (e.g. Atoyan & Dermer, 2004; Kusunose & Takahara, 2012), and pair absorption, which is especially significant 10 TeV (Porter et al., 2018). A cutoff at this energy is also consistent with the emission of SNRs and PWNe, most of which cut off between 10 and 20 TeV. The low value of the cutoff energy could possibly indicate that the magnetic fields in this source are very strong causing a high rate of electron cooling.
No variability of the flux of VER J1745–290 was observed for timescales of days to years. PWNe are not known to exhibit variable behavior, so are consistent with the data, although the weak constraints on variability due to the low counting statistics do not allow for strong conclusions concerning the nature of the source.
We have produced the first spectrum of the diffuse emission in the GC region as determined by VERITAS. The diffuse emission observed by VERITAS, in contrast to the central source VER J1745–290, does not show any evidence of a cutoff, maintaining a hard power law up to 40 TeV. The lack of a cutoff in the spectrum supports the case for the presence of an accelerator of PeV cosmic ray particles in the GC.
The total energy for the flux of radiation in the region could have been supplied by a large supernova event in the past. The energy flux is also consistent with a population of to millisecond pulsars with luminosities above erg s-1 and modest acceleration efficiencies scattered throughout the CMZ (Guépin et al., 2018). Further observations by a VHE gamma-ray telescope with an angular resolution better than VERITAS should be able to provide evidence for, or against, steady-state hadronic models based on the observed morphology of the TeV emission.
The major new worldwide project in the VHE gamma-ray waveband is the Cherenkov Telescope Array (CTA; Acharya et al., 2019). CTA will offer substantially improved sensitivity, a wider energy range and improved angular resolution (below above 1 TeV) compared to the existing IACTs. In addition, CTA is expected to have a systematic pointing uncertainty of less than which could be sufficiently precise to distinguish between Sgr A* and PWN G395.95–0.04 as the source of gamma rays from J1745–290.
Pushing the spectral reconstruction of both J1745–290 and the diffuse component to higher energies will be important to better determine the relevant acceleration processes. With its much larger collection area, CTA will have an energy reach out to 100 TeV and beyond. Flares, if they occur in the VHE band, will be much more likely to be detected by CTA with its greatly improved sensitivity.
A spatial correlation between TeV neutrinos and diffuse gamma rays could strengthen the hadronic scenario of diffuse emission in the CMZ. Data from experiments such as IceCube (Aartsen et al., 2017) could possibly produce such a result in the future.
8 Acknowledgments
This research is supported by grants from the U.S. Department of Energy Office of Science, the U.S. National Science Foundation and the Smithsonian Institution, by NSERC in Canada, and by the Helmholtz Association in Germany. This research used resources provided by the Open Science Grid, which is supported by the National Science Foundation and the U.S. Department of Energy’s Office of Science, and resources of the National Energy Research Scientific Computing Center (NERSC), a U.S. Department of Energy Office of Science User Facility operated under Contract No. DE-AC02-05CH11231. We acknowledge the excellent work of the technical support staff at the Fred Lawrence Whipple Observatory and at the collaborating institutions in the construction and operation of the instrument.
A portion of our support came from these awards from the National Science Foundation: PHY-1307171, “Particle Astrophysics with VERITAS and Defining Scientific Horizons for CTA” and PHY-1607491, “Particle Astrophysics with VERITAS and Development for CTA.”
| Energy | Flux | Flux Uncertainty | Significance |
|---|---|---|---|
| (TeV) | () | () | () |
| 2.11 | 13.29 | ||
| 2.66 | 15.15 | ||
| 3.35 | 13.61 | ||
| 4.21 | 15.34 | ||
| 5.30 | 11.37 | ||
| 6.68 | 10.30 | ||
| 8.40 | 8.01 | ||
| 10.6 | 8.22 | ||
| 13.3 | 6.53 | ||
| 16.7 | 3.91 | ||
| 21.6 | 3.24 | ||
| 30.9 | 1.65 | ||
| 48.4 | \text | -0.48 |
| Energy | Flux | Flux Uncertainty | Significance |
|---|---|---|---|
| (TeV) | () | () | () |
| 2.51 | 7.60 | ||
| 3.97 | 7.46 | ||
| 6.30 | 7.44 | ||
| 9.98 | 3.31 | ||
| 15.8 | 1.77 | ||
| 25.1 | 3.71 | ||
| 39.7 | 2.24 |
References
- Aartsen et al. (2017) Aartsen, M. G., Ackermann, M., Adams, J., et al. 2017, Journal of Instrumentation, 12, P03012
- Abazajian (2011) Abazajian, K. N. 2011, J. Cosmology Astropart. Phys, 2011, 010
- Abdalla et al. (2018a) Abdalla, H., Abramowski, A., Aharonian, F., et al. 2018a, A&A, 612, A9
- Abdalla et al. (2018b) —. 2018b, A&A, 612, A13
- Abdalla et al. (2018c) —. 2018c, A&A, 612, A1
- Abdollahi et al. (2020) Abdollahi, S., Acero, F., Ackermann, M., et al. 2020, ApJS, 247, 33
- Abeysekara et al. (2020) Abeysekara, A. U., Albert, A., Alfaro, R., et al. 2020, Phys. Rev. Lett., 124, 021102
- Abramowski et al. (2016) Abramowski, A., Aharonian, F., Benkhali, F. A., et al. 2016, Nature, 531, 476
- Acciari et al. (2020) Acciari, V. A., Ansoldi, S., Antonelli, L. A., et al. 2020, arXiv e-prints, arXiv:2006.00623
- Acero et al. (2010) Acero, F., Aharonian, F., Akhperjanian, A. G., et al. 2010, Monthly Notices of the Royal Astronomical Society, 402, 1877
- Acharya et al. (2019) Acharya, B. S., Agudo, I., Al Samarai, I., et al. 2019, Science with the Cherenkov Telescope Array (WSP), arXiv:1709.07997
- Ackermann et al. (2017) Ackermann, M., Ajello, M., Albert, A., et al. 2017, ApJ, 840, 43
- Aharonian & Neronov (2005) Aharonian, F., & Neronov, A. 2005, ApJ, 619, 306
- Aharonian & Neronov (2005) Aharonian, F., & Neronov, A. 2005, Ap&SS, 300, 255
- Aharonian et al. (2001) Aharonian, F., Akhperjanian, A., Barrio, J., et al. 2001, A&A, 370, 112
- Aharonian et al. (2004) Aharonian, F., Akhperjanian, A., Aye, K.-M., et al. 2004, Astroparticle Physics, 22, 109
- Aharonian et al. (2005) Aharonian, F., Akhperjanian, A. G., Aye, K.-M., et al. 2005, Astronomy and Astrophysics, 432, L25
- Aharonian et al. (2006a) Aharonian, F., Akhperjanian, A. G., Bazer-Bachi, A. R., et al. 2006a, Nature, 439, 695
- Aharonian et al. (2006b) —. 2006b, Physical Review Letters, 97, 221102
- Aharonian et al. (2006c) Aharonian, F., Akhperjanian, A. G., Bazer‐Bachi, A. R., et al. 2006c, ApJ, 636, 777
- Aharonian et al. (2009) Aharonian, F., Akhperjanian, A. G., Anton, G., et al. 2009, Astronomy and Astrophysics, 503, 817
- Ahnen et al. (2017) Ahnen, M. L., Ansoldi, S., Antonelli, L. A., et al. 2017, Astronomy and Astrophysics, 601, 11
- Akerlof et al. (1991) Akerlof, C. W., Cawley, M. F., Chantell, M., et al. 1991, ApJ, 377, L97
- Albert et al. (2006) Albert, J., Aliu, E., Anderhub, H., et al. 2006, ApJ, 638, L101
- Albert et al. (2008) —. 2008, Nuclear Instruments and Methods in Physics Research, Section A: Accelerators, Spectrometers, Detectors and Associated Equipment, 588, 424
- Aliu et al. (2012) Aliu, E., Archambault, S., Arlen, T., et al. 2012, ApJ, 754, 77
- Antcheva et al. (2009) Antcheva, I., Ballintijn, M., Bellenot, B., et al. 2009, Computer Physics Communications, 180, 2499
- Archer et al. (2014) Archer, A., Barnacka, A., Beilicke, M., et al. 2014, ApJ, 790, 149
- Archer et al. (2016) Archer, A., Benbow, W., Bird, R., et al. 2016, ApJ, 821, 129
- Atoyan & Dermer (2004) Atoyan, A., & Dermer, C. D. 2004, ApJ, 617, L123
- Atwood et al. (2009) Atwood, W. B., Abdo, A. A., Ackermann, M., et al. 2009, ApJ, 697, 1071
- Ballantyne et al. (2011) Ballantyne, D. R., Schumann, M., & Ford, B. 2011, Monthly Notices of the Royal Astronomical Society, 410, no
- Bartels et al. (2016) Bartels, R., Krishnamurthy, S., & Weniger, C. 2016, Physical Review Letters, 116, 051102
- Bednarek & Sobczak (2013) Bednarek, W., & Sobczak, T. 2013, Monthly Notices of the Royal Astronomical Society: Letters, 435, L14
- Belikov et al. (2012) Belikov, A. V., Zaharijas, G., & Silk, J. 2012, Phys. Rev. D, 86, arXiv:1207.2412
- Berge et al. (2006) Berge, D., Funk, S., & Hinton, J. A. 2006, Astronomy & Astrophysics, 631, 1
- Bergström et al. (2005a) Bergström, L., Bringmann, T., Eriksson, M., & Gustafsson, M. 2005a, Physical Review Letters, 95, 241301
- Bergström et al. (2005b) —. 2005b, Physical Review Letters, 94, 131301
- Boehle et al. (2016) Boehle, A., Ghez, A. M., Meyer, L., et al. 2016, ApJ, 830, 1
- Brandt & Kocsis (2015) Brandt, T. D., & Kocsis, B. 2015, Astrophysical Journal, 812, arXiv:1507.05616
- Buchovecky (2019) Buchovecky, M. 2019, PhD thesis, University of California, Los Angeles, Los Angeles, CA, https://inspirehep.net/literature/1763558
- Buckley et al. (1998) Buckley, J. H., Akerlof, C. W., Carter-Lewis, D. A., et al. 1998, A&A, 329, 639
- Buschmann et al. (2020) Buschmann, M., Rodd, N. L., Safdi, B. R., et al. 2020, Phys. Rev. D, 102, 023023
- Carlson & Profumo (2014) Carlson, E., & Profumo, S. 2014, Phys. Rev. D, 90, 023015
- Cembranos et al. (2013) Cembranos, J., Gammaldi, V., & Maroto, A. 2013, Journal of Cosmology and Astroparticle Physics, 2013, 051
- Cembranos et al. (2012) Cembranos, J. A., Gammaldi, V., & Maroto, A. L. 2012, Phys. Rev. D, 86, 103506
- Chernyakova et al. (2011) Chernyakova, M., Malyshev, D., Aharonian, F. A., Crocker, R. M., & Jones, D. I. 2011, ApJ, 726, 60
- Daylan et al. (2016) Daylan, T., Finkbeiner, D. P., Hooper, D., et al. 2016, Physics of the Dark Universe, 12, 1
- Fatuzzo & Melia (2012) Fatuzzo, M., & Melia, F. 2012, ApJLetters, 757, L16
- Fujita et al. (2017) Fujita, Y., Murase, K., & Kimura, S. S. 2017, Journal of Cosmology and Astroparticle Physics, 2017, arXiv:1604.00003
- Gaggero et al. (2015) Gaggero, D., Taoso, M., Urbano, A., Valli, M., & Ullio, P. 2015, J. Cosmology Astropart. Phys, 2015, 056
- Gammaldi et al. (2016) Gammaldi, V., Avila-Reese, V., Valenzuela, O., & Gonzalez-Morales, A. X. 2016, Phys. Rev. D, 94, 121301
- Genzel et al. (2010) Genzel, R., Eisenhauer, F., & Gillessen, S. 2010, Reviews of Modern Physics, 82, 3121
- Ghez et al. (2005) Ghez, A. M., Salim, S., Hornstein, S. D., et al. 2005, ApJ, 620, 744
- Ghez et al. (2003) Ghez, A. M., Duchêne, G., Matthews, K., et al. 2003, ApJ, 586, L127
- Gillessen et al. (2009) Gillessen, S., Eisenhauer, F., Trippe, S., et al. 2009, ApJ, 692, 1075
- Guépin et al. (2018) Guépin, C., Rinchiuso, L., Kotera, K., et al. 2018, The Journal of Cosmology and Astroparticle Physics, 2018, 42
- Guo et al. (2013) Guo, Y.-Q., Yuan, Q., Liu, C., & Li, A.-F. 2013, Journal of Physics G: Nuclear and Particle Physics, 40, 065201
- Hillas (1985) Hillas, A. M. 1985, in Goddard Space Flight Center 19th Intern. Cosmic Ray Conf., Vol. 3, 445–448
- Hinton & Aharonian (2007) Hinton, J. A., & Aharonian, F. A. 2007, ApJ, 657, 302
- Hoecker et al. (2007) Hoecker, A., Speckmayer, P., Stelzer, J., et al. 2007, arXiv e-prints, physics/0703039
- Hofmann et al. (1999) Hofmann, W., Jung, I., Konopelko, A., et al. 1999, Astroparticle Physics, 12, 135
- Hooper & Goodenough (2011) Hooper, D., & Goodenough, L. 2011, Physics Letters B, 697, 412
- Hörandel (2003) Hörandel, J. R. 2003, Astroparticle Physics, 19, 193
- Horns (2005) Horns, D. 2005, Physics Letters, Section B: Nuclear, Elementary Particle and High-Energy Physics, 607, 225
- Jones et al. (2011) Jones, P. A., Burton, M. G., Tothill, N. F. H., & Cunningham, M. R. 2011, Monthly Notices of the Royal Astronomical Society, 411, 2293
- Kelner & Aharonian (2008) Kelner, S. R., & Aharonian, F. A. 2008, Phys. Rev. D, 78, 034013
- Konopelko et al. (1999) Konopelko, A., Aharonian, F., Hemberger, M., et al. 1999, Journal of Physics G Nuclear Physics, 25, 1989
- Kosack et al. (2004) Kosack, K., Badran, H. M., Bond, I. H., et al. 2004, ApJ, 608, L97
- Krause et al. (2017) Krause, M., Pueschel, E., & Maier, G. 2017, Astroparticle Physics, 89, 1
- Krawczynski et al. (2006) Krawczynski, H., Carter-Lewis, D. A., Duke, C., et al. 2006, Astroparticle Physics, 25, arXiv:0604508
- Kusunose & Takahara (2012) Kusunose, M., & Takahara, F. 2012, ApJ, 748, 34
- Lacroix et al. (2016) Lacroix, T., Silk, J., Moulin, E., & Bœhm, C. 2016, Phys. Rev. D, 94, 123008
- Leane & Slatyer (2019) Leane, R. K., & Slatyer, T. R. 2019, Physical Review Letters, 123, 241101
- Lee et al. (2016) Lee, S. K., Lisanti, M., Safdi, B. R., Slatyer, T. R., & Xue, W. 2016, Physical Review Letters, 116, 051103
- Lessard et al. (2001) Lessard, R. W., Buckley, J. H., Connaughton, V., & Le Bohec, S. 2001, Astroparticle Physics, 15, 1
- Li & Ma (1983) Li, T. P., & Ma, Y. Q. 1983, ApJ, 272, 317
- Linden et al. (2012) Linden, T., Lovegrove, E., & Profumo, S. 2012, ApJ, 753, 41
- Macias et al. (2018) Macias, O., Gordon, C., Crocker, R. M., et al. 2018, Nature Astronomy, 2, 387
- Malyshev et al. (2015) Malyshev, D., Chernyakova, M., Neronov, A., & Walter, R. 2015, Astronomy & Astrophysics, 582, A11
- Morris & Serabyn (1996) Morris, M., & Serabyn, E. 1996, Annual Review of Astronomy and Astrophysics, 34, 645
- Ohm et al. (2009) Ohm, S., van Eldik, C., & Egberts, K. 2009, Astroparticle Physics, 31, 383
- Petrović et al. (2014) Petrović, J., Serpico, P. D., & Zaharijaš, G. 2014, Journal of Cosmology and Astroparticle Physics, 2014, 052
- Pohl (1997) Pohl, M. 1997, A&A, 317, 441
- Porter et al. (2018) Porter, T. A., Rowell, G. P., Jóhannesson, G., & Moskalenko, I. V. 2018, Phys. Rev. D, 98, 041302
- Profumo (2005) Profumo, S. 2005, Phys. Rev. D, 72, 103521
- Read et al. (2011) Read, A. M., Rosen, S. R., Saxton, R. D., & Ramirez, J. 2011, Astronomy & Astrophysics, 534, A34
- Reid & Brunthaler (2004) Reid, M. J., & Brunthaler, A. 2004, ApJ, 616, 872
- Rodríguez-Ramírez et al. (2019) Rodríguez-Ramírez, J. C., de Gouveia Dal Pino, E. M., & Alves Batista, R. 2019, ApJ, 879, 6
- Schödel et al. (2002) Schödel, R., Ott, T., Genzel, R., et al. 2002, Nature, 419, 694
- Şentürk (2011) Şentürk, G. D. 2011, in International Cosmic Ray Conference, Vol. 9, International Cosmic Ray Conference, 127
- Sommers & Elbert (1987) Sommers, P., & Elbert, J. W. 1987, Journal of Physics G Nuclear Physics, 13, 553
- Spengler (2015) Spengler, G. 2015, Astroparticle Physics, 67, 70
- Tanabashi et al. (2018) Tanabashi, M., Hagiwara, K., Hikasa, K., et al. 2018, Phys. Rev. D, 98, 30001
- Tsuboi et al. (1999) Tsuboi, M., Handa, T., & Ukita, N. 1999, ApJS, 120, 1
- Tsuchiya et al. (2004) Tsuchiya, K., Enomoto, R., Ksenofontov, L. T., et al. 2004, ApJ, 606, L115
- van Eldik (2015) van Eldik, C. 2015, Astroparticle Physics, 71, 45
- Wang et al. (2002) Wang, Q. D., Lu, F., & Lang, C. C. 2002, ApJ, 581, 1148
- Wang et al. (2006) Wang, Q. D., Lu, F. J., & Gotthelf, E. V. 2006, Monthly Notices of the Royal Astronomical Society, 367, 937
- Yusef-Zadeh et al. (2004) Yusef-Zadeh, F., Hewitt, J. W., & Cotton, W. 2004, ApJS, 155, 421
- Yusef-Zadeh et al. (1984) Yusef-Zadeh, F., Morris, M., & Chance, D. 1984, Nature, 310, 557
- Yusef-Zadeh et al. (2013) Yusef-Zadeh, F., Hewitt, J. W., Wardle, M., et al. 2013, ApJ, 762, 33
- Zitzer & VERITAS Collaboration (2017) Zitzer, B., & VERITAS Collaboration. 2017, in International Cosmic Ray Conference, Vol. 301, 35th International Cosmic Ray Conference (ICRC2017), 769