Confined massive circumstellar shell in type IIL SN 2008fq
Abstract
I explore a phenomenon of the circumstellar H and H absorption lines in the spectrum of luminous type IIL SN 2008fq taken on day 6.8 after the discovery. The absorpion is identified with the radiatively accelerated preshock wind up to km s-1. The required initial luminosity is attributed to the earlier circumstellar interaction with the confined dense shell of . The modelling of similar luminous type IIL SN 1998S based on the same approach results in the comparable shell mass of . More than 1 dex larger mass of the confined dense shell of both SNe IIL compared to that of type IIP supernovae is attributed to the larger progenitor mass of type IIL supernovae.
keywords:
supernovae: general – supernovae: individual: SN 2013fs1 Introduction
Ultimate understanding core collapse supernovae (CCSN) faces two major long-standing problems: the poorly known explosion mechanism and the relation between a certain class of CCSN and a progenitor star. While the first problem is primarily a matter of the collapse and explosion theory, the second is related to the theory of stellar evolution and the interpretation of photometric and spectral observations of CCSN in terms of the progenitor mass. The latter direction includes a growing significance of early spectra of CCSN that reveal in many cases of type II supernovae signature of confined ( cm) dense circumstellar (CS) shell (Chugai, 2001; Quimby et al., 2007; Groh, 2014; Khazov et al., 2016; Yaron et al., 2017). This phenomenon suggests that several years prior to the explosion the mass loss is particularly vigorous that is related probably to the nuclear burning in a mantle of the precollapse core. Shiode & Quataert (2014) have argued that during and after core neon burning, internal gravity waves excited by core convection can transport the energy of nuclear burning out to the stellar envelope causing a robust mass loss.
The study of the confined dense CS shell in SNe IIP might shed light on the final stage of preSN II of different mass that is crucial for the theory of CCSN. Remarkably, in the case of luminous SN 1998S (type IIL) with early CS emissions the confined CS shell is rather massive, (Chugai, 2001), whereas in SN IIP SN 2013fs with the well studied early CS emission lines the mass of the confined dense shell is only (Yaron et al., 2017). The origin of this 30-fold difference is intriguing and may become a clue to the physics of precollapse heavy mass loss of progenitor varieties. Noteworthy, we atribute SN 1998S to SNe IIL despite in some papers it is referred to as SN IIn. The presence of transient CS emission lines in early IIL and IIP supernovae obviously is not a dominant typological property of these supernovae.
Luminous type II SN 2008fq was discovered 2008 March 18.4 (Thrasher et al., 2008) several days after the explosion (Taddia et al., 2013). Authors emphasise the strong similarity between SN 2008fq and SN 1998S, although the early stage of strong CS emission lines has been missing in the former. On day 6.8 after discovery the spectrum shows a blue-shifted H and H absorption with the width of km s-1 (Taddia et al., 2013). These absorptions undoubtedly originate from a dense CS gas; a broad H emission with the blue width at zero intensity (BWZI) of 7500 km s-1 appears later, on day 29 (Taddia et al., 2013). The CS H absorption of SN 2008fq brings to mind a shallow CS H absorption with velocities in the blue wing up to km s-1 in early spectra of SN 1998S, in which case this feature is accompanied by a deep narrow absorption formed in the slow wind with the velocity of km s-1 (Fassia et al., 2001). The low resolution of SN 2008fq spectra ( km s-1) prevents one from the detection of the similar slow wind. The fast CS gas revealed by the H absorption in early spectrum of SN 2008fq presumably has the same origin as that of SN 1998S, viz., a preshock CS gas accelerated by the SN radiation (Chugai et al., 2002).
The velocity of the radiatively accelerated preshock wind has an important diagnostic significance, since it is a measure of the radiation energy emitted between the shock breakout and the moment of the spectral observation. An interesting outcome of this reality is that the radiation energy responsible for the CS preshock acceleration could be powered by the ejecta interaction with a dense CS shell. This prompts us a possibility to employ the CS interaction model in order to probe the confined CS shell. If success, SN 2008fq would become the second SN 1998S-like supernova with the detected confined CS shell.
The proposed goal will be realized here in three steps. In Section 2 we present a general picture of relevant phenomena. The H and H modelling in Section 3 will provide us with the velocity of the preshock gas in SN 2008fq. We then use the CS interaction model to account for the preshock velocity, bolometric light curve and the late time ejecta velocity of SN 2008fq (Section 4). The same modelling will be applied to SN 1998S in order to compare these events in a uniform way.
2 General picture
First three weeks the SN 2008fq spectrum is featureless with low contrast H and H narrow ( km s-1) absorption being most apparent detail apart from superimosed H II region emission lines (Taddia et al., 2013). The sketch (Fig. 1) illustrates how this spectrum presumably arises. The opaque thin cold dense shell (CDS) formed between forward and reverse shocks blocks the radiation from SN ejecta; the similar situation is met in SN 1998S (Chugai, 2001). Outside the CDS there is the forward shock and preshock CS wind accelerated by the radiation: this is the site where the H absorption on day 6.8 does form. The slow wind of the red supergiant (RSG) preSN lies further out. The reliable value of the preshock velocity will be inferred in the next section based on the modelling of the observed H and H avsorptions in the SN 2008fq.

The preshock acceleration at the radius due to the radiative force is , where is the opacity dominated by the Thomson scattering, is the radiative supernova luminosity, and is speed of light. The contribution of the line opacity into the radiative force with respect to the Thomson scattering for the CS density of g cm-3 in the case of SN 1998S turns out to be (Chugai et al., 2002). This parameter gets lower for the larger wind density and shows a weak sensitivity to the wind temperature in the range of K (Chugai et al., 2002). For and the solar composition the effective opacity is cm2 g-1. Neglecting the CS gas displacement the integration of the equation of motion results in the preshock velocity
| (1) |
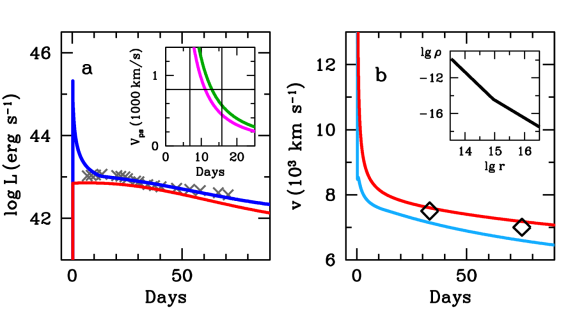
where is the total radiation energy in units of erg emitted from the shock breakout till the certain age, is the radius in units of cm. On day 6.8 the photosphere radius is cm (Taddia et al., 2013), so the preshock velocity of km s-1 for requires erg.
The required radiation energy is too large compared the expected for the exploding RSG of well studied SN IIP. In the case of the luminous type IIP SN 2004et with the explosion energy of erg the energy radiated during first 10 days is only erg (Utrobin & Chugai, 2009). This suggests that the additional luminosity related to the CS interaction at the early stage of SN 2008fq should be dominant. Given the radical consequences for the early luminosity suggested by value, the CS interaction model (Section 4) will be constrained also by the observational bolometric luminosity and the maximal ejecta velocity at the later stage.
3 Preshock velocity from H and H absorptions
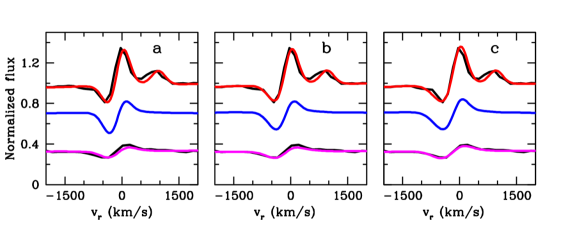
The model for the H formation is a specified version of the cartoon in Figure 1. The photosphere that coincides with the CDS () is encircled by the hot postshock layer with the forward shock radius . The expansion of SN ejecta with a homologous kinematics () and the density occurs self-similarly in a steady wind () with (Chevalier, 1982a). At the considered phase the forward shock is partially radiative, so the postshock layer should be thiner; we adopt . Fortunately the H absorption profile is not sensitive to this ratio. The radiatively accelerated preshock wind expands with the kinematics
| (2) |
in line with the equation (1), where is the velocity of the unperturbed wind adopted to be 40 km s-1 following SN 1998S.
The radiation transfer is calculated based on the Monte Carlo technique that takes into account continuum scattering in the CS gas, recombination H emissivity, resonant scattering, and Thomson scattering on thermal electrons with the angle-averaged frequency redistribution function (Hummer & Mihalas, 1967). The line photon scattering at a certain resonant point is treated in the Sobolev approximation. Yet the overall line photon scattering in the accelerated wind is essentially a non-local process, in contrast to the Sobolev approximation. Indeed, we take into account that for the kinematics of equation (2) there can be two resonant points along some rays. Besides, the photon scattering off electrons with the thermal frequency redistribution can result in the additional resonant scattering at different point, if the scattered photon acquires a blueshift in the comoving frame.
The wind electron temperature is assumed to be constant and equal to the photospheric temperature. The hydrogen ionization and the 2-nd level excitation is calculated using nebular Saha-Boltzman equation. For the H line only the scattered emission is taken into account, whereas for the H the net emissivity (recombination Case C) is included. This is done to check weather the electron number density and the related Thomson optical depth are consistent with the CS interaction model. In fact, as will be shown, the net H emissivity turns out to be negligible compared to the scattered continuum radiation.
The adopted wind density parameter g cm-1 is implied by the interaction model (Section 4); in this case the Thomson optical depth outside the forward shock on day 6.8. The line photon can scatter in the hot postshock layer that is assumed to be uniform with the density being four times of the preshock density. Photons scattered on hot electrons are asumed to be lost since a scattered photon either strikes the absorbing photosphere or escapes the layer in the far wings due to the high electron thermal velocity of km s-1.
The model H and H profiles are shown for cases equal to 600 km s-1, 800 km s-1, and 1000 km s-1 (Figure 2). The computed spectrum is convolved with the Gaussian FWHM = 9.2Å in order to take into account the spectral resolution estimated from H II region H and [N II] 6584 Å lines. The nebular lines with Gaussian profiles and the ratio H/[N II] = 2 indicated by the spectrum on day 71 are superimposed on the computed H. Remarkably, the adopted line ratio is consistent with the median value for the sample of giant H II regions in the ordinary spiral galaxy (Brière et al., 2012). The case of km s-1 is apparently preferred (Fig. 2). Noteworthy, the H is dominated by the scattering of the continuum radiation with the negligible contribution of the recombination emission. Interestingly, despite the simplified treatment of ionization and excitation, the required electron temperature 12800 K is comparable to the potospheric value of K estimated from the blackbody continuum fit (Taddia et al., 2013).
I do not consider in detail an alternative possibility that an energetic dynamic process could eject with high velocities, up to 800 km s-1. This option was already discussed in the case of SN 1998S (Chugai et al., 2002) and was abandoned. The point is that the violent ejection results in the ejecta kinematics of , in which case one expects an increasing absorption velocity with time, in contrast to the observed velocity decrease (Fassia et al., 2001). Unfortunately, in the case of SN 2008fq the evolution of the absorption velocity in H and H cannot be followed based on the available spectra (Taddia et al., 2013), so formally one cannot rule out the energetic ejection. The scenario of the accelerated slow wind is accepted here based on the strong similarity between SN 2008fq and SN 1998S emphasised by Taddia et al. (2013).
4 CS interaction and preshock acceleration
A question arises, what the early luminosity of SN 2008fq should be to account for the preshock CS velocity of 800 km s-1 on day 6.8 after the discovery? The order of magnitude estimate (Section 3) indicates that the radiated energy at the initial stage should be very large in order to provide the required preshock acceleration. I propose therefore that the early luminosity is powered by the CS interaction.
The CS interaction is treated based on the thin shell hydrodynamic approximation (Chevalier, 1982b), in which ejecta and the CS gas shocked in the reverse and forward shocks, respectively, form a thin shell. Equations of motion and mass conservation are solved numerically. Following approximation adopted earlier (Chugai, 2018) the luminosity of the reverse and forward shock at the age is calculated as the shock kinetic luminosity (where is the forward shock radius, is the preshock CS density and the forward shock speed) multiplied by the radiation efficiency , where the cooling time is calculated for the postshock density being four times of the preshock density and assuming electron-ion equilibration. The optical luminosity is equal to the luminosity of both shocks corrected for the escaping X-ray luminosity, whereas for the preshock acceleration we use the total radiation of both shocks.
The model for the optical luminosity includes also the luminosity powered by the explosion and the radioactive decay of 56Ni. This component is calculated using the Arnett (1980) analytical description of the light curve. The adopted 56Ni mass is 0.17 , comparable to 0.15 inferred for SN 1998S (Fassia et al., 2000). The large amount of 56Ni is supported by the presence of broad absorption lines of Na I and Ca II infrared triplet in the latest spectrum on day 71 (Taddia et al., 2013). This argument is based on the fact that ejecta absorption lines require an internal energy source that serves as a background continuum radiation. In the presence of both the internal and external (CS interaction) energy source, the former should be comparable to the CS interaction luminosity for the broad absorption line to be pronounced. This can be illustrated using an approximate expression for the relative depth of the SN broad absorption , where is the monochromatic quasi-continuum flux powered by the CS interaction, is the monochromatic quasi-continuum flux related to the internal source, and is the Sobolev optical depth. In the extreme case, when the (e.g., SNe IIn) the SN spectrum does not show broad absorption lines.
The assumed density distribution of SN ejecta is with and parameters , set by the ejecta mass and kinetic energy . The model luminosity, CDS velocity, and the CDS radius are determined only by the CS density and the SN density in external layers (). The ejecta density distribution in outer layers is invariant for the mass and energy obeyed the relation or in the case of .
For the adopted ejecta mass of 10 the model that meets constraints from the preshock velocity, bolometric light curve, and maximal velocity inferred from the broad H emission on days 29 and 71 suggests the kinetic energy erg and the wind density g cm-1 at cm (Fig. 3). The inner zone cm forms the CS shell with the mass and the density . It is the ejecta interaction with this shell that provides the most of the radiation energy responsible for the radiative acceleration of the CS gas up to 800 km s-1 at 10-13 days after the explosion. This time span between the explosion and the spectral observation (Fig. 3, panel a, inset) is obtained for the accepted model assuming the lines opacity contribution into the radiative force and . The H recombination luminosity of the ionized wind on day 6.8 for the temperature of 12000 K is erg s-1. This value is consistent with the negligible contribution of the H net emission suggested by the H model (Section 3).
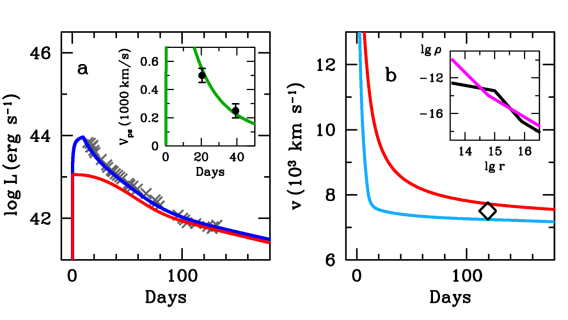
The similar modelling is performed for SN 1998S (Fig. 4) with the bolometric light curve from Fassia et al. (2000), and velocities from Fassia et al. (2001). We adopt the ejecta mass of 10 and 56Ni mass of 0.15 . The required kinetic energy erg turns out to be a factor of 1.6 higher compared to SN 2008fq, while the distant wind is more rarefied, g cm-1 at cm. This external wind density parameter coincides with the estimate based on the radio evolution (Pooley et al., 2002). The confined CS shell mass at cm is that coincides with the previous estimate (Chugai, 2001) recovered from effects of the Thomson scattering on thermal electron and the light curve modelling.
5 Discussion and Conclusions
The study has been aimed at the extraction of the information on the close CS environment of SN 2008fq based on the detected H and H CS absorption in early spectrum. We identify these absorpions with the radiatively accelerated preshock wind. The required radiation for this acceleration is found to be powered by the ejecta interaction with the confined CS shell ( cm) containing 0.08 . The similar modelling has been performed for the luminous type IIL SN 1998S in which case we find the mass of the CS shell of 0.1 in line with the previous estimate (Chugai, 2001).
Remarkably, the confined CS shell in the well studied type IIP SN 2013fs (Yaron et al., 2017) contains only , more than 1 dex lower compared to the CS shell mass in both SNe IIL. The large difference indicates that dynamic processes at the neon burning stage in SNe IIL are more powerful compared to SNe IIP. Note that the distant wind in both SNe IIL ( g cm-1) is also significantly denser compared to the wind in SNe IIP ( g cm-1) (Chevalier et al., 2006; Chugai et al., 2007). A guiding parameter responsible for the mass loss difference between SNe IIL and SNe IIP might be the progenitor mass.
Indeed, for the RSG mass loss driven by the radiation pressure the energy conservation implies , where is speed of light, is assumed to be close to the initial progenitor mass, is a fudge factor. Since the wind velocity is of the order of the escape velocity one gets then . On the vs. diagram the RSG stars occupy a narrow range of temperatures around K (Massey et al., 2020). For the fixed combined with the relation suggested by the massive star evolutiom in the range of 15 - 25 (Meynet et al., 2015) one obtains . This supports the general view that the RSG wind density increases with the progenitor mass.
Recently (Beasor et al., 2020) inferred phenomenological relation between mass loss rate, RSG luminosity, and the initial star mass . Using the evolutionary relation and above assumptions concerning RSG values of and one gets the relation , which suggests the power law with in the mass range of 20 - 25 .
Both relations taken together with the wind parameter indicate that progenitors of SNe IIL are more massive compared to those of SNe IIP. This in turn is consistent with larger 56Ni mass ( ) of both SNe IIL compared to the range of that is characteristic of SNe IIP (cf. Utrobin & Chugai, 2019) and also is in line with the correlation between 56Ni mass and the progenitor mass of CCSNe (Hamuy, 2003). Currently, SN 2008fq and SN 1998S are the only luminous SNe IIL, for which the 56Ni mass is estimated based on the modelling the bolometric light curve with both the CS interaction and the radioactive power taken into account. The conjecture on the high 56Ni mass in luminous SNe IIL, therefore, requires further confirmation.
Acknowledgements
I am grateful to Nando Patat for usefull discussions of early spectra of SN 2008fq.
Data Availability
Data available on request
References
- Arnett (1980) Arnett W. D., 1980, ApJ, 237, 541
- Beasor et al. (2020) Beasor E. R., Davies B., Smith N., van Loon J. T., Gehrz R. D., Figer D. F., 2020, MNRAS, 492, 5994
- Brière et al. (2012) Brière É., Cantin S., Spekkens K., 2012, MNRAS, 425, 261
- Chevalier (1982a) Chevalier R. A., 1982a, ApJ, 258, 790
- Chevalier (1982b) Chevalier R. A., 1982b, ApJ, 259, 302
- Chevalier et al. (2006) Chevalier R. A., Fransson C., Nymark T. K., 2006, ApJ, 641, 1029
- Chugai (2001) Chugai N. N., 2001, MNRAS, 326, 1448
- Chugai (2018) Chugai N. N., 2018, MNRAS, 481, 3643
- Chugai et al. (2002) Chugai N. N., Blinnikov S. I., Fassia A., Lundqvist P., Meikle W. P. S., Sorokina E. I., 2002, MNRAS, 330, 473
- Chugai et al. (2007) Chugai N. N., Chevalier R. A., Utrobin V. P., 2007, ApJ, 662, 1136
- Fassia et al. (2000) Fassia A., et al., 2000, MNRAS, 318, 1093
- Fassia et al. (2001) Fassia A., et al., 2001, MNRAS, 325, 907
- Groh (2014) Groh J. H., 2014, Astronomy and Astrophysics, 572, L11
- Hamuy (2003) Hamuy M., 2003, ApJ, 582, 905
- Hummer & Mihalas (1967) Hummer D. G., Mihalas D., 1967, ApJ, 150, L57
- Khazov et al. (2016) Khazov D., et al., 2016, ApJ, 818, 3
- Massey et al. (2020) Massey P., Neugent K. F., Levesque E. M., Drout M. R., Courteau S., 2020, arXiv e-prints, p. arXiv:2011.13279
- Meynet et al. (2015) Meynet G., et al., 2015, A&A, 575, A60
- Pooley et al. (2002) Pooley D., et al., 2002, ApJ, 572, 932
- Quimby et al. (2007) Quimby R. M., Wheeler J. C., Höflich P., Akerlof C. W., Brown P. J., Rykoff E. S., 2007, ApJ, 666, 1093
- Shiode & Quataert (2014) Shiode J. H., Quataert E., 2014, ApJ, 780, 96
- Taddia et al. (2013) Taddia F., et al., 2013, A&A, 555, A10
- Thrasher et al. (2008) Thrasher P., Li W., Filippenko A. V., 2008, Central Bureau Electronic Telegrams, 1507, 1
- Utrobin & Chugai (2009) Utrobin V. P., Chugai N. N., 2009, A&A, 506, 829
- Utrobin & Chugai (2019) Utrobin V. P., Chugai N. N., 2019, MNRAS, 490, 2042
- Yaron & Gal-Yam (2012) Yaron O., Gal-Yam A., 2012, PASP, 124, 668
- Yaron et al. (2017) Yaron O., et al., 2017, Nature Physics, 13, 510