Probing lipid membrane bending mechanics using gold nanorod tracking
Abstract
Lipid bilayer membranes undergo rapid bending undulations with wavelengths from tens of nanometers to tens of microns due to thermal fluctuations. Here, we probe such undulations and the membranes’ mechanics by measuring the time-varying orientation of single gold nanorods (GNRs) adhered to the membrane, using high-speed dark field microscopy. In a lipid vesicle, such measurements allow the determination of the membrane’s viscosity, bending rigidity and tension as well as the friction coefficient for sliding of the monolayers over one another. The in-plane rotation of the GNR is hindered by undulations in a membrane tension dependent manner, consistent with simulations. The motion of single GNRs adhered to the plasma membrane of living cultured cells similarly reveals that membrane’s complex physics and coupling to the cell’s actomyosin cortex.
The plasma membrane of cells, beyond serving as a boundary between intracellular and extracellular spaces, mediates force transmission, and information and material flow between inside and outside, via cytoskeletal adhesion proteins, signal receptor proteins and endocytic and exocytic vesicle formation. This fluidic lipid membrane displays time-dependent local curvature or undulations, which are controlled by its bending modulus, excess area and membrane tension. The complex physics of model lipid membranes, as in giant unilamellar vesicles (GUV) formed of purified lipids, is relatively well understood, having been studied by a variety of techniques [1, 2, 3, 4, 5, 6, 7, 8, 9]. In contrast, the physical properties and dynamics of the plasma membrane of cells are notoriously difficult to measure [10, 11, 12, 13, 14, 15]. Much of this difficulty stems from the membrane being attached to the underlying viscoelastic actin cortex by adhesion proteins, having a mean spacing of a few hundred nanometers—–deformations and undulations on longer lengthscales are simply those of the composite membrane-cortex structure. Nevertheless, it is the undulations of the plasma membrane itself on the lengthscale that couple to vesicle trafficking, membrane curvature and tension sensing as well as membrane protein binding and assembly.
Here we utilize orientational tracking of single gold nanorods (GNRs) to characterize the small lengthscale undulations and nanorheology of reconstituted lipid GUVs and the plasma membrane of cultured cells. While the in-plane rotational motion of anisotropic probes have previously been applied to infer membrane viscosity [16], we exploit precise three-dimensional orientational tracking to access the dynamics of lipid membrane bending undulations. By developing a model for out of plane angular motion of GNRs on GUVs, we determine physicochemical properties of the lipid bilayers including the bending modulus, intermonolayer friction coefficient and membrane tension. The detailed motion of a nanorod on an undulatory membrane is also studied through Monte Carlo simulation. The angular motion of GNRs bound to the plasma membrane of a Huh7 cell is tracked to investigate dynamics of a fluctuating plasma membrane.
We first apply our method to study the membrane dynamics of GUVs with different lipid compositions and at different tensions. Experimentally, we attach GNRs (with nominal length and diameter ) to GUVs having either 1:1 composition of 1,2 dioleoyl-sn-glycero-3-phosphocholine (DOPC) and 1,2-dioleoyl-sn-glycero-3-phospho-L-serine (DOPS), or 1:1:1 composition of DOPS-DOPC-Cholesterol, using magainin 2 peptides. We also change the effective surface tension of the cholesterol GUVs by changing osmolarity of the buffer solution and form both tense and floppy GUVs, see Supplemental Material (SM) for details [17]. We image the GNRs using a custom-built laser-illuminated dark field microscope [22]. We track the centroid, and , of the GNRs over time by particle tracking [23, 24]. Polarimetric analysis of the scattered light from single nanorods allows the reconstruction of the orientation vector of their major axis in 3D space with a precision of about , at several thousand measurements per second. The center coordinates, , and radius, , of the GUVs are determined by phase contrast microscopy.
The experimental 3D trajectories of single GNRs over time , diffusing at different locations on the no-cholesterol GUV is shown in Fig. 1(a), where is the depth of the GNR. The random motions in all three dimensions are Gaussian distributed [17, Fig. S1]). The coordinates of the nanorod orientation and membrane normal are shown in Fig. 1(b), and typical angular trajectories are shown in Fig. 1(c). The translational mean-squared displacement (MSD) of GNRs, on different GUVs are shown in Fig. 1(d), where denotes a time average. The MSD of a particle diffusing over the surface of a sphere is bounded at long times [17], but satisfies for , where is the translational diffusivity, and , and are the translational drag coefficient and thermal energy.
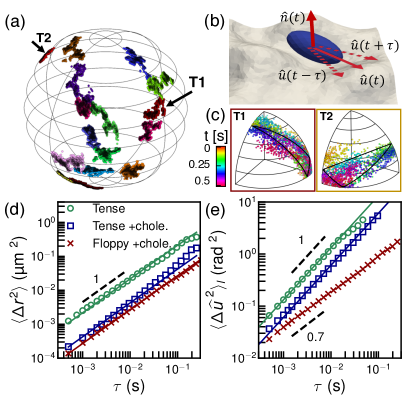
The mean-squared angular displacement (MSAD), , of the GNRs is also measured to determine the in-plane rotational drag coefficient of the rods, . With projected to an octant of the full sphere by the symmetry of our measurement technique [22], the MSAD is also bounded at long times[17]. Using a simple mapping method developed in a previous study [22], the measured MSADs can be converted into unbounded ones, , where , , and is the asymptote value [17, Fig. S2(c)]. For the simple rotational diffusion case, this MSAD then satisfies , where is the rotational diffusivity, and is the rotational drag coefficient.
Fitting the measured MSDs and MSADs yields diffusivities and for single GNRs and their drag coefficients and on different GUVs. In general, these drag coefficients depend on the membrane viscosity, , the size of the nanorod, and the bulk fluid viscosity [25, 16]. For the GNR on the tense GUV without cholesterol, we obtain and . Using a theoretical model for and [26, 25, 27] and assuming a bulk fluid viscosity (see SM [17]), we estimate the membrane viscosity , in good agreement with literature values [28, 16, 29, 30]. This result also indicates that the Saffman-Delbrük length scale, set by the ratio of the membrane and bulk viscosities, , is an order of magnitude larger than the GNR length, ensuring that its motion is dominated by membrane mechanics rather than the bulk fluid [16].
The membrane viscosity of the tense GUV with cholesterol is estimated as which is an order of magnitude larger than of the no-cholesterol GUV. The effect of cholesterol on the fluidity of lipid membranes depends on temperature [31] and lipid composition [32]. While cholesterol increases the fluidity of lipid membranes with saturated or monounsaturated fatty acids tails [32]; it raises the viscosity of unsaturated tail lipids, such as DOPC-DOPS here, by about one order of magnitude [33]. Interestingly, the MSAD of the GNR on the floppy GUV is lower than the same composition tense GUV and shows subdiffusive behavior, Fig. 1(e), which we argue below is due to transient caging by membrane undulations
While a GNR is randomly diffusing over a GUV, the membrane of the GUV also is undergoing thermal undulation causing tilting motion of the nanorods lying prone on the membrane (an orientation that maximizes their adhesion energy). We demonstrate here that the membrane normal direction can be estimated by fitting the time dependent nanorod orientation over a few measurements to a plane, as illustrated in Fig. 1(b), using singular value decomposition [17, Fig. S6(a)]). This approach relies on the fact that in-plane rotational diffusion is typically much faster than the corresponding diffusion of the membrane normal, and is validated using Monte Carlo simulation, [17, Fig. S6(b)].
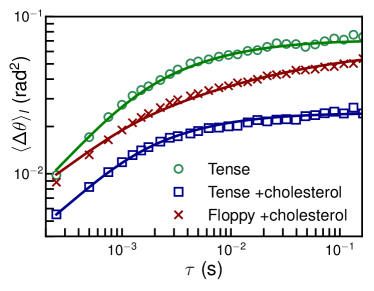
The dynamic fluctuations of the membrane normal can be characterized by the ‘out of plane’ angle between the normal vector and the expected normal if the GUV were a perfect sphere: . The MSDs of this out of plane motion , shown in Fig. 2, reveal dramatic differences in the undulation dynamics among different GUVs. Membrane undulatory dynamics has often been studied by analysing the bending fluctuations of the membranes, for example using optical microscopy. In the long-wavelength (small wavenumber) limit, in the Monge gauge, the spectrum of the height undulations of an elastic membrane varies as . Since angular fluctuations correspond to the slope or derivative of the undulation height function, we expect them to vary as [17]. This suggests that angular measurements, as in our experiment, are far more sensitive to higher wavenumbers than direct height measurements, improving our measurement sensitivity to small amplitude, sub-micron wavelength undulations.
Previous measurements of membrane fluctuations at higher wavenumber, such as small-angle X-ray scattering and neutron spin echo (NSE) spectroscopy [34, 35, 36, 37], have revealed departures from the classical picture of a membrane as a thin fluid sheet coupled to a viscous bulk fluid [38]. At lengthscales closer to the membrane thickness, membrane viscosity and the friction of sliding between the two monolayers act as additional sources of dissipation and leads to a larger effective dynamic bending modulus than that observed in the long wavelength regime [39].
Undulations with different wavelengths relax at different rates, so the lag-time dependence of the normal fluctuations provides information about the amplitude of undulations at different wavelengths. Studies using MD simulation [40, 41, 42] and high-speed video microscopy [43] have shown that the correlation function of the membrane fluctuation relaxes with two q-dependent characteristic rates. The dynamics of long and short wavelengths undulations have different physical origins, and are separated by , where is the compressibility modulus of the lipid bilayer and is the friction coefficient between layers. is the renormalized bending rigidity accounting for the effect of the elastic stretching and compression, where is the bending rigidity, and is the thickness of the lipid layer. At small wave number, , the slow relaxation mode is controlled by bending motion , and the fast mode is driven by intermonolayer friction, . For , however, the slow mode corresponds to the lateral density fluctuation of lipid molecules and intermonolayer friction, , and bulk viscosity quickly relaxes the bending motion with a rate of . For this regime, adapting the Seifert-Langer (SL) model for height correlation function [39], we develop a model for out of plane rotational motion of a GNR [17]
| (1) |
where and are the minimum and the maximum wave numbers set by the size of the GUVs and the GNRs respectively, is the surface tension, and is the measurement error. The asymptotic value of the out of plane displacement is controlled solely by bending rigidity and surface tension,
| (2) |
We use the variance of the measured across multiple measurements to estimate , considering and the correlation function decays to zero at long time. Thus, Eqn. 2 provides a relationship between and .
To model the out of plane motion of our nanorod data, as in Fig. 2, we fit Eqn. 1 to the measured using , , and as free parameters. With this estimate of , we compute the surface tension from Eqn. 2, and iteratively repeat the fitting with updated until the results converge. To limit the number of free parameters in the model, we choose nominal values from the literature for the compressibility modulus and lipid layer thickness [43].
For the GUV with no-cholesterol, we find , , and . The standard error for is estimated from the standard error in determined from more than 10 GNR trajectories with time spans of more than 2 minutes between each measurement. We confirmed the sensitivity of the measurement to the fitting parameters by performing a test [17, Fig. S8]. The values obtained from the fitting agree well with the ranges reported in the literature for [44, 45, 43] and [43, 46, 47, 48, 49]. Adding cholesterol to the lipid composition roughly doubles and triples consistent with literature results [43]. As expected, the floppy GUV shows a low surface tension (comparable to our tension detection limit), while the tense GUV of the same composition shows a roughly larger value .
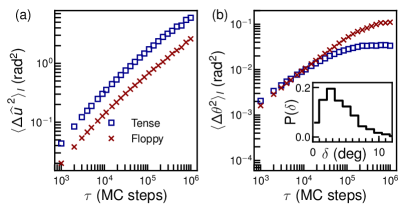
To better understand the complex kinematics of a nanorod moving on membranes with different tensions, we constructed a model GNR-membrane system [17, Fig. S9] based on the dynamically triangulated Monte Carlo (DTMC) method [50]. The model system consists of a patch of membrane bounded by a square frame of length and a GNR represented by an ellipsoidal nanoparticle with nominal dimensions. This mesoscale membrane model uses a continuum approximation of bilayer membranes and computes the elastic energy using Canham-Helfrich Hamiltonian where and are the mean curvatures at each point on the membrane [51]. For the discretization of elastic energy we follow the method developed by Ramakrishnan et al. [52]. In the model system, the GNR is bound to the membrane through a truncated Lennard-Jones potential () between discrete points on the membrane and nanoparticle surfaces. The stochastic movement of the GNR is captured by translational and rotational Monte Carlo moves [17].
The MSAD and MSD of the out of plane motion of the simulated nanoprobe are shown in Fig. 3, for two values of excess membrane area, corresponding to ‘tense’ and ‘floppy’ cases [53, 17, Table S1]). As seen in experiments, the simulated in-plane MSAD of the nanorod anchored on the floppy membrane is fold smaller than that of nanorod on the tense membrane, Fig. 3(a). Examining the simulated membranes [17, moveis S2, Fig. S7] reveals that the nanorod on the floppy membrane is transiently caged in the dynamically evolving valleys of the undulatory membrane leading to a suppression of its in-plane rotational motion, Fig. 3(a). Such a caging effect not only suppresses the motion, but also causes the to be slightly sub-diffusive, consistent with experiments. As expected, the out of plane motion of the nanorods on the floppy membrane has a larger asymptote compared to the one on the tense membrane, Fig. 3(b), due to the larger total amplitude of undulations in the less tense membrane. Moreover, the time-dependent angle between the simulated membrane normal and that inferred from the nanorod motion in the manner we used in experiments confirms the validity of our approach, they differ by just a few degrees.
Rather than GUVs made of purified lipids, the same approach can be used to study the mechanics of the plasma membrane of cultured cells. GNRs bound to Huh7 cells perform 2D random walks on the membrane and stay in focus for more than 5 minutes, [17, Fig. S13](unlike rods in the buffer or engulfed by the cell, that rapidly go out of focus). The orientation data resembles rapid diffusive rotation [17, Fig. S14] in a plane tilted by with respect to the focal plane. Once the mean normal to the plane, , is found, the time-dependent membrane normal vector, , shown in Fig. 1(b), can be computed as before. This can then be decomposed into in-plane, , and out of plane, , angular displacements, where .
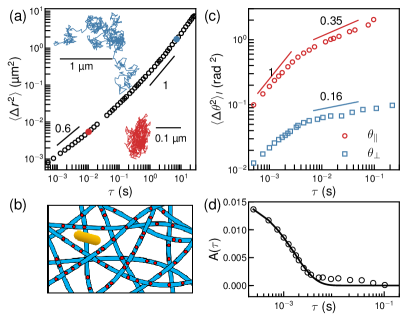
The MSD and a typical trajectory of the GNR at short lag times, Fig. 4(a), reveals subdiffusive motion of GNR. The plasma membrane is tethered to underlying actin filaments by integrin proteins which form a structure akin to ‘picket fences’ surrounding ‘corrals’, Fig. 4(b), [54, 55, 56]. We can interpret the MSD as due to cage diffusion and escape from cages/corrals of variable sizes. The MSD crosses over to purely diffusive motion with at a lengthscale of , comparable to the largest expected corral size [57].
Both and show complex lag-time dependence, Fig. 4(c). As in the GUV, the out of plane fluctuation is much slower than the in-plane diffusion of the GNR. At short lag-time, , the shows a pure diffusive behavior, with the diffusivity comparable with that in a tense pure lipid membrane. At intermediate lag time , however, the rotational motion is subdiffusive consistent with angular caging.
Due to its coupling to the underlying actomyosin cortex, the undulation dynamics of the plasma membrane on long length and timescales is that of the cortex [58]. Indeed, the sub-diffusive exponent of at is consistent with expectations for cortical fluctuations, since the cortex has been shown to have a dynamic shear modulus varying as [59]. At , increases subdiffusively. We can isolate this short-time motion of the membrane by computing the covariance of the out of plane angle of GNR, , Fig. 4(d), which decays exponentially with a relaxation rate of .
Hypothesizing that the short time dynamics of the normal vector is due to plasma membrane undulations, we can create a simple model by integrating Eqn. 1 over a narrow range of wave-numbers, , set by the corral size and the nanorod length, yielding a single exponential decay consistent with our observations, [17]. Using an estimated value of , this provides an estimate of the bending rigidity of the plasma membrane, , roughly a factor of 5 smaller than expected [60].
This too small inferred bending modulus can be readily explained by additional sources of undulation not accounted for by the simple model. For one, the integrins presumably perturb the membrane height, producing a corrugation that leads to dynamic out of plane motion as the nanorod diffuses over it. For another, the presence and diffusion of membrane curvature inducing proteins would also increase the undulation amplitude [61]. Sorting out these multiple contributions will require improved models and future experiments that vary by using different length nanorods.
In conclusion, the nanorod tracking approach we present here enables the reliable measurement of membrane properties of cell-sized GUVs and the undulation dynamics of the plasma membranes of single living cells. Notably, the measurements here are not near their physical limits (e.g. due to photodamage or heating), and so should be readily extendable using faster cameras and brighter laser illumination. This will allow the use of still smaller GNRs, and thus the optical measurement of undulations having wavelengths far smaller than the diffraction limit. Since the orientational tracking is polarimetric and can be performed at low magnification, a wide-field camera would also enable high-throughput measurements of different cells or cell regions simultaneously. Last, our approach promises to enable the study of the mechanics of the membranes of procaryotes, sub-cellular organelles or the dynamics of cell-cell junctions.
Acknowledgements.
This work was supported by the Penn PSOC program, NIH U54-CA193417, and partial support from Grant No. 55120-NDS from the ACS Petroleum Research Fund.References
- Graber et al. [2017] Z. T. Graber, Z. Shi, and T. Baumgart, Phys. Chem. Chem. Phys. 19, 15285 (2017).
- Shi et al. [2018] Z. Shi, Z. T. Graber, T. Baumgart, H. A. Stone, and A. E. Cohen, Cell 175, 1769 (2018).
- Fournier et al. [2004] J.-B. Fournier, D. Lacoste, and E. Raphaël, Phys. Rev. Lett. 92, 018102 (2004).
- Dimova [2014] R. Dimova, Advances in Colloid and Interface Science Special issue in honour of Wolfgang Helfrich, 208, 225 (2014).
- Kilpatrick et al. [2015] J. I. Kilpatrick, I. Revenko, and B. J. Rodriguez, Advanced Healthcare Materials 4, 2456 (2015).
- Kocun and Janshoff [2012] M. Kocun and A. Janshoff, Small 8, 847 (2012).
- Engelhardt et al. [1984] H. Engelhardt, H. Gaub, and E. Sackmann, Nature 307, 378 (1984).
- Dimova et al. [2009] R. Dimova, N. Bezlyepkina, M. D. Jordö, R. L. Knorr, K. A. Riske, M. Staykova, P. M. Vlahovska, T. Yamamoto, P. Yang, and R. Lipowsky, Soft Matter 5, 3201 (2009).
- Kummrow and Helfrich [1991] M. Kummrow and W. Helfrich, Phys. Rev., A 44, 8356 (1991).
- Sheetz and Dai [1996] M. P. Sheetz and J. Dai, Trends in Cell Biology 6, 85 (1996).
- Dai and Sheetz [1995] J. Dai and M. P. Sheetz, Biophys. J. 68, 988 (1995).
- Capraro et al. [2010] B. R. Capraro, Y. Yoon, W. Cho, and T. Baumgart, J. Am. Chem. Soc. 132, 1200 (2010).
- Hochmuth [2000] R. M. Hochmuth, J Biomech 33, 15 (2000).
- Park et al. [2010] Y. Park, C. A. Best, K. Badizadegan, R. R. Dasari, M. S. Feld, T. Kuriabova, M. L. Henle, A. J. Levine, and G. Popescu, Proc. Natl. Acad. Sci. U.S.A. 107, 6731 (2010).
- Feng et al. [2021] X. Feng, W.-H. Leong, K. Xia, C.-F. Liu, G.-Q. Liu, T. Rendler, J. Wrachtrup, R.-B. Liu, and Q. Li, Nano Lett. 10.1021/acs.nanolett.0c04864 (2021), publisher: American Chemical Society.
- Hormel et al. [2014] T. T. Hormel, S. Q. Kurihara, M. K. Brennan, M. C. Wozniak, and R. Parthasarathy, Phys. Rev. Lett. 112, 188101 (2014).
- [17] See Supplemental Material for additional information about the experimental methods, detail of MC simulation, and detail of theoretical models, and additional figures for simulation and experimnetal results, which includes Refs. [18-21].
- Xie et al. [2009] W. Xie, L. Wang, Y. Zhang, L. Su, A. Shen, J. Tan, and J. Hu, Bioconjugate Chem. 20, 768 (2009).
- Angelova and Dimitrov [1986] M. I. Angelova and D. S. Dimitrov, Faraday Discuss. Chem. Soc. 81, 303 (1986).
- Tian and Baumgart [2009] A. Tian and T. Baumgart, Biophys. J. 96, 2676 (2009).
- Khan and Mason [2014] M. Khan and T. G. Mason, Phys. Rev. E 89, 042309 (2014).
- Molaei et al. [2018] M. Molaei, E. Atefi, and J. C. Crocker, Phys. Rev. Lett. 120, 118002 (2018).
- Crocker and Grier [1996] J. C. Crocker and D. G. Grier, J. Colloid Interface Sci. 179, 298 (1996).
- Rose et al. [2020] K. A. Rose, M. Molaei, M. J. Boyle, D. Lee, J. C. Crocker, and R. J. Composto, J. Appl. Phys. 127, 191101 (2020).
- Levine et al. [2004] A. J. Levine, T. B. Liverpool, and F. C. MacKintosh, Phys. Rev. Lett. 93, 038102 (2004).
- Saffman and Delbrück [1975] P. G. Saffman and M. Delbrück, PNAS 72, 3111 (1975).
- Naji et al. [2007] A. Naji, A. J. Levine, and P. A. Pincus, Biophys. J. 93, L49 (2007).
- Stanich et al. [2013] C. A. Stanich, A. R. Honerkamp-Smith, G. G. Putzel, C. S. Warth, A. K. Lamprecht, P. Mandal, E. Mann, T.-A. D. Hua, and S. L. Keller, Biophys. J. 105, 444 (2013).
- Petrov et al. [2012] E. P. Petrov, R. Petrosyan, and P. Schwille, Soft Matter 8, 7552 (2012).
- Honerkamp-Smith et al. [2013] A. R. Honerkamp-Smith, F. G. Woodhouse, V. Kantsler, and R. E. Goldstein, Phys. Rev. Lett. 111, 038103 (2013).
- Kučerka et al. [2011] N. Kučerka, M.-P. Nieh, and J. Katsaras, Biochimica et Biophysica Acta (BBA) - Biomembranes 1808, 2761 (2011).
- Espinosa et al. [2011] G. Espinosa, I. López-Montero, F. Monroy, and D. Langevin, Proc. Natl. Acad. Sci. U.S.A. 108, 6008 (2011).
- Bacia et al. [2005] K. Bacia, P. Schwille, and T. Kurzchalia, Proc. Natl. Acad. Sci. U.S.A. 102, 3272 (2005).
- Boggara et al. [2010] M. B. Boggara, A. Faraone, and R. Krishnamoorti, J. Phys. Chem. B 114, 8061 (2010).
- Nagao et al. [2017] M. Nagao, E. G. Kelley, R. Ashkar, R. Bradbury, and P. D. Butler, J. Phys. Chem. Lett. 8, 4679 (2017), publisher: American Chemical Society.
- Yi et al. [2009] Z. Yi, M. Nagao, and D. P. Bossev, J. Phys. Condens. Matter 21, 155104 (2009).
- Takeda et al. [1999] T. Takeda, Y. Kawabata, H. Seto, S. Komura, S. K. Ghosh, M. Nagao, and D. Okuhara, Journal of Physics and Chemistry of Solids 60, 1375 (1999).
- Brochard and Lennon [1975] F. Brochard and J. F. Lennon, J. Phys. France 36, 1035 (1975), publisher: Société Française de Physique.
- Seifert and Langer [1993] U. Seifert and S. A. Langer, Europhys. Lett. 23, 71 (1993).
- Shkulipa et al. [2006] S. A. Shkulipa, W. K. den Otter, and W. J. Briels, Phys. Rev. Lett. 96, 178302 (2006).
- Watson et al. [2012] M. C. Watson, E. G. Brandt, P. M. Welch, and F. L. H. Brown, Phys. Rev. Lett. 109, 028102 (2012).
- Sadeghi and Noé [2020] M. Sadeghi and F. Noé, Nat. Commun. 11, 1 (2020), number: 1 Publisher: Nature Publishing Group.
- Rodríguez-García et al. [2009] R. Rodríguez-García, L. R. Arriaga, M. Mell, L. H. Moleiro, I. López-Montero, and F. Monroy, Phys. Rev. Lett. 102, 128101 (2009).
- Raphael and Waugh [1996] R. M. Raphael and R. E. Waugh, Biophys. J. 71, 1374 (1996).
- Pott and Méléard [2002] T. Pott and P. Méléard, Europhys. Lett. 59, 87 (2002).
- Rawicz et al. [2000] W. Rawicz, K. C. Olbrich, T. McIntosh, D. Needham, and E. Evans, Biophys. J. 79, 328 (2000).
- Evans and Rawicz [1990] E. Evans and W. Rawicz, Phys. Rev. Lett. 64, 2094 (1990).
- Mell et al. [2013] M. Mell, L. H. Moleiro, Y. Hertle, P. Fouquet, R. Schweins, I. López-Montero, T. Hellweg, and F. Monroy, Eur. Phys. J. E 36, 75 (2013).
- Mell et al. [2015] M. Mell, L. H. Moleiro, Y. Hertle, I. López-Montero, F. J. Cao, P. Fouquet, T. Hellweg, and F. Monroy, Chemistry and Physics of Lipids 185, 61 (2015).
- Ho and Baumgärtner [1989] J. S. Ho and A. Baumgärtner, Phys. Rev. Lett. 63, 1324 (1989).
- Helfrich [1973] W. Helfrich, Zeitschrift für Naturforschung C 28, 693 (1973).
- Ramakrishnan et al. [2010] N. Ramakrishnan, P. B. Sunil Kumar, and J. H. Ipsen, Phys. Rev. E 81, 041922 (2010).
- Ramakrishnan et al. [2018] N. Ramakrishnan, K. K. Sreeja, A. Roychoudhury, D. M. Eckmann, P. S. Ayyaswamy, T. Baumgart, T. Pucadyil, S. Patil, V. M. Weaver, and R. Radhakrishnan, Phys Biol 15, 026002 (2018).
- Hamley and Castelletto [2007] I. W. Hamley and V. Castelletto, Angewandte Chemie International Edition 46, 4442 (2007).
- Kusumi et al. [2005] A. Kusumi, C. Nakada, K. Ritchie, K. Murase, K. Suzuki, H. Murakoshi, R. S. Kasai, J. Kondo, and T. Fujiwara, Annual Review of Biophysics and Biomolecular Structure 34, 351 (2005).
- Morone et al. [2006] N. Morone, T. Fujiwara, K. Murase, R. S. Kasai, H. Ike, S. Yuasa, J. Usukura, and A. Kusumi, Journal of Cell Biology 174, 851 (2006).
- McMahon and Boucrot [2015] H. T. McMahon and E. Boucrot, J Cell Sci 128, 1065 (2015).
- Doherty and McMahon [2008] G. J. Doherty and H. T. McMahon, Annu. Rev. Biophys. 37, 65 (2008).
- Hoffman and Crocker [2009] B. D. Hoffman and J. C. Crocker, Annu Rev Biomed Eng 11, 259 (2009).
- Steinkühler et al. [2019] J. Steinkühler, E. Sezgin, I. Urbančič, C. Eggeling, and R. Dimova, Commun Biol 2, 1 (2019), number: 1 Publisher: Nature Publishing Group.
- Tourdot et al. [2015] R. W. Tourdot, N. Ramakrishnan, T. Baumgart, and R. Radhakrishnan, Phys. Rev. E 92, 042715 (2015).