Extreme HBL-like behavior of Markarian 421 and its two-zone photohadronic interpretation
Abstract
Markarian 421 is the nearest high-energy peaked blazar and also is the first extragalactic source to be detected in multi-TeV -rays. It has been observed in multiwavelength for exceptionally long period of time with dense monitoring and several major outbursts have been detected from this source. In March 2010, the source was in a high state of activity and was observed in multiwavelength by various telescopes for 13 consecutive days. During this period the position of the synchrotron peak was found to be above Hz and also the position of the second peak was shifted towards higher energy, a signature of extreme HBL-like behavior. We observed that the standard photohadronic model is inadequate to explain the observed spectra. However, a recently proposed two-zone photohadronic model explains very well the GeV-TeV flaring events observed by both MAGIC and VERITAS telescopes. From the observation of the highest energy -ray event on MJD 55266 we also estimated the minimum bulk Lorentz factor.
mainReferences \newcitesappendixReferences (Appendix)
1 Introduction
The spectral energy distributions (SEDs) of blazars are characterized by two non-thermal peaks (Dermer & Schlickeiser, 1993). The first peak, in the infrared to X-ray energy range, is produced by the synchrotron emission from relativistic electrons in the jet. The second peak, in between X-ray to -ray energy, is believed to be produced either from the synchrotron Self-Compton (SSC) scattering of high-energy electrons with the low-energy self-produced synchrotron photons in the jet (Maraschi et al., 1992; Murase et al., 2012; Gao et al., 2013) or from the external Compton (EC) scattering with external sources such as photons from the accretion disk or broad-line regions (Sikora et al., 1994; Blazejowski et al., 2000). The model which explains these two peaks is in general referred to as the leptonic model. Depending on the position of the synchrotron peak, the blazars are classified into four categories: low-energy peaked blazars (LBLs, ), intermediate-energy peaked blazars (IBLs, between and ), high energy-peaked blazars (HBLs, between and ) (Abdo et al., 2010) and extreme energy peaked blazar (EHBL, Hz) (Costamante et al., 2001). In particular, the EHBLs are characterized by low luminosity and have limited variabilities which make these objects difficult to detect (Costamante et al., 2018; Acciari et al., 2020b).
So far, only a few EHBLs have been detected in the very high energy (VHE, GeV) regime and among them some well known objects are 1ES 0229+200, 1ES 0347-232, RGB J0710+591 and 1ES 1101-232 (Costamante et al., 2018). Among all the EHBLs observed so far, the highest energy peak frequencies correspond to 1ES 0229+200 with the synchrotron peak at Hz and the SSC peak at Hz (Kaufmann et al., 2011) respectively. The nearest and the extensively studied HBLs Markarian 421 (Mrk 421), Markarian 501 (Mrk 501) and 1ES 1959+650 have also shown EHBL-like behavior with harder TeV spectra in which the synchrotron and SSC peaks are shifted towards higher energy during some flaring episodes (Ahnen et al., 2018; Acciari et al., 2020a; Aleksić et al., 2015). The EHBL-like behavior of Mrk 501 was observed during two episodes of very-high energy flaring events of May - July 2005 and June 2012. Also, during a multiwavelength (MW) campaign of 1ES 1959+650 between 29th April to 21st November 2016, the MAGIC telescopes observed multi-TeV flaring events during the nights of 13th, 14th June and 1st July 2016 when the position of the synchrotron peak was in EHBL range and exhibiting extreme HBL-like behavior.
It is very difficult to explain the shift of the second peak in the one-zone leptonic model. However, it has been shown that by using unrealistic model parameters, such as the large values of minimum electron Lorentz factor and the bulk Lorentz factor (Ahnen et al., 2018; Acciari et al., 2020a) as well as a low magnetic field, the shift can be explained. Alternative solutions have also been proposed, such as: a two-zone leptonic model, IC scattering of the electron with the cosmic microwave background, a spine-layer structured jet model and variants of the hadronic model (Böttcher et al., 2008; Acciari et al., 2019; Ahnen et al., 2018).
In previous studies, Sahu et al. (2019, 2020b) have used the photohadronic model to explain the multi-TeV flaring from many HBLs very well. In all these studies it is shown that the Fermi accelerated high energy protons interacting with the seed SSC photons in the jet can explain the VHE spectrum very well. The SSC photon flux in this region is a perfect power-law given as (in units of ), where is the seed photon energy, is the energy of the observed VHE gamma-ray and is the seed photon spectral index. The value of lies in the range . However, recently, Sahu et al. (2020a, 2021) have shown that this standard photohadronic scenario is inadequate to explain the EHBL-like behavior of the flaring events of Mrk 501 and 1ES 1959+650. It was also shown that the seed SSC photon flux in the kinematically allowed region for the -resonance production from interaction is no more a single power-law due to the EHBL-like behavior of the flaring events. So, the standard photohadronic model was extended to include two different zones for the SSC flux. The zone-1 (low energy region) has the conventional behavior having . But in zone-2 (high energy region) the value of is different and in the range . However, the spectral index of Fermi accelerated high energy protons in both the zones remain the same.
During the EHBL-like flaring events of Mrk 501 and 1ES 1959+650, the positions of the synchrotron peak and the SSC peak were shifted towards the higher energies. So, Sahu et al. (2020a, 2021) assumed that the transition from HBL to EHBL-like behavior is due to the shift of the synchrotron peak and the SSC peak in the SED towards higher energies. As a result of this shift, jet parameters such as bulk Lorentz factor, blob size, and magnetic field may be different from HBL, but the particle acceleration and emission mechanisms remain the same. Therefore, the photohadronic process should still be the dominant process in this changed environment. It is also argued that these EHBL-like events are transient in nature and may repeat in the future.
During a MW campaign in 2010, flaring in GeV-TeV energy was observed in Mrk 421. The VHE activity started decreasing from a high flux to a normal flux during the period from March 10 to March 22, i.e. for 13 consecutive days (Aleksić et al., 2015). It was observed that the positions of both the synchrotron peak and the SSC peak of Mrk 421 were shifted towards higher energy values consistent with the EHBL classification of the object, were similar to the flaring of Mrk 501 and 1ES1959+650 discussed above. This shift in the peak positions towards higher energies is explained using electrostatic acceleration mechanism (Zheng et al., 2021). Also recently it has been shown that these VHE spectra of Mrk 421 can be explained better in the photohadronic model than the one and the two-zone leptonic models (de León et al., 2021). As the two-zone photohadronic model has successfully explained the EHBL-like behavior of Mrk 501 and 1ES1959+650, we use this model once again to explain the EHBL-like behavior of Mrk 421 observed during March 2010.
2 Flaring of Mrk 421
Mrk 421 is the nearest () well known HBL with a central black hole mass and is the first extragalactic source to be detected in multi-TeV -rays (Punch et al., 1992). It is also one of the fastest varying -ray sources. Since its discovery, the object has been studied intensively through dedicated MW observations and several major flares have been observed (Amenomori et al., 2003; Fossati et al., 2008; Cui et al., 2005; Abeysekara et al., 2017; Mastichiadis et al., 2013; Beck et al., 2020). Its average MW SED has been modelled with both leptonic (Abdo et al., 2011; Banerjee et al., 2019) and hadronic (Cerruti et al., 2015; Zech et al., 2017) models. During April-May 1994, a TeV/X-ray flare was reported and on May 14/15 a correlation between the TeV emission and X-ray flare was observed. Also, during a multiwavelength campaign in 2004, large flares in X-ray by Rossi X-ray Timing Explorer (RXTE) and TeV flare by Whipple 10 m telescope were observed (Blazejowski et al., 2005). It is important to note that during this period, the TeV flare had no coincident low energy counterparts, and most significantly, the X-ray flux reached its peak 1.5 days before the TeV flux during this outburst. A remarkable similarity between this VHE flare and the orphan TeV flare in 1ES 1959+650 of 2002 (Krawczynski et al., 2004) and a similar variation pattern in their X-ray emission was established. Exceptionally long and dense monitoring in MW of Mrk 421 has been undertaken since 2009 to understand the temporal evolution of the SED. Mrk 421 was in active state during a MW campaign in 2010 and an extraordinary flare Crab Unit (c.u.) above 1 TeV was first detected by VERITAS telescopes on February 16 and a follow-up observation was undertaken by the HESS telescopes (Tluczykont, 2010) for four subsequent nights. So far, this is the highest flare ever observed from Mrk 421. Also, flaring in VHE gamma-ray was observed for 13 consecutive days from March 10 (MJD 55265) to March 22 (MJD55277). Again, during a 6-month long multi-instrument campaign (Banerjee et al., 2019), a large VHE flare about 16 times larger than the usual one, was observed by MAGIC telescopes on 25th of April 2014 and soon it was followed-up by XMM-Newton and VERITAS. Several of the above multi-TeV flaring events from Mrk 421 have been explained extremely well by the standard photohadronic scenario (Sahu et al., 2016, 2018, 2019).
3 Two-zone photohadronic model
The photohadronic model is very successful in explaining the multi-TeV flaring events from many HBLs (Sahu, 2019; Sahu et al., 2019). The epoch of VHE flaring is explained by assuming the formation of a double jet structure along the same axis: an inner jet of size and photon density buried under an outer jet of size and photon density where and . Here the notation ′ implies comoving frame. The internal and the external jets are moving with almost the same bulk Lorentz factor . Also, their common Doppler factor is (for blazars ). The geometrical structure of the jet and the detailed description of the photohadronic model is given in Fig. 1 of Sahu (2019).
In the inner jet region the Fermi accelerated protons with a differential power-law spectrum () interact with the background SSC seed photons to produce the -resonance and its subsequent decay gives -rays and neutrinos via the decay of neutral pion and charged pion respectively. As the inner region is hidden, there is no way to directly estimate the photon density there. Thus we assume a simple scaling behavior of the photon densities in the inner and the outer jet regions satisfying the criteria
| (1) |
The above equation implies that the ratio of photon densities at two different background energies and in the inner and the outer jet regions are almost the same. By using the relation in Eq. (1), we can express the inner photon density in terms of the observed flux. The kinematical condition (Sahu, 2019) to produce the -resonance is,
| (2) |
where is the redshift of the object. The observed VHE -ray energy and the proton energy are related through . In previous works by Sahu (2019) it is explicitly shown that for the production of -resonance, the value of always lies in the lower tail region of the SSC band and for HBLs the flux in this region is a perfect power-law.
The VHE -rays en route to Earth undergo energy dependent attenuation by the extragalactic background light (EBL) through electron-positron pair production and this pair-production process not only attenuates the absolute flux but also significantly changes the shape of the VHE spectra. The measurement of the EBL is very difficult due to the uncertainties in the contribution of zodiacal light (Hauser & Dwek, 2001; Chary & Pope, 2010) and consequently galaxy counts result in a lower limit since the number of unresolved sources are unknown (Pozzetti & Madau, 2001). Several approaches with different degrees of complexity have been developed to calculate the EBL density as a function of energy for different redshifts (Dominguez et al., 2011; Inoue et al., 2013; Franceschini et al., 2008; Stecker et al., 2006, 2016). For the present analysis we use the EBL model of Franceschini et al. (2008), which is consistent with a EBL peak flux of at and is also widely used in other leptonic and hybrid models (Aleksić et al., 2015; Ahnen et al., 2017). Taking into account the EBL contribution the observed VHE flux from the sources can be given as (Sahu, 2019)
| (3) |
where is a dimensionless constant and is the optical depth for the process which depends on and the redshift. In the standard photohadronic model, and putting this in Eq. (3) the flux can be written as
| (4) |
The normalization constant is deduced from the observed VHE spectrum. Thus the spectral index is the only free parameter in this model and is the intrinsic VHE -ray flux. In previous studies (Sahu et al., 2020a, 2021) it was shown that the EHBL-like behavior of the flaring epoch can not be explained by the canonical photohadronic model. In order to remedy this defect the tail region of the SSC band which is responsible for the production of the -resonance is assumed to have two different power-laws with spectral indices (lower part of the tail region) and (upper part of the tail region). Thus the photon flux is expressed as
| (5) |
Here and is an energy scale around which the transition takes place and its value can be fixed from the individual flaring spectrum. We suppose that the change in the value of the spectral index from to around could be due to the effect of magnetic field on the energy loss process of the high energy electrons to the SSC photons or it could be some new physics. However, we do not dwell on the transition between these two zones as the exact physical mechanism behind it is unclear at this stage. The value of corresponds to a value of in the SSC band. This separates into two distinct regions. By inserting Eq. (5) into Eq. (3), the observed VHE spectrum can be expressed as
| (6) |
In this two-zone photohadronic model and are the normalization constants and the spectral indices () are the free parameters to be adjusted by fitting the model to the observed VHE spectrum of the EHBL. The proton spectral index is , and we use the generally accepted value of (Dermer & Schlickeiser, 1993). This automatically constrains the value of for a given . However, it is important to mention that the value of (zone-1) allows one to characterize the flaring state for a given observation without depending explicitly on the modeling of the SSC region. In other words, in the photohadronic scenario, the low energy region of the VHE spectrum decides the flaring state of the outburst as the value of always lies in the range (Sahu et al., 2019).
To fit the observed data for each VHE spectrum, we use a standard optimization of the parameter space through the mean squared error (MSE) with respect to the central values of the data points, and choose the best pair of () by maximizing the Pearson chi-squared () statistic and calculating the corresponding statistical significance.
The observed VHE spectrum of each day is fitted in the following manner. For the low energy regime of the spectrum we take and fit it with different values of . Similarly in the high energy regime we take and fit the spectrum for different values of . From both the zones we select the best fits by calculating their statistical significance. The crossing point of these two curves gives the value of . Also, we have to make sure that these two curves intersect only once.
4 Results
During the MW campaign period of 2010, flaring in VHE gamma-rays was observed for 13 consecutive days from March 10 (MJD 55265) to March 22 (MJD55277). Initially the VHE flux was high ( C.U.) and slowly the flux decreased to a typical value of C.U. towards the end of the flaring epoch. In the VHE energy band, MAGIC, VERITAS and Whipple telescope systems observed the flaring events. The MAGIC telescopes made 11 observations and the exposure time for each period was about 10 to 80 min, amounting to a total of 4.7 h of good quality data. However, due to bad weather, data recorded on MJD 55272 and MJD 55275 were removed from the MW observations.
The VERITAS telescopes observed the flaring of Mrk 421 on MJD 55260, 55265, 55267-55274 with a 10 min run time each day. The observations were performed at zenith angles to benefit from the lowest possible energy threshold of the events. Also, the Whipple 10 m telescope performed ten observations in ON/OFF and TRK (tracking) modes (Pichel, 2009), lasting from one to six hours each on MJD 55267-55271 and MJD 55273-55277.
The most important aspect of these 13 days observation is that the synchrotron peak and the SSC peaks were displaced towards higher energies. Particularly, the synchrotron peak frequency was above Hz and according to the classification scheme of the BL Lac objects, it belongs to EHBL category even though Mrk 421 is well known as an HBL. As discussed in the introduction, similar behavior has also been observed from Mrk 501 and 1ES 1959+650 which are well known HBLs, and there spectra are explained very well with the two-zone photohadronic scenario (Sahu et al., 2020a, 2021). Thus using the two-zone photohadronic model, the 13 days VHE flaring events observed by MAGIC and VERITAS are analysed here. For comparison, along with our results the one-zone SSC fits are also shown (Aleksić et al., 2015). In this analysis, we ignore the statistical significance of a fit when only three or less observed data points are available.
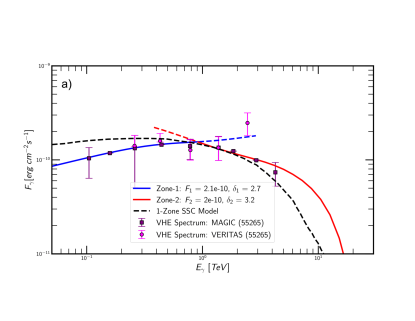
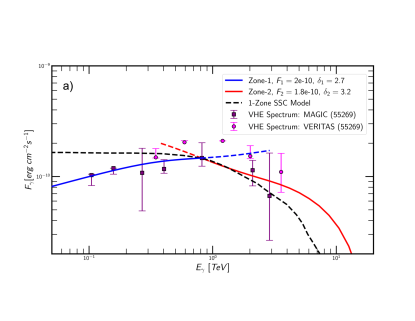
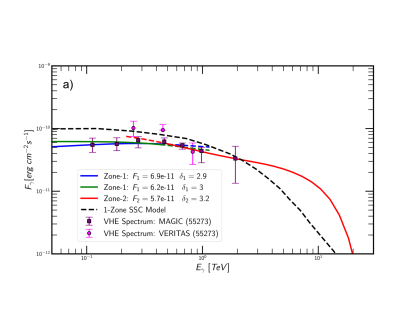
The VHE spectrum of MJD 55265 (10 March 2010) observed by both MAGIC and VERITAS is in the energy range and the synchrotron peak is at Hz which clearly shows its EHBL behavior. Using the two-zone photohadronic model, we fit the low-energy part of the spectrum (zone-1) (for TeV) very well with and its corresponding flux normalization is , with a statistical significance of 98% (). Also the best fit to the high energy part of the VHE spectrum (zone-2) is obtained for and , with a statistical significance of 96% (). These are shown in Fig. 1(a) along with the one-zone SSC model of (Aleksić et al., 2015) for comparison. It can be seen that our model fits better the data than the one-zone SSC model. The zone-1 and zone-2 have their respective seed SSC flux spectral indices and respectively. The VERITAS data behave differently in its highest energy when the flux has suddenly gone up and is non compatible with the two-zone model. However, previously it was shown that this can be fitted well with conventional photohadronic model with and corresponding to a very high emission state (Sahu et al., 2019). As the MAGIC and VERITAS observation windows are seven hours apart, it is possible that intra-night variability might be responsible for this difference.
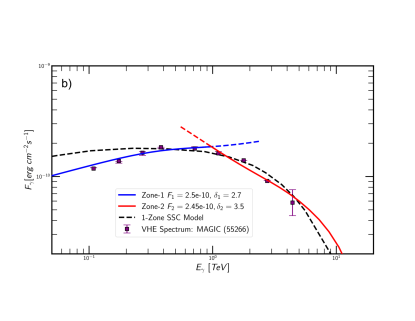
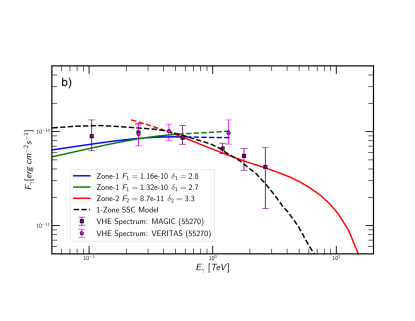
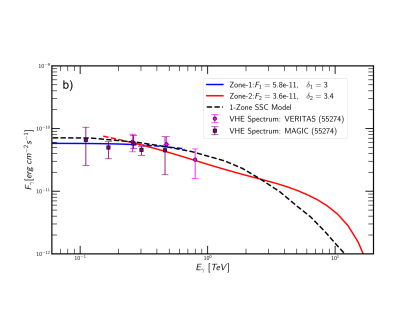
On MJD 55266 the flaring event was observed by MAGIC telescopes only and the spectrum is in the energy range TeV. The bow shape spectrum on this day (MJD 55266) can not be fitted by a single power-law. The zone-1 ( TeV) is fitted with and having a statistical significance of 99% (). Similarly, the best fit to zone-2 is obtained for and , with a statistical significance of 82% () and on this day the synchrotron peak is at Hz. Our fit and the one-zone SSC results are compared in Fig. 1(b). It can be seen that the leptonic model is unable to fit the data in the low energy regime.
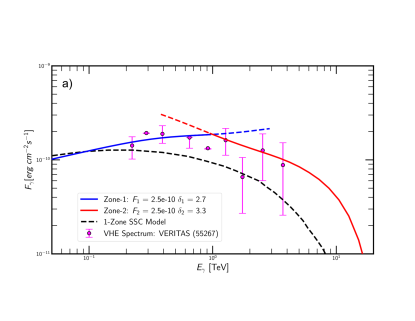
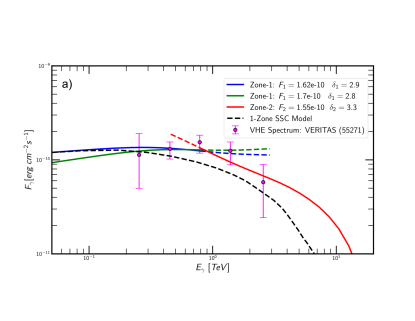
The only data available on MJD 55267 are from VERITAS and the spectrum is very well fitted with the two-zone photohadronic scenario with the transition energy TeV, which is shown in Fig. 2(a). The best fitted values for zone-1 are and (statistical significance of 83%, ) while for zone-2 we have , and . The SSC model of Aleksić et al. (2015) predicts a VHE spectrum which falls significantly faster than the observed spectrum.
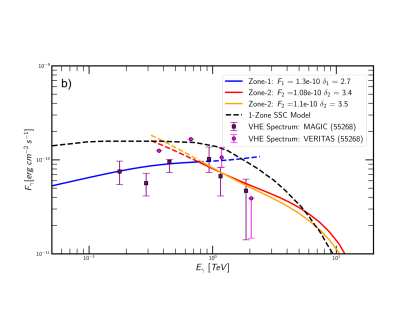
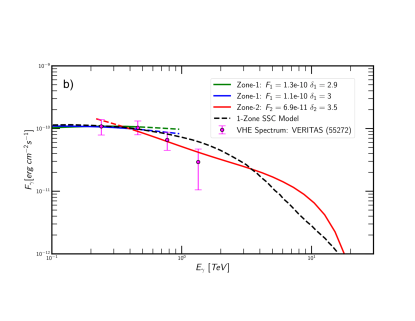
Both MAGIC and VERITAS observed the flaring event of MJD 55268 and the observed spectra are in the energy range TeV. The MAGIC spectrum is well fitted in zone-1 with the spectral index and the normalization factor and here TeV . There are not many data points in zone-2, so we fitted this region with and both values fit very well to the observed data. However, above 2 TeV there is a minor difference between these fits. Also our fit to the spectrum differs substantially from the one-zone SSC fit as shown in Fig. 2(b).
The flaring event of MJD 55269 is very similar to the one observed on MJD 55268 and a good fit to the spectrum is achieved with and for zone-1 (statistical significance of 96%, ), while , are for zone-2 as shown in Fig. 3(a).
On MJD 55270 the spectrum in the low energy regime i.e. zone-1 is flatter than previous days which implies that the flaring event is moving towards low emission state. However, because of less number of data points we fitted this region with and both fit very well with very similar normalization constants ( and ). On the other hand, zone-2 is fitted well by , (statistical significance of 87%, ) as shown in Fig. 3(b). One-zone SSC model also fits well to the spectrum. In the high energy regime, however, it falls faster than our fit.
The flaring event of MJD 55271 was only observed by VERITAS in the energy range TeV. Below the transition energy TeV, the zone-1, we can fit well the spectrum with and . The zone-2 is fitted with and . The one-zone SSC model fit is also shown in Fig. 4(a) to compare with our two-zone photohadronic model fit.
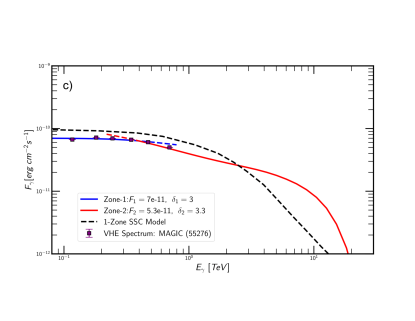
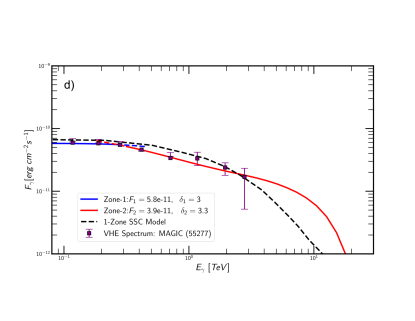
For the observations from MJD 55272 to MJD 55277, with the exception MJD 55275 when there was no observation, the value of is very low and in a narrow range of TeV. Also the spectrum for each individual day is flat which is best fitted with either or and the statistical significance for these fits ranges from 85% to 95%. This value of signifies that the flaring of Mrk 421 has reached the low emission state and at the same time the seed photon flux in the SSC band has reached the maximum value of . Also the maximum photon flux in zone-1 has substantially decreased compared to the first day of the observation. The zone-2 for these five days are also fitted very well with which correspond to the seed photons in the low energy tail region of the SSC band and their fluxes having spectral indices in the range . The flaring events of all these days along with the one-zone SSC fits are shown in Fig. 4(b) and Figs. 5(a), (b), (c) and (d) respectively.
Initially the VHE flaring was in high emission state and slowly it went down to low emission state by the end of the flaring period. This transition was accompanied by a gradual decrease in the transition energy from TeV to TeV and consequently zone-2 became wider and spread into zone-1 making the latter region narrower. We recall that the transition in the VHE spectrum took place due to the change in the seed SSC photon flux. So, physically what it means is that initially the photon flux in the tail region of the SSC band which is responsible for the -resonance production had two distinct energy dependencies as shown in Eq. (5) (lower part with and upper part with ). Slowly the lower part drifted into the upper part by squeezing the former region into a narrow strip.
On MJD 55266, the maximum observed -ray energy was TeV which is produced from the interaction of Fermi accelerated proton of energy TeV in the jet with the photons in the lower part of the SSC spectrum. In the two-zone SSC model of Aleksić et al. (2015) for this day the SSC spectrum starts around Hz (Figure 8(b) of Aleksić et al. (2015)). For this value of , the minimum value of the bulk Lorentz factor estimated in our model is . Similar or smaller values for the bulk Lorentz factor are obtained for other days. On the other hand, in the one-zone SSC model (Figure 8(a) of Aleksić et al. (2015)), the SSC spectrum starts above Hz and for this value of we get minimum which is too high.
5 Discussion
Mrk 421 is the nearest HBL and is the first extragalactic source to be observed in VHE. Since then it has undergone several episodes of multi-TeV flaring. Mrk 421 is also the first source observed in multiwavelength for exceptionally long period of time with dense monitoring. The VHE flaring epochs of this source during all its previous observations were consistently found to be in the HBL category which corresponds to the synchrotron peak in the frequency range Hz. However, during the 13 consecutive days observations undertaken during March 2010 the source was in the state of high activity with a changed spectral behavior and the synchrotron as well as the second peak shifted towards higher energies. The synchrotron peak shifted above Hz, implying that the blazar has undergone a shift from HBL to EHBL. Similar situations are observed in HBLs Mrk 501 and 1ES 1959+650, which were explained very well by the two-zone photohadronic scenario. For Mrk 421, we have used the same two-zone photohadronic model to interpret the 13 consecutive days of flaring in VHE and we find that the individual flaring events are explained very well by our model. This shows once more the success of two-zone photohadronic model in explaining the extreme HBL nature of the VHE flaring events. We note that when the flaring in VHE was first observed on March 10, 2010 (MJD56265), the source was in high emission state and it continued to be in high emission state for about a week. Then it started degrading to low emission state when the flux was low and also the spectrum in zone-1 was almost flat. During the first week of the observation, the transition energy TeV when the flaring in the zone-1 was in high emission state. However, from MJD55272, the transition energy started decreasing and reached a minimum value of TeV on MJD55274 and for rest of the days the zone-1 was in low emission state. The shift in the from TeV to TeV shows that towards the end of the VHE flaring, the zone-2 had dominated almost the whole spectrum, implying that the seed photon flux in SSC region has changed from a flatter behavior () to a steeper () one. This change in spectral behavior, in principle, can be detected by simultaneous observation of the SED in the low energy tail region of the SSC band and in the VHE band during the EHBL-like outburst of the source. We have also estimated the minimum bulk Lorentz factor, obtaining a reasonable value of . Further analysis of EHBL and EHBL-like transient behaviors will help solidify the evidence for the two-zone photohadronic origin of these phenomena.
We are thankful to Luis H. Castañeda Hernandez for many useful discussions. The work of S.S. is partially supported by DGAPA-UNAM (Mexico) Project No. IN103019. Partial support from CSU-Long Beach is gratefully acknowledged.
References
- Abdo et al. (2010) Abdo, A., et al. 2010, Astrophys. J., 716, 30
- Abdo et al. (2011) Abdo, A. A., et al. 2011, Astrophys. J., 736, 131
- Abeysekara et al. (2017) Abeysekara, A. U., et al. 2017, Astrophys. J., 834, 2
- Acciari et al. (2019) Acciari, V., et al. 2019, Mon. Not. Roy. Astron. Soc., 490, 2284
- Acciari et al. (2020a) —. 2020a, Astron. Astrophys., 638, A14
- Acciari et al. (2020b) Acciari, V. A., et al. 2020b, Astrophys. J. Suppl., 247, 16
- Ahnen et al. (2017) Ahnen, M., et al. 2017, Astron. Astrophys., 603, A31
- Ahnen et al. (2018) —. 2018, Astron. Astrophys., 620, A181
- Aleksić et al. (2015) Aleksić, J., Ansoldi, S., Antonelli, L. A., et al. 2015, Astronomy & Astrophysics, 578, A22
- Aleksić et al. (2015) Aleksić, J., et al. 2015, Astron. Astrophys., 573, A50
- Amenomori et al. (2003) Amenomori, M., et al. 2003, Astrophys. J., 598, 242
- Banerjee et al. (2019) Banerjee, B., Joshi, M., Majumdar, P., et al. 2019, Mon. Not. Roy. Astron. Soc., 487, 845–857
- Beck et al. (2020) Beck, M., et al. 2020, PoS, ICRC2019, 630
- Blazejowski et al. (2000) Blazejowski, M., Sikora, M., Moderski, R., & Madejski, G. 2000, Astrophys. J., 545, 107
- Blazejowski et al. (2005) Blazejowski, M., et al. 2005, Astrophys. J., 630, 130
- Böttcher et al. (2008) Böttcher, M., Dermer, C. D., & Finke, J. D. 2008, Astrophys. J. Lett., 679, L9
- Cerruti et al. (2015) Cerruti, M., Zech, A., Boisson, C., & Inoue, S. 2015, Mon. Not. Roy. Astron. Soc., 448, 910
- Chary & Pope (2010) Chary, R.-R., & Pope, A. 2010. https://arxiv.org/abs/1003.1731
- Costamante et al. (2018) Costamante, L., Bonnoli, G., Tavecchio, F., et al. 2018, Mon. Not. Roy. Astron. Soc., 477, 4257
- Costamante et al. (2001) Costamante, L., et al. 2001, Astron. Astrophys., 371, 512
- Cui et al. (2005) Cui, W., Blazejowski, M., Aller, M., et al. 2005, AIP Conf. Proc., 745, 455
- de León et al. (2021) de León, A. R., Brown, A. M., & Chadwick, P. M. 2021, Mon. Not. Roy. Astron. Soc., 501, 2198
- Dermer & Schlickeiser (1993) Dermer, C. D., & Schlickeiser, R. 1993, Astrophys. J., 416, 458
- Dominguez et al. (2011) Dominguez, A., et al. 2011, Mon. Not. Roy. Astron. Soc., 410, 2556
- Fossati et al. (2008) Fossati, G., et al. 2008, Astrophys. J., 677, 906
- Franceschini et al. (2008) Franceschini, A., Rodighiero, G., & Vaccari, M. 2008, Astron. Astrophys., 487, 837
- Gao et al. (2013) Gao, H., Lei, W.-H., & Zhang, B. 2013, Mon. Not. Roy. Astron. Soc., 435, 2520
- Hauser & Dwek (2001) Hauser, M. G., & Dwek, E. 2001, Ann. Rev. Astron. Astrophys., 39, 249
- Inoue et al. (2013) Inoue, Y., Inoue, S., Kobayashi, M. A. R., et al. 2013, Astrophys. J., 768, 197
- Kaufmann et al. (2011) Kaufmann, S., Wagner, S. J., Tibolla, O., & Hauser, M. 2011, Astron. Astrophys., 534, A130
- Krawczynski et al. (2004) Krawczynski, H., et al. 2004, Astrophys. J., 601, 151
- Maraschi et al. (1992) Maraschi, L., Ghisellini, G., & Celotti, A. 1992, Astrophys. J. Lett., 397, L5
- Mastichiadis et al. (2013) Mastichiadis, A., Petropoulou, M., & Dimitrakoudis, S. 2013, Mon. Not. Roy. Astron. Soc., 434, 2684
- Murase et al. (2012) Murase, K., Dermer, C. D., Takami, H., & Migliori, G. 2012, Astrophys. J., 749, 63
- Pichel (2009) Pichel, A. 2009. https://arxiv.org/abs/0908.0010
- Pozzetti & Madau (2001) Pozzetti, L., & Madau, P. 2001, IAU Symp., 204, 71. https://arxiv.org/abs/astro-ph/0011359
- Punch et al. (1992) Punch, M., et al. 1992, Nature, 358, 477
- Sahu (2019) Sahu, S. 2019, Rev. Mex. Fis., 65, 307
- Sahu et al. (2018) Sahu, S., de León, A. R., Nagataki, S., & Gupta, V. 2018, Eur. Phys. J. C, 78, 557
- Sahu et al. (2020a) Sahu, S., López Fortín, C. E., Castañeda Hernández, L. H., Nagataki, S., & Rajpoot, S. 2020a, Astrophys. J., 901, 132
- Sahu et al. (2021) Sahu, S., López Fortín, C. E., Castañeda Hernández, L. H., & Rajpoot, S. 2021, Astrophys. J., 906, 91
- Sahu et al. (2020b) Sahu, S., López Fortín, C., Iglesias Martínez, M., et al. 2020b, Mon. Not. Roy. Astron. Soc., 492, 2261
- Sahu et al. (2019) Sahu, S., López Fortín, C. E., & Nagataki, S. 2019, Astrophys. J. Lett., 884, L17
- Sahu et al. (2016) Sahu, S., Miranda, L. S., & Rajpoot, S. 2016, Eur. Phys. J. C, 76, 127
- Sikora et al. (1994) Sikora, M., Begelman, M. C., & Rees, M. J. 1994, Astrophys. J., 421, 153
- Stecker et al. (2006) Stecker, F. W., Malkan, M. A., & Scully, S. T. 2006, Astrophys. J., 648, 774
- Stecker et al. (2016) Stecker, F. W., Scully, S. T., & Malkan, M. A. 2016, Astrophys. J., 827, 6
- Tluczykont (2010) Tluczykont, M. 2010, PoS, TEXAS2010, 197
- Zech et al. (2017) Zech, A., Cerruti, M., & Mazin, D. 2017, Astron. Astrophys., 602, A25
- Zheng et al. (2021) Zheng, Y. G., Yang, C. Y., Kang, S.-J., & Bai, J. M. 2021, Res. Astron. Astrophys., 21, 008