On the Role of Sensor Fusion for Object Detection in Future Vehicular Networks
Abstract
Fully autonomous driving systems require fast detection and recognition of sensitive objects in the environment. In this context, intelligent vehicles should share their sensor data with computing platforms and/or other vehicles, to detect objects beyond their own sensors’ fields of view. However, the resulting huge volumes of data to be exchanged can be challenging to handle for standard communication technologies. In this paper, we evaluate how using a combination of different sensors affects the detection of the environment in which the vehicles move and operate. The final objective is to identify the optimal setup that would minimize the amount of data to be distributed over the channel, with negligible degradation in terms of object detection accuracy. To this aim, we extend an already available object detection algorithm so that it can consider, as an input, camera images, LiDAR point clouds, or a combination of the two, and compare the accuracy performance of the different approaches using two realistic datasets. Our results show that, although sensor fusion always achieves more accurate detections, LiDAR only inputs can obtain similar results for large objects while mitigating the burden on the channel.
Index Terms:
Autonomous driving, object detection, sensor fusion, machine learning, AVOD.I Introduction
The worldwide commercialization of 5th generation (5G) wireless networks is pushing towards the development of Connected and Autonomous Vehicles (CAVs) to improve road safety and decrease traffic congestion and carbon emissions [1]. For these systems to be truly autonomous, intelligent vehicles must be able to both identify and track critical entities in the environment (e.g., cars, pedestrians, cyclists, etc.), a task that is typically referred to as object detection.
To this aim, autonomous vehicles are usually equipped with different sensors, each of which has its own strengths and weaknesses. On one hand, Light Detection and Ranging (LiDAR) sensors provide both object detection and classification in all lighting conditions and are currently the most precise sensors to measure range. However, they generate point clouds that are quite difficult to compress with low latency [2], are sensitive to diffraction effects (especially in closed environments like tunnels), and offer a sparse representation of the surroundings, particularly when considering faraway objects. On the other hand, RGB cameras are much cheaper than LiDARs, and less of a computational burden for both compression and data exchange. In turn, they suffer from strong sensitivity to external illumination and visibility conditions and have a limited field of view (FoV), and therefore cannot provide detailed depth information [3].
In any case, object detection is inherently vulnerable to occlusions from external blockers, and the limited angular resolution of the sensors, especially in distant regions, may render the perception of the environment inaccurate. In this context, more robust scene understanding could be achieved if vehicles shared their sensor data with cloud computing platforms (i.e., to leverage more computational resources to store and process data than available on board) as well as with other vehicles (i.e., to extend their perception range beyond the capabilities of their own instrumentation) [4]. Exchanging sensor data, however, can be challenging with standard communication technologies. For example, a raw LiDAR perception with 0.7 million points, generated at 30 fps, would require a data rate of around 500 Mbps [5]: in comparison, the IEEE 802.11p standard for Vehicle-to-Vehicle (V2V) transmissions can only offer a nominal data rate of up to 27 Mbps [6].
On one side, capacity issues can be partially solved by using the lower part of the millimeter wave (mmWave) spectrum, as suggested by the latest IEEE and 3GPP specifications for future vehicular networks [7]. A more efficient approach would be to carefully select the amount of data to be broadcast over bandwidth-limited channels [8, 9] to save network resources. The main concern lies in the choice of which sensor(s) would guarantee the optimal trade-off between channel occupancy and accuracy in the object detection task.
Notably, object detection methods are typically designed to accept single inputs only. For example, You Only Look Once (YOLO) [10] and Voxelnet [11] have become very popular solutions to guarantee precise detections using camera’s and LiDAR’s inputs, respectively. This implies, however, that several object detectors may need to be trained and executed at the same time, which may be difficult to handle with limited computational resources. Recently, sensor fusion algorithms like Aggregate View Object Detection (AVOD) [12] were proven to ensure better reliability than single input schemes by exploiting together the complementary properties of cameras and LiDARs, even though they do not permit detection when only one type of sensor data is accessible.
In this paper, we conduct experiments on the Kitti [13] and Lyft [14] vision benchmark suites, and investigate whether sensor fusion can guarantee more accurate detections than single input methods, despite the additional traffic load on the channel for retrieving observations from multiple sensors. To do so, prior works typically considered separate sensor fusion or single input detection methods to be trained and executed in parallel on board of vehicles. For example, the authors in [15, 16, 17] proved the superior or competitive detection performance of sensor fusion schemes compared to conventional camera- and LiDAR-based approaches. On the other hand, we addressed this problem by modifying the architecture of AVOD to also accept single inputs from either cameras or LiDARs. This allows our AVOD implementation to be deployed as a standalone object detector, regardless of the amount (and class) of sensor data available, thus saving computational resources compared to state-of-the-art solutions.
We demonstrate that LiDAR only inputs can obtain an accuracy in the detection of large objects (like cars) similar to sensor fusion, which would require two different types of sensor data, thus mitigating the burden on the channel. On the contrary, sensor fusion can guarantee better detection for smaller road entities like pedestrians and cyclists by leveraging camera images to make up for the sparsity of the LiDAR data.
The remainder of this paper is organized as follows. In Sec. II we describe the AVOD architecture and how it has been modified to accept single inputs. In Sec. III we present our simulation setup. In Sec. IV we illustrate our simulation results, while in Sec. V we summarize our conclusions and propose suggestions for future work.
II The AVOD Architecture for Object Detection
In the last few years, sensor fusion object detectors have appeared as a promising solution to generate robust detections by relying on different sensor modalities [18]. For example, AVOD [12] fuses both front view RGB images and point clouds together, even though it does not permit detection when only one type of sensor data is available. In this section, we describe how we modified the baseline structure of sensor fusion AVOD (SF-AVOD) to also accept, as an input, standalone camera images (SIC-AVOD) or standalone LiDAR point clouds (SIL-AVOD).
II-A Sensor Fusion AVOD (SF-AVOD)
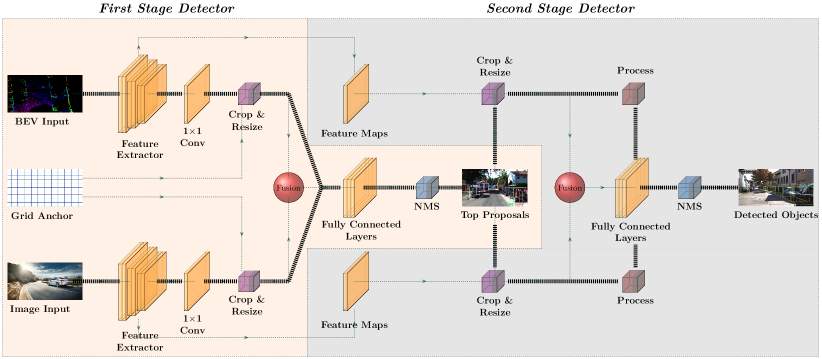
AVOD takes as an input two different types of data: a bird’s eye view (BEV) projection, built from a LiDAR point cloud, and an image from an RGB camera. It then processes the inputs into two steps, namely the first stage detector and second stage detector, as illustrated in Fig. 1.
II-A1 First stage detector
It consists of a Region Proposal Network (RPN) to regress non-oriented anchor proposals.
-
•
Feature extractor. The sensor inputs, after some preprocessing, are separately fed into two Convolutional Neural Networks (CNNs) to extract the feature maps. The feature extractor is inspired to the Feature Pyramid Network (FPN) in [19] and has been structured according to the VGG16 model [20]: the resulting feature map was shown to represent both image and BEV inputs with 8 times lower resolution compared to the original data [12], which may limit the performance on smaller objects such as pedestrians and cyclists. The output feature maps from both input streams are shared by the RPN in the first stage detector (in this case a convolution is applied on the feature maps to reduce the dimensionality of subsequent crop-and-resize operations) and the second stage detector.
-
•
3D anchor generation. The system generates nine anchors for each feature point. They are predefined and non trainable, but their shape, number and size can be tuned manually. The choice of the shape can be based on either the feature map size or the size of the objects to be detected. In our case, AVOD is trained to operate in driving environments, where most objects are expected to be in a rectangular shape. The size and placement of the anchors, instead, are determined by the characteristics of the training samples for each class of objects. After that, Region of Interest (RoI) pooling is applied to (i) extract feature crops for every anchor from each feature map, and (ii) resize the resulting feature crop to to obtain equal-length feature vectors.
-
•
3D anchor top proposals. The feature crops are fused together using an element-wise mean operation. The fused features are then randomly sub-sampled and fed into two task-specific branches consisting of fully connected layers: the first one defines whether an anchor box is “background” or “object,” and the second one produces regression offsets representing the difference between the ground truth’s and the anchors’ centroids and dimensions. Anchor top proposals are selected by filtering redundant anchors via non-maximum suppression (NMS), so that only those with an Intersection over Union (IoU) larger than 0.7 with respect to ground truth boxes are maintained.
II-A2 Second Stage Detector
It is used to regress the final 3D boxes, and takes as inputs (i) the feature maps produced in the first stage detector and (ii) the anchor top proposals.
-
•
Bounding box generation. RoI pooling is applied to the feature maps from the first stage detector, which are cropped and resized for each anchor top proposal111Since in the second stage detector the number of top proposals is an order of magnitude lower than the number of anchors used in the first stage detector’s RoI pooling, the feature maps are used without the convolution., and passed into the detection network. Crops from both inputs are resized to , and fused with an element-wise mean operation.
-
•
Bounding box classification. The fused feature maps are fed into a single set of three fully connected layers to obtain regression, classification, and orientation of each box proposals. Proposals with IoU less than 0.55 (0.45) for cars (pedestrians and cyclists) are classified as “background.” Finally, NMS is applied to remove overlapping detections, keeping the top bounding boxes.
II-B Single Input AVOD (SI-AVOD)
AVOD was designed to accept both LiDAR point clouds and RGB camera images as inputs. In this paper, the code has been altered to allow for accurate detection based on camera only inputs (SIC-AVOD) or LiDAR only input (SIL-AVOD), as displayed in Fig. 1 (thick black connections) and described below.
II-B1 First Stage Detector
The output of the convolutional layer is fed into an RoI pooling layer, which is dimensioned freely to best represent the single input under consideration, i.e., unlike the SF-AVOD implementation, in this setup there is no need to match the features’ size. Specifically, crop and resize parameters can now be configured in such a way that the detection performance of smaller objects (e.g., pedestrians and cyclists, which are generally penalized in the LiDAR input) improves.
The output of the RoI pooling is then directly fed into the first set of fully connected layers. In sensor fusion mode, dropout layers and batch normalization, as well as input masking, were added to each layer to scale the feature maps from both inputs, and to reduce overfitting, respectively. This was performed by randomly setting to zero proposal crops coming from either sample streams during training. In single input mode, instead, the network has been simplified by removing the input masking layer, which was proven to degrade the detection performance significantly.
II-B2 Second Stage Detector
The output of the first stage detector is fed into an RoI pooling layer. Simultaneously, features maps from the initial feature extractor are fetched, and fed also into an RoI pooling layer, whose parameters are chosen so that the outputs of the two RoIs match in size. Again, we disable input masking which, in sensor fusion, was added to randomly drop paths from one of the two sensor streams.
After that, feature crops from the second stage detector are processed by applying dropout and batch regolarizations, and directly sent into three separate sets of fully connected layers for classification, regression, and orientation of the bounding box proposals, respectively.
III Simulation Setup
| Parameters | Kitti [13] | Lyft [14] | |
|---|---|---|---|
| LiDAR | Angular resolution | 0.08∘ azimuth | 0.02∘ azimuth |
| Beams | 64 | 64 | |
| Points/s | 2.2 M | 2.16 M | |
| FPS | 5–20 Hz | 10 Hz | |
| Camera | Pixel resolution | 13841032 | 10242240 |
| FPS | 15 Hz | 10 Hz | |
In this section we present the datasets (Sec. III-A), the training setup (Sec. III-B) and the performance metrics (Sec. III-C) that were used in our performance evaluation.
III-A Datasets
The performance of the single input and sensor fusion AVOD architectures is evaluated on the three classes of objects (i.e., cars, pedestrians, and cyclists) of the Kitti [13] and Lyft [14] multi-modal datasets. Specifically, the Kitti sensor suite includes a Velodyne Laser scanner, two RGB cameras, and two greyscale cameras, mounted on a Volkswagen Passat [13]. The Lyft setup consists of a center roof LiDAR, six wide-field-of-view cameras, and one front-view long focal length camera, mounted on a Renault Zoe [14]. More details about each sensor’s specifications are reported in Table I.
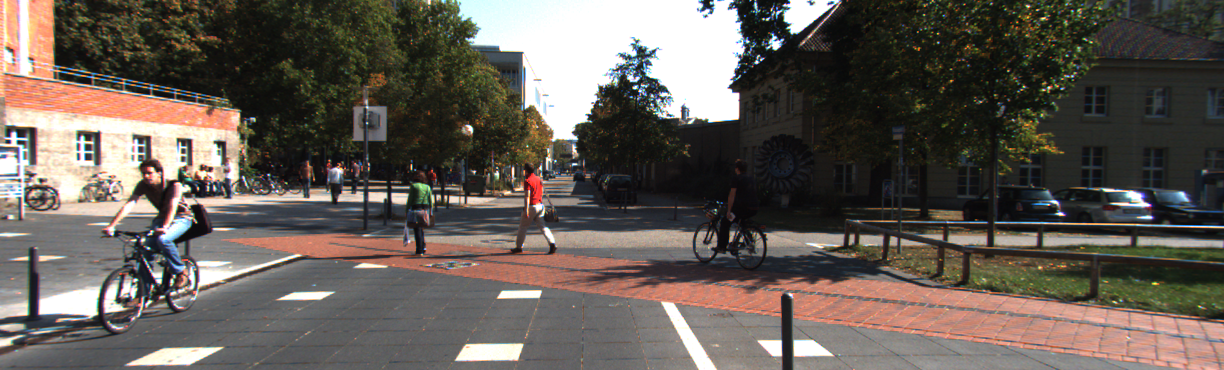

Besides the different sensor suites, the two datasets have different characteristics which make them equally valuable for this work. First, the Kitti dataset contains several dedicated scenes where pedestrians and cyclists are clearly visible and recognizable, as illustrated in Fig. 2(a). On the contrary, these classes of objects are extremely rare in the Lyft acquisitions, and appear either blurred, possibly for privacy reasons, or too far from the source sensor to be detected with sufficient accuracy. The latter problem is particularly critical when considering LiDAR data, which are notoriously too sparse to efficiently capture fine-grained information from small objects over long distances [21], leading to false positives. Second, unlike Kitti, the Lyft dataset incorporates scenes in different lighting and weather conditions, which may severely impact the detection performance.
III-B Training setup
For both Kitti and Lyft datasets, 7500 images were selected for training and 2500 for testing, randomly selected from the available scenes.
Given the inherently different characteristics of the two datasets, two separate networks were trained for the car and the cyclist/pedestrian classes, respectively.
The hardware we used was an HP Z1 Entry Tower, Intel core i7 vPro, equipped with an NVIDIA GeForce RTX 2080.
Convergence was achieved in 40 epochs using the Adam optimizer [22] and batch size 8, for a total runtime of about 8 hours.
III-C Performance Metric: the mAP
The performance of the proposed AVOD implementation for object detection has been evaluated under the mean Average Precision (mAP) metric over classes. Specifically, the per-class Average Precision (AP) is related to the precision-recall curve [23, 24], where precision (recall) is defined as the percentage of correct predictions (correctly predicted objects) over all the predictions (objects). Specifically, the precision-recall curve is obtained by sorting the predictions in such a way that those with highest precision and lowest recall are ordered first, and those with highest recall and lowest precision are ordered last. Interpolating the curve as in [23], the AP is thus computed as the area between the recall axis and the curve. Finally, the mAP is obtained by averaging the mean of the APs for all the considered classes of objects.
In this work we consider the APBEV score, which is the AP computed considering the projection of the bounding boxes on the BEV space.222In the remainder of this paper, for ease of notation and with no ambiguity, the APBEV and AP terms will be used interchangeably. As typical in object detection tasks, only bounding boxes with an IoU greater than 0.5 are considered for the AP computation.
IV Simulation Results
In Sec. IV-A we compare through simulations the accuracy performance of single-input (SIC-AVOD and SIL-AVOD) vs. sensor-fusion (SF-AVOD) object detectors, which is assessed in terms of mAP as well as per-class AP. In Sec. IV-B, the three schemes are compared also in terms of nominal data rate required to broadcast the sensor data.
IV-A Single Input vs. Sensor Fusion
Dataset Comparison. Figs. 3 and 4 show the AP performance of single-input vs. sensor-fusion AVOD on the Kitti and Lyft datasets, respectively. Notably, training on the Kitti data seems to offer a remarkable improvement in terms of mAP than Lyft’s. The difference is particularly significant when considering only the RGB input (in Lyft, the mAP for SIC-AVOD drops by almost 50% compared to Kitti), whereas SIL-AVOD achieves good performance on both datasets (the mAP decreases by only 20% when Lyft is considered). This suggests that our implementation benefits from Kitti’s horizontal (broad FoV) images rather than Lyft’s squared (narrow FoV) images. This is likely due to the fact that the former incorporate, on average, more informative data, as they capture wider road sections where cars, pedestrians and cyclists are located, while neglecting less significant sectors of the scene, e.g., the sky and the background. Moreover, several Lyft scenes were acquired in rainy or foggy conditions, i.e., in low visibility for the cameras, or in busy roads where lined-up vehicles are difficult to distinguish for both sensors. Specifically, different visibility conditions reduce the SIC-AVOD AP from 0.58 (Kitti) to 0.39 (Lyft) for the car class, and from 0.30 (Kitti) to 0.15 (Lyft) for the pedestrian class. Finally, it should be mentioned that the Lyft dataset contains a substantially lower number of pedestrian and cyclist instances than Kitti, thus exacerbating the well-know class imbalance problem [25], as discussed below.
Class Comparison. As we already observed, the AP of the car class is much larger than those of the cyclist and pedestrian classes for both datasets. On one side, smaller entities such as people far from the sensor are known to be more difficult to detect: in RGB camera images, they may appear in few, noisy pixels, whereas in LiDAR point clouds they may be represented by very few points. At the same time, this difference in performance highlights the class imbalance problem [25], occurring when a dataset contains a disproportionate number of instances of one majority class (i.e., cars) with respect to other minority classes (i.e., cyclists and pedestrians). As mentioned in Sec. III, we tried to mitigate this issue by training one network per class, even though the absence of pedestrians and cyclists in most scenes still heavily impacts the overall AP performance.
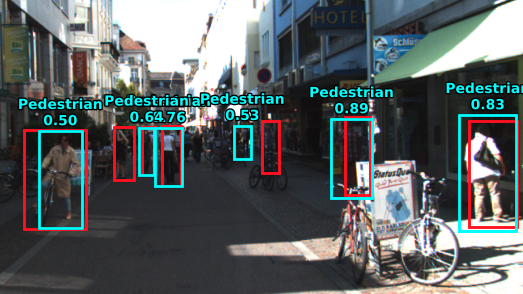
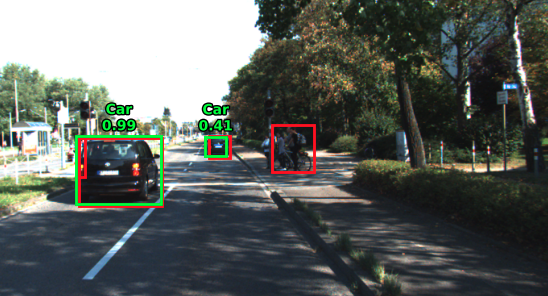
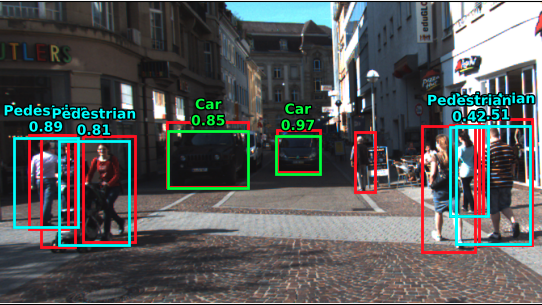
SIC/SIL/SF-AVOD Comparison. For this comparison, we adopt the Kitti dataset, so as to minimize the effects of class imbalance and image blurring. Notably, AVOD was originally designed to jointly exploit 2D RGB camera images and 3D LiDAR point clouds: accordingly, Fig. 3 illustrates that SF-AVOD outperforms both SIC-AVOD and SIL-AVOD, achieving an overall mAP of 0.52, while enhancing the AP of the single classes. The improvement is particularly clear for the detection of smaller objects, for which single-input AVOD struggles: for example, SF-AVOD improves the AP of the pedestrian class by 0.16 compared to SIC-AVOD. The same conclusions can be drawn from Fig. 5, which shows a qualitative example of object detection considering different AVOD architectures. In particular, while SIL-AVOD (Fig. 5(b)) strives to detect people and the farthest cars, which are represented by fewer points, SF-AVOD (Fig. 5(c)) can well recognize different types of objects by also leveraging RGB images. However, it should be noticed that the mAP of SIL-AVOD decreases by only 6% compared to SF-AVOD, in the face of a performance degradation by more than 35% for SIC-AVOD. These results demonstrate that, when considering single inputs, the LiDAR data offer a significant advantage over the camera’s, suggesting that SIL-AVOD may still represent an attractive option to perform robust and reliable detection, as discussed in the following section.
IV-B Capacity vs. Accuracy Trade Off
Autonomous driving requires connected vehicles to share sensor data [26], either to delegate object detection tasks to more powerful edge computing platforms, or to extend the perception range beyond line-of-sight. In a bandwidth-constrained environment, where nodes compete for the limited channel resources, it is of foremost importance to select and transmit only the valuable data [4]. In this section, moving from the AP analysis, we provide guidelines towards the most appropriate object detection solution(s) to achieve high accuracy while minimizing communication costs. More specifically, the sensing vehicles broadcast sensor data according to the type of input that each object detector requires: namely, either LiDAR or camera data for SIL-AVOD and SIC-AVOD, respectively, and a combination of the two for SF-AVOD.
The average data rates of the sensors are obtained from their data sheets. Considering the Kitti suite, point clouds are produced from a 64-beam LiDAR in single mode at a rate equal to 12.48 Bytes/s 100 Mbps [27]. In turn, camera sensors generate data at bit Hz Mbps, which can be reduced down to 12.24 Mbps assuming that PNG compression is applied [13]. Furthermore, whereas a LiDAR can offer a comprehensive view of the surroundings, the limited FoV of the cameras generally necessitates multiple sensors to cover the whole azimuth space. Thus, for a fair comparison, we consider a reference data rate of Mbps for the RGB data, assuming that at least four cameras with a FoV of 90 degrees are employed.
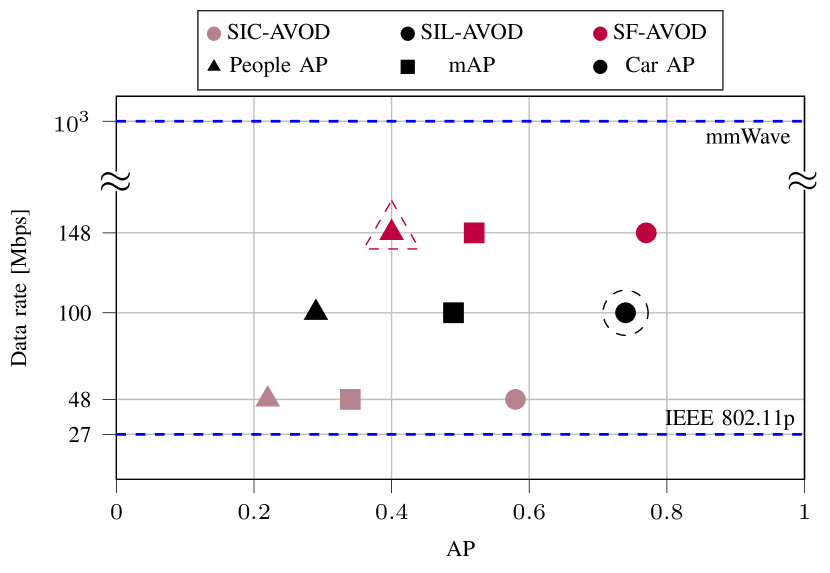
Fig. 6 shows the trade off between detection accuracy and data rate required to achieve it. For the car class, SIL-AVOD achieves a 20% AP gain over SIC-AVOD, while involving more than double its data rate (100 vs. 48 Mbps). In turn, SF-AVOD would generate up to 148 Mbps to distribute data from both sensors, while increasing the AP by only 0.03. Balancing the two, sending only the LiDAR data seems to be the most promising solution for detecting cars. In support of this, connected vehicles may still exchange external data to improve localization (e.g., GPS coordinates), which makes it reasonable to trade a small accuracy drop for a saving on the channel occupancy. On the contrary, non-connected, vulnerable road users such as pedestrians and cyclists should be ensured the greatest possible detection accuracy; thus, we identify SF-AVOD as the working point for these classes, achieving an average AP equal to 0.4 (vs. 0.3 of SIL-AVOD and 0.22 of SIC-AVOD) at Mbps.
As a concluding remark, Fig. 6 shows the nominal capacity provided by some transmission technologies currently considered for vehicular communications. Specifically, although advanced data compression techniques may lift the burden on the channel, the Mbps offered by the IEEE 802.11p standard cannot sustain the LiDAR data flow. In turn, at most two simultaneous camera data streams can be transmitted using PNG compression: in this case, RGB images can still provide a means of detecting critical road entities such as pedestrians, though with low accuracy, as illustrated in Fig. 5(a). Conversely, mmWaves and other high-frequency communication technologies can offer multi-Gbps data rates, thus satisfying network requirements [7].
V Conclusions and Future Works
Beyond-line-of-sight sensing is possible if connected vehicles share perception data with each other. In this work we analyzed how the number and type of sensors affect the object detection performance in real automotive scenarios, and studied how this impacts the channel occupancy. To do so, we altered the code of AVOD, a state-of-the-art object detector, to accept as inputs camera images, LiDAR point clouds, or a combination of the two. Then, we demonstrated that, while LiDAR only perceptions can provide high accuracy for detecting large objects such as cars, a sensor fusion approach would guarantee more robust detections for vulnerable road users such as pedestrians, despite consuming more channel resources.
As part of our future work, we will investigate whether and how detection accuracy would improve using more than two input sensors, and analyze the trade-off between distributed and centralized object detection. Furthermore, a more accurate (system-level) simulation of the network will be considered.
References
- [1] L. Clements and K. Kockelman, “Economic effects of automated vehicles,” Transportation Research Record, vol. 2606, pp. 106–114, 2017.
- [2] A. Varischio, F. Mandruzzato, M. Bullo, M. Giordani, P. Testolina, and M. Zorzi, “Hybrid Point Cloud Semantic Compression for Automotive Sensors: A Performance Evaluation,” IEEE International Conference on Communications (ICC), 2021.
- [3] F. Secci and A. Ceccarelli, “On failures of RGB cameras and their effects in autonomous driving applications,” in IEEE 31st International Symposium on Software Reliability Engineering (ISSRE), 2020.
- [4] T. Higuchi, M. Giordani, A. Zanella, M. Zorzi, and O. Altintas, “Value-Anticipating V2V Communications for Cooperative Perception,” 30th IEEE Intelligent Vehicles Symposium (IV), 2019.
- [5] C. Cao, M. Preda, and T. Zaharia, “3D point cloud compression: A survey,” in 24th Conference on 3D Web Technology, 2019.
- [6] M. Giordani, A. Zanella, T. Higuchi, O. Altintas, and M. Zorzi, “On the Feasibility of Integrating mmWave and IEEE 802.11p for V2V Communications,” in IEEE Connected and Automated Vehicles Symposium (CAVS), 2018.
- [7] T. Zugno, M. Drago, M. Giordani, M. Polese, and M. Zorzi, “Toward Standardization of Millimeter-Wave Vehicle-to-Vehicle Networks: Open Challenges and Performance Evaluation,” IEEE Communications Magazine, vol. 58, no. 9, pp. 79–85, Sep. 2020.
- [8] M. Giordani, A. Zanella, T. Higuchi, O. Altintas, and M. Zorzi, “Investigating Value of Information in Future Vehicular Communications,” IEEE 2nd Connected and Automated Vehicles Symposium (CAVS), 2019.
- [9] ——, “A Framework to Assess Value of Information in Future Vehicular Networks,” 1st ACM Mobihoc Workshop on Technologies, mOdels, and Protocols for Cooperative Connected Cars (TOP-Cars), 2019.
- [10] J. Redmon, S. Divvala, R. Girshick, and A. Farhadi, “You only look once: Unified, real-time object detection,” in IEEE Conference on Computer Vision and Pattern Recognition (CVPR), 2016.
- [11] Y. Zhou and O. Tuzel, “Voxelnet: End-to-end learning for point cloud based 3D object detection,” in IEEE Conference on Computer Vision and Pattern Recognition, 2018.
- [12] J. Ku, M. Mozifian, J. Lee, A. Harakeh, and S. L. Waslander, “Joint 3D proposal generation and object detection from view aggregation,” in IEEE/RSJ International Conference on Intelligent Robots and Systems (IROS), 2018.
- [13] A. Geiger, P. Lenz, and R. Urtasun, “Are we ready for autonomous driving? The KITTI vision benchmark suite,” in IEEE Conference on Computer Vision and Pattern Recognition, June 2012.
- [14] R. Kesten, M. Usman, J. Houston, T. Pandya, K. Nadhamuni, A. Ferreira, M. Yuan, B. Low, A. Jain, P. Ondruska, S. Omari, S. Shah, A. Kulkarni, A. Kazakova, C. Tao, L. Platinsky, W. Jiang, and V. Shet, “Lyft Level 5 Perception Dataset 2020,” https://level5.lyft.com/dataset/.
- [15] D. Xu, D. Anguelov, and A. Jain, “Pointfusion: Deep sensor fusion for 3D bounding box estimation,” in IEEE Conference on Computer Vision and Pattern Recognition, 2018.
- [16] P. Li, S. Liu, and S. Shen, “Multi-sensor 3D object box refinement for autonomous driving,” arXiv preprint arXiv:1909.04942, 2019.
- [17] S. Vora, A. H. Lang, B. Helou, and O. Beijbom, “Pointpainting: Sequential fusion for 3D object detection,” in IEEE/CVF Conference on Computer Vision and Pattern Recognition, 2020.
- [18] X. Chen, H. Ma, J. Wan, B. Li, and T. Xia, “Multi-view 3D Object Detection Network for Autonomous Driving,” in IEEE Conference on Computer Vision and Pattern Recognition (CVPR), July 2017.
- [19] T.-Y. Lin, P. Dollár, R. Girshick, K. He, B. Hariharan, and S. Belongie, “Feature pyramid networks for object detection,” in IEEE Conference on Computer Vision and Pattern Recognition, 2017.
- [20] K. Simonyan and A. Zisserman, “Very deep convolutional networks for large-scale image recognition,” arXiv preprint arXiv:1409.1556, 2014. [Online]. Available: https://arxiv.org/abs/1409.1556
- [21] Y. Guo, H. Wang, Q. Hu, H. Liu, L. Liu, and M. Bennamoun, “Deep learning for 3D point clouds: A survey,” IEEE Transactions on Pattern Analysis and Machine Intelligence [Early Access], 2020.
- [22] Y. Xu, “Faster R-CNN for Open Images Dataset by Keras.” [Online]. Available: https://github.com/RockyXu66/Faster_RCNN_for_Open_Images_Dataset_Keras
- [23] M. Everingham, L. Gool, C. K. Williams, J. Winn, and A. Zisserman, “The Pascal Visual Object Classes (VOC) Challenge,” International Journal of Computer Vision, vol. 88, no. 2, pp. 303–338, Sept. 2010.
- [24] P. A. Flach and M. Kull, “Precision-Recall-Gain curves: PR analysis done right,” in 28th International Conference on Neural Information Processing Systems, 2015.
- [25] K. Oksuz, B. Cam, S. Kalkan, and E. Akbas, “Imbalance Problems in Object Detection: A Review,” IEEE Transactions on Pattern Analysis and Machine Intelligence [Early Access], March 2020.
- [26] E. Arnold, M. Dianati, R. de Temple, and S. Fallah, “Cooperative perception for 3D object detection in driving scenarios using infrastructure sensors,” IEEE Transactions on Intelligent Transportation Systems [Early Access], 2020.
- [27] Velodyne, “HDL-64E S2 and S2.1 – High Definition LiDAR Sensor,” User’s Manual and Programming Guide – Firmware Version 4.07.