Form 10-Q Itemization
Abstract.
The quarterly financial statement, or Form 10-Q, is one of the most frequently required filings for US public companies to disclose financial and other important business information. Due to the massive volume of 10-Q filings and the enormous variations in the reporting format, it has been a long-standing challenge to retrieve item-specific information from 10-Q filings that lack machine-readable hierarchy. This paper presents a solution for itemizing 10-Q files by complementing a rule-based algorithm with a Convolutional Neural Network (CNN) image classifier. This solution demonstrates a pipeline that can be generalized to a rapid data retrieval solution among a large volume of textual data using only typographic items. The extracted textual data can be used as unlabeled content-specific data to train transformer models (e.g., BERT) or fit into various field-focus natural language processing (NLP) applications.
1. Introduction
Publicly traded firms in the United States are required to file financial statements and other disclosure documents that provide a comprehensive review of the firm’s business operations and financial condition to the Securities and Exchange Commission (SEC). In turn, the SEC makes many of those filings publicly available to improve financial transparency and reduce fraud.
Disclosure files could be in plain text or as an HTML file designed for human ingestion. However, these documents lack the hierarchical structure seen in JSON or XML files, optimized for machine extraction (Bao et al., 2009)(Bao et al., 2010). Additionally, although following a predefined reporting structure, companies have considerable flexibility in changing the tagging, wording, and presentation of these documents. As a result, the same types of SEC filings may vary significantly between companies and over time, prohibiting researchers, regulators, and even many well-equipped practitioners from utilizing machine power to extract information (Cohen et al., 2020)(Foucault and Frésard, 2019)(Li, 2008) . The purpose of this study is to present a systematic solution for retrieving data from the quarterly financial statement, refereed as the Form 10-Q, which is one of the most critical financial disclosures to the SEC. In particular, we commit to developing a system capable of efficiently retrieving typographically formatted data from 10-Qs that lack a machine-readable hierarchy. The output would be item-level records in key-value storage database.
A fundamental challenge to information retrieval from 10-Qs is the considerable amount and variety of its reporting formats. By 2019, about 587,000 10-Qs have been submitted to the SEC by over 26,000 companies. The structure of most 10-Qs, primarily in HTML format, is only required to visually comply with the SEC’s typographic structure specification, arranged in the s and s, as illustrated in Table 1. As a result, information extraction would rely heavily on keyword searching, such as ”Item 1. Legal Proceedings”, to parse the whole text into its constituent items. However, the substantial volume of highly tailored 10-Qs significantly complicates this effort. The following is a list of the most often encountered troublesome scenarios.
-
(1)
Each company has its tailored design of HTML presentations, which could vary quarterly. The layout of a 10-Q may not align with the typographical structure defined by SEC.
-
(2)
Keywords are not universal - companies may not use the exact wording from SEC’s predefined structure, like ”Item 1. Legal Proceedings” in Table 1 but instead, use similar titles like ”Item i” or ”Legal Proceedings.”
-
(3)
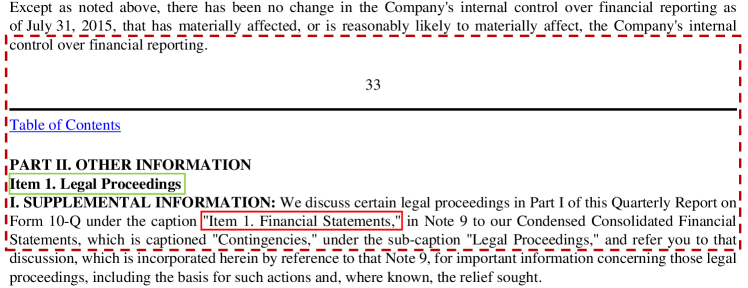
Keywords can be present throughout the main text without necessarily being the title of the Item or Part. Those keywords frequently appear in other places like a table of content, paragraph references, page break, or even referenced in a paragraph, as shown in Figure 2.
The difficulties outlined above will inevitably result in either time-consuming case-by-case manual collection or an omission of a significant portion of 10-Q files, resulting in bias and inconsistent analytic results. Many previous studies take the latter approach, presumably due to the magnitude of collection burdens. For instance, a literature (Loughran and McDonald, 2011) reported a similar task on 10-K, annual disclosure to the SEC, at a rate of around 75%, while subsequent work (Dyer et al., 2017) record an even lower rate at a similar effort.
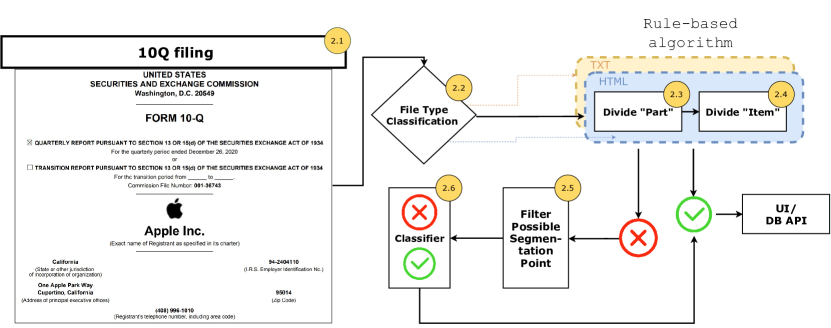
Given that the past literature has not yet provided a generalized and reliable methodology for resolving such challenges, our study presents a viable solution using multi-stage processes via a pipeline method. First, it employs a rule-based approach to extract textual information from the majority of 10-Qs. Then, the remainder of 10-Q information is extracted using a Convolutional Neural Network (CNN) image classifier trained on visual characters applied by human reviewers. A graphical presentation illustrates the flow of our method (Figure 1), and each component on the pipeline will be addressed in detail in the following subsections.
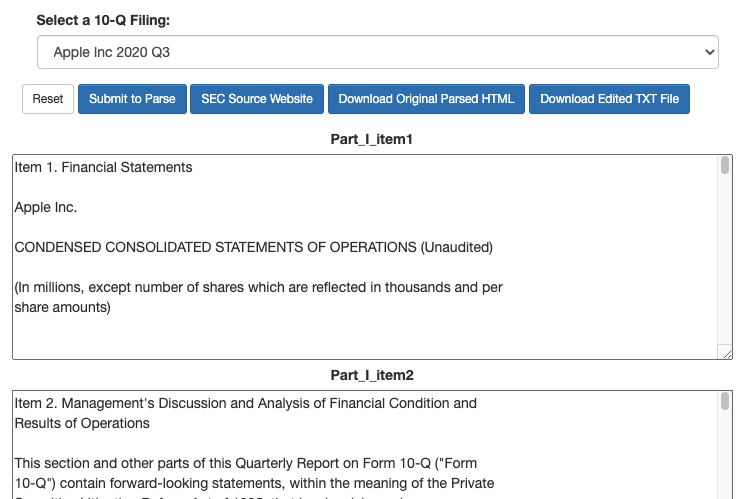
Our pipeline methodology can accommodate a wide range of 10-Q variances, most notably in the HTML layouts used by various companies and reporting periods. Performance-wise, the pipeline converts 10-Q documents to a machine-readable format within 0.1 seconds. In summary, the pipeline processes 10-Q documents available on the SEC website in HTML or plain text format111Database available at https://www.sec.gov/edgar/searchedgar/companysearch.html and generates hierarchical textual outputs. Each item in a 10-Q is dissected into separate text files, designated in their respective section as {document id}_{Part number}_{Item number}. Our demo tool 222Additional information, demo tool, and sample dataset could be requested. interface is illustrated in Figure 3.
This pipeline’s output would enable a variety of downstream tasks, including non-quantitative natural language processing challenges related to asset pricing in company risk and management discussion (Bao and Datta, 2014; Levine et al., 2020; Carpenter et al., 2021a; Li et al., 2019, 2020; Dai et al., 2020; Zhu et al., 2020; Jarrow et al., 2021; Zhu et al., 2021a; Zhu, 2020; Zhu et al., 2021c, b; Jie et al., 2021; L.A. et al., 2016; PrashanthL. et al., 2016; Jie, 2018; Zhao et al., 2018; Lin et al., 2018; Jie et al., 2018; Huang et al., 2020, 2021; Begel et al., 2020; Johnson et al., 2018; Chen et al., 2019; Chen and Davidson, 2020; Guo, 2019; Fang, 2020; Mao et al., 2014; Harvey et al., 2017; Zheng et al., 2019b, a; Acharya et al., 2019; Wang et al., 2014; Mao et al., 2017; Fu et al., 2019; Chen et al., 2020a; Cheng et al., 2021; Yang et al., 2021; Chen et al., 2021; Bo et al., 2021; Bo et al., 2019; Xie et al., 2018; Wang et al., 2018; Chen et al., 2020b; Zhang et al., 2020; Carpenter et al., 2021b; Karvetski et al., 2021; Ma et al., 2020), which are becoming increasingly attractive issues in finance and accounting research.
| Part I — Financial Information |
|---|
| Item 1. Financial Statements. |
| Item 2. MD&A Condition and Results of Operations. |
| Item 3. Quantitative and Qualitative Disclosures |
| About Market Risk. |
| Item 4. Controls and Procedures. |
| Part II — Other Information |
| Item 1. Legal Proceedings. |
| Item 1-A. Risk Factors. |
| Item 2. Unregistered Sales of Equity Securities and Use of |
| Proceeds. |
| Item 3. Defaults Upon Senior Securities. |
| Item 4. Mine Safety Disclosures. |
| Item 5. Other Information. |
| Item 6. Exhibits. |
=1mm
2. Pipeline Design
The pipeline depicted in Figure 1 is composed of its constituent elements. A rule-based algorithm and a CNN image classifier are two critical components. As discussed in Sections 2.3 and 2.4, the rule-based approach successfully retrieves 95% of our 10-Q sample. Additionally, when paired with other pipeline elements, the CNN image classifier can handle the 4% of our 10-Q sample that our rule-based algorithm cannot, as stated in Section 2.6.
2.1. Structure of 10-Q document
Form 10-Q is a quarterly financial disclosure mandated by the SEC. The SEC gives precise instructions on filing formats, including 2 s and 11 s covering financial and other information to enhance companies’ transparency to shareholders and regulators. In Table 1, we supply those predefined titles for the s and s.
2.2. File Type Classification
The SEC 10-Q filing typically has two types of formats – HTML and text. Most filings in text format are antiquated, and more recent filings from 2003 onwards are predominantly in HTML format. Though data of both formats are available to be processed, this paper mainly focuses on the HTML format given that recent and up-to-date filings are relevant ones to be examined, and HTML also covers more diverse situations. A similar algorithm equivalent to section 2.3 to process unstructured plain text files is also implemented. A classifier is designed to identify the data type, and send the data into algorithms with their corresponding input format.
2.3. Identify Parts and Parse
Due to the structure constraint described previously, we use a divide-and-conquer approach to organize and decompose the textual contents using standard 10-Q layouts. This strategy consists of two steps: the first is to divide a document into two s; the second is to divide each into s and handle a smaller group of paragraphs. This two-step method is critical for 10-Q, as its item numbering system contains repeated numbers by design (for example, each shares some identical title, ”Item 1”). Without segmenting 10-Q by s, the keyword-based dividing procedure may result in some unexpected errors.
Due to the fact that the majority of those 10-Qs adhere to SEC guideline, though loosely, we separate them into 10-Q s using a rule-based algorithm. We include several mechanisms for detecting and resolving mistakes at various levels of the method for division. This section of the algorithm requires three pillars to interpret the 10-Q filings at the s level,
-
(1)
The first pillar utilizes the hyperlink provided in the table of content to locate the separation points between two s.
-
(2)
The next pillar uses regular expressions to accomplish the same operation when errors occur in the hyperlink approach.
-
(3)
The final pillar utilized the first 10-Q Part II or equivalent titles that appeared in the HTML header of new pages if both earlier pillars are failed to obtain meaningful records.
These three pillars ensured that, when errors are detected in an earlier stage, a specific algorithm corresponding to the error would be invoked as an attempt to bypass the error and retrieve the contents.
2.4. Identify Items Sequentially
Assuming content are successfully divided at s level, there is no duplicate s under the same , so it can be reliably accomplished using a single pass sequential process.
However, there are several typical scenarios in which the or titles can be falsely detected. Figure 2 illustrates a good example. The green rectangle could be considered as a subtitle under Part II, rather than an title. Other negative cases include but are not limited to appearing in the table of content, titles, paragraph references (red rectangle), or page breaks.
Despite the existence of those challenges, till this step, this rule-based algorithm can still achieve high accuracy for more than 95.43% of 10-Q filings of our selected 10-Q samples, as shown in the result section. We will then focus on coping with the remaining cases in the following two subsections.
Finally, it is worth highlighting the importance of this procedure. The U.S. stock market can simultaneously comprise more than 8,000 public companies at a given time, 5% of which may result in up to 400 unreadable 10-Qs in a quarter.
2.5. Segmentation Point Identification
To resolve the 5% inaccuracy generated by the rule-based algorithm, we resort to filtering out all potential segmentation points by exact keywords matching and generating corresponding context data for further classification. Unfortunately, the keywords searching step are not used directly at the early stage of our pipeline because Item (Part)-related keywords may exist multiple locations in a 10-Q, resulting in a significant increase in the computing time for CNN image classifier. Thus, we trade off time-intensity with a smaller set of challenging cases to improve our overall performance.
2.6. Identify Items through Classification
To identify Items, we used image-based CNN methods (Du et al., 2020; Du et al., 2021b, a; Du et al., 2019, 2015, 2018; Liu et al., 2019; Shi et al., 2020a; Zhai et al., 2019; Reza et al., 2017; Shi et al., 2019a, b, 2020b; Ding et al., 2017; Le et al., 2020; Shi et al., 2020c; Ding et al., 2020; Gao et al., 2020a; Xu et al., 2020b, 2019; Gao et al., 2020b; Hu et al., 2019; Xu et al., 2020a; Tang et al., 2021a, 2019a; Tang et al., 2019b, 2018, 2021b; Li et al., 2021) to address this classification problem. The typographic structure in 10-Q may be more readily captured through aesthetic qualities, especially when many text-based models, such as NLP methods, commonly ignore font size, case, and text position on a page. As a result, we change this textual analysis problem to a computer vision issue to determine the document’s structure. In Figure 2, a sample input to CNN is depicted in the red dot line rectangle box. Our approach adopts a binary classification using a ResNet34 (He et al., 2016) architecture.
In addition, other baseline approaches are tested. In terms of model parameter, 8 closest neighbors and inverse-distance as the weight factor are for k-nearest neighbors model. For Decision Tree model, the depth limits to maximum 8 and weak classifiers cap in AdaBoost to be 100. Features are chosen from our massive observations, applied as following: 1. A binary value equal to one if an {Item number}.{Item name} is in bold, 0 otherwise. 2. A binary value equal to one if an {Item number}.{Item name} is aligned in the center, 0 otherwise 3. The number of space characters on the left of {Item number}.{Item name}. 4. The number of space characters on the right of {Item number}.{Item name}. 5. The number of characters included in {Item number}.{Item name}.
3. Experiment and Results
Our data usage, performance and results will be presented in this section. We will first spell out the performance of our first half of the pipeline, defined as processes before 2.5, followed by the second half performance, defined as processes after 2.5, and eventually summarizing the whole data operation process indicated in Figure 1.
3.1. First Half of Pipeline Performance
Our rule-based algorithm processed altogether 193,000 documents, belonging to 8,100 unique firms published between 1994 and 2017, reporting time-out errors which fails to locate two s for 1,246 (0.65%) filings and fails to parse Part 1 for 4,038, and Part 2 for 3,557 filings respectively. These errors indicate a 4.57% algorithm limitation for which a postprocess will be applied on.
To verify the validity and accuracy of our rule-based model, we randomly selected 5,570 s including 3,528 s that are considered correct itemizations and another 2,042 ones that are considered false, defined in 2.3 and shown Figure 2. We asked three human labelers for manual check - in particular, they were required to determine whether an is correctly captured as the title (accurate parsing) instead of as words inside the content paragraph or anywhere else (inaccurate parsing). Within all the labeled data, there are 2,880 companies covered, each company has an average of 1.5 filings covered in this set over the same period. No duplicate of company is removed given format changes over quarters.
3.2. Second Half of Pipeline Performance
Although our rule-based approach outperformed the previous baseline, it is nowhere near a perfect algorithm. The machine learning models and CNN are tested and proven to be crucial as a building block (section 2.6) in our integrated pipeline. Our final implementation used a CNN model, which is a slightly modified version of ResNet34 at the last layer.
In terms of labelled data, there are two separate sets. First coming from verification process described in section 3.1, were used to train our models. The train, validation and test split are 8:1:1. Train and test results are presented. Challenging sample is defined as files initially failed in 4.57% mentioned in section 3.1. Second, for this challenging portion of data, because they are not included in previous set, our coauthor team manually labeled the data ourselves. Within 1000 total data points, we have 371 positive and 629 negative observations.
As can be seen in Table 3, the CNN model yields the best result, without additional rules or human generated features. We consider it as a successful attempt of converting textual analysis problem into a computer vision problem to identify the document’s hierarchy.
Nevertheless, it is worth noting that the trained CNN model is not designed to be deployed independently without our rule-base method because of the enormous possibility of s identified by keyword search described in section 2.5. Our stand-alone CNN model would significantly deteriorate pipeline performance in speed and accuracy (e.g., 83.4% in challenging cases). As the first half of the pipeline ensures both accuracy and speed, the CNN model performs the best as a building block to solve challenging cases in the whole system.
The overall scientific performance of the whole system would be around 98.97% (95.16% + 4.57% × 0.834), or approximately a thousand filings in total require human attention. Our actual large-scale result on over half million filings has a 1.6% failure rate.
| Labeled True | Labeled False | Total | |
|---|---|---|---|
| Rule-Based True | 3,518 | 10 | 3,528 |
| Rule-Based False | 7 | 2,035 | 2,042 |
| Total | 3,525 | 2,045 | 5,570 |
| Recall | Precision | Accuracy | ||
| Panel A:Training Sample | ||||
| CNN | 0.997 | 0.997 | 0.998 | 0.997 |
| Logistic Regression | 0.911 | 0.923 | 0.897 | 0.917 |
| Naive Bayes | 0.922 | 0.909 | 0.894 | 0.916 |
| SVM | 0.922 | 0.912 | 0.896 | 0.917 |
| -Nearest Neighbor | 0.960 | 0.955 | 0.946 | 0.957 |
| Decision Tree | 0.960 | 0.956 | 0.947 | 0.958 |
| AdaBoost | 0.952 | 0.938 | 0.931 | 0.945 |
| Panel B: Testing Sample | ||||
| CNN | 0.967 | 0.983 | 0.984 | 0.975 |
| Logistic Regression | 0.977 | 0.947 | 0.935 | 0.962 |
| Naive Bayes | 0.930 | 0.968 | 0.916 | 0.949 |
| SVM | 0.938 | 0.953 | 0.909 | 0.945 |
| -Nearest Neighbor | 0.946 | 0.992 | 0.948 | 0.968 |
| Decision Tree | 0.930 | 0.992 | 0.935 | 0.960 |
| AdaBoost | 0.977 | 0.940 | 0.929 | 0.958 |
| Panel C: Challenging Sample | ||||
| CNN | 0.841 | 0.834 | 0.879 | 0.837 |
| Logistic Regression | 0.776 | 0.780 | 0.836 | 0.778 |
| Naive Bayes | 0.803 | 0.772 | 0.839 | 0.787 |
| SVM | 0.798 | 0.769 | 0.836 | 0.783 |
| -Nearest Neighbor | 0.671 | 0.798 | 0.815 | 0.729 |
| Decision Tree | 0.650 | 0.785 | 0.804 | 0.711 |
| AdaBoost | 0.806 | 0.782 | 0.845 | 0.794 |
4. Demonstration Interface
Figure 3 presents a user interface for researchers and analysts to quickly identify desired s information; users can have a view of the itemized content, edit the data in text boxes and export them in different formats. In addition to the demonstration to accelerate single document research, we would show another demo example of downstream application using the information generated by our proposed system at a large scale.
=1mm
5. Conclusion
In this paper, we purposed an integrated pipeline to retrieve itemized information from 10-Qs. It provides a solution for the long-standing problem of large-scale itemization for finance practitioners and researchers. We believe it would enable further research in risk analysis, management strategy and asset pricing by leveraging massive amount of data retrieved from this work.
References
- (1)
- Acharya et al. (2019) Anil Acharya, Yantian Hou, Ying Mao, Min Xian, and Jiawei Yuan. 2019. Workload-Aware Task Placement in Edge-Assisted Human Re-identification. In 2019 16th Annual IEEE International Conference on Sensing, Communication, and Networking (SECON ’19). IEEE, 1–9.
- Bao and Datta (2014) Yang Bao and Anindya Datta. 2014. Simultaneously discovering and quantifying risk types from textual risk disclosures. Management Science 60, 6 (2014), 1371–1391. ISBN: 0025-1909 Publisher: INFORMS.
- Bao et al. (2009) Zhifeng Bao, Tok Wang Ling, Bo Chen, and Jiaheng Lu. 2009. Effective XML Keyword Search with Relevance Oriented Ranking. In 2009 IEEE 25th International Conference on Data Engineering. 517–528. https://doi.org/10.1109/ICDE.2009.16
- Bao et al. (2010) Zhifeng Bao, Jiaheng Lu, Tok Wang Ling, and Bo Chen. 2010. Towards an Effective XML Keyword Search. IEEE Transactions on Knowledge and Data Engineering 22, 8 (2010), 1077–1092. https://doi.org/10.1109/TKDE.2010.63
- Begel et al. (2020) Andrew Begel, John Tang, Sean Andrist, Michael Barnett, Tony Carbary, Piali Choudhury, Edward Cutrell, Alberto Fung, Sasa Junuzovic, Daniel McDuff, et al. 2020. Lessons Learned in Designing AI for Autistic Adults. In The 22nd International ACM SIGACCESS Conference on Computers and Accessibility. 1–6.
- Bo et al. (2021) Di Bo, Hoon Hwangbo, Vinit Sharma, Corey Arndt, and Stephanie C TerMaath. 2021. A Subspace-based Approach for Dimensionality Reduction and Important Variable Selection. arXiv preprint arXiv:2106.01584 (2021).
- Bo et al. (2019) Di Bo, Kunru Yang, Qingsong Xie, Chang He, Bingjian Zhang, Qinglin Chen, Zhiwen Qi, Jingzheng Ren, and Ming Pan. 2019. A novel approach for detailed modeling and optimization to improve energy saving in multiple effect evaporator systems. Industrial & Engineering Chemistry Research 58, 16 (2019), 6613–6625.
- Carpenter et al. (2021a) Jennifer N Carpenter, Fangzhou Lu, and Robert F Whitelaw. 2021a. The Price and Quantity of Interest Rate Risk. Working Paper 28444. National Bureau of Economic Research. https://doi.org/10.3386/w28444
- Carpenter et al. (2021b) Jennifer N. Carpenter, Fangzhou Lu, and Robert F. Whitelaw. 2021b. The real value of China’s stock market. Journal of Financial Economics 139, 3 (2021), 679–696.
- Chen and Davidson (2020) Leshang Chen and Susan B. Davidson. 2020. Automating Software Citation using GitCite. In 2020 IEEE 36th International Conference on Data Engineering (ICDE). 1754–1757. https://doi.org/10.1109/ICDE48307.2020.00162
- Chen et al. (2019) Lingjiao Chen, Hongyi Wang, Leshang Chen, Paraschos Koutris, and Arun Kumar. 2019. Demonstration of Nimbus: Model-based Pricing for Machine Learning in a Data Marketplace. 1885–1888. https://doi.org/10.1145/3299869.3320231
- Chen et al. (2020b) Muhao Chen, Hongming Zhang, Haoyu Wang, and Dan Roth. 2020b. ”What Are You Trying to Do?” Semantic Typing of Event Processes. CoRR abs/2010.06724 (2020). arXiv:2010.06724 https://arxiv.org/abs/2010.06724
- Chen et al. (2021) Xuan Chen, Feng Cheng, Cong Liu, Long Cheng, and Yin Mao. 2021. An improved Wolf pack algorithm for optimization problems: Design and evaluation. Plos one 16, 8 (2021), e0254239.
- Chen et al. (2020a) Xuan Chen, Long Cheng, Cong Liu, Qingzhi Liu, Jinwei Liu, Ying Mao, and John Murphy. 2020a. A woa-based optimization approach for task scheduling in cloud computing systems. IEEE Systems journal 14, 3 (2020), 3117–3128.
- Cheng et al. (2021) Long Cheng, Ying Wang, Qingzhi Liu, Dick HJ Epema, Cheng Liu, Ying Mao, and John Murphy. 2021. Network-Aware Locality Scheduling for Distributed Data Operators in Data Centers. IEEE Transactions on Parallel and Distributed Systems 32, 6 (2021), 1494–1510.
- Cohen et al. (2020) Lauren Cohen, Christopher Malloy, and Quoc Nguyen. 2020. Lazy prices. The Journal of Finance 75, 3 (2020), 1371–1415. ISBN: 0022-1082 Publisher: Wiley Online Library.
- Dai et al. (2020) Rui Dai, Hao Liang, and Lilian Ng. 2020. Socially responsible corporate customers. Journal of Financial Economics (2020). https://doi.org/10.1016/j.jfineco.2020.01.003
- Ding et al. (2017) Yu Ding, Lei Shi, and Zhigang Deng. 2017. Perceptual enhancement of emotional mocap head motion: An experimental study. In Proc. International Conference on Affective Computing and Intelligent Interaction. SA, TX.
- Ding et al. (2020) Yu Ding, Lei Shi, and Zhigang Deng. 2020. Low-Level Characterization of Expressive Head Motion Through Frequency Domain Analysis. IEEE Transactions on Affective Computing 11, 3 (2020), 405–418. https://doi.org/10.1109/TAFFC.2018.2805892
- Du et al. (2018) Tianming Du, Xuqing Liu, Honggang Zhang, and Bo Xu. 2018. Real-time lesion detection of cardiac coronary artery using deep neural networks. In 2018 International Conference on Network Infrastructure and Digital Content (IC-NIDC). IEEE, 150–154.
- Du et al. (2019) Tianming Du, Xiaotong Shi, Ruijia Wu, Honggang Zhang, Xiaolin Song, Jin Feng, and Fuzhuo Sun. 2019. Morphology Reconstruction of Obstructed Coronary Artery in Angiographic Images. In 2019 IEEE Visual Communications and Image Processing (VCIP). IEEE, 1–4.
- Du et al. (2015) Tianming Du, Xiaoru Wang, Junping Du, and Yuanyou Wang. 2015. An Algorithm for Image Classification Based on Semantic Transfer Learning. In Advanced Multimedia and Ubiquitous Engineering. Springer, 249–256.
- Du et al. (2021a) Tianming Du, Lihua Xie, Honggang Zhang, Xuqing Liu, Xiaofei Wang, Donghao Chen, Yang Xu, Zhongwei Sun, Wenhui Zhou, Lei Song, et al. 2021a. Training and validation of a deep learning architecture for the automatic analysis of coronary angiography. EuroIntervention: journal of EuroPCR in collaboration with the Working Group on Interventional Cardiology of the European Society of Cardiology 17, 1 (2021), 32–40.
- Du et al. (2021b) Tianming Du, Honggang Zhang, Yuemeng Li, Stephen Pickup, Mark Rosen, Rong Zhou, Hee Kwon Song, and Yong Fan. 2021b. Adaptive convolutional neural networks for accelerating magnetic resonance imaging via k-space data interpolation. Medical Image Analysis 72 (2021), 102098.
- Du et al. (2020) Tianming Du, Yanci Zhang, Xiaotong Shi, and Shuang Chen. 2020. Multiple Slice k-space Deep Learning for Magnetic Resonance Imaging Reconstruction. In 2020 42nd Annual International Conference of the IEEE Engineering in Medicine Biology Society (EMBC). 1564–1567. https://doi.org/10.1109/EMBC44109.2020.9175642
- Dyer et al. (2017) Travis Dyer, Mark Lang, and Lorien Stice-Lawrence. 2017. The evolution of 10-K textual disclosure: Evidence from Latent Dirichlet Allocation. Journal of Accounting and Economics 64, 2-3 (2017), 221–245. ISBN: 0165-4101, Elsevier.
- Fang (2020) Chuck Fang. 2020. Insurance against Long-Run Volatility Risk: Demand, Supply, and Pricing. Capital Markets: Asset Pricing & Valuation eJournal (2020).
- Foucault and Frésard (2019) Thierry Foucault and Laurent Frésard. 2019. Corporate strategy, conformism, and the stock market. The Review of Financial Studies 32, 3 (2019), 905–950. ISBN: 0893-9454 Publisher: Oxford University Press.
- Fu et al. (2019) Yuqi Fu, Shaolun Zhang, Jose Terrero, Ying Mao, Guangya Liu, Sheng Li, and Dingwen Tao. 2019. Progress-based Container Scheduling for Short-lived Applications in a Kubernetes Cluster. In 2019 IEEE International Conference on Big Data (BigData’19).
- Gao et al. (2020a) Fei Gao, Teresa Wu, Xianghua Chu, Hyunsoo Yoon, Yanzhe Xu, and Bhavika Patel. 2020a. Deep Residual Inception Encoder–Decoder Network for Medical Imaging Synthesis. IEEE Journal of Biomedical and Health Informatics 24, 1 (2020), 39–49. https://doi.org/10.1109/JBHI.2019.2912659
- Gao et al. (2020b) Fei Gao, H. Yoon, Yanzhe Xu, D. Goradia, Ji Luo, Teresa Wu, and Y. Su. 2020b. AD-NET: Age-adjust neural network for improved MCI to AD conversion prediction. NeuroImage : Clinical 27 (2020).
- Guo (2019) Hongye Guo. 2019. Underreaction, Overreaction, and Dynamic Autocorrelation of Stock Returns. Wealth Management eJournal (2019).
- Harvey et al. (2017) Hank Harvey, Ying Mao, Yantian Hou, and Bo Sheng. 2017. EDOS: Edge Assisted Offloading System for Mobile Devices. In The 26th International Conference on Computer Communications and Networks (ICCCN 2017).
- He et al. (2016) Kaiming He, Xiangyu Zhang, Shaoqing Ren, and Jian Sun. 2016. Deep Residual Learning for Image Recognition. 770–778. https://doi.org/10.1109/CVPR.2016.90
- Hu et al. (2019) L. Hu, H. Yoon, J. Eschbacher, L. Baxter, A. Dueck, A. Nespodzany, K. Smith, P. Nakaji, Y. Xu, L. Wang, J. Karis, A. Hawkins-Daarud, K. Singleton, P. Jackson, B. Anderies, B. Bendok, R. Zimmerman, C. Quarles, A. B. Porter-Umphrey, M. Mrugala, A. Sharma, J. Hoxworth, M. Sattur, N. Sanai, P. E. Koulemberis, C. Krishna, J. R. Mitchell, T. Wu, N. Tran, K. Swanson, and J. Li. 2019. Accurate Patient-Specific Machine Learning Models of Glioblastoma Invasion Using Transfer Learning. American Journal of Neuroradiology 40 (2019), 418 – 425.
- Huang et al. (2020) Xiao Huang, Zhenlong Li, Junyu Lu, Sicheng Wang, Hanxue Wei, and Baixu Chen. 2020. Time-series clustering for home dwell time during COVID-19: what can we learn from it? ISPRS International Journal of Geo-Information 9, 11 (2020), 675.
- Huang et al. (2021) Xiao Huang, Junyu Lu, Song Gao, Sicheng Wang, Zhewei Liu, and Hanxue Wei. 2021. Staying at Home Is a Privilege: Evidence from Fine-Grained Mobile Phone Location Data in the United States during the COVID-19 Pandemic. Annals of the American Association of Geographers (2021), 1–20.
- Inc. (2021) Apple Inc. 2021. aapl-20201226. Retrieved March 6, 2021 from https://www.sec.gov/Archives/edgar/data/320193/000032019321000010/aapl-20201226.htm
- Jarrow et al. (2021) Robert A Jarrow, Rinald Murataj, Martin T Wells, and Liao Zhu. 2021. The Low-volatility Anomaly and the Adaptive Multi-Factor Model. arXiv preprint arXiv:2003.08302 (2021).
- Jie (2018) Cheng Jie. 2018. Decision Making Under Uncertainty: New Models and Applications. Ph. D. Dissertation.
- Jie et al. (2018) Cheng Jie, Prashanth L.A., Michael Fu, Steve Marcus, and Csaba Szepesvári. 2018. Stochastic Optimization in a Cumulative Prospect Theory Framework. IEEE Trans. Automat. Control 63, 9 (2018), 2867–2882. https://doi.org/10.1109/TAC.2018.2822658
- Jie et al. (2021) Cheng Jie, Da Xu, Zigeng Wang, Lu Wang, and Wei-Yuan Shen. 2021. Bidding via Clustering Ads Intentions: an Efficient Search Engine Marketing System for E-commerce. ArXiv abs/2106.12700 (2021).
- Johnson et al. (2018) Timothy Johnson, Ping Liu, and Yingjie Yu. 2018. The Private and Social Value of Capital Structure Commitment. SSRN Electronic Journal (01 2018). https://doi.org/10.2139/ssrn.3300371
- Karvetski et al. (2021) Christopher Karvetski, Carolyn Meinel, Daniel Maxwell, Yunzi Lu, Barb Mellers, and Philip Tetlock. 2021. Forecasting the Accuracy of Forecasters from Properties of Forecasting Rationales. SSRN Electronic Journal (01 2021). https://doi.org/10.2139/ssrn.3779404
- L.A. et al. (2016) Prashanth L.A., Cheng Jie, Michael Fu, Steve Marcus, and Csaba Szepesvari. 2016. Cumulative Prospect Theory Meets Reinforcement Learning: Prediction and Control. In Proceedings of The 33rd International Conference on Machine Learning (Proceedings of Machine Learning Research, Vol. 48), Maria Florina Balcan and Kilian Q. Weinberger (Eds.). PMLR, New York, New York, USA, 1406–1415.
- Le et al. (2020) Ha Le, Christos Smailis, Lei Shi, and Ioannis Kakadiaris. 2020. EDGE20: A Cross Spectral Evaluation Dataset for Multiple Surveillance Problems. In Proceedings of the IEEE/CVF Winter Conference on Applications of Computer Vision (WACV).
- Levine et al. (2020) Ross Levine, Chen Lin, Qilin Peng, and Wensi Xie. 2020. Communication within Banking Organizations and Small Business Lending. The Review of Financial Studies 33, 12 (03 2020), 5750–5783. https://doi.org/10.1093/rfs/hhaa036
- Li (2008) Feng Li. 2008. Annual report readability, current earnings, and earnings persistence. Journal of Accounting and economics 45, 2-3 (2008), 221–247. Publisher: Elsevier.
- Li et al. (2020) Huan Li, Stacy Patterson, Yuhao Yi, and Zhongzhi Zhang. 2020. Maximizing the Number of Spanning Trees in a Connected Graph. IEEE Transactions on Information Theory 66, 2 (2020), 1248–1260. https://doi.org/10.1109/TIT.2019.2940263
- Li et al. (2019) Huan Li, Richard Peng, Liren Shan, Yuhao Yi, and Zhongzhi Zhang. 2019. Current Flow Group Closeness Centrality for Complex Networks?. In The World Wide Web Conference (San Francisco, CA, USA) (WWW ’19). Association for Computing Machinery, New York, NY, USA, 961–971. https://doi.org/10.1145/3308558.3313490
- Li et al. (2021) Yifei Li, Kuangyan Song, Yiming Sun, and Liao Zhu. 2021. FrequentNet: A Novel Interpretable Deep Learning Model for Image Classification. Available at SSRN: https://ssrn.com/abstract=3895462 (2021).
- Lin et al. (2018) Kun Lin, Cheng Jie, and Steven I. Marcus. 2018. Probabilistically distorted risk-sensitive infinite-horizon dynamic programming. Automatica 97 (2018), 1–6. https://doi.org/10.1016/j.automatica.2018.07.028
- Liu et al. (2019) Xuqing Liu, Tianming Du, Honggang Zhang, and Chunlei Sun. 2019. Detection and Classification of Chronic Total Occlusion lesions using Deep Learning. In 2019 41st Annual International Conference of the IEEE Engineering in Medicine and Biology Society (EMBC). IEEE, 828–831.
- Loughran and McDonald (2011) Tim Loughran and Bill McDonald. 2011. When is a liability not a liability? Textual analysis, dictionaries, and 10‐Ks. The Journal of Finance 66, 1 (2011), 35–65. ISBN: 0022-1082 Publisher: Wiley Online Library.
- Ma et al. (2020) Zhiqiang Ma, Steven Pomerville, Mingyang Di, and Armineh Nourbakhsh. 2020. SPot: A Tool for Identifying Operating Segments in Financial Tables. In Proceedings of the 43rd International ACM SIGIR Conference on Research and Development in Information Retrieval (Virtual Event, China) (SIGIR ’20). Association for Computing Machinery, New York, NY, USA, 2157–2160. https://doi.org/10.1145/3397271.3401406
- Mao et al. (2017) Ying Mao, Jenna Oak, Anthony Pompili, Daniel Beer, Tao Han, and Peizhao Hu. 2017. Draps: Dynamic and resource-aware placement scheme for docker containers in a heterogeneous cluster. In 2017 IEEE 36th International Performance Computing and Communications Conference (IPCCC). IEEE, 1–8.
- Mao et al. (2014) Ying Mao, Jiayin Wang, Joseph Paul Cohen, and Bo Sheng. 2014. Pasa: Passive broadcast for smartphone ad-hoc networks. In 2014 23rd International Conference on Computer Communication and Networks (ICCCN). IEEE, 1–8.
- PrashanthL. et al. (2016) A. PrashanthL., Cheng Jie, M. Fu, S. Marcus, and Csaba Szepesvari. 2016. Cumulative Prospect Theory Meets Reinforcement Learning: Prediction and Control. In ICML.
- Reza et al. (2017) Md Alimoor Reza, Hui Zheng, Georgios Georgakis, and Jana Košecká. 2017. Label propagation in RGB-D video. In 2017 IEEE/RSJ International Conference on Intelligent Robots and Systems (IROS). IEEE, 4917–4922.
- Shi et al. (2020b) Lei Shi, Charles Livermore, and Ioannis A Kakadiaris. 2020b. DVRNet: Decoupled Visible Region Network for Pedestrian Detection. In Proc. International Joint Conference on Biometrics. Houston, TX.
- Shi et al. (2019a) Lei Shi, Xiang Xu, and I. A. Kakadiaris. 2019a. SANet: Smoothed Attention Network for Single Stage Face Detector. In Proc. International Conference on Biometrics. Crete, Greece.
- Shi et al. (2019b) Lei Shi, Xiang Xu, and I. A. Kakadiaris. 2019b. SEFD: A Simple and Effective Single Stage Face Detector. In Proc. International Conference on Biometrics. Crete, Greece.
- Shi et al. (2020c) Lei Shi, Xiang Xu, and Ioannis A. Kakadiaris. 2020c. Detecting Multi-Scale Faces Using Attention-Based Feature Fusion and Smoothed Context Enhancement. IEEE Transactions on Biometrics, Behavior, and Identity Science 2, 3 (2020), 235–244. https://doi.org/10.1109/TBIOM.2020.2993242
- Shi et al. (2020a) Xiaotong Shi, Tianming Du, Shuang Chen, Honggang Zhang, Changdong Guan, and Bo Xu. 2020a. UENet: A Novel Generative Adversarial Network for Angiography Image Segmentation. In 2020 42nd Annual International Conference of the IEEE Engineering in Medicine & Biology Society (EMBC). IEEE, 1612–1615.
- Tang et al. (2019a) Hao Tang, Xuming Chen, Yang Liu, Zhipeng Lu, Junhua You, Mingzhou Yang, Shengyu Yao, Guoqi Zhao, Yi Xu, Tingfeng Chen, et al. 2019a. Clinically applicable deep learning framework for organs at risk delineation in CT images. Nature Machine Intelligence 1, 10 (2019), 480–491.
- Tang et al. (2018) Hao Tang, Daniel R Kim, and Xiaohui Xie. 2018. Automated pulmonary nodule detection using 3D deep convolutional neural networks. In 2018 IEEE 15th International Symposium on Biomedical Imaging (ISBI 2018). IEEE, 523–526.
- Tang et al. (2021a) Hao Tang, Xingwei Liu, Kun Han, Xiaohui Xie, Xuming Chen, Huang Qian, Yong Liu, Shanlin Sun, and Narisu Bai. 2021a. Spatial Context-Aware Self-Attention Model For Multi-Organ Segmentation. In Proceedings of the IEEE/CVF Winter Conference on Applications of Computer Vision. 939–949.
- Tang et al. (2021b) Hao Tang, Xingwei Liu, Shanlin Sun, Xiangyi Yan, and Xiaohui Xie. 2021b. Recurrent Mask Refinement for Few-Shot Medical Image Segmentation. arXiv preprint arXiv:2108.00622 (2021).
- Tang et al. (2019b) Hao Tang, Chupeng Zhang, and Xiaohui Xie. 2019b. Nodulenet: Decoupled false positive reduction for pulmonary nodule detection and segmentation. In International Conference on Medical Image Computing and Computer-Assisted Intervention. Springer, 266–274.
- Wang et al. (2018) Haoyu Wang, Vivek Kulkarni, and William Yang Wang. 2018. DOLORES: Deep Contextualized Knowledge Graph Embeddings. CoRR abs/1811.00147 (2018). arXiv:1811.00147 http://arxiv.org/abs/1811.00147
- Wang et al. (2014) Jiayin Wang, Yi Yao, Ying Mao, Bo Sheng, and Ningfang Mi. 2014. Fresh: Fair and efficient slot configuration and scheduling for hadoop clusters. In 2014 IEEE 7th International Conference on Cloud Computing. IEEE, 761–768.
- Xie et al. (2018) Qingsong Xie, Hua Liu, Di Bo, Chang He, and Ming Pan. 2018. Data-driven Modeling and Optimization of Complex Chemical Processes Using a Novel HDMR Methodology. In Computer Aided Chemical Engineering. Vol. 44. Elsevier, 835–840.
- Xu et al. (2019) Yanzhe Xu, F. Gao, Teresa Wu, K. Bennett, J. Charlton, and Suryadipto Sarkar. 2019. U-Net with optimal thresholding for small blob detection in medical images. 2019 IEEE 15th International Conference on Automation Science and Engineering (CASE) (2019), 1761–1767.
- Xu et al. (2020a) Yanzhe Xu, Teresa Wu, J. Charlton, F. Gao, and K. Bennett. 2020a. Small Blob Detector Using Bi-Threshold Constrained Adaptive Scales. IEEE transactions on bio-medical engineering PP (2020).
- Xu et al. (2020b) Yanzhe Xu, Teresa Wu, F. Gao, J. Charlton, and K. Bennett. 2020b. Improved small blob detection in 3D images using jointly constrained deep learning and Hessian analysis. Scientific Reports 10 (2020).
- Yang et al. (2021) Allen Yang, Jiayin Wang, Ying Mao, Yi Yao, Ningfang Mi, and Bo Sheng. 2021. Optimizing Internal Overlaps by Self-Adjusting Resource Allocation in Multi-Stage Computing Systems. IEEE Access 9 (2021), 88805–88819.
- Zhai et al. (2019) Mo Zhai, Tianming Du, Ruolin Yang, and Honggang Zhang. 2019. Coronary artery vascular segmentation on limited data via pseudo-precise label. In 2019 41st Annual International Conference of the IEEE Engineering in Medicine and Biology Society (EMBC). IEEE, 816–819.
- Zhang et al. (2020) Hongming Zhang, Haoyu Wang, and Dan Roth. 2020. Unsupervised Label-aware Event Trigger and Argument Classification. CoRR abs/2012.15243 (2020). arXiv:2012.15243 https://arxiv.org/abs/2012.15243
- Zhao et al. (2018) Xinyan Zhao, Mengqi Zhan, and Cheng Jie. 2018. Examining multiplicity and dynamics of publics’ crisis narratives with large-scale Twitter data. Public Relations Review 44, 4 (2018), 619–632. https://doi.org/10.1016/j.pubrev.2018.07.004
- Zheng et al. (2019a) Wenjia Zheng, Yun Song, Zihao Guo, Yongchen Cui, Suwen Gu, Ying Mao, and Long Cheng. 2019a. Target-based Resource Allocation for Deep Learning Applications in a Multi-tenancy System. In 2019 IEEE High Performance Extreme Computing Conference(HPEC ’19).
- Zheng et al. (2019b) Wenjia Zheng, Michael Tynes, Henry Gorelick, Ying Mao, Long Cheng, and Yantian Hou. 2019b. FlowCon: Elastic Flow Configuration for Containerized Deep Learning Applications. In ACM the 48th International Conference on Parallel Processing (ICPP ’19).
- Zhu (2020) Liao Zhu. 2020. The Adaptive Multi-Factor Model and the Financial Market. eCommons.
- Zhu et al. (2020) Liao Zhu, Sumanta Basu, Robert A. Jarrow, and Martin T. Wells. 2020. High-Dimensional Estimation, Basis Assets, and the Adaptive Multi-Factor Model. The Quarterly Journal of Finance 10, 04 (2020), 2050017.
- Zhu et al. (2021a) Liao Zhu, Robert A. Jarrow, and Martin T. Wells. 2021a. Time-Invariance Coefficients Tests with the Adaptive Multi-Factor Model. arXiv preprint arXiv:2011.04171 (2021).
- Zhu et al. (2021b) Liao Zhu, Ningning Sun, and Martin T. Wells. 2021b. Clustering Structure of Microstructure Measures. arXiv preprint arXiv:2107.02283 (2021).
- Zhu et al. (2021c) Liao Zhu, Haoxuan Wu, and Martin T. Wells. 2021c. A News-based Machine Learning Model for Adaptive Asset Pricing. arXiv preprint arXiv:2106.07103 (2021).