Ab initio inspection of thermophysical experiments for zirconium near melting
Abstract
We present quantum molecular dynamics calculations of thermophysical properties of solid and liquid zirconium in the vicinity of melting. An overview of available experimental data is also presented. We focus on the analysis of thermal expansion, molar enthalpy, resistivity and normal spectral emissivity of solid and liquid Zr. Possible reasons of discrepancies between the first–principle simulations and experiments are discussed. Our calculations reveal a significant volume change on melting in agreement with electrostatic levitation experiments. Meanwhile, we confirm a low value of enthalpy of fusion obtained in some pulse-heating experiments. Electrical resistivity of solid and liquid Zr is systematically underestimated in our simulations, however the slope of resistivity temperature dependencies agrees with experiment. Our calculations predict almost constant normal spectral emissivity in liquid Zr.
1 Introduction
Knowledge of high-temperature thermophysical properties of nuclear energy materials is essential for analyzing safety of nuclear reactors currently in operation or planned for operation in the future. Equations of state for reactor materials are crucial for modeling the behavior of nuclear power plants under critical impacts, predicting conditions that can lead to severe industrial accidents and for analysis of their consequences. In this regard, accurate knowledge of the conditions at which a phase transition occurs in the system is of particular importance. This may be a change in the type of a crystal lattice, melting or evaporation.
Zirconium is some of the main structural materials of nuclear power plants, and is specifically used for the fuel elements of boiling water reactors, owing to its low neutron absorption cross section and resistance to corrosion. It has a hexagonal close-packed (hcp) structure (-phase) under normal conditions which transforms to a hexagonal structure (-phase) under pressure [1, 2]. Upon further compression at room temperature, Zr takes on the bcc structure (-phase) [3, 1, 4]. The hcp to bcc transition in Zr also occurs at heating to temperatures higher than about 1135 K [5]. It is interesting, that anharmonicity in lattice vibrations stabilizes -Zr at high temperatures [6]. This circumstance significantly complicates a theoretical description of the -phase at high temperatures, since harmonic models commonly used for crystalline materials become inapplicable.
Zirconium melts at about K at atmospheric pressure. High melting temperature and the risk of contamination of liquid Zr make it difficult to measure its thermophysical properties at .
The methods of pulsed heating of conductors and electrostatic levitation allow one to obtain properties in that high-temperature region, unattainable for stationary studies.
Pulse-heating involves high heating rates up to 108 K/s that leads to short measurement times (microseconds). This minimizes chemical interactions between the sample and its environment during the experiment. However, due to the high temperatures attained and the short duration of experiments, temperature measurements are carried out by optical methods. This requires the use of fast pyrometers and the knowledge of normal spectral emissivity as a function of temperature. Over the last decades temperature measurements on pulse heated liquid metal samples [7, 8, 9, 10, 11] have always been performed under the assumption that emissivity is constant over the investigated temperature range of the liquid phase and its value equal to that at the melting point, due to the lack of data on the emissivity of liquid metals. This, in turn, can cause large deviations, especially at elevated temperatures, and leads to significant uncertainty in temperature dependent thermophysical properties. Another potential weak point of this method is density measurements. Radial expansion measurements are made using the shadowgraph technique, so they can be affected by the surrounding medium. Since electrical resistivity measurements require the thermal expansion accounting, strong differences are often observed for experiments in liquid [12, 13].
Electrostatic (ESL) [14, 15, 16, 17, 18, 19], aerodynamic (ADL) [20, 21], and electromagnetic (EML) [22] levitation methods are used to measure the density of liquid metals at high–temperature environment. Among them, only the ESL approach provides a quiescent condition and an almost spherical shape of the melt under high vacuum for measuring the density of a levitated liquid droplet. This allows easy image analysis for density, viscosity and surface tension measurements while still providing accurate results. However, discrepancies have been revealed between several reported density values, in particular for Fe [18], Ti [23], Zr [24, 25], and Nb [24, 25], in ESL experiments. Inaccurate liquid density values may lead to a misinterpretation in understanding of phase transitions and liquid structure as well as in predicting other physical quantities via numerical simulation.
Thus, the interpretation of both pulse-heating and levitation high-temperature experiments is difficult due to the speed and complexity of the occurring physical phenomena, therefore the experimental data obtained by different authors often differ significantly.
This is exactly the case with thermophysical properties of liquid Zr, which are still only approximately known. The density of liquid zirconium at the melting point measured by different authors differs within almost 10%. The difference in the estimates of the slope of the thermal expansion curve is almost two-fold. Only few experimental measurements are available for temperatures above 2500 K.
In turn, theoretical description of zirconium in a condensed state is very challenging due to a complex electronic structure. In this connection, ab initio methods based on density functional theory (DFT) which take into account the complicated electronic structure of transition metals are a great deal of help [26].
Properties of crystalline Zr are widely studied using DFT [27, 28, 29, 30, 31, 32, 33, 34]. Works dedicated to molecular dynamics simulations are usually limited by using empirical interatomic potentials [35, 36], although some of them are fitted to ab initio data [37]. On the other hand, computer simulations such as quantum molecular dynamics (QMD), that is based on DFT and does not use any empirical data except for fundamental physical constants, provide a physical insight into understanding of various phenomena on the atomic scale and enable one to predict some thermodynamic, mechanical, structural, transport and dynamic properties of materials, including in liquid or near-critical state. Such calculations are very computationally expensive and time consuming, so it is not surprising that only few QMD studies on Zr available [38, 39, 40].
Meanwhile, QMD was successfully implemented for the description of thermodynamical and transport properties of hot expanded molybdenum [41], tungsten [42], rhenium [43], boron [44], tantalum [45], aluminum [46]. It was shown that it is possible to describe consistently experiments both in the solid and in the liquid phase in the framework of ab initio calculations. So QMD can be used as a reference method for the inspection of available experimental data.
The paper focuses on the thermophysical properties of both solid and liquid zirconium at high temperatures. The properties include density, pressure, temperature, molar enthalpy, resistivity, and normal spectral emissivity. The authors believe that the new data obtained will help to improve the existing constitutive relations for zirconium, eliminating the uncertainty in its thermophysical properties at high temperatures and in the liquid state.
2 Methods and simulation parameters
2.1 Thermodynamic properties
The method of quantum molecular dynamics is used to obtain thermodynamic properties of zirconium. QMD simulations based on finite-temperature density functional theory (FT-DFT) [47] are performed using the Vienna ab initio Simulation Package (VASP) [48, 49, 50, 51] with an implementation of the projector augmented-wave (PAW) [52] pseudopotential. In all simulations the generalized gradient approximation (GGA) for the exchange-correlation (XC) functional with the Perdew-Burke-Ernzerhof (PBE) [53, 54] parametrization is applied. To reduce numerical efforts, 12 valence electrons are included in our calculations. The Fermi smearing for electron occupancies is applied. To achieve convergence for both energy and pressure the plane wave cutoff energy is set to 400 eV. 250 atoms, initially arranged in the hcp structure for -phase and in the ideal bcc lattice for -phase, with periodic boundary conditions are simulated. The liquid phase simulations start from a disordered state. The lattice parameter determines the density of matter , which remains constant during the simulation process. Nosé-Hoover [55] thermostat is used to maintain a given temperature. The ion dynamics uses forces derived from the Hellmann-Feynman theorem, on the basis of the Born-Oppenheimer approximation. The dynamics of Zr atoms is simulated within no less than 6 ps with 2 fs time step. In this paper we do not determine the melting temperature and use the reference value of K [56].
According to our previous work [41], a study of the numerical convergence of QMD calculations on the number of atoms, k-points in the Brillouin zone and the estimation of statistical uncertainty in the averaging of thermodynamic properties are important aspects of accurate QMD modeling. Thus, we found that for an adequate description of the thermophysical properties of zirconium in the crystalline and liquid states, it is necessary to use 250 atoms in the supercell with the Baldereschi mean-value [57] k-point . Thermodynamic parameters of the system were found by averaging of the corresponding values at the equilibrium stage of the simulation. Since pressure strongly fluctuates during the calculation each thermodynamic state was simulated during no less than 3000 steps and the standard error of the calculated average pressure was estimated as 1 kbar.
2.2 Transport properties
The parallel GreeKuP code [60] written by the authors is applied to determine the conductivity of Zr. This code uses the matrix elements from DFT calculation, to calculate the real part of the complex dynamic electrical conductivity according to the Kubo–Greenwood (KG) formula [61, 62, 60, 63]:
| (1) |
In this formula and are the electronic eigenfunctions and eigenvalues, accordingly, for the ith electronic band at a given -point in the Brillouin zone; is the -point weight in the Brillouin zone using the Monkhorst-Pack scheme, is the Fermi distribution function; is the supercell volume, and are the charge and mass of the electron, accordingly. Formula (2.2) takes into account all transitions between all possible states and to find which can be treated here as energy absorption at the corresponding frequency. The -function in the Kubo–Greenwood formula is responsible for the fact that only levels with the energy difference make a contribution to the absorption at the frequency . If the occupation of an initial level is equal to the occupation of a last level, then the probability of the transition between these levels is 0, the energy absorption is 0 too, so the difference of occupation numbers is included to this formula. The -function is represented by a Gaussian with broadening of eV in our calculations. The squared matrix elements are responsible for the intensity of every such transition ( is the velocity operator along the spatial direction , there are three such spatial directions in total).
The value of dc conductivity can be obtained by extrapolation of the dynamic conductivity to zero frequency [62]. The convergence upon width of the -function is carefully checked for every calculation.
The conductivity calculation requires more precise DFT determination of electronic structure and consequently it is significantly more computationally expensive. Therefore, such calculations are performed not for all but selected configurations from the equilibrium QMD trajectory. The averaging of the calculated conductivity is performed over no less than 10 configurations equidistantly spaced along the ions trajectory in our QMD+KG calculations. We use Monkhorst–Pack k-points grid [64] in the Brillouin zone for this type of calculations.
2.3 Optic properties
The real and imaginary parts of a complex function that is analytic in the upper half-plane, are connected via the Kramers–Kronig transform (KKT): if we know the real part we can use the relation
| (2) |
to find the imaginary part of this function, where denotes the Cauchy principal value. For any stable physical system, causality implies the condition of analyticity, and conversely, analyticity implies causality of the corresponding stable physical system [65].
At known we can obtain optical properties depending on the radiation frequency :
-
1.
the complex dielectric constant as
where is the vacuum permittivity;
-
2.
the complex refractive index as
-
3.
the normal spectral reflectivity as
-
4.
the absorption coefficient as
where is the speed of light in vacuum;
-
5.
the normal spectral emissivity as
(3)
The integration in practical KKT calculation is performed over the limited frequency range. In this work up to 8000 orbitals were involved in the DFT calculation with about 6000 unoccupied ones to account for high–energy transitions in the Kubo–Greenwood formula (2.2). We estimate the computational error of our calculation of optic properties of less than 1%.
3 Results and Discussion
3.1 Density
The main source of experimental data on thermophysical properties of metals in the liquid phase at high temperatures near the binodal is the dynamic pulse-heating method. The obtained quantities are enthalpy, electrical resistance, volume expansion, specific heat capacity, thermal conductivity, and some others.
Electrostatic levitation (ESL) technique [71] allows a sample to levitate in a high vacuum and to process it at high temperature using laser radiation. Thus, a sample is isolated from contaminating container walls as well as surrounding gases. However, measurements are limited by the temperatures of about 2500 K.
An experimental pressure value during isobaric expansion (IEX) measurements is usually comparable to the absolute computational error of the calculation due to pressure fluctuations during the simulation. Increasing the number of atoms in the simulation to reduce oscillations leads to a non-linear increase in computational costs [83, 84]. Therefore, in order to reduce the influence of calculation errors and to be able to reconstruct the IEX curve at a given pressure with high accuracy, we perform a series of calculations along isochores in the liquid phase and along isotherms in the solid phase. Then calculated points are interpolated by a quadratic polynomial on isochores and a linear fit on isotherms, and interpolation relations are used to restore the isobar.
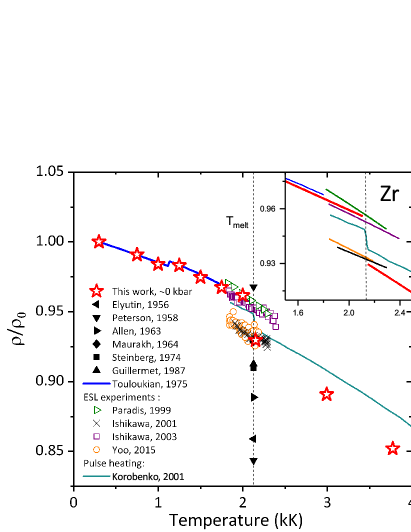
Figure 1 shows our calculations and available experimental data on isobaric expansion of zirconium in the melting region. The results of density calculations and measurements are compared in relative units, since the calculated density under normal conditions differs somewhat from the experimental value. We use the QMD-calculated reference density at normal conditions g/cm3 for our data.
As can be seen, calculations in solid and phases agree perfectly with the reference data of the Handbook by Touloukian et al. [85], which provides a compilation of multiple experiments for solid Zr up to 1800 K. At higher temperatures data of ESL measurements for -Zr are available. The slope of our curve corresponds to the data by Ishikawa et al. [25], obtained using the electrostatic levitation furnace and validated with Hard Sphere model [86] calculations. Our calculations confirm the density of Zr at the melting temperature as measured by electrostatic levitation by Ishikawa et al. [25], as well as earlier measurements by Paradis and Rhim [71].
Experimental data on density of molten Zr from the following earlier papers are shown in Fig. 1: Elyutin, Peterson et al. [66], Allen [67], Maurakh et al. [68], Steinberg [69] and Guillermet and Fernández [70]. As can be seen from the figure, the data spread is very significant. Noteworthy is the huge density drop from 6.31 to 5.5 g/cm3 at melting, reported by Peterson et al.
Meanwhile, the density of liquid Zr at the melting point by QMD is in good agreement with the results of electrostatic levitation experiments by Ishikawa et al. [73] and Yoo et al. [72] where Zr was in supercooled and stable liquid phases. As can be seen, the most recent experimental data by Yoo et al. have some scatter and the error in measuring the density of liquid zirconium was estimated as 1.1. Nevertheless, the average slope of experimental data [72] is consistent with our slope of liquid Zr thermal expansion.
Pulse-heating experiment by Korobenko and Savvatimskii [74] is the only high-temperature density–temperature measurement available for Zr. The QMD slope of the thermal expansion curve in the solid phase is consistent with this experiment, but there is a deviation in the liquid phase. The density of solid Zr at the melting point in this experiment is lower than in the previously discussed works, but the density of liquid is the highest. QMD also predicts lower density of liquid at the same temperature. Bending deformations which are not detected in thin shadowgraph images of the wire diameter could be reasonable explanation of the underestimation of liquid volume in the experiment. However, the authors points out that bending deformations are insignificant under experimental conditions and for the given rate of heating.
3.2 Enthalpy
Another thermophysical parameter available in dynamic heating experiments is enthalpy. As temperature and enthalpy can be measured simultaneously as a function of time, enthalpy as a function of temperature can be easily obtained [12, 13]. The enthalpy change along the zero isobar , is considered between a given temperature and K directly from QMD calculations where and are the corresponding internal energies of the system. To reduce the systematic error the convergence of was carefully tested (see Table 1 in A).
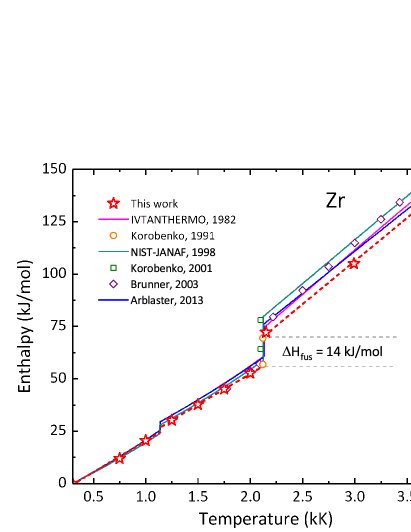
The results of our QMD calculations on molar enthalpy depending on temperature are presented in Fig. 2 together with reference and experimental data.
In a relatively recent review on zirconium, Arblaster [76] provides empirical relationships between enthalpy and temperature based on experimental data for the , , and liquid phases. Above 273.15 K and up to the – transition temperature, the Douglas and Victor [87] enthalpy measurements (373–1124 K) were adopted after a correction to the International Temperature Scale of 1990 (ITS-90 is an approximation of the thermodynamic temperature scale that facilitates comparability and compatibility of temperature measurements internationally). Before melting, specific heat measurements of Cezairliyan and Righini [88] (1500–2100K) and Petrova et al. [89] (1200–2100 K) were combined with the drop calorimetry enthalpy measurements of Rösner-Kuhnetal et al. [90] (1821–2105 K).
Thermochemical Table NIST [75] provides an approximation of seven enthalpy studies [92, 93, 94, 95, 96, 87, 97] between 300 K and 1135 K and four [93, 94, 96, 87] over the temperature range 1135–2125 K.
Our calculations agree excellently with all reference data in the -phase, while for -Zr better agreement is observed between our data and NIST approximation and measurements of Brunner et al. [79].
At the melting point, there are two datasets obtained by the electrical pulse current heating method by Korobenko and his colleagues. In later work [78] with a heating rate of K s-1, the molar enthalpy of solid and liquid zirconium was reported as 64.1 and 78.1 kJ/mol, respectively, while in earlier work [80] with a heating rate of K s-1, the molar enthalpy of solid and liquid zirconium were 56.8 and 69.4 kJ/mol, correspondingly, that is in excellent agreement with our results. It is worth to note, that in Ref. [78] experiments with zirconium foils were carried out, while zirconium wires were used in Ref. [80] .
In the liquid phase of zirconium, the difference between the experimental and reference enthalpy data and the QMD results is more noticeable. In Thermochemical Table NIST [75] there are no enthalpy studies covering the liquid region; a constant value of J K-1mol-1 is assumed for the region 2125–5500 K. In the review by Arblaster [76] the drop calorimetry enthalpy measurements of Bonnell [7] (2232–3046 K), Kats et al. [98] and Qin et al. [99] (2027–2901 K) were separately fitted to linear functions and combined for the liquid phase. Brunner’s et al. data [79] on electrical pulsed heating intersects all reference extrapolated lines.
As can be seen from the figure, the slope of our curve in the liquid phase is similar to the reference ones. The isobaric heat capacity in the liquid Zr by QMD is 40.5 J K-1mol-1, while Arblaster presented the value of 39.92, IVTANTHERMO — 42.6, and NIST — 41.84 J K-1mol-1.
Thus, the difference in the molar enthalpy in the liquid phase is caused by the heat of fusion estimate. We obtained a value of heat of fusion of zirconium 14 kJ/mol by QMD. Our calculations tend to the lower values of the enthalpy of melting measured by rapid pulse heating [78, 80, 79] and drop calorimetry [100, 98, 90] (12.8–21.5 kJ/mol).
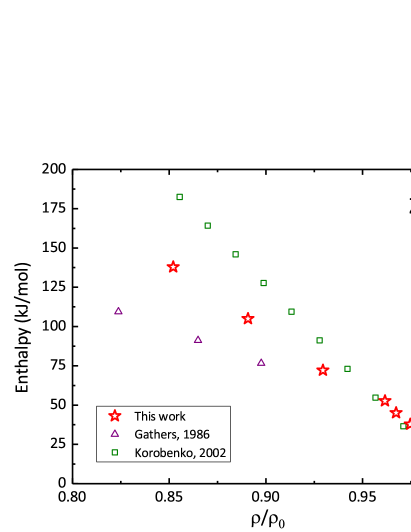
The diagram of molar enthalpy versus relative density is shown in Fig. 3. Only data on electrical pulse heating obtained by Gathers [82] and Korobenko et al. [81] are shown. The available experimental data notably contradict to each other and our QMD calculations in the liquid phase. But in the solid there is good agreement between our data and Korobenko’s measurements.
3.3 Resistivity
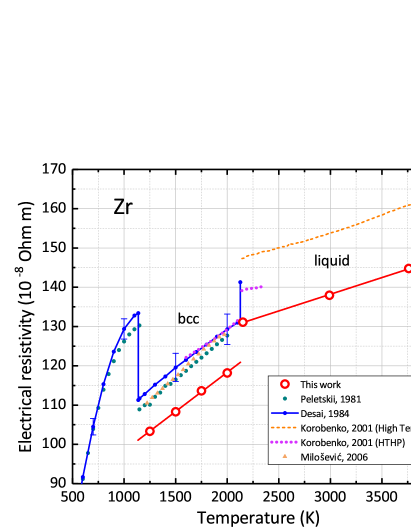
Electrical resistivity of solid zirconium was widely investigated in numerous experiments. Experimental data on resistivity of solid zirconium in the range of temperature 1–2127 K were collected by Desai [101] in 1984. An extensive overview provides a compilation of 43 experimental data sets. Earlier in 1981, recommended data for Zr resistivity were published in the Handbook by Peletskii and Belskaya [102]. Meanwhile, data on resistivity of liquid Zr are almost lacking. Experiments on the electrical explosion of zirconium foils and wires by Korobenko et al. [78, 74, 81] made it possible to obtain resistivity of liquid zirconium up to 4100 K. The data discussed are shown in Fig. 4, as well as recent experimental data for solid Zr by Milošević et al. [103]. As can be seen, there is a consensus on the resistivity of -Zr. The jump in resistivity due to melting differs more than two-fold even by the same authors.
We found that QMD+KG provides systematically lower resistivity for Zr than observed in experiments. Meanwhile, the slope of the resistivity for -Zr is in excellent agreement with Desai data. The difference between our data and Desai approximation is about 11 cm, or about 10%. The jump in resistivity at melting by QMD agree perfectly with Desai estimate as well. The slope of the liquid part of the QMD curve of resistivity is consistent with one by Korobenko et al. [74].
Discussing the discrepancy between our results and experiments, we firstly note, that the statistical error is less than 1% in our calculations and the convergence on simulation parameters was well checked, see A. Meanwhile, it should be noted, that QMD+KG calculation of dc conductivity is sensitive to the choice of pseudopotential [113]. We used the most accurate pseudopotential that is available in the VASP package for Zr. Among the disadvantages of the QMD+KG method we can also mention an underestimation of contributions from electron–electron collisions [114, 115], which, however, seem to have little effect at the conditions considered in this paper. Finally, it should be remembered, that the DFT electronic band structure is based on Kohn–Sham eigenvalues that can differ from a real system. For example, DFT is assumed to work good for metals, but underestimates the size of the band gap in insulators and semiconductors to varying degree depending on the material. This phenomenon may have a systematic effect on the calculated dc conductivities [61]. Thus, comparison with well–established experimental data is still required for the resistivity calculations using QMG+KG in order to estimate the accuracy of calculated quantities or to envisage a corresponding correction.
At the same time, it should be mentioned here, that the purity of Zr samples has notable influence on the results of resistivity measurements. According to Peletskii and Belskaya [102] less impurities in Zr samples provide a decrease in measured resistivity.
3.4 Normal spectral emissivity
Optical properties of solid zirconium were studied in multiple experiments [105, 118, 119, 104, 103]. Most of the experimental data for the liquid phase are close to the melting temperature [116, 109, 79, 110, 117]. Discussing the optical properties, we will focus on normal spectral emissivity.
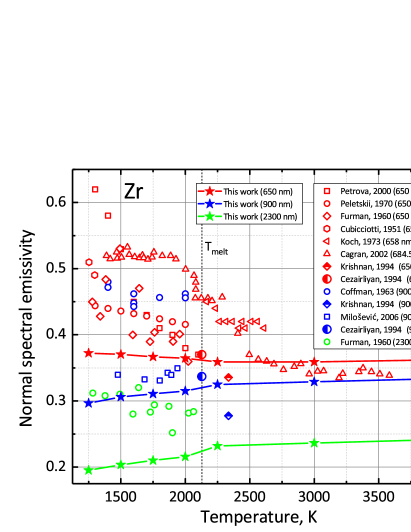
Figure 5 demonstrates some available experimental data on normal spectral emissivity of Zr as well as our calculated data for several wavelengths in the range of temperatures 1200–4000 K.
The scatter of the data for solid zirconium is particularly conspicuous. The detailed explanation of this fact was presented by Cagran et al. [109]. The fact is, emissivity is mainly influenced by the roughness of the sample surface and possible surface impurities such as oxide layers. So a large variety of normal spectral emissivity values for the solid state can be explained by different procedures of preparing and abrading the sample. To obtain reproducible values for the solid state, one must preheat the sample several times close to melting to smoothen the surface and to eliminate surface contaminations. However, this procedure is usually overlooked by researchers.
Again, some experiments exhibit a sudden drop in normal spectral emissivity at the onset of melting (noticeable for Cagran data in Fig. 5). This is believed to be related to a smoothening of the sample surface upon melting and to the evaporation of possible oxide layers from the surface. So during the melting transition, emissivity drops to a lower, reproducible, and material-specific value. Moreover, some recent measurements on copper, silver, and platinum showed that the opposite behaviour is equally possible, when normal spectral emissivity suddenly increases at the start of melting. This occurs when the surface of the sample is almost perfectly smooth and does not need to be polished [109].
The QMD+KG calculated normal spectral emissivity for Zr at nm does not demonstrate an abrupt drop at melting. Moreover, for larger wavelengths an opposite effect is predicted by our calculations. Our results for 650 and 900 nm agree almost perfectly with Cezairliyan et al. [111] experiment for molten Zr. There is good agreement of our data with Cagran measurements for the liquid Zr and with recent experiment by Milošević et al. for -Zr. Finally, our calculations predict almost constant normal spectral emissivity up to 4000 K and do not confirm the growth of after 3000 K, observed in some experiments [120].
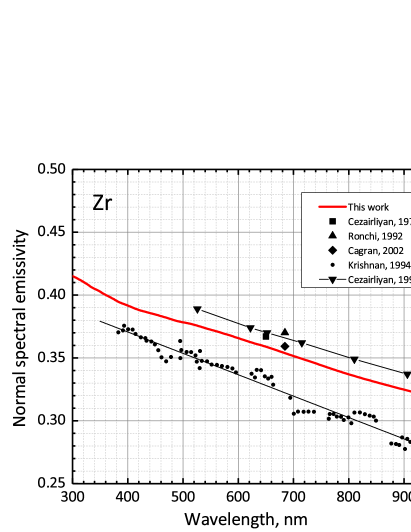
The comparison of the calculated normal spectral emissivity of liquid Zr with experimental data in the vicinity of melting temperature is also shown in Figure 6. We can see that the slope of obtained in this work is similar to the linear fit of the experimental data by Krishnan et al.[110]. Even more spectacular agreement is observed for data of Cezairliyan et al. [111]. The values of normal spectral emissivity from first-principle calculations agree well with other experiments for [116] and 684.5 nm [117, 109].
4 Conclusion
Thermophysical properties of zirconium in the vicinity of melting are very ambiguous due to strong contradictions in the available experimental data, that makes it difficult to construct reliable equation of state of Zr. However, in this work we have demonstrated for the first time that some experimental data can be accurately described using the ab initio method of quantum molecular dynamics.
In the solid phase the results on thermal expansion by QMD calculations agree perfectly with the approximation from Tolukyan et al. Handbook [85] and electrostatic levitation measurements by Ishikawa et al. [25].
Thermal expansion of liquid Zr by QMD is in good agreement with the results of experiments on electrostatic levitation by Ishikawa et al. [73] and Yoo et al. [72]. Meanwhile, the QMD slope of the thermal expansion curve in the liquid phase is not consistent with the high-temperature pulse-heating experiment by Korobenko and Savvatimskii [74].
Our QMD calculations predict a substantial volume change on melting of about , in addition to quite a low value of calculated enthalpy of fusion ( kJ/mol). This fact leads to the steep slope of the melting curve at of K/GPa predicted by QMD contrary to laser-heated diamond anvil cell experiments [5, 121, 122] where 24–28 K/GPa was proposed.
However, it should be noted, that the classic molecular dynamics with empirical interatomic EAM potential predicts an initially steep melting curve for Zr ( K/GPa at GPa) that quickly flattens out at higher pressures [123]. Moreover, recently similar steep behavior of the melting curve at low pressures was confirmed in experiments for Ti [124].
We found that QMD+KG systematically underestimates resistivity for Zr compared to experiments. Meanwhile, the slope of the resistivity for -Zr and a jump in resistivity at melting is in excellent agreement with Desai approximation [101]. The slope of temperature dependence of resistivity in liquid Zr is consistent with one by Korobenko et al. [74].
Contrary to some experiments, the calculated normal spectral emissivity for Zr at nm does not demonstrate an abrupt drop at melting. Moreover, for larger wavelengths the jump in normal spectral emissivity is predicted by our calculations. Our results for 650 and 900 nm agree excellently with Cezairliyan et al. [111] and some other experiments for molten Zr. Good agreement of our data with Cagran et al. [109] for the liquid Zr and with recent experiment by Milošević et al. for -Zr is also demonstrated. Our calculations predict almost constant value of normal spectral emissivity up to 4000 K.
Acknowledgements
This work has been supported by the Russian Science Foundation (grant No. 20-79-10398). The authors acknowledge the JIHT RAS Supercomputer Centre, the Joint Supercomputer Centre of the Russian Academy of Sciences, and the Shared Resource Centre “Far Eastern Computing Resource” IACP FEB RAS for providing computing time.
Appendix A Convergence
Table 1 contains convergence tests for calculated thermodynamic properties upon system size and number of k-points for Zr. The lattice constant obtained within the quasiharmonic approximation calculations of equilibrium density at K is used for QMD simulation at normal conditions. The corresponding energy obtained in QMD simulation of 250 atoms is kJ/mol, while pressure is almost zero. This value of internal energy is used for calculation along the zero isobar.
Table 2 contains convergence tests for calculated dc conductivity on system size and k-point sampling.
| (g/cm3) | (kK) | k-point | (GPa) | (kJ/mol) | |
|---|---|---|---|---|---|
| 6.455 | 0.3 | 128 | M | 0.07 | -814.34 |
| 6.455 | 0.3 | 250 | B | 0.01 | -813.79 |
| 6.500 | 0.3 | 128 | M | 0.54 | -814.46 |
| 6.500 | 0.3 | 250 | B | 0.62 | -813.70 |
| 6.450 | 1.0 | 128 | M | 0.94 | -793.82 |
| 6.450 | 1.0 | 250 | B | 1.30 | -793.62 |
| 6.500 | 1.0 | 128 | M | 1.75 | -792.72 |
| 6.500 | 1.0 | 250 | B | 1.97 | -793.39 |
| 6.500 | 1.25 | 250 | B | 0.09 | -783.59 |
| 6.500 | 1.25 | 250 | M | 0.09 | -783.66 |
| 6.300 | 1.5 | 128 | M | 0.10 | -776.55 |
| 6.300 | 1.5 | 250 | B | 0.12 | -776.46 |
| 6.300 | 1.5 | 432 | B | 0.08 | -776.67 |
| 6.400 | 1.5 | 128 | M | 1.32 | -777.17 |
| 6.400 | 1.5 | 250 | B | 1.33 | -777.22 |
| 6.400 | 1.5 | 432 | B | 1.30 | -777.24 |
| 6.400 | 2.0 | 128 | M | 2.69 | -762.24 |
| 6.400 | 2.0 | 250 | B | 2.62 | -762.54 |
| (g/cm3) | (kK) | k-point | (103 Sm/m) | |
|---|---|---|---|---|
| 6.4 | 1.50 | 128 | M | 981.84 |
| 6.4 | 1.50 | 250 | B | 973.05 |
| 6.4 | 1.50 | 250 | M | 952.82 |
| 6.4 | 1.50 | 250 | M | 953.03 |
| 6.4 | 1.50 | 432 | M | 952.31 |
| 6.0 | 2.25 | 128 | M | 756.98 |
| 6.0 | 2.25 | 250 | B | 757.08 |
| 6.0 | 2.25 | 250 | M | 759.61 |
| 6.0 | 2.25 | 250 | M | 757.53 |
| (g/cm3) | (kK) | (GPa) | (kJ/mol) | (103 Sm/m) |
| phase | ||||
| 6.40 | 0.75 | 0.08 | -801.18 | - |
| 6.50 | 0.75 | 1.40 | -801.23 | - |
| 6.60 | 0.75 | 2.75 | -800.62 | - |
| 6.40 | 1.00 | 0.64 | -793.59 | - |
| 6.45 | 1.00 | 1.30 | -793.61 | - |
| 6.50 | 1.00 | 1.97 | -793.39 | - |
| 6.35 | 1.15 | 0.29 | -788.63 | - |
| 6.40 | 1.15 | 0.98 | -788.95 | - |
| 6.45 | 1.15 | 1.65 | -788.96 | - |
| phase | ||||
| 6.35 | 1.25 | 0.09 | -783.59 | 985.61 |
| 6.42 | 1.25 | 0.96 | -784.19 | 986.02 |
| 6.50 | 1.25 | 1.99 | -784.21 | 1006.90 |
| 6.70 | 1.25 | 4.66 | -784.20 | 1081.86 |
| 6.30 | 1.50 | 0.12 | -776.46 | 915.24 |
| 6.35 | 1.50 | 0.72 | -776.77 | 946.55 |
| 6.40 | 1.50 | 1.36 | -777.22 | 952.82 |
| 6.50 | 1.50 | 2.60 | -777.51 | 977.42 |
| 6.70 | 1.50 | 5.27 | -777.25 | 1031.11 |
| 6.25 | 1.75 | 0.17 | -768.80 | 883.45 |
| 6.35 | 1.75 | 1.34 | -769.64 | 897.75 |
| 6.45 | 1.75 | 2.57 | -770.20 | 926.24 |
| 6.55 | 1.75 | 3.88 | -770.33 | 952.68 |
| 6.75 | 1.75 | 6.63 | -769.94 | 1003.53 |
| 6.40 | 2.00 | 2.62 | -762.54 | 886.16 |
| 6.60 | 2.00 | 5.18 | -763.03 | 929.34 |
| 6.80 | 2.00 | 7.98 | -762.58 | 980.83 |
| Liquid | ||||
| 6.00 | 2.15 | 0.01 | -741.29 | - |
| 6.00 | 2.25 | 0.26 | -738.63 | 759.61 |
| 6.00 | 2.35 | 0.59 | -734.79 | 761.81 |
| 6.00 | 3.20 | 2.90 | -706.10 | 751.69 |
| 6.00 | 4.00 | 5.19 | -678.31 | 742.53 |
| 5.75 | 3.00 | 0.02 | -708.42 | 722.48 |
| 5.75 | 3.10 | 0.31 | -705.03 | 725.65 |
| 5.75 | 3.20 | 0.53 | -702.11 | 723.62 |
| 5.75 | 4.00 | 2.74 | -674.85 | 715.82 |
| 5.75 | 5.00 | 5.37 | -640.68 | 707.81 |
| 5.50 | 3.80 | 0.05 | -675.01 | 688.88 |
| 5.50 | 3.90 | 0.50 | -672.34 | - |
| 5.50 | 4.00 | 0.63 | -668.95 | 689.30 |
| 5.50 | 5.00 | 3.29 | -633.78 | 679.56 |
| 5.50 | 6.00 | 5.65 | -599.25 | 666.72 |
Appendix B Equation of state
The EOS data derived from the QMD simulations are presented in Table 3, as well as calculated dc conductivity along the isotherms for -Zr and along the isochors for liquid metal.
References
- [1] E. Y. Tonkov, E. Ponyatovsky, Phase transformations of elements under high pressure, CRC press, 2018.
- [2] S. Sikka, Y. Vohra, R. Chidambaram, Omega phase in materials, Progress in Materials Science 27 (3-4) (1982) 245–310.
- [3] A. Dewaele, V. Stutzmann, J. Bouchet, F. Bottin, F. Occelli, M. Mezouar, High pressure-temperature phase diagram and equation of state of titanium, Physical Review B 91 (13) (2015) 134108.
- [4] S. Anzellini, F. Bottin, J. Bouchet, A. Dewaele, Phase transitions and equation of state of zirconium under high pressure, Phys. Rev. B 102 (2020) 184105. doi:10.1103/PhysRevB.102.184105.
- [5] P. Parisiades, F. Cova, G. Garbarino, Melting curve of elemental zirconium, Physical Review B 100 (5) (2019) 054102.
- [6] O. Hellman, I. Abrikosov, S. Simak, Lattice dynamics of anharmonic solids from first principles, Physical Review B 84 (18) (2011) 180301.
- [7] D. W. Bonnell, Property measurements at high temperatures–levitation calorimetry studies of liquid metals, Ph.D. Thesis (1972) 1–72.
- [8] R. Hixson, M. Winkler, Thermophysical properties of liquid platinum, International journal of thermophysics 14 (3) (1993) 409–416.
- [9] M. Boivineau, H. Colin, J. Vermeulen, T. Thévenin, Thermophysical properties of solid and liquid thorium, International journal of thermophysics 17 (5) (1996) 1001–1010.
- [10] W. Obendrauf, E. Kaschnitz, G. Pottlacher, H. Jäger, Measurements of thermophysical properties of nickel with a new highly sensitive pyrometer, International journal of thermophysics 14 (3) (1993) 417–426.
- [11] A. Seifter, F. Sachsenhofer, S. Krishnan, G. Pottlacher, Microsecond laser polarimetry for emissivity measurements on liquid metals at high temperatures—application to niobium, International journal of thermophysics 22 (5) (2001) 1537–1547.
- [12] G. R. Gathers, Dynamic methods for investigating thermophysical properties of matter at very high temperatures and pressures, Reports on Progress in Physics 49 (4) (1986) 341.
- [13] M. Boivineau, G. Pottlacher, Thermophysical properties of metals at very high temperatures obtained by dynamic heating techniques: recent advances, International Journal of Materials and Product Technology 26 (3-4) (2006) 217–246. doi:10.1504/IJMPT.2006.009468.
- [14] W.-K. Rhim, S. K. Chung, D. Barber, K. F. Man, G. Gutt, A. Rulison, R. E. Spjut, An electrostatic levitator for high-temperature containerless materials processing in 1-g, Review of Scientific Instruments 64 (10) (1993) 2961–2970.
- [15] T. Ishikawa, P.-F. Paradis, T. Itami, S. Yoda, Non-contact thermophysical property measurements of refractory metals using an electrostatic levitator, Measurement Science and Technology 16 (2) (2005) 443.
- [16] R. Bradshaw, D. Schmidt, J. Rogers, K. Kelton, R. Hyers, Machine vision for high-precision volume measurement applied to levitated containerless material processing, Review of scientific instruments 76 (12) (2005) 125108.
- [17] N. Mauro, K. Kelton, A highly modular beamline electrostatic levitation facility, optimized for in situ high-energy x-ray scattering studies of equilibrium and supercooled liquids, Review of Scientific Instruments 82 (3) (2011) 035114.
- [18] G. W. Lee, S. Jeon, D.-H. Kang, Crystal–liquid interfacial free energy of supercooled liquid fe using a containerless technique, Crystal growth & design 13 (4) (2013) 1786–1792.
- [19] P.-F. Paradis, T. Ishikawa, G.-W. Lee, D. Holland-Moritz, J. Brillo, W.-K. Rhim, J. T. Okada, Materials properties measurements and particle beam interactions studies using electrostatic levitation, Materials Science and Engineering: R: Reports 76 (2014) 1–53.
- [20] F. Millot, J.-C. Rifflet, V. Sarou-Kanian, G. Wille, High-temperature properties of liquid boron from contactless techniques, International journal of Thermophysics 23 (5) (2002) 1185–1195.
- [21] G. Wille, F. Millot, J. Rifflet, Thermophysical properties of containerless liquid iron up to 2500 k, International Journal of Thermophysics 23 (5) (2002) 1197–1206.
- [22] I. Egry, Thermophysical property measurements in microgravity, High Temperatures High Pressures(UK) 32 (2) (2000) 127–134.
- [23] G. W. Lee, S. Jeon, C. Park, D.-H. Kang, Crystal–liquid interfacial free energy and thermophysical properties of pure liquid ti using electrostatic levitation: Hypercooling limit, specific heat, total hemispherical emissivity, density, and interfacial free energy, The Journal of Chemical Thermodynamics 63 (2013) 1–6.
- [24] T. Ishikawa, P.-F. Paradis, S. Yoda, New sample levitation initiation and imaging techniques for the processing of refractory metals with an electrostatic levitator furnace, Review of Scientific Instruments 72 (5) (2001) 2490–2495.
- [25] T. Ishikawa, P.-F. Paradis, T. Itami, S. Yoda, Thermophysical properties of liquid refractory metals: comparison between hard sphere model calculation and electrostatic levitation measurements, The Journal of chemical physics 118 (17) (2003) 7912–7920.
- [26] E. Wimmer, R. Najafabadi, G. A. Y. Jr, J. D. Ballard, T. M. Angeliu, J. Vollmer, J. J. Chambers, H. Niimi, J. B. Shaw, C. Freeman, M. Christensen, W. Wolf, P. Saxe, Ab initio calculations for industrial materials engineering: successes and challenges, Journal of Physics: Condensed Matter 22 (38) (2010) 384215. doi:10.1088/0953-8984/22/38/384215.
- [27] R. Tu, Q. Liu, C. Zeng, Y. Li, W. Xiao, First principles study of point defect effects on iodine diffusion in zirconium, Nuclear Materials and Energy 16 (2018) 238–244. doi:https://doi.org/10.1016/j.nme.2018.07.006.
- [28] X. Xin, W. Lai, B. Liu, Point defect properties in hcp and bcc zr with trace solute nb revealed by ab initio calculations, Journal of Nuclear Materials 393 (1) (2009) 197–202. doi:https://doi.org/10.1016/j.jnucmat.2009.06.005.
- [29] W. Xiong, W. Xie, D. Morgan, Thermodynamic evaluation of the np–zr system using calphad and ab initio methods, Journal of Nuclear Materials 452 (1) (2014) 569–577. doi:https://doi.org/10.1016/j.jnucmat.2014.06.023.
- [30] R. Khanal, N. Ayers, N. Jerred, M. T. Benson, R. D. Mariani, I. Charit, S. Choudhury, Role of zirconium in neodymium-dopants interactions within uranium-based metallic fuels, Nuclear Materials and Energy 26 (2021) 100912. doi:https://doi.org/10.1016/j.nme.2021.100912.
- [31] M. Christensen, W. Wolf, C. Freeman, E. Wimmer, R. Adamson, L. Hallstadius, P. Cantonwine, E. Mader, Diffusion of point defects, nucleation of dislocation loops, and effect of hydrogen in hcp-zr: Ab initio and classical simulations, Journal of Nuclear Materials 460 (2015) 82–96. doi:https://doi.org/10.1016/j.jnucmat.2015.02.013.
- [32] Q. Peng, W. Ji, H. Huang, S. De, Stability of self-interstitial atoms in hcp-zr, Journal of Nuclear Materials 429 (1) (2012) 233–236. doi:https://doi.org/10.1016/j.jnucmat.2012.06.010.
- [33] F. Willaime, Ab initio study of self-interstitials in hcp-zr, Journal of Nuclear Materials 323 (2) (2003) 205–212, proceedings of the Second IEA Fusion Materials Agreement Workshop on Modeling and Experimental Validation. doi:https://doi.org/10.1016/j.jnucmat.2003.08.005.
- [34] Y.-J. Hao, L. Zhang, X.-R. Chen, L.-C. Cai, Q. Wu, D. Alfè, Ab initio calculations of the thermodynamics and phase diagram of zirconium, Phys. Rev. B 78 (2008) 134101. doi:10.1103/PhysRevB.78.134101.
- [35] W. Zhou, J. Tian, Q. Feng, J. Zheng, X. Liu, J. Xue, D. Qian, S. Peng, Molecular dynamics simulations of high-energy displacement cascades in hcp-zr, Journal of Nuclear Materials 508 (2018) 540–545. doi:https://doi.org/10.1016/j.jnucmat.2018.06.002.
- [36] Y. Li, H. Chen, Y. Chen, Y. Wang, L. Shao, W. Xiao, Point defect effects on tensile strength of -zirconium studied by molecular dynamics simulations, Nuclear Materials and Energy 20 (2019) 100683. doi:https://doi.org/10.1016/j.nme.2019.100683.
- [37] A. Moore, B. Beeler, C. Deo, M. Baskes, M. Okuniewski, Atomistic modeling of high temperature uranium–zirconium alloy structure and thermodynamics, Journal of Nuclear Materials 467 (2015) 802–819. doi:https://doi.org/10.1016/j.jnucmat.2015.10.016.
- [38] H. Fang, X. Hui, G. Chen, R. Öttking, Y. Liu, J. Schaefer, Z. Liu, Ab initio molecular dynamics simulation for structural transition of zr during rapid quenching processes, Computational Materials Science 43 (4) (2008) 1123–1129. doi:https://doi.org/10.1016/j.commatsci.2008.03.011.
- [39] N. Jakse, O. Le Bacq, A. Pasturel, Short-range order of liquid and undercooled metals: Ab initio molecular dynamics study, Journal of non-crystalline solids 353 (32-40) (2007) 3684–3688.
- [40] N. Jakse, O. L. Bacq, A. Pasturel, Short-range order of liquid and undercooled metals: Ab initio molecular dynamics study, Journal of Non-Crystalline Solids 353 (32) (2007) 3684–3688. doi:https://doi.org/10.1016/j.jnoncrysol.2007.05.131.
- [41] D. V. Minakov, M. A. Paramonov, P. R. Levashov, Ab initio inspection of thermophysical experiments for molybdenum near melting, AIP Advances 8 (12) (2018) 125012. doi:10.1063/1.5062152.
- [42] D. V. Minakov, M. A. Paramonov, P. R. Levashov, Consistent interpretation of experimental data for expanded liquid tungsten near the liquid-gas coexistence curve, Phys. Rev. B 97 (2018) 024205. doi:10.1103/PhysRevB.97.024205.
- [43] D. V. Minakov, M. A. Paramonov, P. R. Levashov, Interpretation of pulse-heating experiments for rhenium by quantum molecular dynamics., High Temperatures–High Pressures 49 (1-2) (2020) 211–219.
- [44] J. Clérouin, P. Renaudin, P. Noiret, Experiments and simulations on hot expanded boron, Phys. Rev. E 77 (2008) 026409. doi:10.1103/PhysRevE.77.026409.
- [45] L. Miljacic, S. Demers, Q.-J. Hong, A. van de Walle, Equation of state of solid, liquid and gaseous tantalum from first principles, Calphad 51 (Supplement C) (2015) 133 – 143. doi:https://doi.org/10.1016/j.calphad.2015.08.005.
- [46] J. Clérouin, P. Noiret, V. N. Korobenko, A. D. Rakhel, Direct measurements and ab initio simulations for expanded fluid aluminum in the metal-nonmetal transition range, Phys. Rev. B 78 (2008) 224203. doi:10.1103/PhysRevB.78.224203.
- [47] N. D. Mermin, Thermal properties of the inhomogeneous electron gas, Phys. Rev. 137 (1965) A1441–A1443. doi:10.1103/PhysRev.137.A1441.
- [48] G. Kresse, J. Hafner, Ab initio molecular dynamics for liquid metals, Phys. Rev. B 47 (1993) 558.
- [49] G. Kresse, J. Hafner, Ab initio molecular-dynamics simulation of the liquid-metal-amorphous-semiconductor transition in germanium, Phys. Rev. B 49 (1994) 14251.
- [50] G. Kresse, J. Furthmüller, Efficient iterative schemes for ab initio total-energy calculations using a plane-wave basis set, Phys. Rev. B 54 (1996) 11169–11186. doi:10.1103/PhysRevB.54.11169.
- [51] G. Kresse, J. Furthmüller, Efficiency of ab-initio total energy calculations for metals and semiconductors using a plane-wave basis set, Computational Materials Science 6 (1) (1996) 15 – 50. doi:10.1016/0927-0256(96)00008-0.
- [52] P. E. Blöchl, Projector augmented-wave method, Phys. Rev. B 50 (1994) 17953–17979. doi:10.1103/PhysRevB.50.17953.
- [53] J. P. Perdew, K. Burke, M. Ernzerhof, Generalized gradient approximation made simple, Phys. Rev. Lett. 77 (1996) 3865.
- [54] J. P. Perdew, K. Burke, M. Ernzerhof, Erratum: Generalized gradient approximation made simple, Phys. Rev. Lett. 78 (1997) 1396.
- [55] S. Nosé, A unified formulation of the constant temperature molecular dynamics methods, The Journal of Chemical Physics 81 (1) (1984) 511–519. doi:10.1063/1.447334.
- [56] D. R. Lide (Ed.), CRC Handbook of Chemistry and Physics, Internet Version 2005, CRC Press, Boca Raton, FL, 2005.
- [57] A. Baldereschi, Mean-value point in the brillouin zone, Phys. Rev. B 7 (1973) 5212–5215. doi:10.1103/PhysRevB.7.5212.
- [58] R. Armiento, A. E. Mattsson, Functional designed to include surface effects in self-consistent density functional theory, Phys. Rev. B 72 (2005) 085108. doi:10.1103/PhysRevB.72.085108.
- [59] D. M. Ceperley, B. J. Alder, Ground state of the electron gas by a stochastic method, Phys. Rev. Lett. 45 (1980) 566–569. doi:10.1103/PhysRevLett.45.566.
- [60] D. V. Knyazev, P. R. Levashov, Thermodynamic, transport, and optical properties of dense silver plasma calculated using the GreeKuP code, Contrib. Plasma Phys. 59 (3) (2018) 345–353. doi:10.1002/ctpp.201800084.
- [61] M. P. Desjarlais, J. D. Kress, L. A. Collins, Electrical conductivity for warm, dense aluminum plasmas and liquids, Phys. Rev. E 66 (2) (2002) 025401. doi:10.1103/physreve.66.025401.
- [62] D. V. Knyazev, P. R. Levashov, Ab initio calculation of transport and optical properties of aluminum: Influence of simulation parameters, Comput. Mater. Sci. 79 (2013) 817–829. doi:10.1016/j.commatsci.2013.04.066.
- [63] P. M. Kowalski, S. Mazevet, D. Saumon, M. Challacombe, Equation of state and optical properties of warm dense helium, Phys. Rev. B 76 (7) (2007) 075112. doi:10.1103/physrevb.76.075112.
- [64] H. J. Monkhorst, J. D. Pack, Special points for brillouin-zone integrations, Phys. Rev. B 13 (1976) 5188–5192. doi:10.1103/PhysRevB.13.5188.
- [65] J. S. Toll, Causality and the dispersion relation: Logical foundations, Phys. Rev. 104 (6) (1956) 1760–1770. doi:10.1103/physrev.104.1760.
- [66] A. Peterson, H. Kedesdy, P. Keck, E. Schwarz, Surface tension of titanium, zirconium, and hafnium, Journal of Applied Physics 29 (2) (1958) 213–216.
- [67] B. Allen, The surface tension of liquid transition metals at their melting points, Trans. AIME 227 (1963).
- [68] V. Yelyutin, M. Maurakh, I. Penkov, Viscosity of liquid zirconium (1964).
- [69] D. Steinberg, A simple relationship between the temperature dependence of the density of liquid metals and their boiling temperatures, Metallurgical Transactions 5 (6) (1974) 1341–1343.
- [70] A. F. Guillermet, Critical evaluation of the thermodynamic properties of zirconium, High Temperatures-High Pressures 19 (2) (1987) 119–160.
- [71] P.-F. Paradis, W.-K. , Thermophysical properties of zirconium at high temperature, Journal of materials research 14 (9) (1999) 3713–3719.
- [72] H. Yoo, C. Park, S. Jeon, S. Lee, G. W. Lee, Uncertainty evaluation for density measurements of molten ni, zr, nb and hf by using a containerless method, Metrologia 52 (5) (2015) 677.
- [73] T. Ishikawa, P.-F. Paradis, S. Yoda, New sample levitation initiation and imaging techniques for the processing of refractory metals with an electrostatic levitator furnace, Review of Scientific Instruments 72 (5) (2001) 2490–2495. doi:10.1063/1.1368861.
- [74] V. N. Korobenko, A. I. Savvatimskii, Temperature dependence of the density and electrical resistivity of liquid zirconium up to 4100 k, High Temperature 39 (4) (2001) 525–531.
- [75] M. Chase Jr, Nist-janaf thermochemical tables, J. Phys. Chem. Ref. Dara Monogrph 9 (1998) 1019.
- [76] J. Arblaster, Thermodynamic properties of zirconium, Calphad 43 (2013) 32–39.
- [77] L. V. Gurvich, I. V. Veits, V. A. Medvedev, Thermodynamic Properties of Individual Substances. Volume 4 [in Russian], Nauka, Moscow, 1982.
- [78] V. N. Korobenko, A. I. Savvatimski, K. K. Sevostyanov, Experimental investigation of solid and liquid zirconium, High Temperatures – High Pressures 33 (6) (2001) 647–658.
- [79] C. Brunner, C. Cagran, A. Seifter, G. Pottlacher, The normal spectral emissivity at a wavelength of 684.5 nm and thermophysical properties of liquid zirconium up to the end of the stable liquid phase, in: AIP Conference Proceedings, Vol. 684, American Institute of Physics, 2003, pp. 771–776.
- [80] V. N. Korobenko, A. Savvatimskij, Properties of solid and liquid zirconium, Teplofizika Vysokikh Temperatur 29 (5) (1991) 883–886.
- [81] V. Korobenko, M. Agranat, S. Ashitkov, A. Savvatimskiy, Zirconium and iron densities in a wide range of liquid states, International journal of thermophysics 23 (1) (2002) 307–318.
- [82] G. Gathers, Dynamic methods for investigating thermophysical properties of matter at very high temperatures and pressures, Reports on Progress in Physics 49 (4) (1986) 341.
- [83] J. Hafner, Ab-initio simulations of materials using vasp: Density-functional theory and beyond, Journal of Computational Chemistry 29 (13) (2008) 2044–2078. doi:10.1002/jcc.21057.
- [84] J. Harl, G. Kresse, Accurate bulk properties from approximate many-body techniques, Phys. Rev. Lett. 103 (2009) 056401. doi:10.1103/PhysRevLett.103.056401.
- [85] Y. S. Touloukian, R. Kirby, R. Taylor, P. Desai, Thermophysical Properties Of Matter - The TPRC Data Series. Volume 12. Thermal Expansion Metallic Elements And Alloys, New York: IFI/Plenum, 1975.
- [86] T. Itami, M. Shimoji, Application of simple model theories to thermodynamic properties of liquid transition metals, Journal of Physics F: Metal Physics 14 (2) (1984) L15.
- [87] T. B. Douglas, A. C. Victor, Heat content of zirconium and of five compositions of zirconium hydride from 0 to 900 C, J. Res. Natl. Bur. Stand 61 (1958) 13–23.
- [88] A. Cezairliyan, F. Righini, Simultaneous measurements of heat capacity, electrical resistivity and hemispherical total emittance by a pulse heating technique: zirconium, 1500 to 2100 k, Journal of research of the National Bureau of Standards. Section A, Physics and chemistry 78 (4) (1974) 509.
- [89] I. I. Petrova, V. E. Peletskii, B. N. Samsonov, Investigation of the thermophysical properties of zirconium by subsecond pulsed heating technique, High Temperature 38 (4) (2000) 560–565.
- [90] M. Rösner-Kuhn, K. Drewes, H. Franz, M. G. Frohberg, Enthalpy measurements of the solid high-temperature -phase of titanium and zirconium by levitation drop calorimetry, Journal of alloys and compounds 316 (1-2) (2001) 175–178.
- [91] G. V. Belov, S. A. Dyachkov, P. R. Levashov, I. V. Lomonosov, D. V. Minakov, I. V. Morozov, M. A. Sineva, V. N. Smirnov, The ivtanthermo-online database for thermodynamic properties of individual substances with web interface, Journal of Physics: Conference Series 946 (1) (2018) 012120.
- [92] F. Jaeger, W. Veenstra, The exact measurement of the specific heats of solid substances at high temperatures. vi. the specific heats of vanadium, niobium, tantalum and molybdenum, Recueil des Travaux Chimiques des Pays-Bas 53 (8) (1934) 677–687.
- [93] J. Coughlin, E. King, High-temperature heat contents of some zirconium-containing substances1, Journal of the American Chemical Society 72 (5) (1950) 2262–2265.
- [94] G. B. Skinner, J. W. Edwards, H. L. Johnston, The vapor pressure of inorganic substances. v. zirconium between 1949 and 2054 K., Journal of the American Chemical Society 73 (1) (1951) 174–176.
- [95] H. Adenstedt, Physical, thermal and electrical properties of hafnium and high purity zirconium, Transactions of the American Society for Metals 44 (1952) 949–973.
- [96] R. Redmond, J. Lones, Enthalpies and heat capacities of stainless steel (316), zirconium, and lithium at elevated temperatures, Tech. rep., Oak Ridge National Lab. (1952).
- [97] I. Fieldhouse, J. Lang, Armour research foundation report, Tech. rep., WADD-TR-60-904 (1961).
- [98] S. A. Kats, V. Y. Chekhovskoi, M. D. Kovalenko, Thermophysical properties of zirconium and hafnium at high temperatures, Teplofizika Vysokikh Temperatur 23 (2) (1985) 395–397.
- [99] J. Qin, M. Rösner-Kuhn, K. Drewes, U. Thiedemann, G. Kuppermann, B. Camin, R. Blume, M. G. Frohberg, Spectral emissivities at wavelengths in the range 500–653 nm, enthalpies, and heat capacities of the liquid phases of cobalt, titanium, and zirconium, High temperature and materials science 37 (3) (1997) 129–142.
- [100] V. Elyutin, M. Maurakh, G. Sverdlov, Determining the latent heat of fusion of zirconium., Izv. Vyssh. Ucheb. Zaved., Tsvet. Met., No. 2, 87-8 (1967). (1967).
- [101] P. D. Desai, H. M. James, C. Y. Ho, Electrical resistivity of vanadium and zirconium, Journal of Physical and Chemical Reference Data 13 (4) (1984) 1097–1130. doi:10.1063/1.555724.
- [102] V. E. Peletskii, E. A. Bel’skaya, Elektricheskoe soprotivlenie tugoplavkikh metallov (Electrical Resistance of Refractory Metals), Moscow: Energoizdat, 1981.
- [103] N. D. Milošević, K. D. Maglić, Thermophysical properties of solid phase zirconium at high temperatures, Int. J. Thermophys. 27 (4) (2006) 1140–1159. doi:10.1007/s10765-006-0080-z.
- [104] I. I. Petrova, V. E. Peletskii, B. N. Samsonov, Investigation of the thermophysical properties of zirconium by subsecond pulsed heating technique, High Temp. 38 (4) (2000) 560–565. doi:10.1007/bf02755802.
- [105] V. E. Peletskii, V. Druzhinin, Y. G. Sobol’, Emissivity, thermal conductivity, and electrical conductivity of remelted zirconium at high temperatures, Teplofiz. Vys. Temp. 8 (4) (1970) 774–779.
- [106] S. C. Furman, P. A. McManus, Metal-water reactions: Ix. the kinetics of metal-water reactions- feasibility study of some new techniques, Tech. Rep. GEAP-3338, General Electric Co. Vallecitos Atomic Lab., Pleasanton, Calif. (1960).
- [107] D. Cubicciotti, The melting point—composition diagram of the zirconium—oxygen system1, Journal of the American Chemical Society 73 (5) (1951) 2032–2035.
- [108] R. K. Koch, J. Hoffman, R. A. Beall, Liquid State Spectral Emissivities of Titanium, Vanadium, Zirconium, Molybdenum, and Platinum in an Electron-beam Furnace, Vol. 7743, US Department of Interior, Bureau of Mines, 1973.
- [109] C. Cagran, C. Brunner, A. Seifter, G. Pottlacher, Liquid-phase behaviour of normal spectral emissivity at 684.5 nm of some selected metals, High Temp. - High Pressures 34 (6) (2002) 669–679. doi:10.1068/htjr067.
- [110] S. Krishnan, C. D. Anderson, P. C. Nordine, Optical properties of liquid and solid zirconium, Phys. Rev. B 49 (5) (1994) 3161–3166. doi:10.1103/PhysRevB.49.3161.
- [111] A. Cezairliyan, J. McClure, A. Miiller, Radiance temperatures (in the wavelength range 523–907 nm) of group ivb transition metals titanium, zirconium, and hafnium at their melting points by a pulse-heating technique, International journal of thermophysics 15 (5) (1994) 993–1009.
- [112] J. A. Coffman, G. M. Kibler, T. F. Lyon, B. D. Acchione, Carbonization of plastics and refractory materials research, Tech. Rep. WADD-TR-60-646 (Pt.II); AD-2979, General Electric Co. Flight Propulsion Lab. Dept., Cincinnati (1961).
- [113] M. French, T. R. Mattsson, Thermoelectric transport properties of molybdenum from ab initio simulations, Physical Review B 90 (16) (2014) 165113. doi:10.1103/PhysRevB.90.165113.
- [114] Y. V. Petrov, K. P. Migdal, N. Inogamov, S. I. Anisimov, Transfer processes in a metal with hot electrons excited by a laser pulse, JETP letters 104 (6) (2016) 431–439.
- [115] M. P. Desjarlais, C. R. Scullard, L. X. Benedict, H. D. Whitley, R. Redmer, Density-functional calculations of transport properties in the non-degenerate limit and the role of electron-electron scattering, Physical Review E 95 (2017) 033203. doi:10.1103/PhysRevE.95.033203.
- [116] A. Cezairliyan, F. Righini, Measurement of melting point, radiance temperature (at melting point), and electrical resistivity (above 2,100 k of zirconium by a pulse heating method, Rev. Int. Hautes Temp. Refract. 12 (3) (1975) 201–207.
- [117] C. Ronchi, J. P. Hiernaut, G. J. Hyland, Emissivity x points in solid and liquid refractory transition metals, Metrologia 29 (4) (1992) 261–271. doi:10.1088/0026-1394/29/4/001.
- [118] D. N. Baria, R. G. Bautista, Effect of surface conditions on the normal spectral emittance of titanium and zirconium between 1000 and 1800 k, Metall. Trans. 5 (3) (1974) 555–560. doi:10.1007/bf02644649.
- [119] A. Cezairliyan, F. Righini, Simultaneous measurements of heat capacity, electrical resistivity and hemispherical total emittance by a pulse heating technique: zirconium, 1500 to 2100 k, J. Res. Natl. Bur. Stand., Sect. A 78A (4) (1974) 509. doi:10.6028/jres.078a.034.
- [120] A. I. Savvatimskii, V. N. Korobenko, High-Temperature Properties of Metals of Atomic Power Engineering (Zirconium, Hafnium, and Iron in Melting and Liquid State)[in russian], Izd. dom MEI, 2012.
- [121] H. B. Radousky, M. R. Armstrong, R. A. Austin, E. Stavrou, S. Brown, A. A. Chernov, A. E. Gleason, E. Granados, P. Grivickas, N. Holtgrewe, H. J. Lee, S. S. Lobanov, B. Nagler, I. Nam, V. Prakapenka, C. Prescher, P. Walter, A. F. Goncharov, J. L. Belof, Melting and refreezing of zirconium observed using ultrafast x-ray diffraction, Phys. Rev. Research 2 (2020) 013192. doi:10.1103/PhysRevResearch.2.013192.
- [122] J. S. Pigott, N. Velisavljevic, E. K. Moss, N. Draganic, M. K. Jacobsen, Y. Meng, R. Hrubiak, B. T. Sturtevant, Experimental melting curve of zirconium metal to 37 GPa, Journal of Physics: Condensed Matter 32 (35) (2020) 355402. doi:10.1088/1361-648x/ab8cdb.
- [123] D. Smirnova, S. Starikov, I. Gordeev, Evaluation of the structure and properties for the high-temperature phase of zirconium from the atomistic simulations, Computational Materials Science 152 (2018) 51–59.
- [124] V. Stutzmann, A. Dewaele, J. Bouchet, F. m. c. Bottin, M. Mezouar, High-pressure melting curve of titanium, Phys. Rev. B 92 (2015) 224110. doi:10.1103/PhysRevB.92.224110.