Predicting ion channel conductance via dissipation-corrected targeted molecular dynamics and Langevin equation simulations
Abstract
Ion channels are important proteins for physiological information transfer and functional control. To predict the microscopic origins of their voltage-conductance characteristics, we here applied dissipation-corrected targeted Molecular Dynamics in combination with Langevin equation simulations to potassium diffusion through the Gramicidin A channel as a test system. Performing a non-equilibrium principal component analysis on backbone dihedral angles, we find coupled protein-ion dynamics to occur during ion transfer. The dissipation-corrected free energy profiles correspond well to predictions from other biased simulation methods. The incorporation of an external electric field in Langevin simulations enables the prediction of macroscopic observables in the form of I-V characteristics.
1 Introduction
Ion channels are membrane-spanning proteins that exist in every cell of every living organism1. The function of these channels is to enable and control ion flux in and out of cells. The resulting charge currents lead to compartmentation and control of electrostatic gradients, which is one of the major mechanisms of information transfer within living beings2, 3. Consequently, channel dysfunctions result in maladies such as central nervous disorders of excitability, e.g., epilepsy and cardiac arrhythmia4.
To gain insight into the molecular mechanisms of ion transfer through such channels, unbiased all-atom molecular dynamics (MD)5 simulations can be used. This approach becomes impractical in the presence of high free energy barriers, leading to rare transitions that require long simulation times for statistically converged results. Furthermore, ion transport across channels is usually governed by external driving such as electrostatic and osmotic potentials. To overcome such issues, various MD methods employing bias potentials have been applied to ion channels 6, 7, 8, 9, 10, 11, 12, 13, 14, 15, which usually require extensive equilibration. A way to circumvent equilibration is to carry out non-equilibrium simulations16, 17, 18. Alternatively, simulations can be sped up by using coarse-graining approaches and electrostatic-based models7, 19, 20, 21.
To implement external driving, it is possible to apply an electric potential along the simulation box22, 23, 24, 25, 26, 27.
We recently developed an approach that combines non-equilibrium simulations and coarse-graining of system dynamics called dissipation-corrected targeted MD (dcTMD) 28, which allows to calculate free energies as well as friction profiles along a reaction coordinate of interest directly from a series of constant velocity targeted MD trajectories. Such free energies and friction factors can be used for the integration of a Langevin equation (LE), which allows to sample processes such as ion transduction well beyond the capabilities of atomistic MD simulations.29.
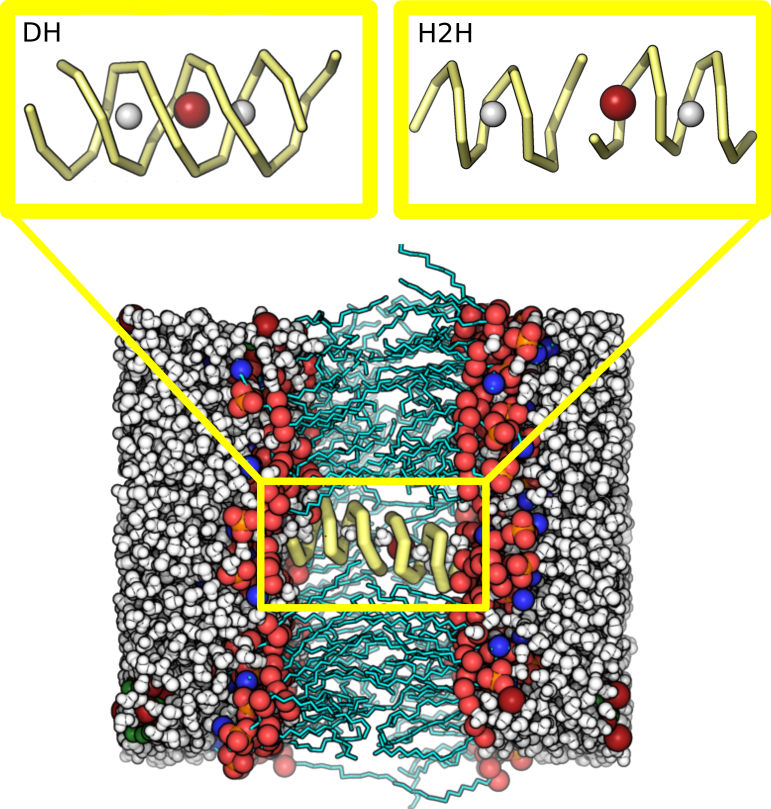
We here use dcTMD in combination with LE simulations to calculate ion channel conductances. To mimic an electrophysiological experiment30, 22, we model the membrane potential by adding a linear potential to the free energy profile. From the resulting ion transition times we then calculate the corresponding ion currents. The major advantage of our approach is that we are not limited by the approximations made in rate theory,31, 32 but can calculate rates for systems with rugged free energy profiles and several transition states of similar height. Furthermore, we can predict I-V characteristics that do not obey Ohm’s law 22. As test system, we use the Gramicidin A channel (gA) from Bacillus brevis 33, 34. Gramicidines consist of a dimer of a 15 amino acid helical peptide and form a family of antibiotics, that damage and kill bacteria by increasing the cation permeability of their plasma membranes through bilayer-spanning pores. The cylindrical pore is only permeable for monovalent cations such as New Aor K+ , but not for anions like Cl-. As shown in Fig. 1, two main conformations of gA exist, which are the double helix (DH) and head-to-head (H2H) conformation. H2H is believed to be the physiologically relevant conformation35, 36 and is consistent with data from solid-state NMR spectroscopy37, while DH appears in protein crystallization38 and organic solvents39 (see the Supplementary Information for further details). gA is both an experimentally 34, 30, 19, 40, 41, 42 and computationally 43, 6, 44, 45, 46, 9, 47, 10, 16, 17, 18, 12, 13, 15 well-investigated system, making it an ideal benchmark system for our approach. We used both representative conformations as model systems for the simulations in this work: the DH conformation served as theory-internal benchmark system, and the H2H conformation for comparison with other methods as well as with experiments.
2 Theory
Dissipation-corrected targeted Molecular Dynamics (dcTMD)
We briefly recapitulate the theoretical basis of dcTMD: our approach is based on targeted MD developed by Schlitter et al. 48. Here, a constraint force is applied to a subset of atoms to move it towards a target conformation along a predetermined one-dimensional path in conformational space with constant velocity along a pulling coordinate .
From the resulting TMD trajectories, dcTMD 28 estimates the free energy as well as a non-equilibrium friction coefficient . dcTMD employs a second order cumulant expansion of Jarzynski’s equality 49, 50
| (1) |
where , denotes the work performed on the system by external pulling and an ensemble average over the independently realised pulling trajectories. We further assume that the constraint force can be simply included as an additive term in a memory free Langevin equation 51
| (2) |
with a mean force , a dissipative drag force and a Gaussian process with zero mean and unity variance. As the constraint force enforces a constant velocity, . An ensemble average of Eq. (2) over many TMD trajectories and integrating from to results in
| (3) |
where the second right-hand side term describes the dissipated work of the process in terms of the friction . Combining Eqs. (1) and (3) finally yields non-equilibrium friction factors
| (4) |
Friction factors can be converted into diffusion coefficients .
Path separation
Eq. (1) requires the assumption that the work along the pulling coordinate is normally distributed. However, the bias may introduce motion along additional hidden coordinates, leading to deviations from a normal work distribution29. In the following, a "pathway" denotes a route through a relevant reaction coordinate space shared by a subset of trajectories. We showed earlier29 that clustering trajectories according to pathways and separately subjecting such clusters to dissipation correction reveals the free energies and friction profiles along those pathways. We assume that the most likely path taken is the one most energetically favoured, i.e. the one with the lowest free energy barrier.
LE with external electrical field
Using and estimated via Eqs. (3) and (4) as input for the integration of the LE (2), one can predict coarse-grained dynamics along as long as 29. So far, this dcTMD-LE ansatz was only applied to systems without external driving except for the constraint force . Here, we investigate its applicability to systems under external driving by an electric field. In a LE framework, this field can be represented by adding a linear electrostatic potential to the free energy. This approximation is valid if the electric field is homogeneous and stationary, only causes a linear perturbation of the free energy and has no influence on the system-bath time scale separation51, i.e., the electric field does not alter the structure nor the dynamics of the channel. If these requirements are fulfilled, the resulting biased potential is
| (5) |
with the electric potential and ion charge . In difference to ion channels with charge sensitive domains 52, 53, 54, gA does not appear to perform conformational changes upon application of an electric field, and Eq. (5) should be well applicable for our investigation.
3 Methods
Structure preparation and equilibration
gA models of a H2H dimer based on PDB ID 1MAG 37 and an antiparallel DH structure based on PDB ID 1AV2 38 are based on simulation systems from Ref. 13. The H2H as well as DH conformation had K+ placed at the preferred ion locations close to the center of the channel as determined in Ref. 13 and shown in Fig. 1. The proteins were embedded into a bilayer patch of 115 DMPC lipids surrounded by ca. 3.600 TIP3P water 55 with a 1 M concentration of KCl using the INFLATEGRO script 56, resulting in a rectangular simulation box with dimensions of 6.05 x 6.05 x 6.64 nm.
MD simulations were carried out in Gromacs v2016 and v2018 57 using a combination58 of the Amber99SB force field59, 60 for the protein and the Berger force field61, 62 for lipid parameters. Missing atomic parameters for N- and C-terminal modifications of gA were generated with antechamber63 and acpype64 using GAFF atomic parameters 65 and AM1/BCC charges 66 used on a protocol applied by us before 67.
For MD simulations, we used a 1 fs integration time step employing the leap-frog integrator 68. Bonds between heavy atoms and hydrogen atoms were constrained by the LINCS algorithm 69. Electrostatics were described by the particle mesh Ewald (PME) method 70. Cutoffs were set to 1 nm for van der Waals interactions and a minimum of 1 nm for PME real space. Temperature control was achieved by the Bussi velocity rescaling thermostat71 (coupling time constant of 0.2 ps). Pressure control was achieved via the Berendsen barostat 72 for preparation simulations employing positional restraints, and the Parrinello-Rahman barostat73 for free MD simulations. In all cases, we used a semiisotropic pressure coupling with a coupling time constant of 0.5 ps and a compressibility of 4.5x bar-1.
For structure equilibration, we employed a simulation protocol used by us previously74: After an initial steepest descent minimization with positional restraints of 1000 kJ/mol applied to protein atoms and the bound K+ ion, 10 ns of MD simulations in the NPT ensemble retaining the restraints were carried out to pre-equilibrate the membrane-solvent environment. Afterwards, positional restraints were removed, and the full system was subjected to a second round of steepest descent minimization. After heating the system to 300 K in a short 10 ps simulation using positional restraints on protein atoms and the bound ion, restraints were removed again, and a final 10 ns free MD simulation for equilibration was carried out.
dcTMD simulations and pathway separation
Targeted MD simulations 48 were carried out using the PULL code implemented in Gromacs 57. As pulling coordinate s we used the distance between K+ and the center of mass (COM) of eight -atoms at the entrance of the channel (visualized in Fig. 1) that served as ”anchor group” so that the pulling vector is parallel to the channel axis . During the simulation, K+ is pulled away or towards the anchor. As the PULL code only allows a maximum distance of half the shortest simulation box edge, the ion was pulled from to the exit of the channel in both directions to determine the free energy and friction profile along the whole channel. For better display of simulation data, the pulling coordinate was mapped onto the channel axis using a Galileo transformation with the COM at nm. In the following, the two pulling directions are denoted as ”forward” and ”backward”, indicating positive and negative values of , respectively.
To generate an initial Boltzmann distribution following Eq. (1), 100–1000 starting configurations with independent velocity distributions corresponding to a temperature of 300 K were generated from the equilibrated system after 10 ns free MD simulation. Each simulation system produced was then equilibrated for 10 ps with position restraints on protein atoms and the bound ion, followed by 100 ps of free MD simulation with a constant distance constraint applied to the ion–anchor group distance. Finally, pulling simulations with a constraint velocity were carried out in all systems for a simulation time of 1.2 ns, resulting in a cumulative simulated time of 4 s. This is close to a water permeation ”velocity” of in Gramicidin 75 (see the Supplementary Information for details), and proved to be an optimal pulling velocity in dcTMD calculations on protein-ligand unbinding 29.
The search for hidden reaction coordinates and pathways was performed with dPCA+ using the fastpca program 76. Trajectories were sorted according to pathways, and the resulting trajectory sets separately subjected to dissipation correction from Eqs. (3) and (4) to obtain and . Friction profiles were smoothed with a Gaussian filter implemented in scipy77 with a width nm (see Fig. S1 for the choice of this parameter).
Additional MD simulations
To determine the bulk friction coefficient of potassium ions in our simulation setup, we performed dcTMD simulations on an enforced dissociation of a KCl ion pair in water. We used the same simulation protocol as in our study on the dissociation of NaCl28, carrying out 1000 independent simulations of 1 ns each with a pulling velocity of m/s. The bulk friction coefficient was determined as the average in the second half of the simulation.
For simulations with two potassium ions bound to gA, we substituted a water molecule at the positions of free energy minima revealed by dcTMD with a second potassium ion in both DH and H2H conformation with the first ion either at the channel entrance or in the center of the channel. After minimzation and equilibration using the protocol above, we carried out unbiased MD simulations of 10–20 ns length.
For simulations with an electrical field applied to the DH conformation, we used the Gromacs option to add a homogeneous field to the simulation box. To achieve ion transitions within a reasonable simulation time (300 ns), we applied a field of 0.08 V/nm corresponding to a voltage of 0.55 V over the length of the simulation box (6.8 nm). After equilibration using the protocol above, we carried out 20 independent MD simulations of each 100–300 ns individual length, with an accumulated simulation time of 3.6 s. While five simulations resulted into ion unbinding into the reverse direction, 12 simulations ended with a completed transfer. The remaining three simulations resulted in incomplete ion transfer and were included as a transfer duration of 300 ns into the calculation of the mean ion passage time.
Langevin equation simulations
The biased potential calculated via Eq. (5) as well as the friction profile derived from dcTMD were used as input for a Markovian LE equation 29 (see the Supplementary Information for details). The LE was numerically integrated using an integrator developed by Bussi and Parrinello 71 using an integration time step of , the K+ mass and . At least 100 LE simulations using different electric potentials were performed with a maximal simulation time of . To compare simulation data based on the LE model to experimental values, the mean passage time of K+ through the gA channel in dependence on the electric potential was then calculated: LE simulations started at close to the channel entrance and ended at a time when the ion crossed . Single channel currents were then calculated as
| (6) |
with the ion charge . Uncertainties of were derived using Jackknifing 78.
4 Results and Discussion
DH conformation
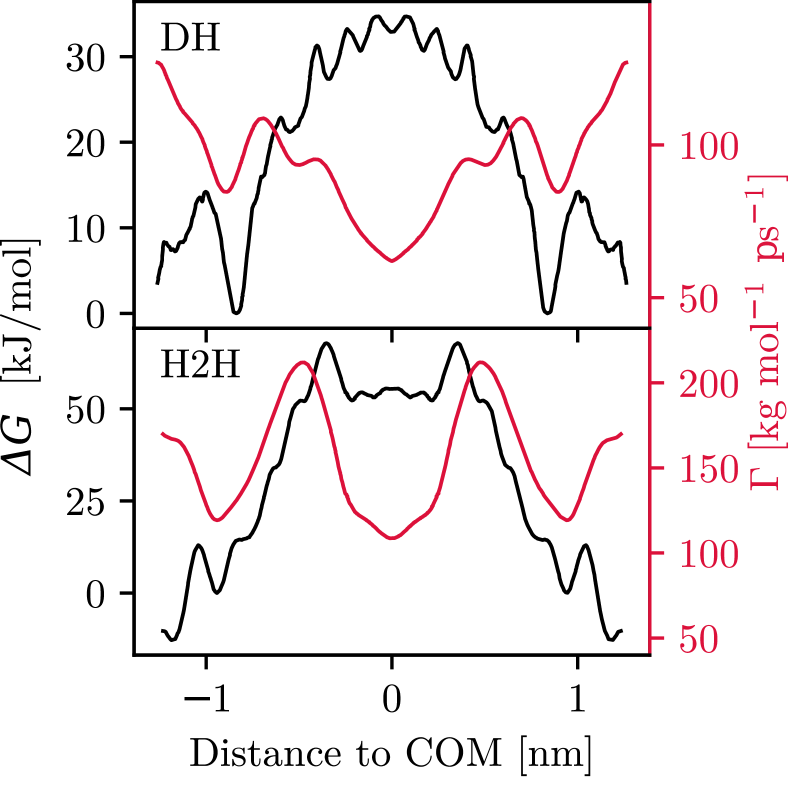
From 100 TMD trajectories in each pulling direction, the free energy and friction profile of K+ within the channel is recovered using dcTMD. Following earlier works, the final profiles are symmetrized 79, 16 and shown in Figs. 2 and S1A. The global shape of the free energy profile exhibits a major central barrier with . Moreover, the profile exhibits two adjacent minima at close to the channel entrance corresponding to binding sites, which fits observations from MD simulations in Ref. 13.
Further, we examined if the presence of two minima allows the binding of two ions at the same time. Short equilibrium MD simulations with two ions placed at these positions however led to the expulsion of one ion into the bulk solvent within 10 ns due to a perturbation of the single-file water chain (see Figs. S2 and S3). The two free energy minima therefore only account for possible binding sites of a single ion present in the channel. Strictly speaking, the presented free energy profiles are only valid for the transfer of a single ion through gA in presence of a 1 M bulk KCl concentration. We note the possibility of ion transfer involving two ions, which we do not investigate here any further.
The friction profile displayed in Figs. 2 and S1B exhibits three pronounced minima: a global minimum in the middle of the channel, and two local minima at that approximately coincide with the binding site close to the channel entrance. The mean channel friction of 93.5 kg/(mol ns) corresponds to a diffusion coefficient Å2/ps for the DH conformation, which is about two orders of magnitude smaller than the one for potassium in bulk water (0.6 Å2/ps). Interestingly, the friction is on the order of values found for ligand unbinding from proteins 29, and similarly, maxima in friction are found at gradients in the free energy profile. This observation is in line with our earlier investigations 28 that minima in free energies correspond to well-ordered states with only small fluctuations, and that approaching transition states leads to the disruption of such order and subsequently increased structural fluctuations. The global minimum around the center of the channel coincides with the maximum in free energy. After leaving the binding site the friction rises again, probably due to solvation of the K+ ion. Outside the channel, the estimate of the free energy becomes less reliable (see Figs. S1 and S4), but stays approximately constant within the estimated error range.
H2H conformation
For the analysis of this conformation, 1000 dcTMD simulations in each pulling direction were carried out. The starting position of K+ is at nm, a position naturally taken by the K+ ion after equilibration. Applying our dissipation correction directly to the full set of trajectories resulted in free energy differences between simulation start and end on the order of several 100s of kJ/mol, which is about one order of magnitude higher than results from Umbrella Sampling calculations (29–) 13. Such artificial free energy profiles in dcTMD have been shown to arise from the presence of hidden coordinates 29, requiring a pathway separation via non-equilibrium PCA 80.
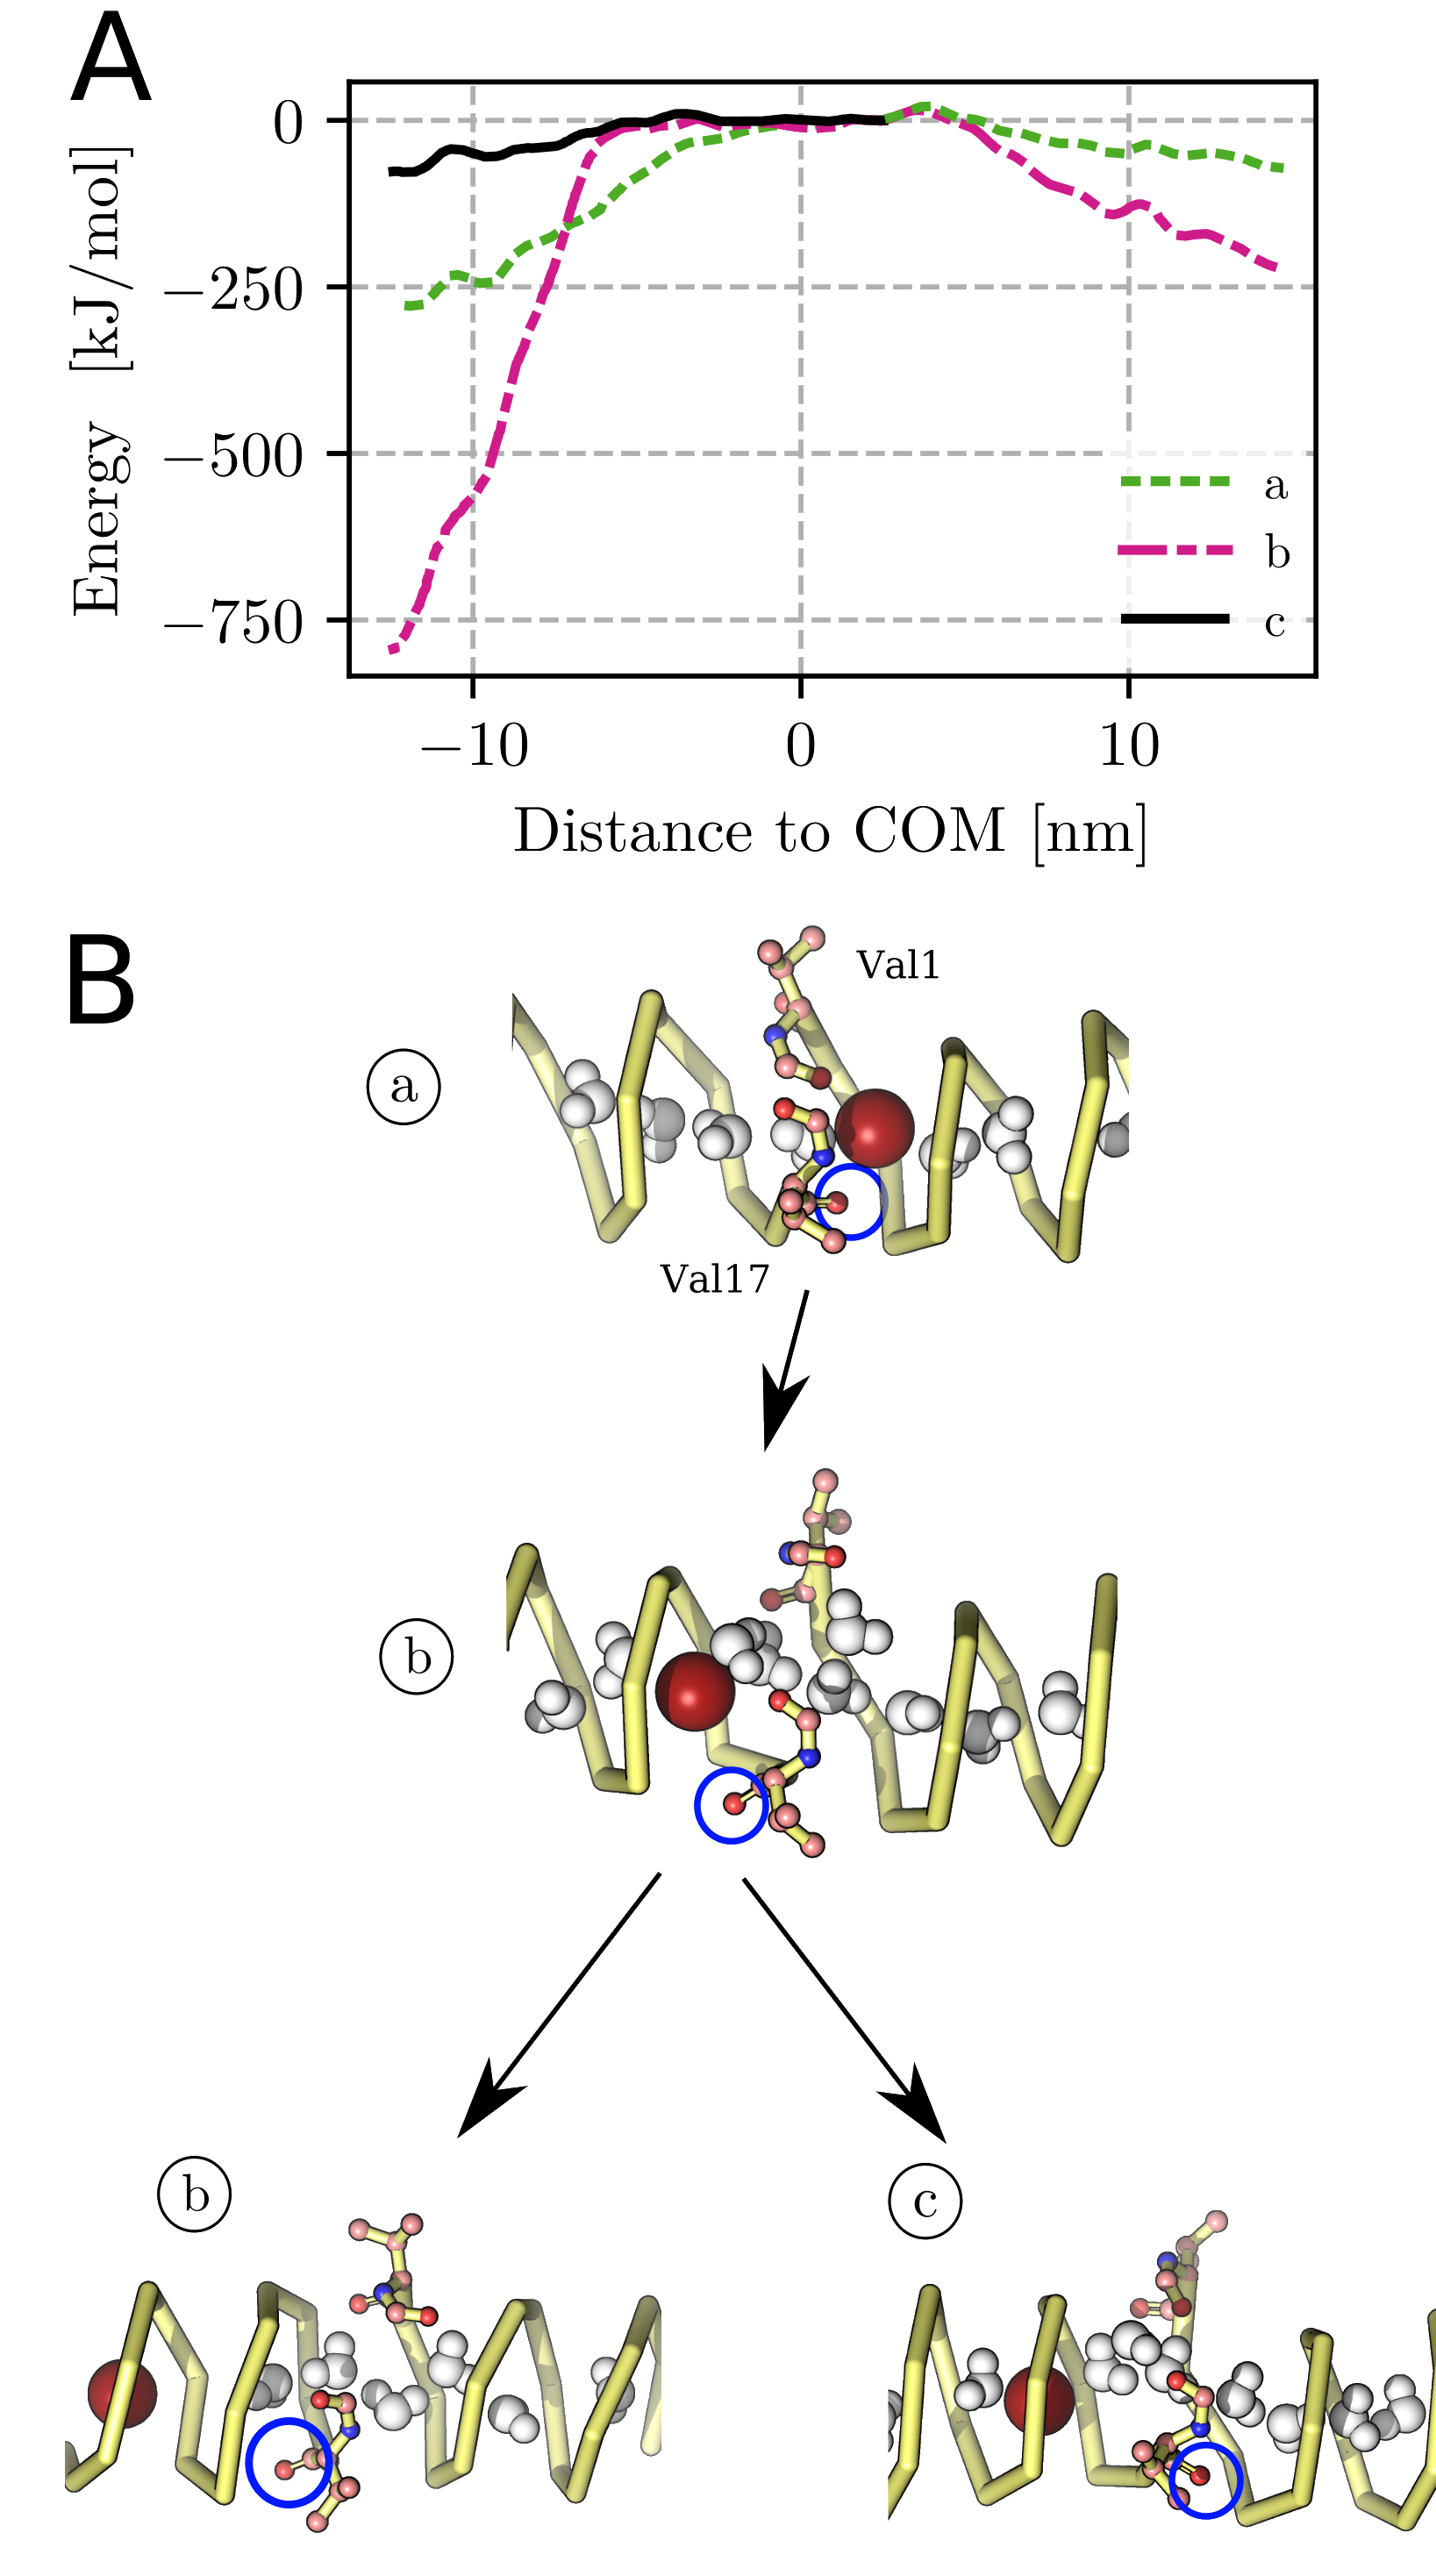
The small size of gA limits the number of possible candidates for such a hidden coordinate: as no large-scale conformational changes occur during ion translocation, we ruled out differences in protein-internal contacts81. Instead, the H2H conformation is less rigid than the DH conformation in the middle of the channel, where the two dimers are connected by six hydrogen bonds around Val1 and Val17 82. Hence, changes of dihedral angles may occur during ion transfer, which in turn might affect degrees of freedom of the single file water chain inside Gramidicin 45. We therefore chose to perform a dPCA+ on the dihedral angles of gA (see Fig. S5). We find for the first principal component (PC1) that Val1 and Val17 indeed undergo conformational changes in the set of targeted MD simulations. Fig. S6A furthermore shows that only PC1 contains more than a single state along its biased energy 80 , where represents the probability to find the system at a given value of a PC within the set of biased trajectories. Assessing changes of these dihedral angles in the simulations and further taking into account the stability of the single-file water chain, we find three distinct patterns of coupled dynamics of protein, ion and water chain that are visualized in Figs. 3, S6 and S7 (further details are given in the Suppleementary Information):
a) In most trajectories (730 trajectories in forward, 700 in backward direction), the valines remain in their initial conformation, and the water chain remains intact. This pattern is unproblematic when K+ is pushed out of the channel along nm. However, when pushed in the opposite (backward) direction past Val1 and Val17, an artificial drop in free energy occurs again.
b) In some trajectories (220 trajectories in forward, 70 in backward direction), the carbonyl group of Val17 follows K+ when the ion is pushed past the channel COM due to electrostatic interactions. This causes the corresponding dihedral angle to flip. As a results, Val17 "clogs" the channel and water molecules cannot follow K+ , leading to the local collapse of the protein structure and again a drop in free energy.
c) In 200 trajectories in backward direction, the carbonyl group of Val17 follows K+ when the ion crosses the channel COM and then flips back into its initial position. Separating such trajectories and performing a separate dissipation correction leads to a free energy profile that agrees in shape and height with the one from a) in forward direction.
The intermediate switching of Val17 in c) is consistent with observations from NMR experiments 83, which propose a conformational change in the Val1/Val17 carbonyl group during ion transduction. We assume that a combination of the free energy profiles of a) for the simulations along and of c) for simulations along is the correct one. As can bee seen in Fig. S8, the resulting subsets of path-separated trajectories indeed result in the necessary recovery of a normal distribution of . Possibly, the water chain collapsing in b) represents an artefact from the usage of a fixed charge force field, as protein-bound water chains are known to experience a significantly increased stabilization from polarization effects 84, 85.
The resulting symmetrized PMF as well as the friction profile for the H2H conformation recovered from the path separated trajectories is shown in Figs. 2 and S9A. The qualitative shape of the free energy agrees with the one from the DH conformation: minima and maxima are approximately at the same positions and agree in depth and height, respectively. The profile exhibits two local minima inside the channel at , which match a binding site observed in experiment 86 as well as computational study 13. The free energy further decreases towards the exit, pointing towards a second binding site right outside the channel as observed by other studies46, 79, 12, and then roughly stays constant within the error of the estimate (see Fig. S10). As in the case of the DH conformation, placing a second potassium ion into the second minimum leads to the exit of one of the ions (see Figs. S2 and S11) due to a perturbation of the water chain. Likewise, the two minima are only valid for a single ion passing through the channel. Two free energy barriers of can be found at , which is in the range of results from other targeted MD studies (58-79 kJ/mol) 18, 17. In other biased MD simulations using mainly Umbrella sampling methods, the obtained free energy barriers of gA in H2H conformation were found to be between 79, 13, which is at least lower than our result. In the center of the channel, a high-energy plateau can be found instead of a single maximum as transition state, which qualitatively matches the results from a recent study employing polarizable force fields 15.
As in the case of the DH conformation, the friction profile displayed in Fig. S9B is minimal at the center of the channel, and peaks at gradients of the free energy profile. The friction rises from until it peaks at and decreases towards the channel entrance binding sites, and qualitatively agrees with the diffusion constant profiles presented in Ref. 12. The mean friction 150 kg/(mol ps) corresponds to a mean diffusion coefficient of Å2/ps, which agrees with other investigations 12 within a factor of 10, and is well comparable to values obtained in similar nonequilibrium simulations employing steered MD17 (1.8 Å2/ps).
LE with electrical field
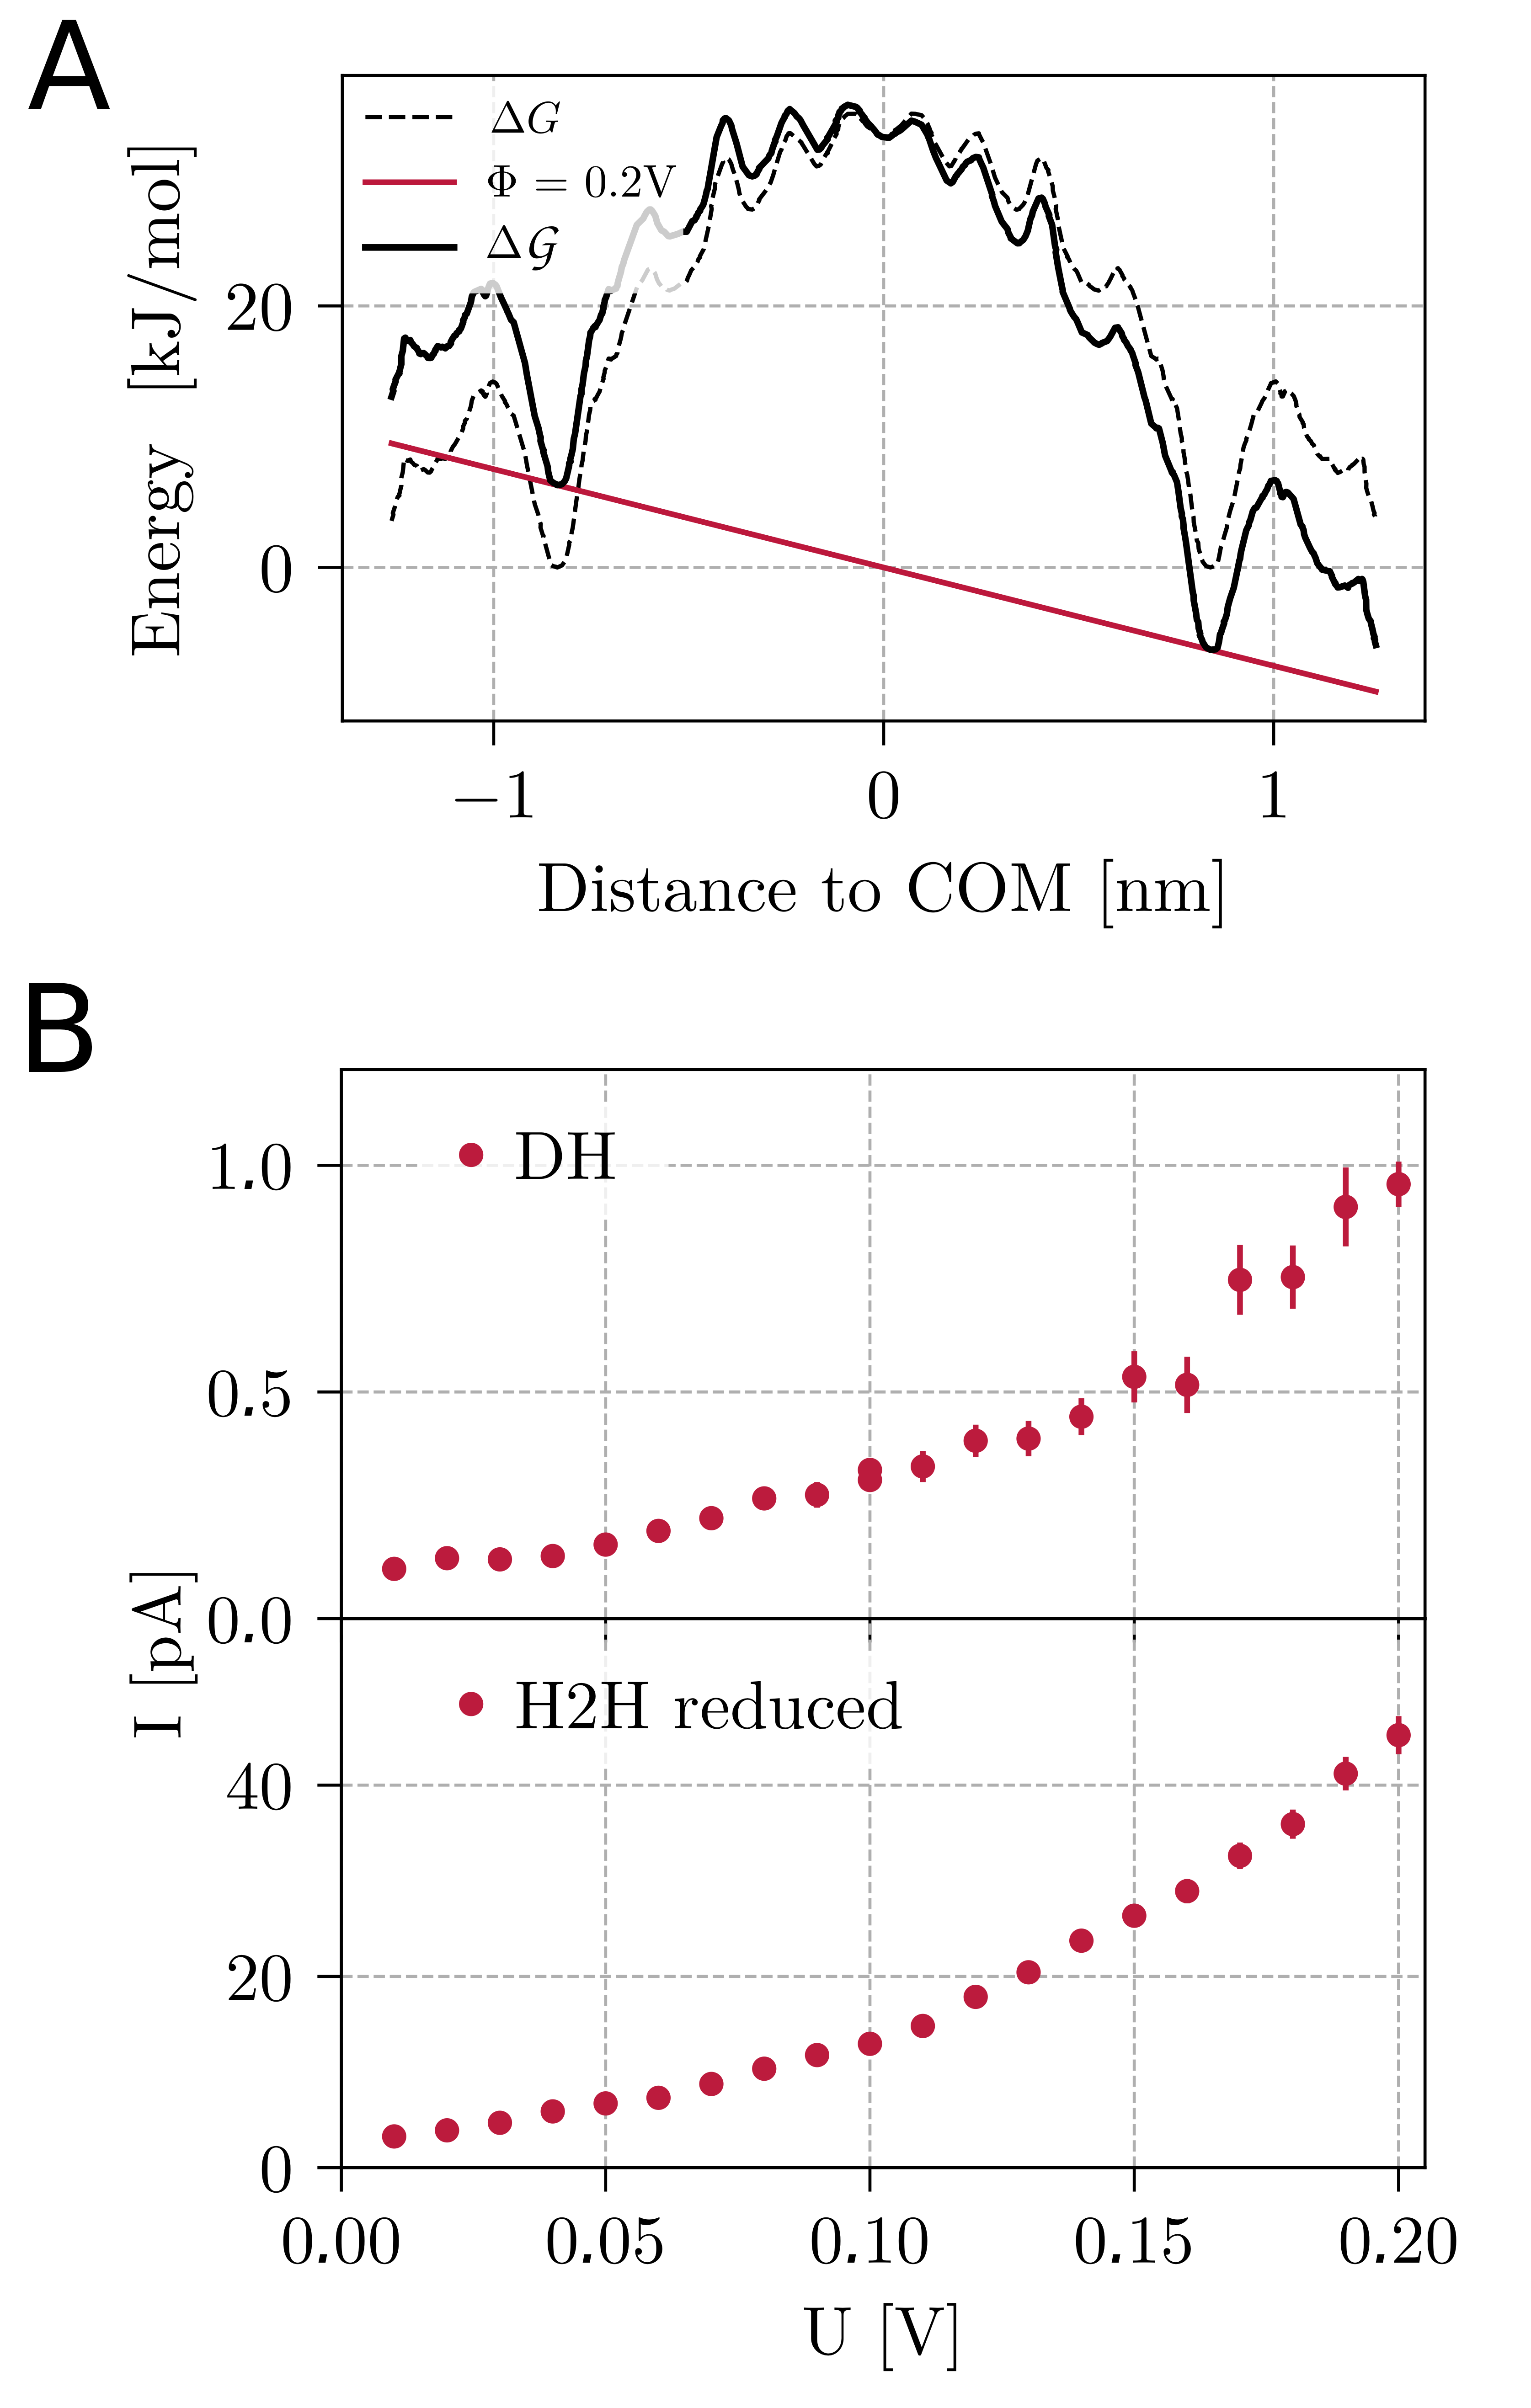
To ensure that the addition of a linear electric potential to the free energy in LE simulations is justified, we checked the charge distribution along the DH in simulations with and without electric field. As can be seen in Fig. S12A, the charge distributions differ only slightly, and mostly agree within 1. Figure 4A displays the change of the free energy curve by an electric potential following Eq. (5), and Fig. S14 displays typical distributions of mean passage times resulting from LE simulations. Table S1 compares our predicted with values from experiment 30, and Fig. 4B displays selected current-voltage (I-V) characteristics calculated according to Eq. (6) for both the DH and the H2H conformation.
In fully atomistic simulation of the DH conformation with electric field, we observe ns. A comparison with the results from our LE simulations however is not straightforward: as Fig. S12B shows, the water-membrane interface where the linear potential drop occurs23, 24 is not easy to define. Additionally, the channel with its length of 2.4 nm does not penetrate the membrane completely, but opens two inlet funnels. We therefore regard three likely scenarios: the potential drop starts and ends
-
A:
at the beginning of the membrane density at 2.5 nm distance to the channel COM, resulting in a partial 0.27 V over the channel.
-
B:
at the maxima in membrane density at 1.5 nm distance to the channel COM, resulting in a partial 0.44 V over the channel.
-
C:
at the channel entrance and exit, resulting in the full 0.55 V over the channel.
If we take scenario B as the most likely one and the two others as an upper and lower boundary, respectively, Tab. S1 shows that we obtain an agreement of fully atomistic MD and LE simulation within a factor of 8. These factors are well within the capabilities of our dcTMD-LE combination reported before29 and within the best error range that can be achieved by free energy-based methods87, 88, 89. We think accordingly that our combined dcTMD-LE simulations approach gives good results for the reproduction of ion transition rates from MD simulations.
For the H2H conformation, K+ does not cross the channel within in any of the LE simulations, which we attribute to an overestimation of free energy barriers. PMF calculations with the H2H system employing polarizable force fields 12, 15 suggest that free energy barriers from simulations with fixed charge force fields are significantly too high. We therefore rescaled the H2H free energy profile to a maximal height of as found in Ref. 12. The resulting I-V characteristics shown in Fig. 4B agree in their exponentially increasing shape with measurements 30 for KCl concentrations of 1–2 M and only deviate from the absolute currents by a factor of 10, which is within the best range achievable by our method 29. We note that for smaller ion concentrations, experimental curves are known to exhibit an apparent linear or asymptotically increasing shape. As our LE simulations start when the ion just entered the channel at and end at just prior to leaving the channel, the estimated and I-V curves should only be quantitatively comparable to electrophysiological experiments at high ion concentration, where the ion current is not limited by the ion diffusion rate from the bulk into the channel.
Concerning the friction profile employed in LE simulations, we find that the transition times and calculated currents are not sensitive to the chosen smoothing factor (see Fig. S13). However, using a potassium bulk friction coefficient leads to reduced currents in H2H and a complete vanishing of currents in DH. The latter observation highlights the necessity to use the dcTMD-derived channel friction coefficients for LE simulations. The drop in currents upon using a smaller friction coefficient stands in contrast to Kramers rate theory, where the transfer rate is , and smaller should result in a larger rate and thus increased currents.
We note in passing that we carried out LE simulations with a comparatively small integrator time step of 1 fs, but the appear to be insensitive to increasing the step size (see Fig. S14). We attribute the time step insensitivity in both protein conformations to the existence of several smaller barriers with individual heights well beyond instead of a single transition state. Overcoming one such barrier due to an overlong time step thus does not directly result in a successful ion transfer. However, changing the system’s mass as done in earlier investigations on protein-ligand pair dissociation 29 resulted in significantly changed (see Fig. S15). This again points to the gA-ion system not following a Kramers reaction-rate expression in the high-friction regime31. Interestingly, this finding is in contrast to the aforementioned work on protein-ligand complexes despite a comparable magnitude of .
5 Conclusion
Our investigation of potassium conduction through Gramicidin A using dcTMD and LE simulations under driving by an external electric potential shows promise as a tool to explicitly compute single channel I-V curves from molecular simulations that can be directly compared to their experimental counterparts. Our method requires full-atom simulations of 2.5 s total simulation time per channel conformation, which is comparable to other methods employing biased simulations15. When taking into account polarization effects, the predicted absolute currents are within a factor of 10 of experimentally measured currents, which corresponds to an error in the transition barrier of 2 and is within the best range achievable by biased simulations88, 29, 89. While most other methods underestimate the maximal conductance at 100 mV by at least a magnitude (see Tab. 1 in Ref.12), we overestimate it by a magnitude owing to the neglect of the initial ion transfer from the water bulk into the channel and the final transfer back into the bulk. A comparison of diffusion coefficients between different methods is problematic, as they can differ between methods by several orders of magnitude (see Ref.47). We find that our H2H mean diffusion coefficient matches the ones from similar nonequilibrium simulations 17. Our approach allows us to monitor coupled ion-protein and ion-water dynamics during the transit as observed in experiment83 and map them to the free energy and friction profiles. We note that studies using non-equilibrium steered MD16, 17, 18 have a similar capability to reveal such dynamics. Furthermore, including an electrical field in our Langevin simulation approach allows to directly calculate electrical currents in form of an I-V curve and therefore a direct comparison with experiment. As the Langevin simulations are extremely fast (1 s simulation take ca. 4 minutes on a single CPU), we can calculate hundreds of replicate runs at a range of voltages within a short time, and obtain well-converged current estimates.
Concerning the comparison of I-V characteristics shape with experiment, we expect that any decrease in current at lower ion concentration than the 1 M investigated here will simply be a consequence of a first-order reaction law for ion binding to the channel entrance. At high ion concentrations on the other hand, transfer over the channel becomes the rate-limiting step. We cannot rule out a transfer mechanism involving two or more ions, which we did not investigate here any further.
The major challenge we encounter in H2H simulations is the significant underestimation of currents, which has been observed by others as well79, 90, 91. The reason for this effect is an overestimation of free energy barriers along the channel due to a missing polarization term in the force field utilized here 79, 12, 15. A similar issue has recently been reported for nonequilibrium simulations of ligand unbinding from receptor molecules 92. Further application of the dcTMD-LE simulation combination to ion channels may therefore require the usage of polarizable force fields.
Finally, we need to address some differences between the applicability of dcTMD to gA and other physiologically relevant ion channels. First, using gA as test systems has the benefit of the protein conformation being independent from the applied electric potential. Other physiologically relevant ion channels such as potassium channels 7, 25, 26, 27 usually contain voltage-sensor-domains 53, 54 that cause an activation or inactivation of the channel via conformational changes depending on the applied voltage. However, if the respective open and closed states can be structurally identified, our approach may help in discriminating and explaining differences in conformation state conductivity. Second, the symmetrization of free energy profiles is only possible in gramicidin due to its structural symmetry, and has been employed by others as well79, 18, 12, 15. For the application to physiologically relevant ion channels, we will need to further evolve our method. Last, such channels usually contain several potassium ions within the channel at the same time7, 25, 26, 27, which will necessitate a different bias coordinate as well as a careful evaluation of the number and position of ions and water molecules conducted.
6 Associated content
6.1 Supporting Information
One PDF with (1) Supplementary Methods detailing on simulations with two ions in gA, pathway separation in H2H and Langevin simulations. (2) Supplementary Discussion on gA conformation, gA water and ion conduction measurements, and work distribution analysis. (3) One Supplementary Table. (4) Fifteen Supplementary Figures.
This information is available free of charge via the Internet at http://pubs.acs.org.
7 Acknowledgements
The authors are grateful to Gerhard Stock, Matthias Post, Sehee Na, Lucie Delemotte and Wojciech Kopec for helpful discussion, and to Benjamin Lickert for discussions and help with Langevin equation simulation scripts. This work has been supported by the Deutsche Forschungsgemeinschaft (DFG) via grant WO 2410/2-1 within the framework of the Research Unit FOR 5099 ”Reducing complexity of nonequilibrium” (project No. 431945604). The authors acknowledge support by the bwUniCluster computing initiative, the High Performance and Cloud Computing Group at the Zentrum für Datenverarbeitung of the University of Tübingen, the state of Baden-Württemberg through bwHPC and the DFG through grant No. INST 37/935-1 FUGG.
References
- Isacoff et al. 2013 Isacoff, E. Y.; Jan, L. Y.; Minor Jr, D. L. Conduits of life’s spark: a perspective on ion channel research since the birth of neuron. Neuron 2013, 80, 658–674
- Hille 2001 Hille, B. Ionic channels of excitable membranes; Sinauer, 2001
- Catterall et al. 2012 Catterall, W. A.; Raman, I. M.; Robinson, H. P.; Sejnowski, T. J.; Paulsen, O. The Hodgkin-Huxley heritage: from channels to circuits. J. Neurosci. 2012, 32, 14064–14073
- Shieh et al. 2000 Shieh, C.-C.; Coghlan, M.; Sullivan, J. P.; Gopalakrishnan, M. Potassium channels: molecular defects, diseases, and therapeutic opportunities. Pharmacol. Rev. 2000, 52, 557–594
- Berendsen et al. 1987 Berendsen, H. J. C.; Grigera, J. R.; Straatsma, T. P. The missing term in effective pair potentials. J. Phys. Chem. 1987, 91, 6269–6271
- Roux and Karplus 1993 Roux, B.; Karplus, M. Ion transport in the gramicidin channel: free energy of the solvated right-handed dimer in a model membrane. J. Am. Chem. Soc. 1993, 115, 3250–3262
- Berneche and Roux 2001 Berneche, S.; Roux, B. Energetics of ion conduction through the K+ channel. Nature 2001, 414, 73–77
- Roux et al. 2004 Roux, B.; Allen, T.; Bernèche, S.; Im, W. Theoretical and computational models of biological ion channels. Q. Rev. Biophys. 2004, 37, 15–103
- Kato and Warshel 2005 Kato, M.; Warshel, A. Through the channel and around the channel: validating and comparing microscopic approaches for the evaluation of free energy profiles for ion penetration through ion channels. J. Phys. Chem. 2005, 109, 19516–19522
- Baştuǧ et al. 2006 Baştug, T.; Gray-Weale, A.; Patra, S. M.; Kuyucak, S. Role of protein flexibility in ion permeation: A case study in gramicidin A. Biophys. J. 2006, 90, 2285–2296
- Khalili-Araghi et al. 2009 Khalili-Araghi, F.; Gumbart, J.; Wen, P.-C.; Sotomayor, M.; Tajkhorshid, E.; Schulten, K. Molecular dynamics simulations of membrane channels and transporters. Curr. Opin. Struct. Biol. 2009, 19, 128–137
- Peng et al. 2016 Peng, X.; Zhang, Y.; Chu, H.; Li, Y.; Zhang, D.; Cao, L.; Li, G. Accurate Evaluation of Ion Conductivity of the Gramicidin A Channel Using a Polarizable Force Field without Any Corrections. J. Chem. Theory Comput. 2016, 12, 2973–2982
- Na et al. 2018 Na, S.; Steinbrecher, T.; Koslowski, T. Thermodynamic integration network approach to ion transport through protein channels: Perspectives and limits. J. Comput. Chem. 2018, 39, 2539–2550
- Flood et al. 2019 Flood, E.; Boiteux, C.; Lev, B.; Vorobyov, I.; Allen, T. W. Atomistic Simulations of Membrane Ion Channel Conduction, Gating, and Modulation. Chem. Rev. 2019, 119, 7737–7832
- Ngo et al. 2021 Ngo, V.; Li, H.; MacKerell Jr., A. D.; Allen, T. W.; Roux, B.; Noskov, S. Polarization Effects in Water-Mediated Selective Cation Transport across a Narrow Transmembrane Channel. J. Chem. Theory Comput. 2021,
- Liu et al. 2006 Liu, Z.; Xu, Y.; Tang, P. Steered molecular dynamics simulations of Na+ permeation across the gramicidin a channel. J. Phys. Chem. B 2006, 110, 12789–12795
- De Fabritiis et al. 2008 De Fabritiis, G.; Coveney, P. V.; Villà-Freixa, J. Energetics of K+ permeability through Gramicidin A by forward-reverse steered molecular dynamics. Proteins Struct. Funct. Genet. 2008, 73, 185–194
- Giorgino and De Fabritiis 2011 Giorgino, T.; De Fabritiis, G. A High-Throughput Steered Molecular Dynamics Study on the Free Energy Profile of Ion Permeation through Gramicidin A. J. Chem. Theory Comput. 2011, 7, 1943–1950
- Edwards et al. 2002 Edwards, S.; Corry, B.; Kuyucak, S.; Chung, S. H. Continuum electrostatics fails to describe ion permeation in the gramicidin channel. Biophys. J. 2002, 83, 1348–1360
- Liu and Eisenberg 2014 Liu, J.-L.; Eisenberg, B. Poisson-Nernst-Planck-Fermi theory for modeling biological ion channels. J. Chem. Phys. 2014, 141, 22D532
- Wilson et al. 2014 Wilson, M. A.; Nguyen, T. H.; Pohorille, A. Combining molecular dynamics and an electrodiffusion model to calculate ion channel conductance. J. Chem. Phys. 2014, 141, 22D519
- Roux et al. 2004 Roux, B.; Allen, T.; Bernèche, S.; Im, W. Theoretical and computational models of biological ion channels. Q. Rev. Biophys. 2004, 37, 15–103
- Roux 2008 Roux, B. The membrane potential and its representation by a constant electric field in computer simulations. Biophys. J. 2008, 95, 4205–4216
- Gumbart et al. 2012 Gumbart, J.; Khalili-Araghi, F.; Sotomayor, M.; Roux, B. Constant electric field simulations of the membrane potential illustrated with simple systems. Biochim. Biophys. Acta - Biomembr. 2012, 1818, 294–302
- Köpfer et al. 2014 Köpfer, D. A.; Song, C.; Gruene, T.; Sheldrick, G. M.; Zachariae, U.; de Groot, B. L. Ion permeation in K+ channels occurs by direct Coulomb knock-on. Science 2014, 346, 352–355
- Kopec et al. 2019 Kopec, W.; Rothberg, B. S.; de Groot, B. L. Molecular mechanism of a potassium channel gating through activation gate-selectivity filter coupling. Nat. Commun. 2019, 10, 1–15
- Gu and de Groot 2020 Gu, R.-X.; de Groot, B. L. Lipid-protein interactions modulate the conformational equilibrium of a potassium channel. Nat. Commun. 2020, 11, 2162
- Wolf and Stock 2018 Wolf, S.; Stock, G. Targeted molecular dynamics calculations of free energy profiles using a nonequilibrium friction correction. J. Chem. Theory Comput. 2018, 14, 6175––6182
- Wolf et al. 2020 Wolf, S.; Lickert, B.; Bray, S.; Stock, G. Multisecond ligand dissociation dynamics from atomistic simulations. Nat. Commun. 2020, 11, 2918
- Busath et al. 1998 Busath, D. D.; Thulin, C. D.; Hendershot, R. W.; Phillips, L. R.; Maughan, P.; Cole, C. D.; Bingham, N. C.; Morrison, S.; Baird, L. C.; Hendershot, R. J.; Cotten, M.; Cross, T. A. Noncontact dipole effects on channel permeation. I. Experiments with (5F-indole) Trp13 gramicidin A channels. Biophys. J. 1998, 75, 2830–2844
- Kramers 1940 Kramers, H. A. Brownian motion in a field of force and the diffusion model of chemical reactions. Physica 1940, 7, 284–304
- Roux and Karplus 1991 Roux, B.; Karplus, M. Ion Transport in a Gramicidin-like Channel: Dynamics and Mobility. J. Phys. Chem. 1991, 95, 4856–4868
- Andersen 1984 Andersen, O. S. Gramicidin Channels. Annu. Rev. Physiol. 1984, 46, 531–548
- Wallace 1990 Wallace, B. A. Gramicidin Channels and Pores. Annu. Rev. Biophys. Biophys. Chem. 1990, 19, 127–157
- T.A. Cross, A. Arseniev and Al. 1999 T.A. Cross, A. Arseniev, B.; Al., Gramicidin channel controversy — reply. Nat. Struct. Biol. 1999, 6, 611–612
- Andersen et al. 1999 Andersen, O. S. et al. Gramicidin channel controversy - The structure in a lipid environment. Nat. Struct. Biol. 1999, 6, 609–612
- Ketchem et al. 1996 Ketchem, R. R.; Lee, K.-C.; Huo, S.; Cross, T. A. Macromolecular structural elucidation with solid-state NMR-derived orientational constraints. J. Biomol. NMR 1996, 8, 1–14
- Burkhart et al. 1998 Burkhart, B. M.; Li, N.; Langs, D. A.; Pangborn, W. A.; Duax, W. L. The conducting form of gramicidin A is a right-handed double-stranded double helix. Proc. Natl. Acad. Sci. 1998, 95, 12950–12955
- Burkhart and Duax 1999 Burkhart, B. M.; Duax, W. L. Gramicidin channel controversy — reply. Nat. Struct. Biol. 1999, 6, 611–612
- Saparov and Pohl 2004 Saparov, S. M.; Pohl, P. Beyond the diffusion limit: Water flow through the empty bacterial potassium channel. Proc. Natl. Acad. Sci. U. S. A. 2004, 101, 4805–4809
- Andersen et al. 2005 Andersen, O. S.; Koeppe, R. E.; Roux, B. Gramicidin channels. IEEE Trans. Nanobioscience 2005, 4, 10–19
- Kelkar and Chattopadhyay 2007 Kelkar, D. A.; Chattopadhyay, A. The gramicidin ion channel: A model membrane protein. Biochim. Biophys. Acta - Biomembr. 2007, 1768, 2011–2025
- Roux and Karplus 1991 Roux, B.; Karplus, M. Ion transport in a model gramicidin channel. Structure and thermodynamics. Biophys. J. 1991, 59, 961–981
- Elber et al. 1995 Elber, R.; Chen, D. P.; Rojewska, D.; Eisenberg, R. Sodium in gramicidin: an example of a permion. Biophys. J. 1995, 68, 906–924
- De Groot et al. 2002 De Groot, B. L.; Tieleman, D. P.; Pohl, P.; Grubmüller, H.; Peter Tieleman, D.; Pohl, P.; Grubmüller, H. Water Permeation through Gramicidin A: Desformylation and the Double Helix: A Molecular Dynamics Study. Biophys. J. 2002, 82, 2934–2942
- Allen et al. 2004 Allen, T. W.; Andersen, O. S.; Roux, B. Energetics of ion conduction through the gramicidin channel. Proc. Natl. Acad. Sci. U. S. A. 2004, 101, 117–122
- Mamonov et al. 2006 Mamonov, A. B.; Kurnikova, M. G.; Coalson, R. D. Diffusion constant of K+ inside Gramicidin A: A comparative study of four computational methods. Biophys. Chem. 2006, 124, 268–278
- Schlitter et al. 1994 Schlitter, J.; Engels, M.; Krüger, P. Targeted molecular dynamics: A new approach for searching pathways of conformational transitions. J. Mol. Graph. 1994, 12, 84–89
- Jarzynski 1997 Jarzynski, C. Nonequilibrium equality for free energy differences. Phys. Rev. Lett. 1997, 78, 2690–2693
- Jarzynski 2004 Jarzynski, C. Nonequilibrium work theorem for a system strongly coupled to a thermal environment. J. Stat. Mech. Theory Exp. 2004,
- Zwanzig 2001 Zwanzig, R. Nonequilibrium Statistical Mechanics; Oxford University Press: Oxford, 2001
- Bezanilla 2008 Bezanilla, F. Ion Channels: From Conductance to Structure. Neuron 2008, 60, 456–468
- Strutz-Seebohm et al. 2011 Strutz-Seebohm, N.; Pusch, M.; Wolf, S.; Stoll, R.; Tapken, D.; Gerwert, K.; Attali, B.; Seebohm, G. Structural Basis of Slow Activation Gating in the Cardiac IKs Channel Complex. Cell. Physiol. Biochem. 2011, 27, 443–452
- Delemotte et al. 2015 Delemotte, L.; Kasimova, M. A.; Klein, M. L.; Tarek, M.; Carnevale, V. Free-energy landscape of ion-channel voltage-sensor–domain activation. Proc. Natl. Acad. Sci. USA 2015, 112, 124–129
- Jorgensen et al. 1983 Jorgensen, W. L.; Chandrasekhar, J.; Madura, J. D.; Impey, R. W.; Klein, M. Comparison of simple potential functions for simulating liquid water. J. Chem. Phys. 1983, 79, 926
- Schmidt and Kandt 2012 Schmidt, T. H.; Kandt, C. LAMBADA and InflateGRO2: efficient membrane alignment and insertion of membrane proteins for molecular dynamics simulations. J. Chem. Inf. Model. 2012, 52, 2657–2669
- Abraham et al. 2015 Abraham, M. J.; Murtola, T.; Schulz, R.; Páll, S.; Smith, J. C.; Hess, B.; Lindahl, E. GROMACS: High performance molecular simulations through multi-level parallelism from laptops to supercomputers. SoftwareX 2015, 1–2, 19–25
- Cordomí et al. 2012 Cordomí, A.; Caltabiano, G.; Pardo, L. Membrane protein simulations using AMBER force field and Berger lipid parameters. J. Chem. Theory Comput. 2012, 8, 948–958
- Wang et al. 2000 Wang, J.; Cieplak, P.; Kollman, P. A. How well does a restrained electrostatic potential (RESP) model perform in calculating conformational energies of organic and biological molecules? J. Comput. Chem. 2000, 21, 1049–1074
- Hornak et al. 2006 Hornak, V.; Abel, R.; Okur, A.; Strockbine, B.; Roitberg, A.; Simmerling, C. Comparison of multiple Amber force fields and development of improved protein backbone parameters. Proteins 2006, 65, 712–725
- Berger et al. 1997 Berger, O.; Edholm, O.; Jähnig, F. Molecular dynamics simulations of a fluid bilayer of dipalmitoylphosphatidylcholine at full hydration, constant pressure, and constant temperature. Biophys. J. 1997, 72, 2002–2013
- Tieleman et al. 1999 Tieleman, D. P.; Sansom, M. S.; berendsen, H. J. Alamethicin helices in a bilayer and in solution: molecular dynamics simulations. Biophys. J. 1999, 76, 40–49
- Wang and Brüschweiler 2006 Wang, J.; Brüschweiler, R. 2D Entropy of Discrete Molecular Ensembles. J. Chem. Theory Comput. 2006, 2, 18–24
- Sousa da Silva and Vranken 2012 Sousa da Silva, A. W.; Vranken, W. F. ACPYPE - AnteChamber PYthon Parser interfacE. BMC Res. Notes 2012, 5, 367
- Wang et al. 2004 Wang, J. M.; Wolf, R. M.; Caldwell, J. W.; Kollman, P. A.; Case, D. A. Development and testing of a general amber force field. J. Comput. Chem. 2004, 25, 1157–1174
- Jakalian et al. 2000 Jakalian, A.; Bush, B. L.; Jack, D. B.; Bayly, C. I. Fast, efficient generation of high-quality atomic Charges. AM1-BCC model: I. Method. J. Comput. Chem. 2000, 21, 132–146
- Wolf et al. 2019 Wolf, S.; Amaral, M.; Lowinski, M.; Vallée, F.; Musil, D.; Güldenhaupt, J.; Dreyer, M. K.; Bomke, J.; Frech, M.; Schlitter, J.; Gerwert, K. Estimation of Protein-Ligand Unbinding Kinetics Using Non-Equilibrium Targeted Molecular Dynamics Simulations. J. Chem. Inf. Model. 2019, 59, 5135–5147
- Leach 1996 Leach, A. R. Molecular Modeling; Pearson Education Limited: London, 1996
- Hess et al. 1997 Hess, B.; Bekker, H.; Berendsen, H. J. C.; Fraaije, J. G. E. M. LINCS: A Linear Constraint Solver for Molecular Simulations. J. Comp. Chem. 1997, 18, 1463–1472
- Darden et al. 1993 Darden, T.; York, D.; Pedersen, L. Particle mesh Ewald: An N log (N) method for Ewald sums in large systems. J. Chem. Phys. 1993, 98, 10089–10092
- Bussi and Parrinello 2007 Bussi, G.; Parrinello, M. Accurate sampling using Langevin dynamics. Phys. Rev. E 2007, 75, 56707
- Berendsen et al. 1984 Berendsen, H. J. C.; Postma, J. P. M.; van Gunsteren, W. F.; Dinola, A.; Haak, J. R. Molecular dynamics with coupling to an external bath. J. Chem. Phys. 1984, 81, 3684
- Parrinello and Rahman 1981 Parrinello, M.; Rahman, A. Polymorphic transitions in single crystals: A new molecular dynamics method. J. Appl. Phys. 1981, 52, 7182–7190
- Schneider et al. 2011 Schneider, M.; Wolf, S.; Schlitter, J.; Gerwert, K. The structure of active opsin as a basis for identification of GPCR agonists by dynamic homology modelling and virtual screening assays. FEBS Lett. 2011, 585, 3587–3592
- Pohl and Saparov 2000 Pohl, P.; Saparov, S. M. Solvent Drag across Gramicidin Channels Demonstrated by Microelectrodes. Biophys. J. 2000, 78, 2426–2434
- Sittel et al. 2017 Sittel, F.; Filk, T.; Stock, G. Principal component analysis on a torus: Theory and application to protein dynamics. J. Chem. Phys. 2017, 147, 244101
- Virtanen et al. 2020 Virtanen, P. et al. SciPy 1.0: Fundamental Algorithms for Scientific Computing in Python. Nat. Methods 2020, 17, 261–272
- Efron and Stein 1981 Efron, B.; Stein, C. The Jackknife Estimate of Variance. Ann. Stat. 1981, 9, 586–596
- Allen et al. 2006 Allen, T. W.; Andersen, O. S.; Roux, B. Ion permeation through a narrow channel: Using gramicidin to ascertain all-atom molecular dynamics potential of mean force methodology and biomolecular force fields. Biophys. J. 2006, 90, 3447–3468
- Post et al. 2019 Post, M.; Wolf, S.; Stock, G. Principal component analysis of nonequilibrium molecular dynamics simulations. J. Chem. Phys. 2019, 150, 204110
- Ernst et al. 2017 Ernst, M.; Wolf, S.; Stock, G. Identification and validation of reaction coordinates describing protein functional motion: Hierarchical dynamics of T4 Lysozyme. J. Chem. Theory Comput. 2017, 13, 5076 – 5088
- Sun et al. 2021 Sun, D.; He, S.; Bennett, W. F. D.; Bilodeau, C. L.; Andersen, O. S.; Lightstone, F. C.; Ingólfsson, H. I. Atomistic Characterization of Gramicidin Channel Formation. J. Chem. Theory Comput. 2021, 17, 7–12
- Jones et al. 2010 Jones, T. L.; Fu, R.; Nielson, F.; Cross, T. A.; Busath, D. D. Gramicidin channels are internally gated. Biophys. J. 2010, 98, 1486–1493
- Wolf et al. 2014 Wolf, S.; Freier, E.; Cui, Q.; Gerwert, K. Infrared spectral marker bands characterizing a transient water wire inside a hydrophobic membrane protein. J. Chem. Phys. 2014, 141, 22D524
- Wolf et al. 2014 Wolf, S.; Freier, E.; Gerwert, K. A Delocalized Proton-Binding Site within a Membrane Protein. Biophys. J. 2014, 107, 174–184
- Olah et al. 1991 Olah, G. A.; Huang, H. W.; Liu, W.; Wu, Y. Location of ion-binding sites in the gramicidin channel by X-ray diffraction. J. Mol. Biol. 1991, 218, 847–858
- Bruce et al. 2018 Bruce, N. J.; Ganotra, G. K.; Kokh, D. B.; Sadiq, S. K.; Wade, R. C. New approaches for computing ligand-receptor binding kinetics. Curr. Opin. Struct. Biol. 2018, 49, 1–10
- Nunes-Alves et al. 2020 Nunes-Alves, A.; Kokh, D. B.; Wade, R. C. Recent progress in molecular simulation methods for drug binding kinetics. Curr. Opin. Struct. Biol. 2020, 64, 126–133
- Schindler et al. 2020 Schindler, C. E. M. et al. Large-Scale Assessment of Binding Free Energy Calculations in Active Drug Discovery Projects. J. Chem. Inf. Model. 2020, 60, 5457–5474
- Jensen et al. 2013 Jensen, M. Ø.; Jogini, V.; Eastwood, M. P.; Shaw, D. E. Atomic-level simulation of current-voltage relationships in single-file ion channels. J. Gen. Physiol. 2013, 141, 619–632
- Furini and Domene 2020 Furini, S.; Domene, C. Critical Assessment of Common Force Fields for Molecular Dynamics Simulations of Potassium Channels. J. Chem. Theory Comput. 2020, 16, 7148–7159
- Capelli et al. 2020 Capelli, R.; Lyu, W.; Bolnykh, V.; Meloni, S.; Olsen, J. M. H.; Rothlisberger, U.; Parrinello, M.; Carloni, P. Accuracy of Molecular Simulation-Based Predictions of koffValues: A Metadynamics Study. J. Phys. Chem. Lett. 2020, 6373–6381