Modified Gravity and the Flux-weighted Gravity-Luminosity Relationship of Blue Supergiant Stars
Abstract
We calculate models of stellar evolution for very massive stars and include the effects of modified gravity to investigate the influence on the physical properties of blue supergiant stars and their use as extragalactic distance indicators. With shielding and fifth force parameters in a similar range as in previous studies of Cepheid and tip of the red giant branch (TRGB) stars we find clear effects on stellar luminosity and flux-weighted gravity. The relationship between flux weighted gravity, g/, and bolometric magnitude (FGLR), which has been used successfully for accurate distance determinations, is systematically affected. While the stellar evolution FGLRs show a systematic offset from the observed relation, we can use the differential shifts between models with Newtonian and modified gravity to estimate the influence on FGLR distance determinations. Modified gravity leads to a distance increase of 0.05 to 0.15 magnitudes in distance modulus. These change are comparable to the ones found for Cepheid stars. We compare observed FGLR and TRGB distances of nine galaxies to constrain the free parameters of modified gravity. Not accounting for systematic differences between TRGB and FGLR distances shielding parameters of 510-7 and 10-6 and fifth force parameters of 1/3 and 1 can be ruled out with about 90% confidence. Allowing for potential systematic offsets between TRGB and FGLR distances no determination is possible for a shielding parameter of 10-6. For 510-7 a fifth force parameter of 1 can be ruled out to 92% but 1/3 is unlikely only to 60%.
1 Introduction
The discovery of dark matter and of the accelerated expansion of the universe has triggered a substantial amount of approaches to explain these revolutionary astronomical discoveries by a modification of general relativity. These approaches introduce a new scalar degree of freedom in scalar-tensor theories coupling to ordinary matter and lead to a fifth force which changes gravitational attraction. Most promising are concepts which include a screening mechanism where the new force is suppressed in deep potential wells or regions of high density but influences gravity outside these regions. A prominent example of this class of models are the ones discussed by Khoury & Weltman (2004) and Brax et al. (2004), where a non-linear screening of a scalar field, a so called chameleon field, can suppress modifications of gravity on galactic scales. For an introduction and overview we refer to Chang & Hui (2011); Davis et al. (2012); Jain et al. (2013); Desmond et al. (2019); Sakstein (2020). In the case of massive galaxies or of dwarf galaxies in the neighborhood of massive galaxies the potential wells will shield the stars against the fifth force (see Cabré et al. 2012 for a detailed description), but for isolated smaller galaxies modified gravity may affect the internal structure of stars through a modification of the equation of hydrostatic equilibrium resulting in changes of observational stellar properties such as luminosity, temperature, radius and pulsation periods. Most promising are evolved stars, giants or supergiants, because their envelopes may be unscreened against the fifth force due to their large radii and the resulting lower gravitational potential.
Jain et al. (2013) systematically investigated two types of evolved stars, low mass stars at the tip of the red giant branch (TRGB) and massive Cepheid stars of 5 to 10 in the stellar instability strip. They found that both the luminosity of TRGB stars and the period-luminosity relationship of Cepheids are affected. As a result, extragalactic distances obtained from these objects are altered, most interestingly in opposite direction, as TRGB distances decrease due to a decreased luminosity (see also Desmond & Sakstein 2020), whereas Cepheid distances increase because of the decrease of pulsation period. Comparing with observed galaxy distances Jain et al. (2013) obtained constraints on the potential scalar background field.
Blue supergiant stars provide an important alternative to Cepheids as distance indicators through their relationship between flux-weighted gravity and luminosity (Kudritzki et al. 2003, 2008; Urbaneja et al. 2017). They have higher masses than Cepheids and are significantly more luminous with substantially larger radii. The gravitational potential of their envelopes is comparable to the one of Cepheids and, consequently, effects of modified gravity may be equally important. We have therefore carried out stellar evolution calculations for massive stars in the range from 12 to 60 to investigate how modified gravity influences the observable stellar properties and whether it introduces detectable systematic changes to the flux-weighted gravity - luminosity relationship (FGLR).
2 Flux-weighted Gravity- Luminosity Relationship (FGLR)
Blue supergiant stars (BSG) are massive stars in the temperature range 7900K 25000K (see Urbaneja et al. 2017). Their tight observational relationship between absolute stellar magnitude and flux weighted gravity , = - 4log(/104K), has been discovered by Kudritzki et al. (2003). It is a simple consequence of the well known power law relationship between stellar luminosity and mass and the fact the massive stars evolve from their hydrogen burning main sequence to the red supergiant phase at almost constant luminosity. With absolute visual magnitudes up to -10 mag BSG are beacons in the universe and much brighter than other stellar distance indicators such as Cepheids or TRGB stars. This allows for spectroscopic studies out to distances of 10 Mpc with present day telescopes and a factor four further out with the next generation of 30m to 40m ground based telescopes. In consequence, the FGLR has a great potential for extragalactic distance determinations. Kudritzki et al. (2008) studying a large sample of BSG in the sculptor galaxy NGC 300 have provided a first calibration of the FGLR and subsequently distances to eight galaxies have been determined: WLM – Urbaneja et al. (2008); M33 – U et al. (2009); M81 – Kudritzki et al. (2012); NGC3109 – Hosek et al. (2014); NGC3621 – Kudritzki et al. (2014); M83 – Bresolin et al. (2016); NGC55 – Kudritzki et al. (2016); IC1613 – Berger et al. (2018). We note that these galaxies cover a wide range of stellar metallicities from about 1/10 solar to twice solar but no significant metallicity dependence of the FGLR has been found. These observational findings are in agreement with stellar evolution calculations which also show that the effects of metallicity on the FGLR are small (Meynet et al. 2015).
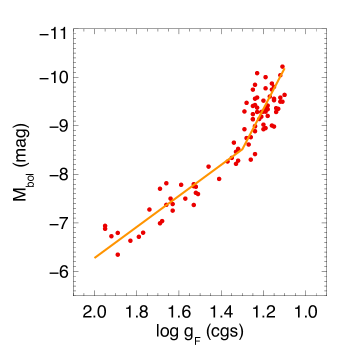
The most recent calibration of the FGLR is given by the work of Urbaneja et al. (2017). They carried out a detailed quantitative spectroscopic NLTE analysis of 90 BSG in the LMC and determined stellar effective temperatures, gravities and element abundances. Figure 1 shows the FGLR resulting from their work. The 2-component regression fit to the data provides the new calibration, which is given by
| (1) |
if , and
| (2) |
if , with
| (3) |
where = 1.30 dex, = 3.20 0.08, = –7.878 0.02 mag, and = 8.34 0.25.
We note that our Figure 1 and the value of b in eqn. (1) are slightly different from the original results obtained by Urbaneja et al. (2017), since we now use the 1 percent precision distance to the LMC determined by Pietrzyński et al. (2019) from the light curve and radial velocity analysis of 20 late type eclipsing binaries and an improved stellar surface brightness-color relationship.
3 Modified Gravity and Massive Star Evolution
The effects of modified gravity on stellar structure depend on two free parameters, the self-screening parameter and the fifth force parameter (see Jain et al. 2013). describes how efficient a star is screening itself against the fifth force. It is used to determine the screening radius rs inside the star through the condition
| (4) |
where r is the radial coordinate inside the star, R the stellar radius, G0 the Newtonian gravitational constant and c the speed of light. Inside the screening radius the fifth force is screened and only Newtonian gravity with G0 is acting. is the density profile of the star. Exterior to rs the fifth force contributes and leads to a radius dependent gravitation via
| (5) |
sets the maximum contribution of the fifth force. M(r) and M(rs) correspond to the stellar mass enclosed inside the radius r and the screening radius rs, respectively.
For the physics of stellar structure and evolution the implementation of modified gravity through eqns. (4) and (5) is straightforward through a replacement of G0 by G(r) in the equation of hydrostatic equilibrium as demonstrated in the work by Chang & Hui (2011); Davis et al. (2012); Jain et al. (2013). For main sequence stars, analytical estimates of the main effects can easily be obtained. For instance, using the well know mass-luminosity relation (see eq. 6 below) it is straightforward to show that stellar luminosity increases as a consequence of the rise from G0 to G(r). For advanced stages of stellar evolution such as Cepheids and red giants stars numerical models are needed in conjunction with analytical considerations.
The case of massive BSG is more complex, because their evolution is complicated by the effects of strong stellar winds and rapid rotation. Thus, to investigate the influence of modified gravity requires the detailed use of numerical models. For our study we have used the MESA stellar evolution code version 12115 (Paxton et al. 2011, 2013, 2015, 2018, 2019). One of the many advantages of MESA is that it provides a simple way to override most of physical routines without modifying more than one file. Since MESA already has a variable that holds the value of the gravitational constant for each radial cell in the star, the implication of modified gravity for a given pair of values and is simple. All it requires is a numerical determination of the screening radius rs and then the values of G0 are replaced by G(r) outside the screening radius in all equations, which contain G. This approach has already been used by Chang & Hui (2011); Davis et al. (2012); Jain et al. (2013).
For our numerical calculations of BSG evolution using MESA we adopt Z = 0.0067 for the metallicity mass fraction corresponding to the average metallicity of the 90 BSG in the LMC determined by Urbaneja et al. (2017). For the effects of mass-loss we apply the MESA module, which uses the results obtained by Vink et al. (1999, 2000, 2001) based on the theory of radiation driven winds (see Kudritzki & Puls 2000). For internal stellar layers with convection a mixing length parameter = 1.6 and step function overshooting with an overshooting parameter = 0.1 are used. Our models include stellar rotation with initial rotational velocities on the zero-age-main-sequence as in Ekström et al. (2012) and they also account for rotationally enhanced mass-loss. Eddington-Sweet circulation (with Eddington Sweet factor 0.5) instability, Goldreich-Schubert-Fricke instability, Solberg-Hoiland instability and secular shear instability (Heger et al. 2000) induced by rotation and resulting in mixing are also included.
For our investigation we calculate a grid of evolutionary models with initial masses of 12, 13, 15, 18, 20, 23, 25, 29, 32, 37, 40, 43, 45, 50, 60 , respectively. To check our adaption of the MESA code we also compare in detail with the comprehensive sets of the Newtonian state-of-the-art stellar evolution models by Ekström et al. (2012) and Georgy et al. (2013). For this comparison we adjust our metallity to their values (Milky Way and Small Magellanic Cloud metallicities, respectively). We find good agreement over the whole mass range.
For the selection of the modified gravity parameters and we use the work by Jain et al. (2013) as guideline. Jain et al. (2013) discussed self-shielding parameters in a range from 10-7 to 10-6 and fifth force parameters in a range from 0.2 to 1 with special emphasis on models with = 1/3 and 1. Comparing observed galaxy distances determined from Cepheid and TRGB stars they concluded that for = 1/3 values of 510-7 can be ruled out with 95% confidence. For = 1 values of 110-7 can be ruled out with similar evidence. Following this discussion we select = 510-7 and 10-6 and = 1/3 and 1, respectively, and compare with models which do not include modified gravity. We note that corresponds to models with non-linear terms in gravity sector of the Lagrangian, i.e. so called theories, as for example explored as inflationary scenario by Starobinsky (1980) or in the context of dark energy by Hu & Sawicki (2007) or additional spatial dimensions (Dvali et al. 2000), albeit the screening mechanism in the latter is the Vainshtein mechanism (Vainshtein 1972). We should additionally note that a recent analysis by Desmond & Ferreira (2020), who investigated the constraints on modified gravity from a statistical study of galaxy morphology, seems to rule out Hu-Sawacki f(R) gravity.
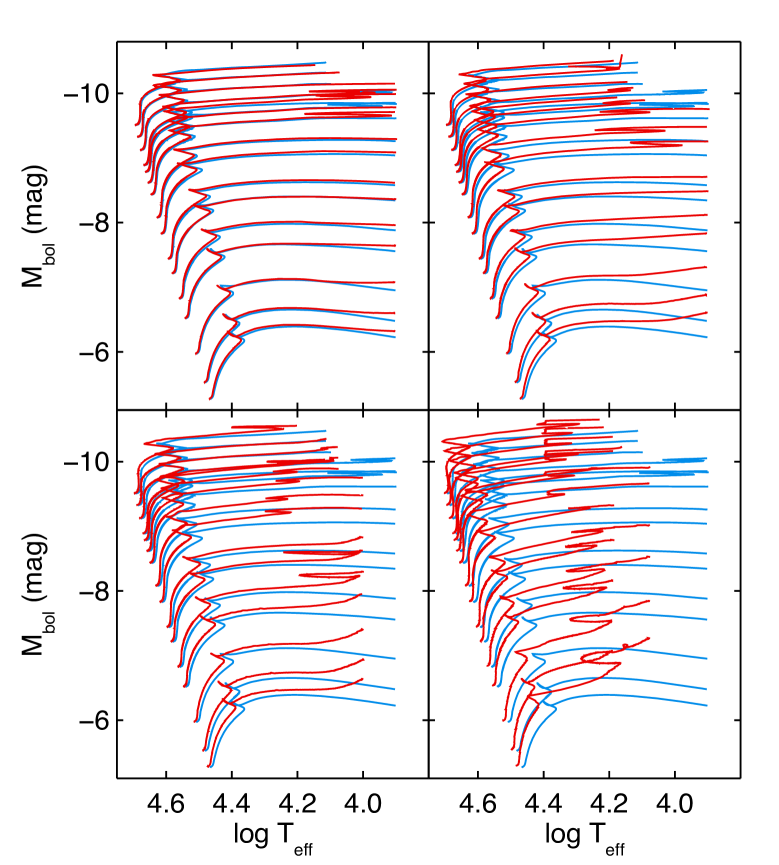
Figure 2 shows the classical Hertzsprung-Russell diagram (HRD) of the evolutionary tracks for both cases, Newtonian and modified gravity. As we can see, modified gravity increases the luminosity of massive stars. The effect increases with screening parameter and fifth force parameter . This effect is a simple consequence of the change from G0 to G(r) as described by equation (5).
As is well known (see, for instance, Kippenhahn et al. 2012 or Davis et al. 2012), a simple estimate of the relationship between stellar luminosity and stellar mass for stars on the main sequence yields
| (6) |
We note that in our range of stellar masses the exponent of M is slightly smaller, 2.5 instead of 3, because of the influence of radiation pressure which increases with increasing stellar mass. We also note from Figure 2 that BSG follow a similar relationship except that the luminosities are about a factor of ten larger than on the main sequence. Therefore, if the screening radius is located deep inside the massive stars, they should experience the increase from G0 to G(r) and become more luminous. In the following we discuss this more quantitatively. We introduce an analytical fit of the density stratification inside massive stars during their evolution and and use this to derive an approximation for the location of the screening radius as a function of stellar parameters.
The density distribution of a massive star on the main sequence is reasonably well approximated by adopting constant density inside the stellar core rc and an exponential decline with scale height H outside the stellar core:
| (7) |
| (8) |
and
| (9) |
with
| (10) |
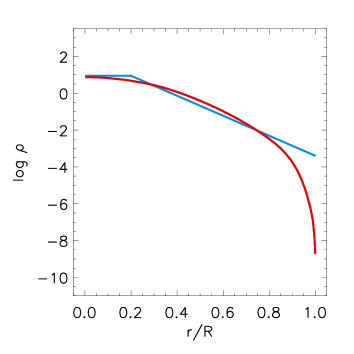
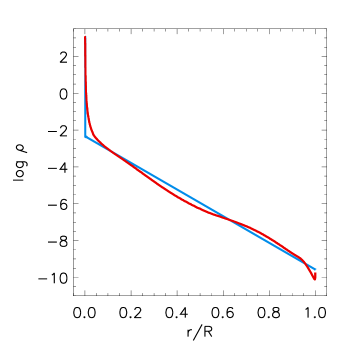
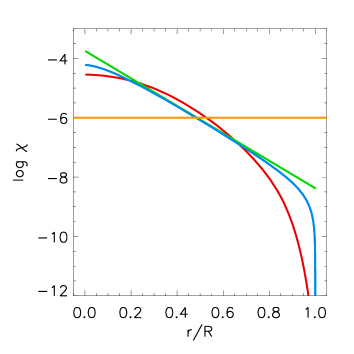
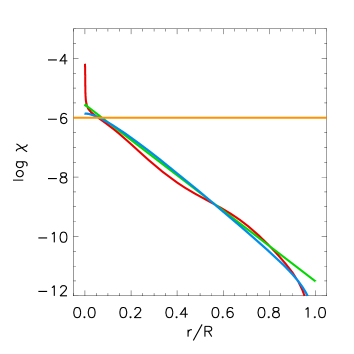
Figure 3 displays an example for the density distribution fit of a 15 star at the zero-age-mains-sequence (ZAMS). While the fit is not perfect, in particular above r/R 0.9, it is good enough for the discussion of the effects of modified gravity, as we will explain below. We use = 0.08 and = 2.5 for the main sequence density fits.
During the evolution away from the main sequence into the BSG phase the density distribution changes dramatically. The stellar core contracts and the outer layers expand. As a result, the density increases strongly in a small central volume, while it decreases for the rest of the star. Figure 3 shows the example of 15 star at the end of BSG phase at = 7900K. A simple analytical fit is
| (11) |
| (12) |
and
| (13) |
with
| (14) |
We apply = 0.06 as the best fit to describe the exponential decline outside the stellar core. For the mass Mc confined in the contracted central core we use the core mass of the ZAMS phase defined as
| (15) |
where Rms is the stellar radius on the ZAMS. With R the actual stellar radius in the BSG phase we then adopt
| (16) |
which means that the core radius rc in the BSG phase is one fifth of the core radius on the ZAMS taking into account the contraction of the stellar core. This leads to the simple relationship between the central densities of the ZAMS and BSG phases
| (17) |
The analytical fit obtained in this way is not excellent but to zero order captures the development of the density distribution during the evolution to the BSG phase well.
The analytical approximations of the density stratification inside the massive stars can now be used to calculate the screening radius using eqn. (4). We obtain
| (18) |
with
| (19) |
.
The density corresponds to e for the ZAMS and to in the BSG phase, respectively. For R and we select the corresponding ZAMS and BSG values.
In order to asses at which radius the interior of the the star is screened we study when the modified potential
| (20) |
drops below the chameleon threshold for screening . Figure 4 shows the function of eqn. (20) versus r/R for the two examples of Figure 3 and compares with the analytical approximation. We see that for radii r/R 0.8 the failure of the analytical density approximation in the main sequence case (left part of Figure 3) has only a small influence on the analytical approximation of (r). The reason is that the density in the outer stellar layers is small and, therefore, its contribution to the radial integral is of minor importance.
It is obvious from Figure 4 that even on the ZAMS a large fraction of the star would be unscreened against the effects of modified gravity if were as large as 10-6. The effect becomes even more dramatic at the end of the BSG phase where all stellar layers except the very core are unscreened. This is the result of the core-halo density distribution inside BSGs as displayed in Figure 3 and described eqn. (11) and (12). We note that for = 510-7 the horizontal orange line in Figure 4 would be 0.3 dex lower and the screening radii slightly larger.
In order to derive a simple analytical approximation for the screening radius we replace of eqn. (19) by
| (21) |
with u = 2.7 and w = 3.0 for ZAMS stars and u = 2.8 and w = 2.0 for BSG stars. As can be seen from Figure 4 using instead of in eqn. (18) approximates the function equally well. Using from eqn. (18) we can then approximate the screening radius by
| (22) |
with
| (23) |
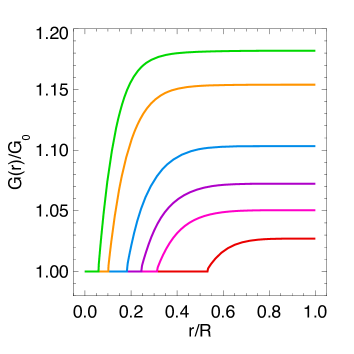
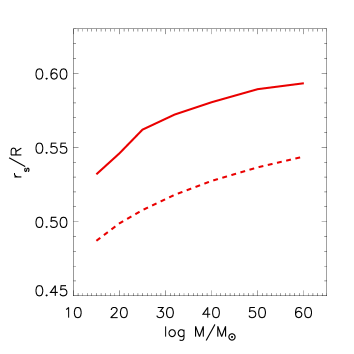
Figure 5 shows the ZAMS screening radii rs obtained directly from numerical integral of eqn. (4) (corresponding to the red curve in Figure 3) for different stellar masses compared with the approximation of eqn. (21). While there is a 9% systematic offset, the approximation describes the trend with stellar mass very well. The screening radius moves further out when stellar mass increases. This is the result of and the radius mass relationship of R M0.57 on the ZAMS. This leads to M0.43 resulting in a larger value of rs/R, when the ZAMS mass becomes larger.
For BSG stars the ratio of is much smaller, because the stars have expanded significantly, and consequently the screening radii become as small as rs/R = 0.06 at the end of the BSG phase as indicated by Figure 4 for the example of 15. For evolutionary tracks with larger initial ZAMS masses rs/R can reach values as small as 0.02.
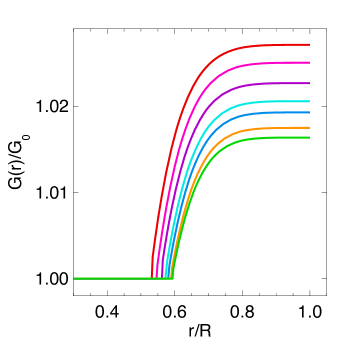
The location of the screening radius determines how strong the modification of the gravitational force is in the unscreened region inside the star through the ratio of M(rs)/M(r) in eqn. (5). Figure 6 shows the stratification of G(r)/G0 for selected ZAMS models of different mass. We see that the effects of modified gravity increase with decreasing stellar mass, because the screening radius moves inward according to Figure 5 and eqn. (21) and, therefore, encircles a smaller mass M(rs) relative to the total mass. In the same way modified gravity becomes more important in the evolution of a massive star from the ZAMS to the BSG phase, because the screening radius moves inward during the course of evolution. This is shown in Figure 7 for the example of 15 .
The saturation of G(r)/G0 towards increasing radii r/R is a consequence of the low density in the outer stellar layers. This means that the incremental increase of the mass M(r) confined within radius r is very small when moving outward and is very close to the total stellar mass. With eq. (5) this leads to the saturation of G(r)/G0.
Stellar luminosity is affected by the modifications of gravity following eqn. (6). An increase of G(r) also enhances the luminosity and the effect becomes stronger when a larger fraction of the star is unscreened. This explains the qualitative behaviour in Figure 2. On the main sequence changes in luminosity are larger at lower masses than at higher masses. They are very small for = 5 and = 1/3 but increase with and , because the screening radius moves inward and G(r) increases. In the BSG phase the increases in luminosity follow the same trend but are significantly larger since a much smaller fraction of the star is unscreened. At = 10-6 and also with = 1 the effects become extreme and lead to a significant increase of the outer stellar envelopes, in particular, at lower masses. These dramatic changes of the outer stellar structure require extremely small time steps in the numerical calculation of the evolution to accomplish a converged solution. This is the reason why we have stopped the calculations at somewhat higher temperatures at values between 10000K to 15000K.
4 Modified gravity and flux-weighted gravity
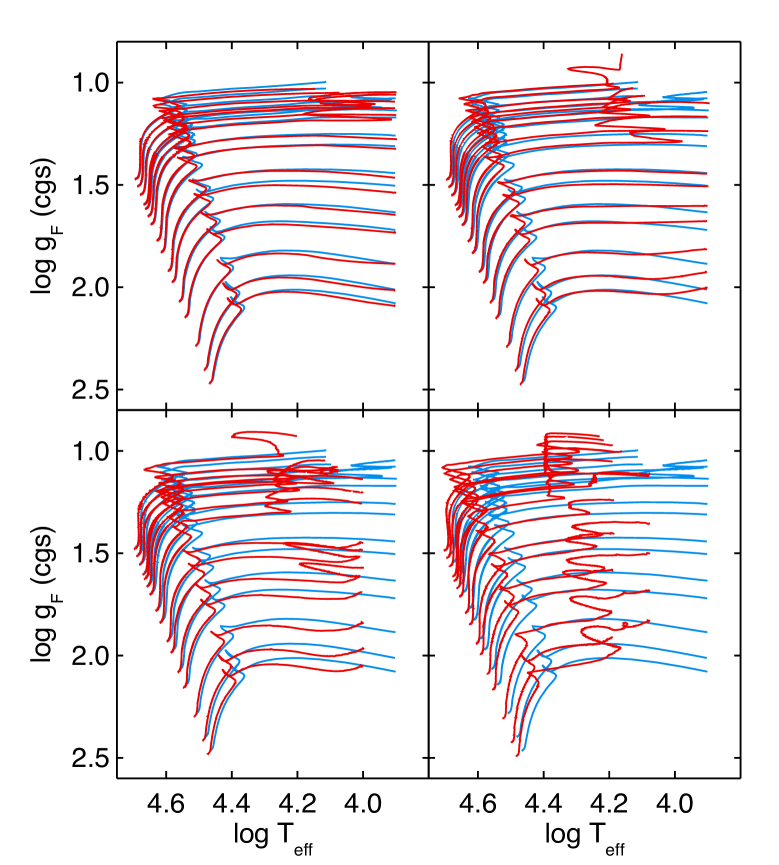
Figure 8 displays the spectroscopic Hertzsprung-Russell diagram (sHRD) as introduced by Langer & Kudritzki (2014), where flux-weighted gravity is plotted versus effective temperature. Again we compare stellar evolution models calculated with Newtonian and modified gravity. The evolutionary tracks of the Newtonian models demonstrate why flux-weighted gravity is a promising distance indicator. It stays roughly constant in the BSG evolutionary phase (where stars become very bright at visual wavelength because of the dependence of bolometric correction on ) but at the same time it correlates strongly with luminosity.
The influence of modified gravity is two-fold. Since GM/L, an increase of G(r) through modified gravity increases , whereas the simultaneous increase in luminosity may lead to a decrease of . For = 5 10-7 and the influence of G(r) is dominant, in particular for BSG at lower masses. This is still true, when is increased to 1, at least at lower masses. For = 10-6 the changes in luminosity start to dominate and decreases relative to BSG models with Newtonian gravity. Generally, the effects of modified gravity are small at = 5 10-7 and but become much more pronounced when and increase for the physical reasons already discussed in the previous section.
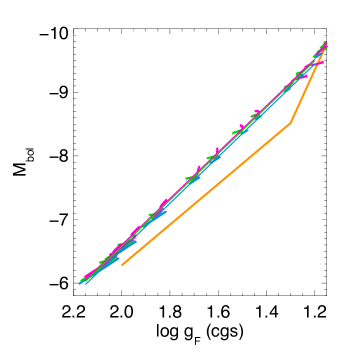
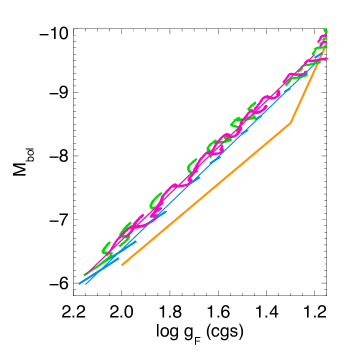
The effects of modified gravity encountered in Figure 8 must also be visible in the FGLR of the stellar evolution models. In Figure 9 we have transformed the evolutionary tracks of Figure 8 into diagrams, which displays bolometric magnitude against flux-weighted gravity. We also compare with the observations by Urbaneja et al. (2017) already shown in Figure 1. Because of the comparison with BSG observations we restrict the plot of the tracks to the range of BSG.
Before we discuss the influence of modified gravity we need to comment on the comparison of the Newtonian tracks with the observations. At 1.3 we note an offset in . This offset was already noticed in the work by Meynet et al. (2015) (see their figures 3, 6, and 7), who compared stellar evolution models with observations based on the old FGLR calibration by Kudritzki et al. (2008). Farrell et al. (2019) compared with the same set of observations but used models which included the effects of binary star evolution. They found a similar offset (see their figures 2 and 3). At this point it is unclear what the physical reason for the offset is. There are many reasons which could affect the evolution of massive stars into the BSG phase such as changes in mass-loss or rotational properties (see Meynet et al. 2015) or changes in the internal angular momentum transport and rotational mixing (see Taormina et al. 2020). At the same time there is also the possibility that the spectroscopic measurement of BSG flux-weighted gravities are subject to systematic uncertainties. We note that a systematic shift of 0.1 dex in at higher gravities of the observational data would resolve the problem. Such a shift is, of course, possible. For 1.3 there is a strong disagreement between between the observed and stellar evolution FGLR slopes. So far, no explanation for this discrepancy has been found. We note, however, that this steep part of the FGLR is of little influence for extragalactic FGLR distance determinations, since most of the extragalactic BSG found are in the range of the higher gravity part.
For a simple straightforward estimate of the potential influence of modified gravity on BSG distances determinations using the FGLR we ignore the discrepancy between observed and model FGLRs and concentrate on the discussion of the systematic differential effects on evolutionary tracks with modified gravity relative to the Newtonian tracks.
The differential effects for = 1/3 in Figure 9 are small. We fit a straight FGLR curve to the evolutionary tracks assuming = a(-1.5)+b with constant a=3.65 but different b for the three different sets of evolution models. We restrict the fit to the range 2.2 1.2. The difference b between modified gravity and the Newtonian models is -0.05 mag and -0.075 mag for = 1/3 and = 510-7 and 10-6, respectively. These differences are comparable to the distances modulus uncertainties obtained from a typical FGLR distance determination. But since the effects are systematic, they may become important, when larger samples of galaxies are used, for instance, to calibrate second order distance indicators. For = 1 the differences are even larger and amount to -0.15 mag for both values of . An effect of this size would certainly be important for extragalactic distance determinations. As a consequence, FGLR distances would become larger with increased influence of modified gravity. The changes in distance are comparable to the ones found by Jain et al. (2013) for Cepheid stars.
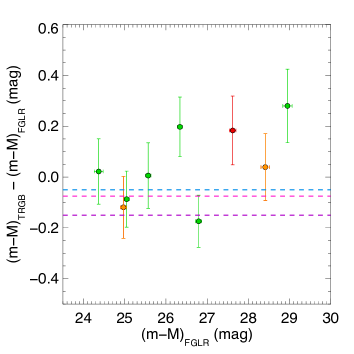
So far, spectroscopic studies of BSG with FGLR measurements have been carried out for nine galaxies (see introduction and Table 1). While this is a relatively small sample, it provides a first opportunity to investigate potential effects of a fifth force on this new stellar distance indicator. As shown by Jain et al. (2013) the fact that TRGB distances are not affected by modified gravity in the range of and considered here can be used to observationally constrain these parameters. For this purpose it is important to distinguish between galaxies shielded or unscreened against modified gravity. As we already mentioned in the introduction the stars in many galaxies are shielded against modified gravity because of the galaxy gravitational potential or the superimposed potential of neighboring galaxies. However, isolated smaller galaxies are unscreened and here stars would be fully influenced by the fifth force of modified gravity. In those galaxies the FGLR shifts caused by modified gravity would change the distance determinations while TRGB distances would remain unchanged.
| name | (m-M)FGLR | (m-M)TRGB |
|---|---|---|
| mag | mag | |
| NGC3621 | 28.95 | 29.230.09 |
| M83 | 28.41 | 28.450.08 |
| M81 | 27.62 | 27.800.11 |
| NGC55 | 26.79 | 26.620.07 |
| NGC300 | 26.34 | 26.540.10 |
| NGC3109 | 25.57 | 25.580.11 |
| WLM | 25.05 | 24.960.09 |
| M33 | 24.97 | 24.850.10 |
| IC1613 | 24.37 | 24.390.07 |
The conditions for screening have been investigated by Cabré et al. (2012) and Jain et al. (2013). Stars inside a galaxy are shielded against the fifth force, when the absolute value of the galaxy potential is larger than . This is the case of internal screening. As shown by Jain et al. (2013) the observed maximal rotational velocity vm can be used to estimate the potential. This leads to the condition 210-7(vm/200 kms-1)2 for internal screening. The condition for external screening can be approximated by the addition of the point source potentials of all neighbor galaxies within a radius + ri through . Mi, ri and di are the dynamical masses, virial radii and distances of the neighbor galaxies. is the Compton length of the fifth force and related to the screening parameter via = 3200 Mpc. For the calculation of galaxy screening in the nearby universe Cabré et al. (2012) provide two galaxy catalogues on their website based on the work by Karachentsev et al. (2004) and Lavaux & Hudson (2011), which we have utilized. (We have updated some of the values of vm and Mi taking into account more recent work).
Applying the screening conditions as outlined we find that three galaxies of our sample (M81, M83, and M33) are screened against a fifth force characterized by = 510-7. The remaining galaxies (NGC3621, NGC300, NGC 55, NGC 3109, IC 1613, WLM) are unscreened. For = 10-6 M33 and M83 become unscreened as well.
We have used the FGLR calibration of eqn. (1) and (2) to re-determine distances to the eight galaxies mentioned in the introduction. We also determined an FGLR distance to NGC 300 using the spectroscopic results by Kudritzki et al. (2008). All nine galaxies also have accurate TRGB distances determined consistently in a homogeneous way and published in the EDD database (http://edd.ifa.hawaii.edu, see Tully et al. 2009). A subset of four galaxies (M81, NGC55, NGC300, NGC3109) has also TRGB distances determined by the ANGST project (Dalcanton et al. 2009). For those we use the mean between EDD and ANGST. The FGLR and TRGB distance moduli for the nine galaxies are given in Table 1.
Figure 10 displays the differences = (m-M)TRGB - (m-M)FGLR between TRGB and FGLR distance moduli for the shielded and unscreened galaxies in the sample. The mean value for all nine galaxies is = 0.0390.052 mag, whereas for = 510-7 the mean for the unscreened galaxies is = 0.0410.070 mag and = 0.0350.087 mag for the shielded sample. For = 10-6 we obtain = 0.0210.055 mag for the unscreened sample and = 0.1830.135 for the one remaining shielded galaxy M81.
According to the differential effects of our fits to the stellar evolution FGLRs of Figure 9 we would expect = -0.05 mag and -0.75 mag for = 1/3 and = 510-7 and 10-6, respectively, and -0.15 mag for = 1. However, the values obtained for the unscreened samples are positive and the differences are larger than 2.7 standard deviations for = 1. Formally, adopting a Gaussian distribution for the probability of = 1 being consistent with our measurement is smaller than 4%. The probabilities for = 1/3 and = 510-7 and 10-6 are 11% and 5% , respectively.
We note that by calculating probabilities in this way we make the assumption that the distance moduli obtained by the TRGB and FGLR method, respectively, are not affected by systematic effects based on their calibrations. If, for instance, would have a systematic positive offset caused by calibration systematics, this would compensate for the negative shifts induced by modified gravity in the case of unscreened galaxies. Of course, by including the screened samples in our consideration we can study the differential effects between screened and unscreened galaxies. Unfortunately, the number of screened galaxies is small and the means are more uncertain. For = 510-7 we obtain for = - = 0.0060.111 mag. The value is still positive albeit with a large error. This means that in this statistically more uncertain differential consideration = 1/3 cannot be ruled out at this value. On the other hand, = 1 can be ruled out to 92%. For = 10-6 a meaningful differential determination is not possible, because only the value for one galaxy is available for the screened sample.
Very obviously, increasing the number of shielded and unscreened galaxies with measured FGLR distances would make the result more significant. At this point, our results support the conclusions found by Jain et al. (2013) as described in section 3.
5 Summary and conclusions
We have constructed stellar evolution models for massive stars in the range from 12 to 60 accounting for the influence of modified gravity in the equation of hydrostatic equilibrium. We find an increase of stellar luminosity already on the main sequence and the effect becomes stronger in the BSG phase. The reason is the change in internal density stratification. BSG with their contracted core and strongly expanded envelope have a core-halo density structure, which leaves a large fraction of the stellar volume unscreened against a potential fifth force. In consequence, clear effects of modified gravity are encountered for the evolutionary tracks in the HRD and sHRD.
Using the evolutionary tracks in the BSG phase we can construct a theoretical FGLR diagram, where we display against . The comparison with observations in the LMC reveals an offset between the observed and theoretical FGLRs which was already noted in previous work and which may be caused by deficiencies of the spectral diagnostics leading to the observed FGLR or uncertainties of the stellar evolution treatment leading to BSG. However, the differential effects between the stellar evolution calculations with Newtonian gravity and modified gravity still allow for an estimate of the influence of modified gravity on FGLR distance determinations. Distance moduli would become 0.15 mag larger for a fifth force parameter = 1 and shielding parameters = 510-7 and 10-6. We use a comparison between observed TRGB distances, which should be unaffected by modified gravity, and FGLR distances in galaxies shielded and unscreened against the fifth force to constrain . If we assume that there is no systematic offset between TRGB and FGLR distances, then we find that = 1 can be ruled out with 96% confidence. For = 1/3 modified gravity distance moduli would increase by 0.05 mag and 0.075 mag for = 510-7 and 10-6, respectively. The constraints on modified gravity are slightly weaker in this case. = 510-7 is unlikely by 89% and = 10-6 by 95%. If we allow for a potential systematic offset between TRGB and FGLR distances, then the constraining results are more uncertain. For = 510-7 = 1 can still be ruled out to 92% but = 1/3 is unlikely only to 60%. For = 10-6 no constraints are possible, because the sample of shielded galaxies is too small. In summary, the results are comparable with the ones obtained by Jain et al. (2013) from a study of Cepheid stars, where for = 1/3 values of 510-7 were be ruled out with 95% confidence and for = 1 values of 110-7 with similar evidence.
References
- Berger et al. (2018) Berger, T. A., Kudritzki, R.-P., Urbaneja, M. A., et al. 2018, ApJ, 860, 130, doi: 10.3847/1538-4357/aac493
- Brax et al. (2004) Brax, P., van de Bruck, C., Davis, A.-C., Khoury, J., & Weltman, A. 2004, Phys. Rev. D, 70, 123518, doi: 10.1103/PhysRevD.70.123518
- Bresolin et al. (2016) Bresolin, F., Kudritzki, R.-P., Urbaneja, M. A., et al. 2016, ApJ, 830, 64, doi: 10.3847/0004-637X/830/2/64
- Cabré et al. (2012) Cabré, A., Vikram, V., Zhao, G.-B., Jain, B., & Koyama, K. 2012, J. Cosmology Astropart. Phys, 2012, 034, doi: 10.1088/1475-7516/2012/07/034
- Chang & Hui (2011) Chang, P., & Hui, L. 2011, ApJ, 732, 25, doi: 10.1088/0004-637X/732/1/25
- Dalcanton et al. (2009) Dalcanton, J. J., Williams, B. F., Seth, A. C., et al. 2009, ApJS, 183, 67, doi: 10.1088/0067-0049/183/1/67
- Davis et al. (2012) Davis, A.-C., Lim, E. A., Sakstein, J., & Shaw, D. J. 2012, Phys. Rev. D, 85, 123006, doi: 10.1103/PhysRevD.85.123006
- Desmond & Ferreira (2020) Desmond, H., & Ferreira, P. G. 2020, Phys. Rev. D, 102, 104060, doi: 10.1103/PhysRevD.102.104060
- Desmond et al. (2019) Desmond, H., Jain, B., & Sakstein, J. 2019, Phys. Rev. D, 100, 043537, doi: 10.1103/PhysRevD.100.043537
- Desmond & Sakstein (2020) Desmond, H., & Sakstein, J. 2020, Phys. Rev. D, 102, 023007, doi: 10.1103/PhysRevD.102.023007
- Dvali et al. (2000) Dvali, G., Gabadadze, G., & Porrati, M. 2000, Physics Letters B, 485, 208, doi: 10.1016/S0370-2693(00)00669-9
- Ekström et al. (2012) Ekström, S., Georgy, C., Eggenberger, P., et al. 2012, A&A, 537, A146, doi: 10.1051/0004-6361/201117751
- Farrell et al. (2019) Farrell, E. J., Groh, J. H., Meynet, G., et al. 2019, A&A, 621, A22, doi: 10.1051/0004-6361/201833657
- Georgy et al. (2013) Georgy, C., Ekström, S., Eggenberger, P., et al. 2013, A&A, 558, A103, doi: 10.1051/0004-6361/201322178
- Heger et al. (2000) Heger, A., Langer, N., & Woosley, S. E. 2000, ApJ, 528, 368, doi: 10.1086/308158
- Hosek et al. (2014) Hosek, Jr., M. W., Kudritzki, R.-P., Bresolin, F., et al. 2014, ApJ, 785, 151, doi: 10.1088/0004-637X/785/2/151
- Hu & Sawicki (2007) Hu, W., & Sawicki, I. 2007, Phys. Rev. D, 76, 064004, doi: 10.1103/PhysRevD.76.064004
- Jain et al. (2013) Jain, B., Vikram, V., & Sakstein, J. 2013, ApJ, 779, 39, doi: 10.1088/0004-637X/779/1/39
- Karachentsev et al. (2004) Karachentsev, I. D., Karachentseva, V. E., Huchtmeier, W. K., & Makarov, D. I. 2004, AJ, 127, 2031, doi: 10.1086/382905
- Khoury & Weltman (2004) Khoury, J., & Weltman, A. 2004, Phys. Rev. D, 69, 044026, doi: 10.1103/PhysRevD.69.044026
- Kippenhahn et al. (2012) Kippenhahn, R., Weigert, A., & Weiss, A. 2012, Stellar Structure and Evolution, doi: 10.1007/978-3-642-30304-3
- Kudritzki et al. (2003) Kudritzki, R. P., Bresolin, F., & Przybilla, N. 2003, ApJ, 582, L83, doi: 10.1086/367690
- Kudritzki et al. (2016) Kudritzki, R. P., Castro, N., Urbaneja, M. A., et al. 2016, ApJ, 829, 70, doi: 10.3847/0004-637X/829/2/70
- Kudritzki & Puls (2000) Kudritzki, R.-P., & Puls, J. 2000, ARA&A, 38, 613, doi: 10.1146/annurev.astro.38.1.613
- Kudritzki et al. (2014) Kudritzki, R.-P., Urbaneja, M. A., Bresolin, F., Hosek, Jr., M. W., & Przybilla, N. 2014, ApJ, 788, 56, doi: 10.1088/0004-637X/788/1/56
- Kudritzki et al. (2008) Kudritzki, R.-P., Urbaneja, M. A., Bresolin, F., et al. 2008, ApJ, 681, 269, doi: 10.1086/588647
- Kudritzki et al. (2012) Kudritzki, R.-P., Urbaneja, M. A., Gazak, Z., et al. 2012, ApJ, 747, 15, doi: 10.1088/0004-637X/747/1/15
- Langer & Kudritzki (2014) Langer, N., & Kudritzki, R. P. 2014, A&A, 564, A52, doi: 10.1051/0004-6361/201423374
- Lavaux & Hudson (2011) Lavaux, G., & Hudson, M. J. 2011, MNRAS, 416, 2840, doi: 10.1111/j.1365-2966.2011.19233.x
- Meynet et al. (2015) Meynet, G., Kudritzki, R.-P., & Georgy, C. 2015, A&A, 581, A36, doi: 10.1051/0004-6361/201526035
- Paxton et al. (2011) Paxton, B., Bildsten, L., Dotter, A., et al. 2011, ApJS, 192, 3, doi: 10.1088/0067-0049/192/1/3
- Paxton et al. (2013) Paxton, B., Cantiello, M., Arras, P., et al. 2013, ApJS, 208, 4, doi: 10.1088/0067-0049/208/1/4
- Paxton et al. (2015) Paxton, B., Marchant, P., Schwab, J., et al. 2015, ApJS, 220, 15, doi: 10.1088/0067-0049/220/1/15
- Paxton et al. (2018) Paxton, B., Schwab, J., Bauer, E. B., et al. 2018, ApJS, 234, 34, doi: 10.3847/1538-4365/aaa5a8
- Paxton et al. (2019) Paxton, B., Smolec, R., Schwab, J., et al. 2019, ApJS, 243, 10, doi: 10.3847/1538-4365/ab2241
- Pietrzyński et al. (2019) Pietrzyński, G., Graczyk, D., Gallenne, A., et al. 2019, Nature, 567, 200, doi: 10.1038/s41586-019-0999-4
- Sakstein (2020) Sakstein, J. 2020, arXiv e-prints, arXiv:2002.04194. https://arxiv.org/abs/2002.04194
- Starobinsky (1980) Starobinsky, A. A. 1980, Physics Letters B, 91, 99, doi: 10.1016/0370-2693(80)90670-X
- Taormina et al. (2020) Taormina, M., Kudritzki, R.-P., Puls, J., et al. 2020, ApJ, 890, 137, doi: 10.3847/1538-4357/ab6bd0
- Tully et al. (2009) Tully, R. B., Rizzi, L., Shaya, E. J., et al. 2009, AJ, 138, 323, doi: 10.1088/0004-6256/138/2/323
- U et al. (2009) U, V., Urbaneja, M. A., Kudritzki, R.-P., et al. 2009, ApJ, 704, 1120, doi: 10.1088/0004-637X/704/2/1120
- Urbaneja et al. (2008) Urbaneja, M. A., Kudritzki, R.-P., Bresolin, F., et al. 2008, ApJ, 684, 118, doi: 10.1086/590334
- Urbaneja et al. (2017) Urbaneja, M. A., Kudritzki, R.-P., Gieren, W., et al. 2017, AJ, 154, 102, doi: 10.3847/1538-3881/aa79a8
- Vainshtein (1972) Vainshtein, A. I. 1972, Physics Letters B, 39, 393, doi: 10.1016/0370-2693(72)90147-5
- Vink et al. (1999) Vink, J. S., de Koter, A., & Lamers, H. J. G. L. M. 1999, A&A, 350, 181. https://arxiv.org/abs/astro-ph/9908196
- Vink et al. (2000) —. 2000, A&A, 362, 295. https://arxiv.org/abs/astro-ph/0008183
- Vink et al. (2001) —. 2001, A&A, 369, 574, doi: 10.1051/0004-6361:20010127