[style=french, orcid=0000-0002-7086-5443] \cormark[1] url]aurelien.stcherbinine.net
[style=french]
[style=french, orcid=0000-0002-4187-1457]
[style=french]
[cor1]Corresponding author
Identification of a new spectral signature at 3 µm over Martian northern high latitudes: implications for surface composition.
Abstract
Mars northern polar latitudes are known to harbor an enhanced 3 m spectral signature when observed from orbit. This may indicate a greater amount of surface adsorbed or bound water, although it has not yet been possible to easily reconcile orbital observations with ground measurements by Phoenix. Here we re-analyzed OMEGA/Mars Express observations acquired during the Northern summer to further characterize this 3 m absorption band increase. We identify the presence of a new specific spectral signature composed of an additional narrow absorption feature centered at 3.03 m coupled with an absorption at m. This signature is homogeneously distributed over a high-albedo open ring surrounding the circumpolar low-albedo terrains between 68∘N and 76∘N and 0∘E and 270∘E. This location includes the Phoenix landing site. This feature shows no time variability and can be confidently attributed to a seasonally stable surface component. All together, the stability, spectral shape and absence of significant correlation with other signatures in the 1 – 2.5 m range discard interpretations relying on water ice or easily exchangeable adsorbed water. Sulfates, notably anhydrite, provide interesting comparisons to several sections of the spectrum. Analogies with Earth samples also show that the spectral signature could result from a latitudinal modification of the hydration state and/or grains size of salts contaminants. While the exact full spectral shape cannot be easily reproduced, plausible explanations to this observation seem to involve geologically recent water alteration at high northern latitudes.
keywords:
Mars \sepSurface hydration \sepIR spectroscopy \sepOMEGA \sepNorth polar regions1 Introduction
Mars ubiquitous wide 3 m spectral absorption has been first identified using ground observations and associated with the presence of hydrated minerals at the surface of the red planet (Sinton, 1967). This feature was then observed from orbit by e.g. Mariner and Phobos missions (Pimentel et al., 1974; Bibring et al., 1990). The 3 m variability over the surface was attributed to either difference in absorbed water content, or compositional variations (Murchie et al., 2000). The first global mapping of this spectral signature was obtained through observations of the Observatoire pour la Minéralogie, l’Eau, les Glaces et l’Activité (OMEGA) instrument (Jouglet et al., 2007; Milliken et al., 2007). Either superficial adsorbed water independent of composition, bound structural water within minerals, intermediate cases (e.g., water stored in the interlayer regions of phyllosilicates), or a mix of these possibilities, were considered to explain this feature (Milliken et al., 2007). Irrelevant of its origin, as this spectral feature is mainly associated with OH/H2O, this 3 m band was used to estimate a water weight % content of the surface (Jouglet et al., 2007; Milliken et al., 2007). These studies reveal that the water content of the Martian soil increases poleward by a factor greater than two, with the highest levels reached in the northern latitudes ( 8 wt. % H2O, up to 10% to 15%). While the absolute value of this weight % is model-dependent (Jouglet et al., 2007; Milliken et al., 2007; Liu et al., 2020), the relative increase corresponds to a robust latitudinal trend of the band depth. This polar increase of hydration was mainly attributed to an increase of superficial weakly bound adsorbed water (Jouglet et al., 2007; Poulet et al., 2008, 2010). This interpretation was notably supported by a tentative identification of seasonal variations of the 3 m band depth, suggestive of exchanges between the surface and the atmosphere (Jouglet et al., 2007).
In-situ measurements from the Phoenix lander offered observational "ground truth" constraints about the water content of soils at northern polar latitudes. Phoenix reported the detection of various minerals that may indicate a past water alteration process such as carbonates (2–5%) and perchlorates ( 1%), but an overall soil water content of 1–2% only (Boynton et al., 2009; Hecht et al., 2009; Smith et al., 2009; Poulet et al., 2010; Sutter et al., 2012) which is well below the value of 10-11% retrieved using OMEGA data at 3 m (Jouglet et al., 2007; Milliken et al., 2007; Audouard et al., 2014). Both measurements were argued to be reconcilable if we consider that the 3 m feature is due to superficial adsorbed water contained within the first few hundred micrometers sampled by OMEGA, and not in the first centimeters sampled by Phoenix (Poulet et al., 2010). However, water from samples heated by Phoenix was not released at low, adsorbed water-compatible temperatures (Smith et al., 2009). Observed temperatures of about 300∘C and 700∘C are compatible with the presence of several hydrous minerals or phases within soils (Smith et al., 2009). In the absence of a significant amount of adsorbed water, the discrepancy between OMEGA and Phoenix measurements may thus be related to either the presence of a very superficial hydrated coating with tightly bound - and not adsorbed - water, or to an improper association between 3 m band depth/shape and water %.
In-situ measurements of the soil water content were also obtained at equatorial latitudes by the Mars Sample Laboratory (MSL) rover Curiosity. Various instruments (the Sample Analysis of Mars, SAM, the Chemistry and Mineralogy, CheMin, and the Chemistry Camera, ChemCam) lead to the conclusion that most of the water (about 2 %) contained in the martian regolith at MSL landing site is likely not weakly bound adsorbed water, but rather more strongly bound water within the amorphous phase (Leshin et al., 2013; Bish et al., 2013; Meslin et al., 2013). Based on these results, Meslin et al. (2013) suggested that the spatial variations of the surface water content observed from orbit may be partly related to the variations of abundances of hydrated amorphous components.
A reassessment of the 3 m band in the OMEGA dataset then similarly questioned the interpretation of this band by adsorbed water (Audouard et al., 2014): using a larger dataset and applying a stricter atmospheric filtering on the data, these authors did not confirm the seasonal variations previously reported from OMEGA data at northern high latitudes. Moreover, the surface 3 m feature was found to be extremely stable with respect to changes in relative humidity. It was then suggested that the 3 m band at high northern latitudes is also not linked with adsorbed water, and that the increased 3 m band may be related to a specific polar alteration process involving ice and modifying the amount of tightly bound water within minerals or amorphous phases (Audouard et al., 2014).
Another piece of the puzzle came from laboratory measurements on analogs and meteorites: these measurements revealed that increasing the amount of adsorbed water usually creates an absorption feature at 1.9 m in addition to the one at 3 m, while this 1.9 m band is not observed over most of Mars unlike the ubiquitous 3 m band, suggesting again that the Martian 3 m band may not be related to adsorbed water (Pommerol et al., 2009, 2011; Beck et al., 2015). Note however that under northern polar latitudes, above 60∘N, the 1.9 m band is observed almost everywhere, with an increasing latitudinal trend similarly to the 3 m feature (Poulet et al., 2008), which is this time consistent with the hydrated water interpretation for the 3 m polar increase (Poulet et al., 2008). As in other context (i.e., at lower latitudes), the 1.9 m band is also an indicator of the presence of hydrated minerals such as phyllosilicates (Poulet et al., 2005), the presence of this 1.9 m may also suggest a specific widespread presence of hydrated minerals at high northern latitudes. Actually, the presence of hydrated minerals such as phyllosilicates or sulfates also leads to a significant co-increase of the 1.9 m and 3 m bands (Jouglet et al., 2007, figure 10).
Remote observations of the high northern latitudes of Mars indeed reveal the presence of other spectral features related to hydrated minerals, in particular sulfates, suggesting the presence of water alteration (Langevin et al., 2005a; Poulet et al., 2008; Massé et al., 2012; Carter et al., 2016). These identifications are based on features located in the 1 to 2.5 m wavelength range. Near-IR data first revealed an area about 240∘E and 85∘N with strong signatures compatible with calcium-rich hydrated sulfates such as gypsum (Langevin et al., 2005a). Note that it has been reported afterward that perchlorates can display similar spectral signatures (Hanley et al., 2015). Weaker signatures of these sulfates (and possibly perchlorates) have then been observed all over the norther circumpolar dune fields surrounding the perennial cap (Massé et al., 2010, 2012). Another candidate for some OMEGA hydration features observed at high northern latitudes is zeolites (Poulet et al., 2010). Large areas of the northern high latitudes actually possess a distinct spectral shape in OMEGA data which may be related to some sort of widespread water-limited alteration (Horgan and Bell, 2012). Such a widespread limited weathering potentially producing hydrated phases may also explain data collected by the Thermal Emission Spectrometer (Wyatt et al., 2004; Michalski et al., 2005).
If hydrated phases concentration within soil is low, such as expected from a limited weathering, then they may not be easily identified in remote observations. Some low-abundance minerals that have been detected through in-situ measurements at northern high latitudes, as e.g. Mg-perchlorates and carbonates at the Phoenix landing site (Boynton et al., 2009; Hecht et al., 2009) have not yet been detected by orbital observations. This may be due to orbital detection threshold limitations that can be up to 6% for carbonates (Jouglet et al., 2007; Poulet et al., 2010) or to the effect of dust coating which masks underlying materials (Vincendon et al., 2015). Similarly, the hydrated amorphous phase observed by Curiosity (Leshin et al., 2013; Bish et al., 2013; Meslin et al., 2013) is not identified from orbit. This further suggests that low amount of hydrated minerals or amorphous hydrated phases may be widely distributed at high latitudes, without being easily identifiable by OMEGA and the Compact Reconnaissance Imaging Spectrometer for Mars (CRISM), notably within the most widely used 1 to 2.5 m spectral range. They could however take part in the spectral shape and deepness of the 3 m H2O/OH feature, which shows up more rapidly compared to features in the 1 to 2.5 m range (e.g. Bishop, 2019).
Overall, northern latitudes show complex spectral behaviors related to hydrated mineralogy and/or adsorbed water, some of which are still not uniquely interpreted nor related to lander observations. In this study, we re-analyze OMEGA observations of the north polar regions of Mars to further constrain the origin of the polar increase of the 3 m feature.
2 Dataset and methods
2.1 OMEGA data
The OMEGA experiment onboard the Mars Express orbiter is a visible and near-infrared imaging spectrometer composed of three different channels covering the 0.38–5.1 m spectral range, respectively called "V" (0.38–1.05 m), "C" (0.93–2.73 m) and "L" (2.55–5.1 m) channels (Bibring et al., 2004). Observations of the Martian surface using the three channels were conducted from 2004 to 2010. Additional observations are still ongoing with limited spectral coverage, but in this study, we will only deal with pre-2010 measurements. It corresponds to a dataset of 9646 hyperspectral cubes covering most of the Martian surface with a typical spatial sampling of 1 km, varying from 350 m to 5 km depending on the position of Mars-Express on its elliptical orbit. Repeated observations of the same region have been frequently obtained over the mission, in particular at high latitudes where time sampling can be about 10∘ of (Langevin et al., 2005b, 2007) thanks to the quasi-polar orbit of Mars Express.
While the response of the C channel remains stable from 2004 to 2010, the onboard calibration (OBC) of OMEGA reveals that the L channel response has significantly varied over the mission (Jouglet et al., 2009). In this paper, we use the adapted instrument transfer function (ITF) that accounts for these variations, as described in Jouglet et al. (2009). Most of our study will however focus on data acquired during MY 27 northern summer (from orbits 923 to 1224, i.e. over 98∘– 137∘), a timeframe over which the ITF was nominal.
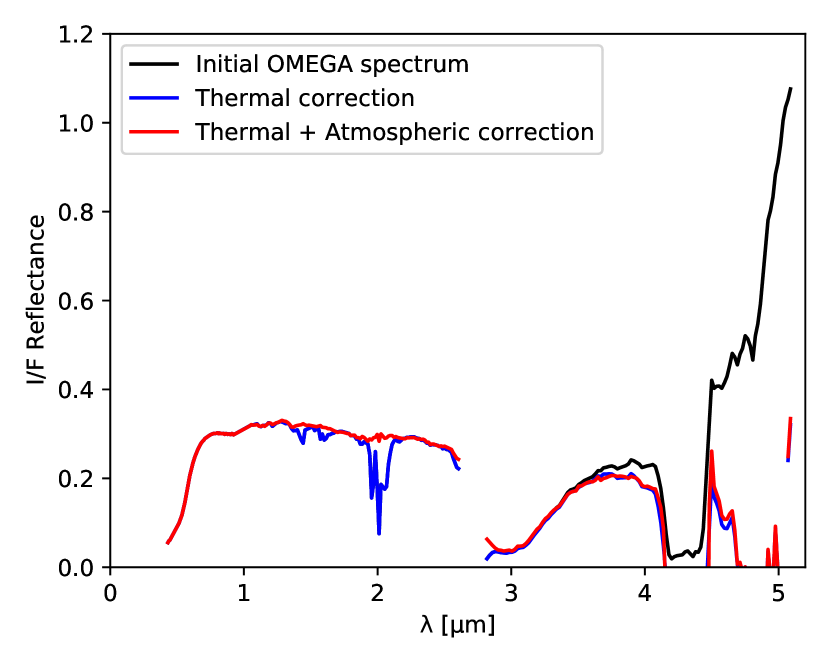
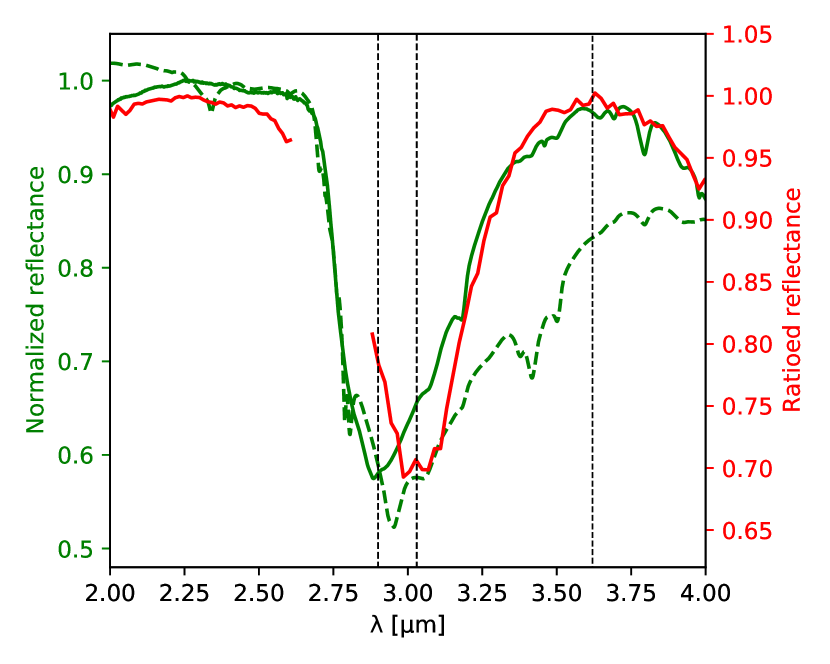
As the thermal emission from the planet is of importance for wavelengths larger than 3 m, we remove this thermal component from each OMEGA data cube using the method described in Jouglet et al. (2007), and thereafter used in other studies based on OMEGA observations (e.g. Audouard et al., 2014). This method relies on the comparison between the observed reflectance at 5 m, where thermal emission dominates for temperatures greater than about 200 K, and the reflectance at 2.4 m where the thermal contribution is negligible. We first estimate the theoretical thermal-free reflectance at 5 m using the measured reflectance at 2.4 m, assuming a typical spectral shape extracted from Erard and Calvin (1997). We then calculate the appropriate thermal additional contribution that reproduces the observed reflectance at 5 m. This thermal contribution can then be removed at all wavelengths assuming Planck law. An example is shown in Figure 1.
We also correct the OMEGA spectra from the atmospheric gas absorption using the method described in Langevin et al. (2005a) and Jouglet et al. (2007). Each OMEGA spectrum is divided by a transmission spectrum of the martian atmosphere computed from a comparison between the base and the top of Olympus Mons, that is scaled to the appropriated atmospheric column height using the 2 m atmospheric CO2 absorption band (Figure 1).
OMEGA data are processed using a Python module developed for this study ("OMEGA-Py"), freely available on GitHub at https://github.com/AStcherbinine/omegapy. This module notably includes a re-implementation of the most recent release ("SOFT10") of the official OMEGA software (IDL routines) available with OMEGA data. It also contains several additional data reduction functions such as build-in atmospheric and thermal corrections (using the methods described above), and graphic tools including interactive visualization of the data or generation of composite OMEGA maps.
2.2 Data filtering
OMEGA has provided a large number of observations: we can thus apply strong filtering on the dataset while keeping a near global coverage of the polar regions. This data filtering is based on criteria established and detailed in previous studies (e.g. Langevin et al., 2007; Poulet et al., 2007; Ody et al., 2012; Vincendon et al., 2015) that are summarized below.
-
•
To prevent possible effects related to viewing geometry (Pommerol and Schmitt, 2008a), we restrict our study to near-nadir pixels (emergence angle ) with an incidence angle .
-
•
As the OMEGA IR detector has been designed and calibrated to operate at temperatures below 80 K, we remove the observation lines that have been acquired with higher temperatures.
-
•
Depending on the hyperspectral cube number, some lines at the beginning and the end of the images have to be removed as they are used for instrument calibration or are usually corrupted (see the OMEGA software SOFT10_readme.txt documentation file available on the PSA at ftp://psa.esac.esa.int/pub/mirror/MARS-EXPRESS/OMEGA/MEX-M-OMEGA-2-EDR-FLIGHT-EXT7-V1.0/SOFTWARE/ for more details).
-
•
Near-saturation of some pixels can occur when observing a surface element brighter than expected (e.g., sun-lighted tilted surfaces). Similarly to the higher quality level criteria defined in Vincendon et al. (2015), we use a conservative threshold of 500 DN for the spectel #40 (corresponding to m), and reject pixels with lower value to prevent non-linearity effects.
-
•
An instrumental issue perturbs 128 pixels wide observations from orbit 513 to 3283 (see OMEGA software SOFT10_readme.txt file) as columns #81 to #96 present 44 corrupted wavelengths. Even if it is possible to recover part of the information, we decided to remove these columns from the study to focus on the more reliable part of the images. Between orbits 2124 and 3283, an additional random noise also affects columns #68 to #128, which are also removed from our study.
-
•
The 3 m band is very sensitive to the presence of water ice at the surface or in the atmosphere (Vincendon et al., 2011). We remove all pixels with a water ice 1.5 m absorption (see Table 1) . We also compute the ice cloud index (ICI) defined in Langevin et al. (2007) as the ratio of the reflectance at m over the reflectance at m to detect the presence of clouds and remove pixels with an ICI (Audouard et al., 2014).
In addition, 3 m band depth estimators are known to exhibit a strong dependency to the surface albedo (Jouglet et al., 2007; Pommerol and Schmitt, 2008b), so a specific attention should be taken when comparing regions of different albedo. Thus, in the following, we usually apply restrictions on the value of the reflectance at m when studying the spatial evolution of a given criterion.
2.3 Band depth estimators
| Description | Spectral indice |
| 1.5 m BD (Poulet et al., 2007) | |
| 1.9 m BD (Langevin et al., 2005b) | |
| 2.4 m BD | |
| Wide 3 m BD (Jouglet et al., 2007) | |
| where | |
| Narrow 3 m BD | |
| 4 m BD |
The spectral estimators used and developed in this study are summarized in Table 1, with their explicit formula.
We first consider three band depths estimators derived from previous studies at 1.5 m (water ice), 1.9 m (hydrated minerals or adsorbed water) and 3 m. For the 1.5 m and 1.9 m band depth (BD), we compute the absorption at the center of the band relatively to a continuum defined linearly between two reference points at the extremities of the band. Wavelengths are selected to avoid atmospheric absorption (see subsection 2.1). E.g., this is why the reflectance at 1.93 m is used in the computation of the 1.9 m BD instead of the reflectance at 1.94 m (Langevin et al., 2005a). For the quantification of the absorption related to the full 3 m band observed everywhere on Mars, we have computed the 3 m normalized integrated band depth under a continuum defined linearly between 2.35 m and 3.7 m, as described in Jouglet et al. (2007). This band depth is hereafter referred as the wide 3 m BD.
We have then defined three new estimators which appeared necessary during the development of this study. A new estimator focus on the central part of the 3 m band: it makes it possible to locate a narrow sub-feature within the wide 3 m band. It is called hereafter the narrow 3 m BD: the absorption is computed at 3.0 m relatively to a continuum whose reference points are taken at 2.9 and 3.2 m instead of 2.9 and 3.7 m for the usual, previously used wide 3 m BD. Indeed, as the usual wide 3 m feature is almost linear between 2.9 and 3.2 m, this criterion traces the concavity in this spectral range related to the presence of the narrow 3 m band (cf. Figure 2b). As most wavelengths used for this criterion are localized around the bottom of the 3 m band, reflectance values are low due to the strong absorption, and we average 3 consecutive wavelengths (see Table 1) to increase the signal-to-noise ratio (SNR).
Another spectral feature identified during this work is located at about 4 m. In the case of this 4 m band, as we can only see one part of the band because of the strong atmospheric absorption for wavelength larger than 4.06 m, we compute a new 4 m BD estimator using a linear continuum equals to the average reflectance value at 3.7 m.
Finally, we will also explore possible correlations with another minor band at 2.4 m for which a new estimator has also been developed, using the calculation principles of the 4 m BD (Table 1).
3 Results
3.1 Phoenix landing site area
As discussed in section 1, Phoenix provided unique ground truth measurements in the north polar region that can be compared to information derived from orbital data.
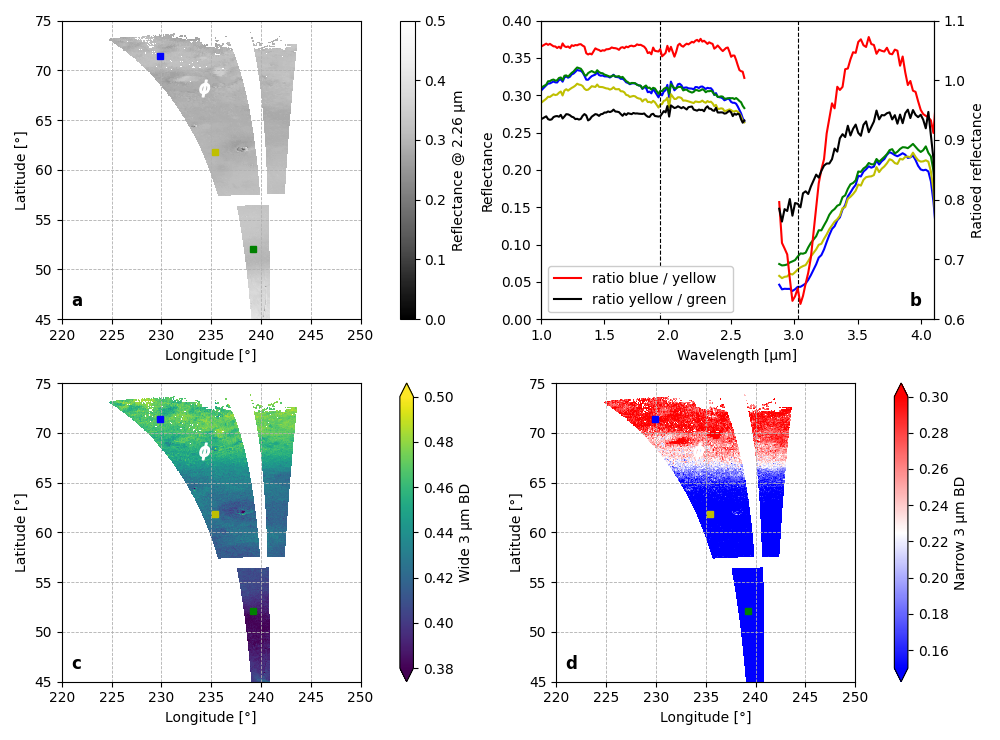
Figure 2 illustrates the evolution of surface spectral reflectance over a latitudinal band covering a relatively uniform bright albedo area and crossing the Phoenix landing site at 234∘E / 68∘N. We can see that the wide 3 m BD progressively increases with latitude, as previously reported (Jouglet et al., 2007; Milliken et al., 2007). In panel (b) of the same figure, we show spectra from three different latitudes (52∘N, 62∘N & 72∘N). We can see that the spectral modifications are not progressive with latitudes, in particular between 2.8 and 4.0 m. Indeed, we observe that the shape of the northern spectrum differs from the two others (blue versus yellow and green on Figure 2): the maximum of absorption of the 3 m band is shifted from 2.9 m to 3.0 m, and a decrease of the reflectance is observed beyond 3.8 m. This difference of behavior is enhanced in the spectral ratios (Figure 2b): while the ratio obtained south of Phoenix (black) reveals an increase of the 3 m band with a typical band shape similar to the actual band prior ratioing (minimum at 2.9 m), the ratio obtained poleward, over the Phoenix area (red), exhibits a strong but narrow absorption band centered on m (hereafter referred as the narrow 3 m band) along with a wide shallow absorption band starting at m.
We have then mapped the spatial distribution of this narrow 3 m band in the surroundings of Phoenix using the new associated spectral criteria defined in Table 1 and subsection 2.3. This mapping (Figure 2d) reveals that this band is observed only above 68∘N. The transition between the area without signature ( 66∘N) towards that with the signature ( 68∘N) is abrupt, which is very different from the progressive latitudinal gradient observed for the wide 3 m band (Figure 2c).
3.2 Spatial distribution
Outside the Phoenix landing site region, we computed the narrow 3 m BD over the whole OMEGA dataset that contains observations with the 3 channels operating (i.e. up to orbit 8485 and the loss of the C channel) to map the spatial distribution of the newly identified signature at m. It turns out that the signature is only present in the north polar regions. Figure 3 shows composite maps of the northern hemisphere (down to 50∘N), and we observe on panels (e) and (f) that the narrow 3 m band is spread over an open ring, crescent-shaped area around the North pole. This open ring area, hereafter referred as the 3 m northern ring or ring, corresponds to bright regions at latitudes comprised between 68∘N and 76∘N and longitudes between 0∘E and 270∘E. The lower (southern) transition to the ring can occur in bright terrains, without changes in terms of surface albedo. Between 30∘E and 115∘E, the transition is located close to the frontier with low-albedo terrains. The upper (northern) limit of the ring (around 76∘N) corresponds to the delimitation between the high-albedo northern terrains and the dark regions around the perennial north polar cap (cf Figure 4a). Similarly, no detection has been observed in the southward extension of this low-albedo region in Vastitas Borealis, between 280∘E and 360∘E, while latitudes are comparable to the 3 m northern ring area. The new detection thus seems to require two conditions for observation: bright albedo and latitudes greater than 68∘N.
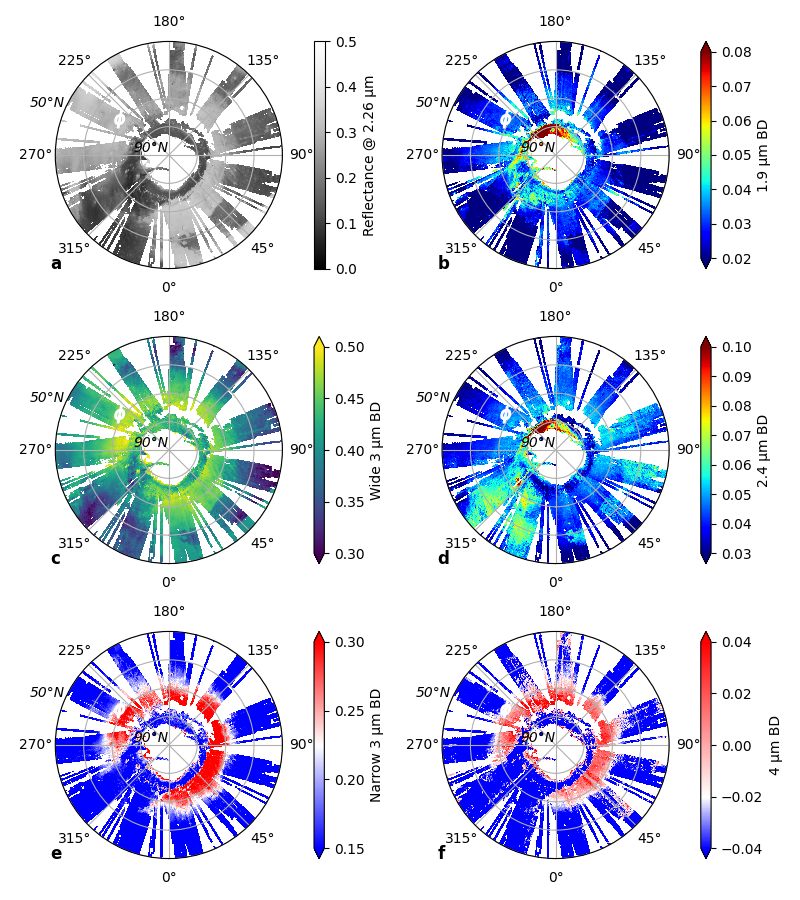
We observe on panels (e) and (f) the presence of an open ring structure between N and N (referred to the 3 m northern ring): this surface distribution is specific to the narrow 3 m BD and 4 m BD criteria. This region is not correlated with surface albedo variations although it occurs only in bright albedo terrains (a). It is nearly anti-correlated with the 1.9 m (b) and 2.4 m (d) absorption features that tend to be observed mainly in dark terrains. The wide 3 m BD is also shown for comparison in panel (c).
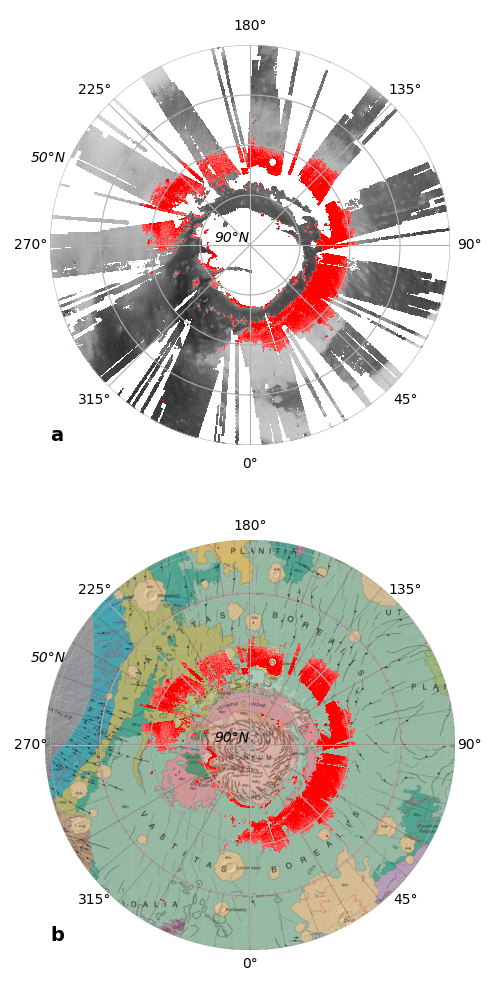
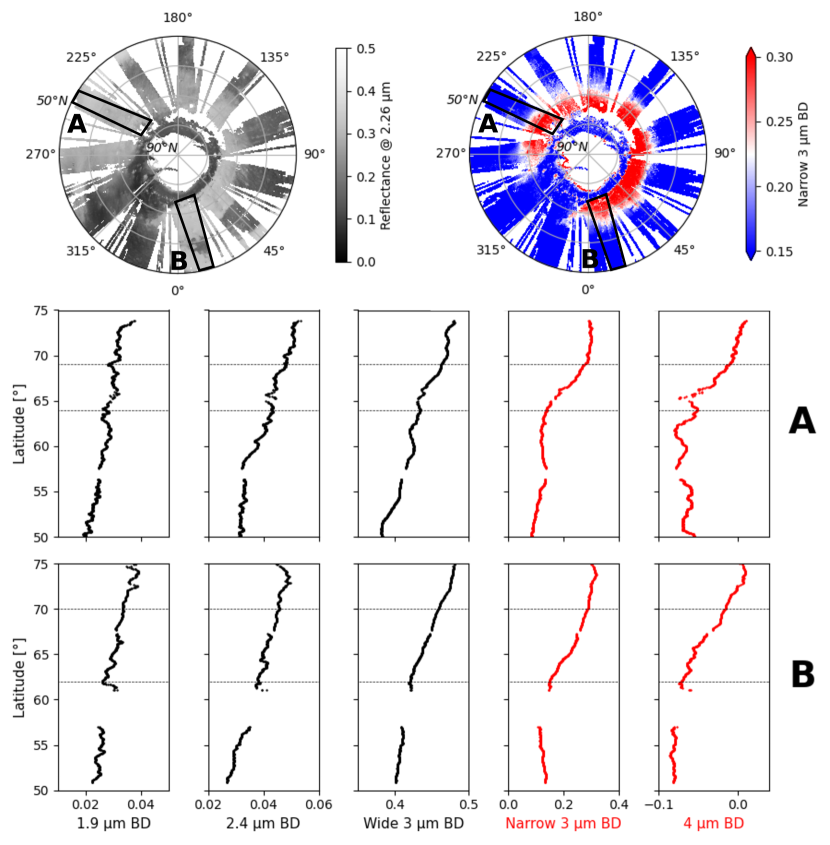
Figure 4 shows the spatial distribution of the detection (narrow 3 m BD values larger than 0.27) over a map of geological units from Tanaka et al. (2005). We observe that it is spread across two main Early Amazonian geological units (referred as Vastitas Borealis marginal and interior units in Tanaka et al. (2005)). This suggests that the signature is associated with the superficial composition of the soil overlying both units (OMEGA sensing depth is a few hundreds of micrometers only).
We show in Figure 5 latitudinal profiles of band depth averages between 45∘N and 75∘N for two areas crossing the 3 m northern ring ("A" and "B"). Four spectral estimators are shown: wide 3 m BD, 1.9 m BD, narrow 3 m BD, and 4 m BD. The values of spectral estimators are averaged over longitude (i.e. image lines), considering only the pixels with a surface reflectance at 2.26 m between 0.3 and 0.35 to avoid possible interference due to albedo variations. We observe that the wide 3 m BD and 1.9 m BD continuously increase with the latitude. On the other hand, both the narrow 3 m and 4 m bands present an abrupt increasing step from low to higher values over a few degrees of latitude only.
Actually, as shown in Figure 3, the spatial distribution of the 4 m band is similar to that of the narrow 3 m one. We can see that the correlation between both is excellent. This strongly suggests that both are connected, i.e. that the phenomena ongoing over the 3 m northern ring is responsible for both absorption features.
3.3 Correlation with other spectral features
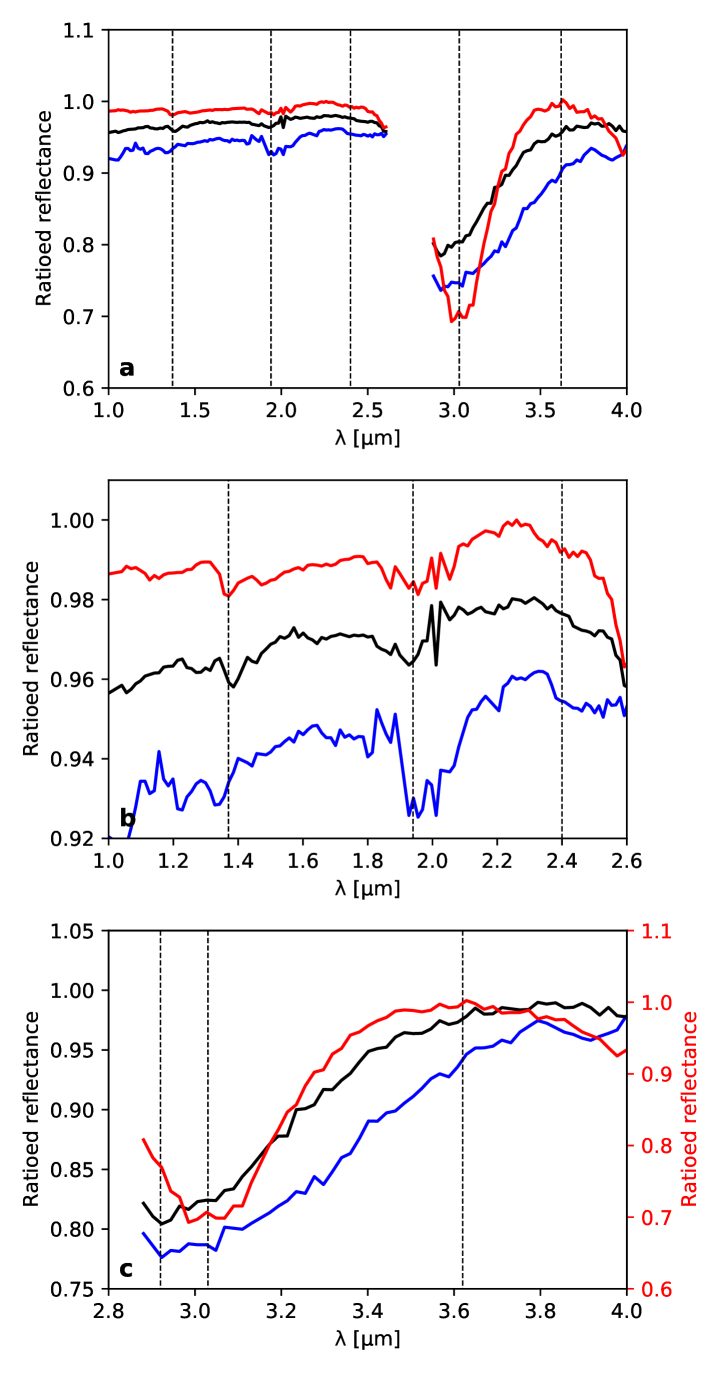
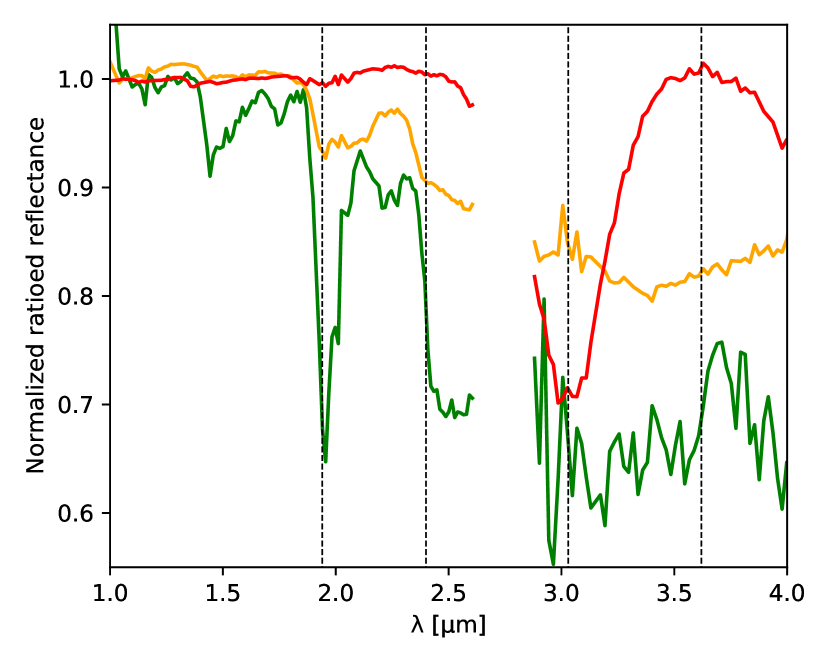
We have averaged several latitudinal spectral ratios ( 70∘N over 63∘N) extracted all around the 3 m northern ring to isolate the mean spectral signature of this newly detected area (see red spectrum in Figure 6).
We first compare this signature with another spectral ratio taken south of the ring (60∘N over 50∘N). This ratio shows that the 3 m increase from 50∘N to 60∘N has a different spectral shape compared to that observed at northern latitudes over the ring. We observe that the main differences between these two spectral ratios reside in the 2.8 – 4 m spectral range. The increase of absorption at 3 m is noticeably larger between 63∘N and 70∘N than between 50∘N and 60∘N, while the latitudinal range is smaller, suggesting an enhancement of the 3 m increase over the ring. As previously discussed for the Phoenix region (subsection 3.1), we observe again that the spectral shape between both also significantly differs. Over the 3 m northern ring, we observe a narrow absorption centered on 3.03 m along with what may be the beginning of a wide absorption at wavelengths larger than 4 m (starting at 3.6 m). Southward, we observe a wider 3 m absorption centered at 2.9 m and no 4 m absorption (cf Figure 6c).
Having a closer look at the 1 – 2.6 m spectral range, we can observe the presence of some very small absorption features (typically about one percent of absorption in the ratios). The main features that can be identified in the red spectrum are localized at 1.37, 1.9, 2.4 and 2.6 m. The 1.37 m and 2.6 m band are associated with atmospheric water vapor (Encrenaz et al., 2005). As we compute spectral ratio across about ten degrees of latitude, the presence of these water vapor bands in the spectra is consistent with the latitudinal increase of the water vapor content characteristic of this season during which water vapor is released from the cap (e.g. Smith, 2006; Melchiorri et al., 2007; Trokhimovskiy et al., 2015). Note also that the solar incidence angle increases as we go poleward, which results in longer atmospheric path lengths that strengthens differences in ratios. The 1.9 m and 2.4 m bands are observed for various hydrated minerals as they result from the stretching and bending vibrations of HO molecules and -OH groups (Gendrin et al., 2005; Bishop, 2019). However, the mapping of these absorption bands in the North polar regions (Figure 3b&d) and their latitudinal profiles in the bright regions (Figure 5) show that their intensity tends to increase with latitude, but without being correlated to the 3 m northern ring. In addition, regions that exhibit the strongest absorption at 1.9 m and 2.4 m are not located in the ring either (see Figure 3 and also Poulet et al. (2008)).
3.4 Comparison with the Southern hemisphere
Figure 6 also presents a typical ratio from the southern polar regions (blue spectrum). As no narrow 3 m band has been detected in the Southern hemisphere during mapping, the location of the used spectra to calculate the ratio ( 74∘S over 62∘S, blue spectrum) were chosen to be as close as possible to the conditions of observation of the signature in the Northern hemisphere in terms of albedo and latitude. This spectral ratio confirms that the spectral band shape observed over the 3 m northern ring is specific to the northern high latitudes: we can see that the maximum of absorption of the 3 m band occurs at 2.9 m as for the black spectrum, and that there is no absorption at 4 m.
We can notice that several absorption features are present in the 1 – 2.6 m spectral range in the southern hemisphere, and that they also differ from the north. This will not be discussed here, but information can be found in Poulet et al. (2008) and Carter et al. (2016).
3.5 Time stability
We have looked for time variations of this signature, as a function of year, season, day, or hour.
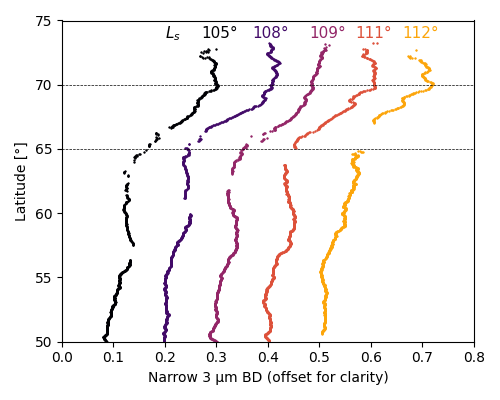
Due to the Mars Express orbit and our restrictions applied on the emergence and incidence angle (cf subsection 2.2), all the observations used here to compute maps from the Martian northern summer of MY 27 have been acquired in the middle of the afternoon (around 3 p.m.). Figure 7 shows latitude profiles above the Phoenix landing region derived with 5 successive OMEGA observations taken over 15 days ( 105∘– 112∘). We can see that apart from some small variations due to longitudinal spatial discrepancies between the observations, the narrow 3 m BD profile remains stable.
We have also compared OMEGA observations acquired in the morning ( 9 a.m.) and evening ( 6 p.m.) over different Martian Years (MY 28 to 30). Morning and evening observations imply differences in the observation geometry, essentially in terms of incidence angle: comparing both is not trivial. We did not identify significant variation in the narrow 3 m BD criteria, despite a wide amplitude in parameters varying with time such as surface temperature.
Overall, available observational constraints suggest that the spatial distribution and spectral shape of this signature are stable with time.
4 Discussion
4.1 Potential atmospheric biases
OMEGA observations of the surface are obtained through the atmosphere. Atmospheric constituents could create an absorption at 3 m or a modification of the 3 m band depth or shape. There are three possible atmospheric contributors in this wavelength range: water vapor, water ice clouds/fog, and dust.
Water vapor concentration is at its highest value during northern summer close to the polar cap, with a latitudinal gradient (Smith, 2004, 2006). A spectral ratio between high and low latitudes could thus highlight more water vapor, as discussed in subsection 2.3. However, the impact of water vapor on the 3 m band was previously shown to be negligible considering the expected depth of water vapor features (Jouglet et al., 2007).
Atmospheric dust is known to modify significantly the depth of the 3 m feature (Audouard et al., 2014). Dust is however not associated with a narrow 3 m spectral feature such as observed here (Vincendon et al., 2009). Moreover, the amount of dust in the atmosphere, its variability, and its impact on surface spectra has been studied in details for the MY27 northern summer OMEGA observations of the high latitudes (Vincendon et al., 2007): the optical depth of dust decreases by a factor of 2-3 from the summer solstice to mid-summer to reach a low value of about 0.3 for which we do not expect any major impact on the 3 m band (Audouard et al., 2014). Additionally, we do not observe any major modification of the detected spectral feature over that period of changing optical depth (Figure 7). Overall, it thus seems highly unlikely that the observed spectral feature over the ring can be explained by atmospheric dust.
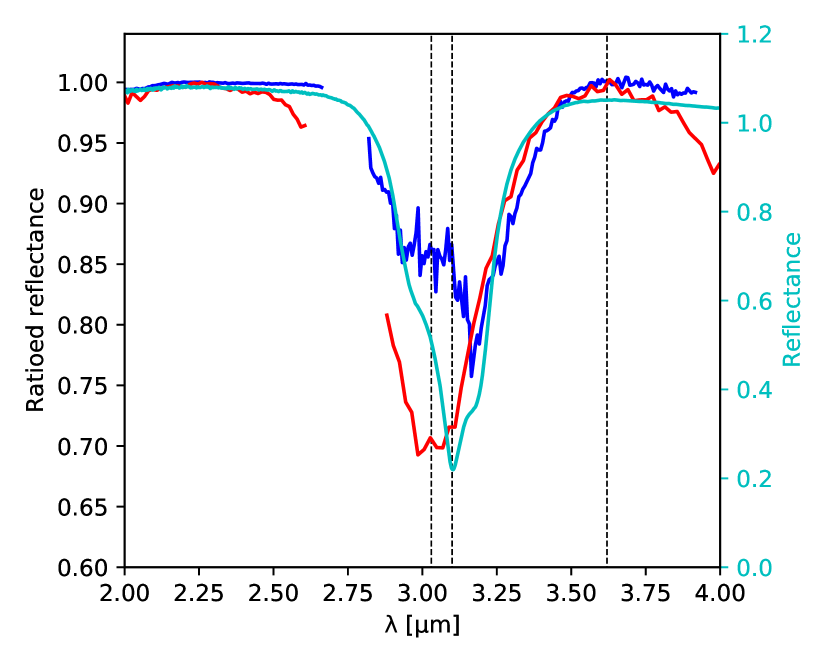
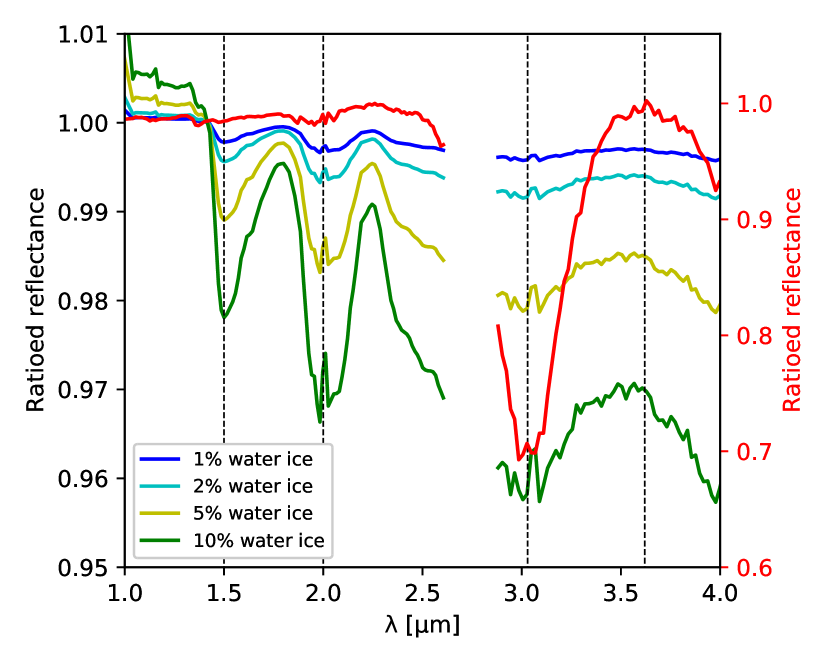
While water vapor and atmospheric dust can be confidently discarded, atmospheric water ice can create a strong and relatively thin spectral absorption near 3 m (Vincendon et al., 2011; Stcherbinine et al., 2020). A particular attention was therefore paid to remove water ice clouds through the combination of the 1.5 m BD and ICI water ice criteria (see subsection 2.2). Nevertheless, as the 3 m band is stronger than the 1.5 m, some thin water ice clouds modifying the 3 m band could remain unfiltered. We illustrate this possible effect on Figure 8 with a typical water ice cloud spectral ratio derived on Mars with CRISM data (Vincendon et al., 2011). We can see that a 3 m atmospheric water ice signature with a significant depth comes with other fainter features at 1.5 m and 2 m that are not observed over the 3 m northern ring (Figure 6). In addition, the 3 m absorption feature due to water ice clouds differs from the observed narrow 3 m band, as ice absorption peaks at 3.1 – 3.2 m. Water ice clouds with smaller particle sizes (m), such as those observed frequently at high altitude (Stcherbinine et al., 2020; Luginin et al., 2020; Liuzzi et al., 2020), may produce a narrower 3 m absorption band without significant signatures at 1.5 or 1.9 m (Vincendon et al., 2011, figure 4). However, such clouds do not have a 4 m absorption feature and their 3 m absorption is centered on 3.1 m instead of 3.03 m. Overall, observed spectral properties are thus not easily explained by atmospheric water ice. Additionally, as mentioned in subsection 3.5, the spatial distribution and depth of the narrow 3 m signature are stable over several mid-afternoon observations taken a few degrees of apart (cf Figure 7) and do not show major variation between morning ( 9 a.m.) and evening ( 6 p.m.) observations (subsection 3.5), while water ice clouds could be expected to vary (Szantai et al., 2021).
4.2 Exposed surface water ice
The discovery of a northern polar ring, reported here, is only observed poleward of a clear boundary located at 68∘N. Its additional 3 m band is frequently linked with water and presents some first-order similarities with water ice (Figure 6). As atmospheric water ice has been discarded previously, it is worth investigating the potential implication of surface water ice.
At such latitudes, the perennial subsurface ice of the permafrost is close to the surface (Bandfield and Feldman, 2008) and was exposed by the Phoenix robotic arm did (Arvidson et al., 2009) after digging the ground. However, the permafrost distribution in the polar regions (Bandfield and Feldman, 2008, Figure 8) does not match the area detected here, especially between 200∘E and 270∘E, where the permafrost remains very close to the surface down to 50∘N, while the spectral transition toward the ring-shaped area occurs around 68∘N (see subsection 3.1). Actually, water ice buried a few cm below the surface would be missed by OMEGA as it can only sense the first few micrometers. When some subsurface water ice was exposed in a trench dug by the Phoenix robotic arm, observations showed that it quickly sublimated (Arvidson et al., 2009), so permafrost is unstable at the surface. However, local exposure of pergelisol outcrops have been reported in the northern mid-latitudes on pole-facing slopes (Dundas et al., 2018; Harish et al., 2020; Dundas et al., 2021). These are subpixel compared to OMEGA resolution, and we could expect such subsurface ice exposures to be more frequent in the northern high latitudes. Dundas et al. (2021) however show that it is not the case for the type of exposure they analyzed. Nevertheless, we have tried to simulate the spectral signature that OMEGA would have observed by looking at such subpixel permafrost exposures (Figure 9). We simulated the impact of a spatial mix between an observed spectrum of perennial water ice (particles sizes 1 – 10 m) and a typical ice-free high latitude spectrum from Figure 6. We observe that even for a few percent of water ice coverage, the spectral ratios exhibit 1.5 m and 2 m absorption bands with intensities comparable to the 3 m absorption, along with a bluer spectral slope in the 1 – 4 m range. However, neither the blue spectral slope nor sufficient 1.5 m or 2 m absorption compared to the intensity of the 3 m feature are present in the 3 m northern ring. Overall, these spatial and spectral considerations contradict a subpixel permafrost exposures explanation.
Small-grained seasonal surface water ice could also persist throughout summer, e.g. in some subpixel shadowed areas. Seasonal water ice is known to be present and stable over shadowed pole-facing slopes earlier and later in the season compared to the seasonal cap (Carrozzo et al., 2009; Vincendon et al., 2010), and some surface water ice patches have been observed in the Phoenix region even during the northern summer (Seelos et al., 2008; Cull et al., 2010). Additionally, the presence of water ice frost that forms during nighttime and remains in the early morning has also been observed by the Viking Lander 2 Camera 2, the Phoenix lander Surface Stereo Imager (SSI) and CRISM observations of the region from (Cull et al., 2010). Up to the Phoenix landing site exposed surface is however ice-free throughout the day (Cull et al., 2010). Our observations were performed in the mid-afternoon ( 3 p.m.) from 98∘ to 137∘, and no surface water ice have been observed during the afternoon hours under Phoenix latitudes between and (Cull et al., 2010), except well-known perennial patches of water ice in craters. Additionally, observations of water ice or frost in the shadows of pole-facing slopes or craters with CRISM or OMEGA (Carrozzo et al., 2009; Vincendon et al., 2010; Harish et al., 2020) exhibit a 1.5 m absorption of a few percent depth along with a stronger 2 m absorption feature, while we do not detect these features. Very small water ice particles are needed to produce a 3 m band without detectable feature at m: an optical path length of only 4 m within ice is supposed to be sufficient for OMEGA to detect ice at m according to Vincendon et al. (2010). We show in Figure 8 the spectral properties of a 0.74 m-thick surface water ice measured at 145K from Schmitt and Trotta (1996) compared to the spectral signature identified here. We observe that even if the width of the two 3 m absorption bands are similar, there is a mismatch between their respective positions with a peak at 3.03 m compared to 3.13 m for the water ice signature. The ice spectrum also lacks the 4 m absorption observed in OMEGA data.
Thus, several issues challenge our attempts to explain the spectral feature of the 3 m northern ring with surface ice, either as large- or small-grained.
4.3 Adsorbed water
Water adsorption refers to weak bonds between water molecules and a mineral surface, that can occur (Milliken et al., 2007) through exchanges with atmospheric vapor (Jouglet et al., 2007). As discussed in section 1, it has been suggested that adsorbed water may be the main explanation for the high latitude increase of the 3 m band (Jouglet et al., 2007; Poulet et al., 2008, 2010), although this interpretation has been questioned (Audouard et al., 2014).
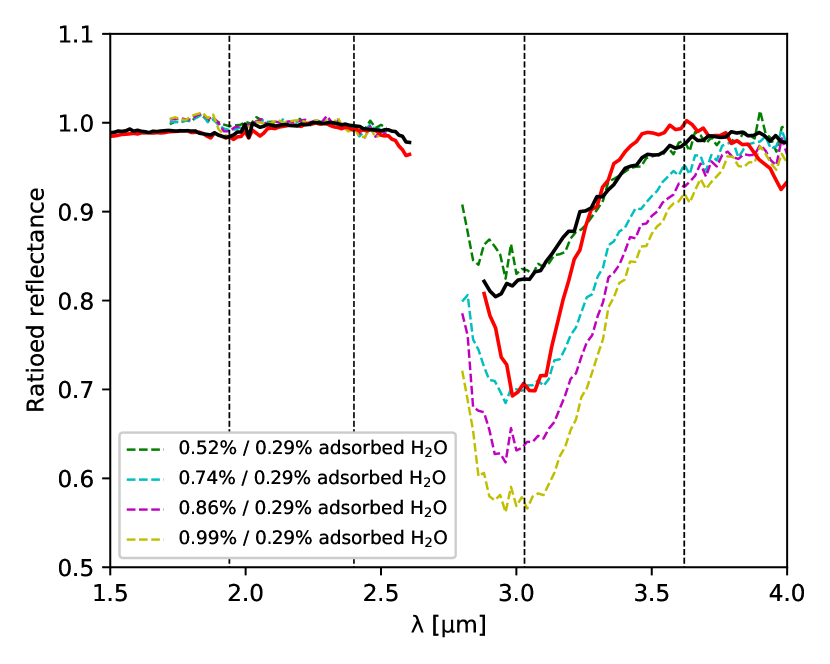
The increase of the 3 m spectral feature related to the water adsorption process comes generally along with an increase of the 1.9 m band ((Pommerol et al., 2009, figure 16) and Beck et al. (2015)). However, we observe that the narrow 3 m and the 4 m bands identified in this study over the 3 m northern ring are anti-correlated with the areas where the 1.9 m band is high (Figure 3). Additionally, the spectral ratio typical of the detected area does not contain a significant 1.9 m band (Figure 6), although the 1.8 – 2.1 m range may contain a shallow absorption ( 1%). This does not favor the adsorbed water hypothesis.
We compare in Figure 10 the spectral ratio of the 3 m northern ring to spectral ratios of a Volcanic tuff sample with different levels of hydration from Pommerol et al. (2009). This sample was chosen because it does not present a strong absorption at 1.9 m, but a variation of the 3 m band. We have however checked that the spectral behavior of adsorbed water estimated with this sample was typical of other samples presented in (Pommerol et al., 2009). We can see that the adsorbed water spectral shape does not compare well with the spectral ratio of the 3 m northern ring. Indeed, we can see that the 3 m band associated with water adsorption is significantly wider than the narrow 3 m absorption and that the adsorption spectra are unable to reproduce the decrease of reflectance between 3.7 and 4 m. The 3 m northern ring spectral signature thus seems to be related to another process, and adsorbed water does not seem to be the main explanation for the 3 m band increase observed poleward 68∘N.
On the other hand, we observe that the spectral ratio obtained southward of the 3 m northern ring, that is between 50∘N and 60∘N, provides a reasonable 3 m shape match with adsorbed water (Figure 10), along with a small 1.9 m band that is also consistent with adsorbed water (Figure 6). The observed spectral evolution between 50∘N and 60∘may thus reveal an increase in the amount of adsorbed water south of the ring. However, the observed minimum of the 3 m band is at 2.9 m in the observed ratio, which is not comparable to adsorbed water. Additionally, as discussed previously (section 1), adsorbed water is difficult to reconcile with the temperatures required to release the water from the soil measured by Phoenix (Smith et al., 2009) and the lack of temporal variability of the 3 m band (Audouard et al., 2014). The fact that such an increase of adsorbed water would not be observed at the higher latitudes of the ring is also puzzling. Alternatively, an increasing amount of hydrated minerals with latitude would also result in such a spectral ratio with 3 m and 1.9 m bands of comparable shapes (Jouglet et al., 2007; Beck et al., 2015). The spectral ratio obtained southward of the 3 m northern ring may thus indicate the presence of an enhanced hydration within minerals or amorphous phases south of the ring.
4.4 Surface salts
As discussed in previous sections, the spectral signature identified over the 3 m northern ring does not seem to be associated with atmospheric, icy or adsorbed water phenomena. Consequently, it must relate to some sort of modification of the physical and/or chemical properties of the surface.
Studies of the mineralogy of the north polar regions have revealed that the highest amounts of hydrated minerals detectable in the near-IR seem to be located in the low-albedo regions surrounding the perennial polar cap (Langevin et al., 2005a; Poulet et al., 2008; Massé et al., 2010, 2012). This area also presents a high density of dune fields (Tanaka and Hayward, 2008; Massé et al., 2012). These polar hydrated minerals have been mostly identified as Ca-sulfates, and more specifically gypsum (Langevin et al., 2005a; Horgan et al., 2009; Massé et al., 2010, 2012). The highest concentration is located in the Olympia Undae deposit (Langevin et al., 2005a). Perchlorates are an alternative candidate for the spectral shapes typical of these latitudes (Massé et al., 2010; Hanley et al., 2015). While these low albedo terrains are not included in the area of the 3 m northern ring (see previous discussion), this indicates that sulfates, in particular Ca-sulfates, and possibly perchlorates, are abundant and widespread in the northern polar regions. The Phoenix lander is on the contrary located within the 3 m northern ring. Phoenix also provided indication that sulfates (notably Mg-sulfates) and, with lower concentrations, perchlorates, participate in the composition of high altitude soils with typical concentrations of a few weight % (Boynton et al., 2009; Hecht et al., 2009; Smith et al., 2009; Toner et al., 2014).
We first compare our signature with spectra from various perchlorate salts in Figure 11. Anhydrous samples are featureless at wavelengths lower than 2.6 m, similarly to the 3 m northern ring spectral signature, but with a very different spectral shape at longer wavelengths devoid of a marked 3 m band. On the other hand, hydrated perchlorate salts do have a strong 3 m band but centered at 2.8-2.9 m and accompanied with other features notably at shorter wavelengths, which is again poorly compatible with the 3 m northern ring spectral signature.
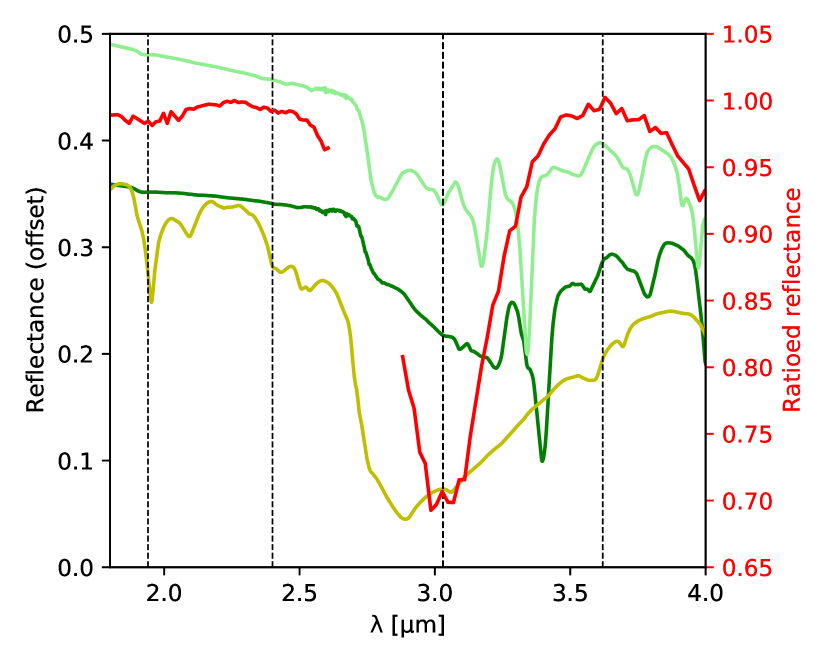
The observed 4 m absorption in our OMEGA spectra shows some similarities with the bluer wing of the wide 4.4 – 4.7 m absorption of sulfates due to SO4 vibrations harmonic (Bishop et al., 2014; Bishop, 2019). We compare in Figure 12 the spectral signature of the 3 m northern ring with typical OMEGA spectra of previously identified sulfates-rich areas: Olympia Undae (Langevin et al., 2005b) and Terra Meridiani (Gendrin et al., 2005). These hydrated sulfates are associated with strong 1.9 and 2.4 m absorption bands not clearly observed in the 3 m northern ring spectrum. They also provide a poor fit of the 3 m band, with a wider shape and a band center shifted toward longer wavelengths.
.
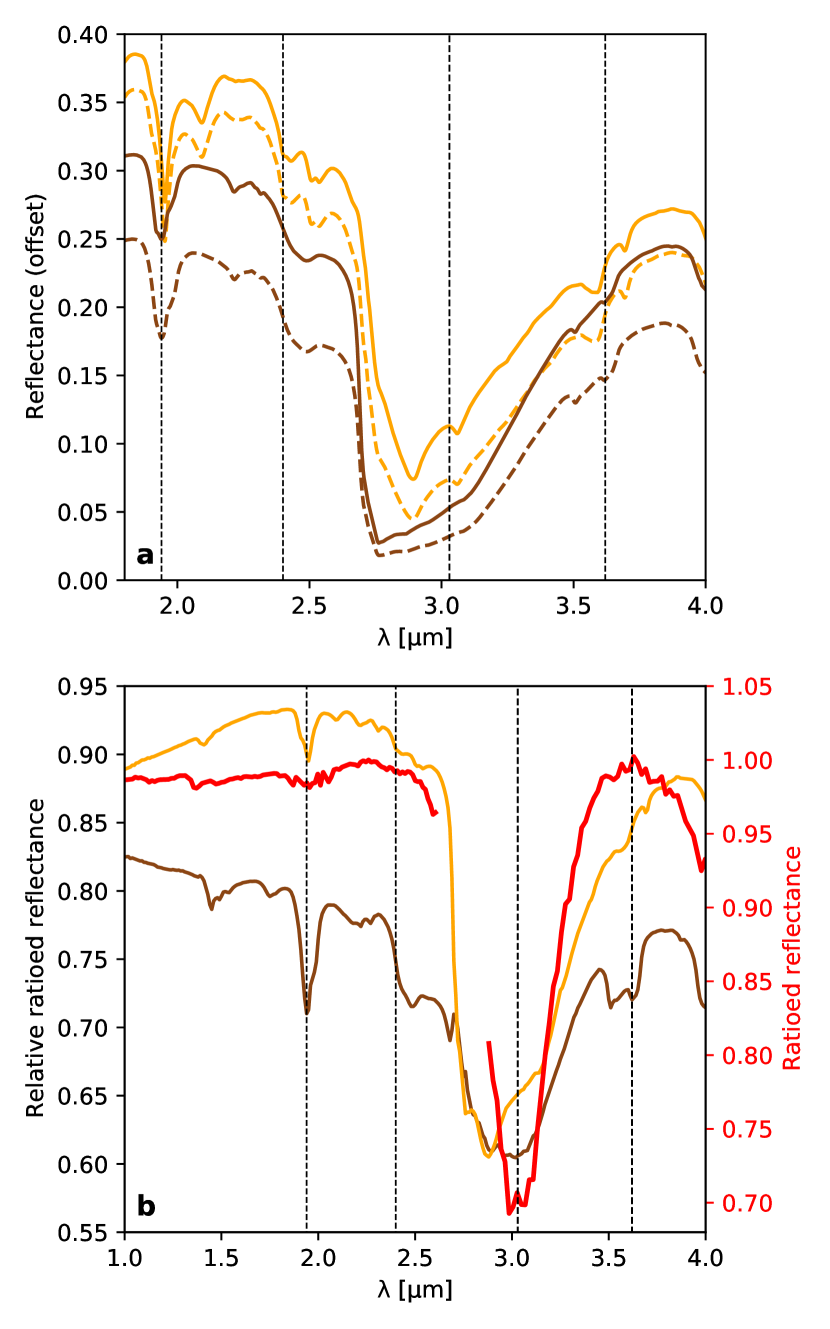
The lack of any significant signature in the 1 – 2.5 m spectral range may suggest a weakly-hydrated sulfate (Bishop et al., 2014). Such sulfates are known to be present on Mars since a small amount of anhydrite has been detected in Gale Crater by MSL (Bish et al., 2013). We compare the spectrum identified in this study over the 3 m northern ring to anhydrite in Figure 13. The 4 m band shape, the relative depth of the 4 and 3 m bands, and the narrow 3 m band width can be reproduced by the anhydrite sample. However, the 3 m band minimum in this anhydrite sulfate sample is not located at the same wavelength as in our observed spectrum. The spectrum of the 3 m northern ring is also compared to another anhydrite sample that contains minor admixtures (Bishop et al., 2014): this lowers the overall quality of the fit, but we can see that a subtle contamination of this sulfate by other mineral components shifts the minimum of the 3 m band to longer wavelengths, bringing it closer to our observation.
Studies of the distribution of gypsum across the north circumpolar dune field showed evidence for eolian processes that may have scattered the gypsum away from a few dune field reservoirs (Horgan et al., 2009; Massé et al., 2012). The smallest grains could have been transported further away, and could have accumulated in the bright area, as bright areas on Mars usually correspond to areas where erosion of fines and dust is less efficient. Exposed to southern, warmer conditions, gypsum grains could have undergone desiccation toward bassanite and then even to anhydrite (Poitras et al., 2018). Alternatively, such desiccation could have occurred at the source and could have then facilitated fracturing, producing smaller and wind transportable grains. These desiccated sulfate grains could have been transported further away by winds compared to larger gypsum grains.
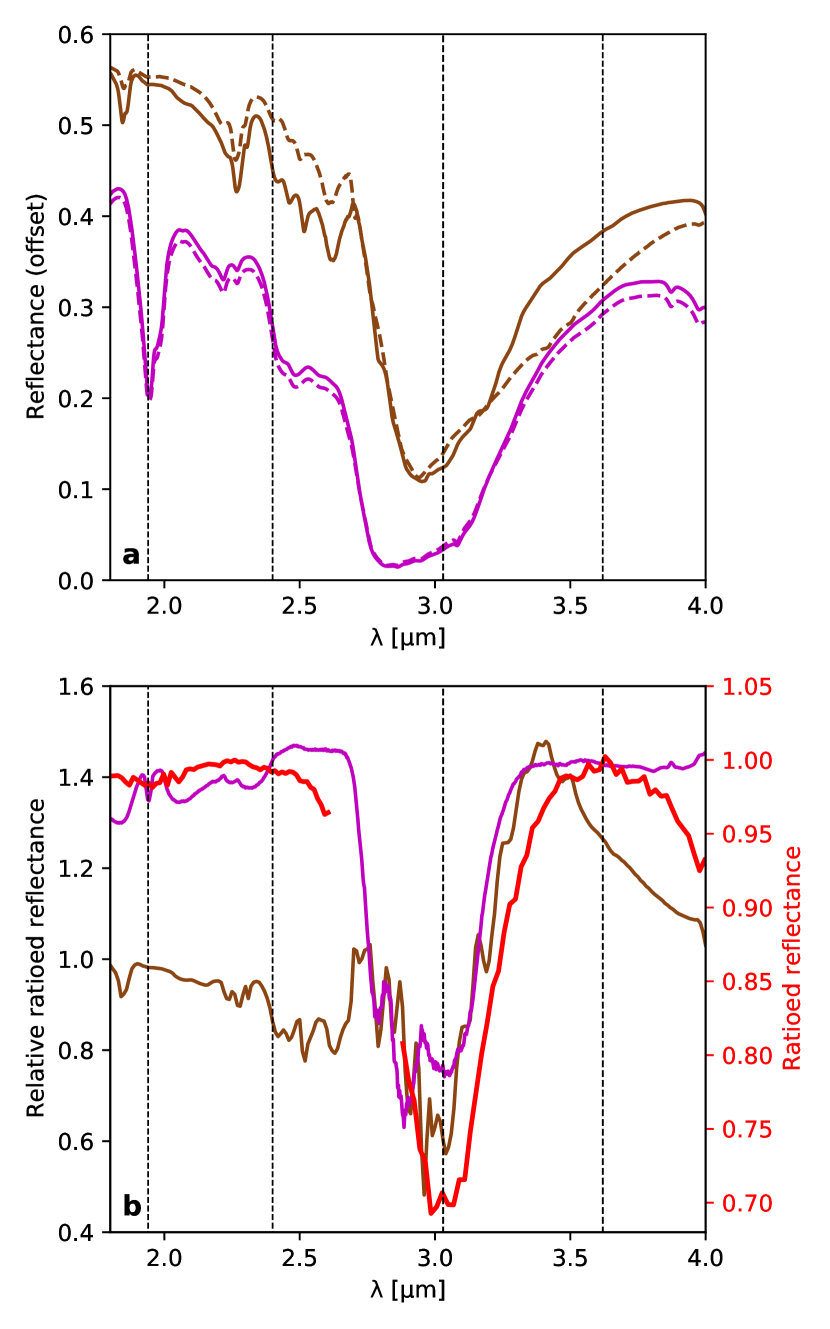
We compare in Figure 14 two gypsum spectra obtained for two different grain sizes. While the gypsum spectrum in itself provides a poor fit to our observed spectrum, the ratio of the small grain size over the larger grain size provides a relatively satisfactory explanation for the narrow 3 m band of the ring. This may indicate that reducing the grain size of calcium-sulfates can produce the spectral evolution observed at the 3 m northern ring. The 4 m feature is however absent of the gypsum ratio of two sizes, so reducing the size does not seem to be enough. Additionally, this interpretation would require calcium sulfates with larger grains to be present southward of the identified area, as our spectrum is a ratio between 70∘N and 63∘N, while observational evidence for gypsum have been obtained essentially poleward. Southward, as discussed in subsection 4.3, terrains located between 50∘N and 65∘N do show enhanced hydration spectral features at 1.9 m and 3 m that may be related to hydrated phases such as hydrated minerals. This could indicate that soils south of the 3 m northern ring actually contain more altered phases compared to equatorial latitudes, as previously proposed (see section 1). The 3 m northern ring would then correspond to a latitude transition beyond which these phases are modified.
While a sole modification of the grain size does not seem to explain all observed features (notably, the 4 m band, see previous paragraph), one could imagine that, if low amount of sulfates are already present south of the 3 m northern ring, increasing the latitude can modify the hydration level of sulfates and produce the observed spectral features in ratios. To test this hypothesis, we compare in Figure 14b our observation to a ratio of two samples of jarosite from two different locations on Earth. Jarosite is a hydrous sulfate of potassium and ferric iron detected on Mars by the Opportunity rover (Klingelhöfer et al., 2004) which may form under icy conditions (Niles et al., 2020). Both samples are described as jarosite mixture with similar grain sizes lower than 45 m. One of the two samples appears more hydrated from the 1.9 m band depth. Ratioing the spectra of these two samples results in a spectral shape that presents some similarities with our observation, with both a narrow 3 m band centered at the appropriate wavelength and a decrease toward 4 m. This example illustrates that increasing the amount of hydration of sulfates may result in a spectral ratio consistent with our observations. Actually, there are indications that soils contain minor amounts of anhydrous sulfates (anhydrite) even at equatorial latitudes (Bish et al., 2013), so trace amount of lowly hydrated sulfates may already be present southward of the ring.
We also computed spectral ratios between the perchlorates samples discussed previously in Figure 11. While none of these ratios provide a satisfactory explanation on his own, they illustrate again that ratioing salts spectra from different samples may result in 3 m bands that share some of the characteristics (narrowness or band center) of the 3 m northern ring. As indicated by Phoenix measurements, the salts content of soil at these latitudes probably results from a mixture of various species (Boynton et al., 2009; Hecht et al., 2009; Smith et al., 2009; Toner et al., 2014), which could explain why none of the spectra or ratios used here for comparison perfectly explain the observed spectral shape, as they are each inherited from relatively pure samples. The 3 m northern ring may then result from a modification of the hydration of a mixture of various salts contaminants in the soils.
Overall, while the exact mechanism responsible for the spectral signature of the ring is not firmly identified, available constraints point toward a possible contribution of salts, notably sulfates, but also possibly perchlorates, in a context of hydration state change and/or grain size change. We summarize the putative formation scenarios mentioned in the previous paragraphs in Figure 16. As our observed 3 m northern ring is superficial and overlays different geological units dated from early-Amazonian (cf subsection 3.2), we are probably observing a relatively recent process. This process may be currently acting and somehow related to the seasonal ice cap (Audouard et al., 2014) that cover the area every winter, although this association is not clear as the cap extent at southern latitudes, down to near 50∘N (Appéré et al., 2011). Alternatively, this modification of the surface may be related to a longer timescale. Mars high latitudes are currently covered by a mantle that is thought to have been deposited during past glaciations over the last million years (Head et al., 2003). In both hemispheres, this ice-rich mantle is considered to be present and uniform poleward 60∘, while being only partially preserved equatorward (Head et al., 2003). Sulfates formation can be associated with ice on Earth and this has been proposed as an explanation for sulfates formation on Mars at high northern latitudes (Massé et al., 2010) or near the equator (Niles and Michalski, 2009), either through authigenic formation within ice or associated with atmospheric ice condensation and precipitation (Massé et al., 2010). Widespread spectral features possibly related to sulfates have been observed at high southern latitudes (Poulet et al., 2008; Wray et al., 2009; Ackiss and Wray, 2014; Carter et al., 2016), and widespread spectral signatures potentially linked with limited water alteration have been observed at high northern latitudes in this study (see subsection 4.3 and previous paragraph) and previously (Wyatt et al., 2004; Michalski et al., 2005; Horgan and Bell, 2012). The 3 m northern ring identified in this study north of 65∘ N may then highlight a modification of such a widespread sulfates contamination. This modification could be a hydration state increase occurring once a latitude threshold is crossed in the northern hemisphere where the amount of water vapor and the overall atmospheric pressure are higher (see Figure 16b).

5 Conclusion
In this paper, we report and characterize the detection of a new spectral feature defined by a deep and relatively narrow 3 m band, centered at 3.03 m, that differs from the usual Mars 3 m band, coupled with a shallow but significant wide 4 m feature. This spectral signature appears to be specific to the bright regions located at high northern latitudes. More precisely, the detection occurs over a wide, open ring area surrounding the cap between 68∘N and 76∘N and extending from 0∘E to 315∘E. This area includes the Phoenix landing site and is referred as the "3 m northern ring" in this study.
A detailed study of the spectral properties observed in this ring (3 m band shape, association with other spectral features, time variability) leads to rule out atmospheric and water-ice explanations. The spectral properties cannot be explained by an increase in the amount of weakly bound adsorbed water either.
The ring appears to possess a specific surface signature that may relate to some sort of modification of the physical or chemical properties of the ice-free soils. The ring occurs north of terrains where a progressive latitudinal increase of surface hydration (1.9 m and 3.0 m bands) is observed. The spectral signature of the ring does however not correlate with signatures in the 1 – 2.5 m spectral range, despite the presence of specific hydrated signatures at similar latitudes in nearby dark terrains.
First comparisons with spectra from libraries suggest that salts, notably sulfates, and possibly perchlorates, may play a role. The most promising comparisons are obtained with the anhydrous Cal-sulfate anhydrite or with ratios of sulfates and/or perchlorates spectra suggestive of an hydration or a grain size modification. In this context we propose two hypothetical scenarios to explain this observation. This first one involves aeolian transport and dessication of the gypsum deposits previously identified near the north polar cap. The second relies on the presence of trace amounts of salts within soils which hydration level is modified on each side of a latitudinal threshold at 65∘N. Within both frameworks, the 3 m northern ring could highlight ice-related formation or modification pathways of salts on Mars.
Data availability
The OMEGA/MEx data are freely available on the ESA PSA at https://archives.esac.esa.int/psa/#!Table%20View/OMEGA=instrument. The source code of the OMEGA-Py Python module is freely available on GitHub at https://github.com/AStcherbinine/omegapy. Laboratories spectra were downloaded from the USGS spectral library (Kokaly et al., 2017), the PDS spectral library (Milliken, 2020) and SSHADE (Schmitt et al., 2018).
Acknowledgments
We thank A. Pommerol and B. Bultel for their constructive reviews that improve the quality of the manuscript.
References
- Ackiss and Wray (2014) Ackiss, S.E., Wray, J., 2014. Occurrences of possible hydrated sulfates in the southern high latitudes of Mars. Icarus 243, 311–324. doi:10.1016/j.icarus.2014.08.016.
- Appéré et al. (2011) Appéré, T., Schmitt, B., Langevin, Y., Douté, S., Pommerol, A., Forget, F., Spiga, A., Gondet, B., Bibring, J.P., 2011. Winter and spring evolution of northern seasonal deposits on Mars from OMEGA on Mars Express. Journal of Geophysical Research 116. doi:10.1029/2010JE003762.
- Arvidson et al. (2009) Arvidson, R.E., Bonitz, R.G., Robinson, M.L., Carsten, J.L., Volpe, R.A., Trebi-Ollennu, A., Mellon, M.T., Chu, P.C., Davis, K.R., Wilson, J.J., Shaw, A.S., Greenberger, R.N., Siebach, K.L., Stein, T.C., Cull, S.C., Goetz, W., Morris, R.V., Ming, D.W., Keller, H.U., Lemmon, M.T., Sizemore, H.G., Mehta, M., 2009. Results from the Mars Phoenix Lander Robotic Arm experiment. Journal of Geophysical Research: Planets 114. doi:10.1029/2009JE003408.
- Audouard et al. (2014) Audouard, J., Poulet, F., Vincendon, M., Milliken, R.E., Jouglet, D., Bibring, J.P., Gondet, B., Langevin, Y., 2014. Water in the Martian regolith from OMEGA/Mars Express. Journal of Geophysical Research: Planets 119, 1969–1989. doi:10.1002/2014JE004649.
- Bandfield and Feldman (2008) Bandfield, J.L., Feldman, W.C., 2008. Martian high latitude permafrost depth and surface cover thermal inertia distributions. Journal of Geophysical Research 113. doi:10.1029/2007JE003007.
- Beck et al. (2015) Beck, P., Pommerol, A., Zanda, B., Remusat, L., Lorand, J., Göpel, C., Hewins, R., Pont, S., Lewin, E., Quirico, E., Schmitt, B., Montes-Hernandez, G., Garenne, A., Bonal, L., Proux, O., Hazemann, J., Chevrier, V., 2015. A Noachian source region for the “Black Beauty” meteorite, and a source lithology for Mars surface hydrated dust? Earth and Planetary Science Letters 427, 104–111. doi:10.1016/j.epsl.2015.06.033.
- Bibring et al. (1990) Bibring, J.P., Combes, M., Langevin, Y., Cara, C., Drossart, P., Encrenaz, T., Erard, S., Forni, O., Gondet, B., Ksanfomaliti, L., Lellouch, E., Masson, P., Moroz, V., Rocard, F., Rosenqvist, J., Sotin, C., Soufflot, A., 1990. ISM observations of Mars and Phobos: first results. Lunar and Planetary Science Conference Proceedings 20, 461–471.
- Bibring et al. (2004) Bibring, J.P., Soufflot, A., Berthé, M., Langevin, Y., Gondet, B., Drossart, P., Bouyé, M., Combes, M., Semery, A., Bellucci, G., Formisano, V., Moroz, V., Kottsov, V., Bonello, G., Erard, S., Forni, O., Gendrin, A., Manaud, N., Poulet, F., Poulleau, G., Encrenaz, T., Fouchet, T., Melchiori, R., Altieri, F., Ignatiev, N., Titov, D., Zasova, L., Coradini, A., Capacionni, F., Cerroni, P., Fonti, S., Mangold, N., Pinet, P., Schmitt, B., Sotin, C., Hauber, E., Hoffmann, H., Jaumann, R., Keller, U., Arvidson, R., Mustard, J., Forget, F., 2004. OMEGA: Observatoire pour la Minéralogie, l’Eau, les Glaces et l’Activité. ESA Publication Division 1240, 37–49.
- Bish et al. (2013) Bish, D.L., Blake, D.F., Vaniman, D.T., Chipera, S.J., Morris, R.V., Ming, D.W., Treiman, A.H., Sarrazin, P., Morrison, S.M., Downs, R.T., Achilles, C.N., Yen, A.S., Bristow, T.F., Crisp, J.A., Morookian, J.M., Farmer, J.D., Rampe, E.B., Stolper, E.M., Spanovich, N., MSL Science Team, 2013. X-ray Diffraction Results from Mars Science Laboratory: Mineralogy of Rocknest at Gale Crater. Science 341, 1238932–1238932. doi:10.1126/science.1238932.
- Bishop (2019) Bishop, J.L., 2019. Visible and Near-Infrared Reflectance Spectroscopy: Laboratory Spectra of Geologic Materials, in: Bishop, J.L., Bell III, J.F., Moersch, J.E. (Eds.), Remote Compositional Analysis. first ed.. Cambridge University Press, pp. 68–101. doi:10.1017/9781316888872.006.
- Bishop et al. (2014) Bishop, J.L., Lane, M.D., Dyar, M.D., King, S.J., Brown, A.J., Swayze, G.A., 2014. Spectral properties of Ca-sulfates: Gypsum, bassanite, and anhydrite. American Mineralogist 99, 2105–2115. doi:10.2138/am-2014-4756.
- Boynton et al. (2009) Boynton, W.V., Ming, D.W., Kounaves, S.P., Young, S.M.M., Arvidson, R.E., Hecht, M.H., Hoffman, J., Niles, P.B., Hamara, D.K., Quinn, R.C., Smith, P.H., Sutter, B., Catling, D.C., Morris, R.V., 2009. Evidence for Calcium Carbonate at the Mars Phoenix Landing Site. Science 325, 61–64. doi:10.1126/science.1172768.
- Carrozzo et al. (2009) Carrozzo, F., Bellucci, G., Altieri, F., D’Aversa, E., Bibring, J.P., 2009. Mapping of water frost and ice at low latitudes on Mars. Icarus 203, 406–420. doi:10.1016/j.icarus.2009.05.020.
- Carter et al. (2016) Carter, J., Gondet, B., Massé, M., Vincendon, M., Pilorget, C., 2016. The South Polar Sulfates of Mars, in: Sixth International Conference on Mars Polar Science and Exploration, p. 6063.
- Cull et al. (2010) Cull, S., Arvidson, R.E., Morris, R.V., Wolff, M., Mellon, M.T., Lemmon, M.T., 2010. Seasonal ice cycle at the Mars Phoenix landing site: 2. Postlanding CRISM and ground observations. Journal of Geophysical Research: Planets 115. doi:10.1029/2009JE003410.
- Dundas et al. (2018) Dundas, C.M., Bramson, A.M., Ojha, L., Wray, J.J., Mellon, M.T., Byrne, S., McEwen, A.S., Putzig, N.E., Viola, D., Sutton, S., Clark, E., Holt, J.W., 2018. Exposed subsurface ice sheets in the Martian mid-latitudes. Science 359, 199–201. doi:10.1126/science.aao1619.
- Dundas et al. (2021) Dundas, C.M., Mellon, M.T., Conway, S.J., Daubar, I.J., Williams, K.E., Ojha, L., Wray, J.J., Bramson, A.M., Byrne, S., McEwen, A.S., Posiolova, L.V., Speth, G., Viola, D., Landis, M.E., Morgan, G.A., Pathare, A.V., 2021. Widespread Exposures of Extensive Clean Shallow Ice in the Midlatitudes of Mars. Journal of Geophysical Research: Planets 126, e2020JE006617. doi:10.1029/2020JE006617.
- Encrenaz et al. (2005) Encrenaz, T., Melchiorri, R., Fouchet, T., Drossart, P., Lellouch, E., Gondet, B., Bibring, J.P., Langevin, Y., Titov, D., Ignatiev, N., Forget, F., 2005. A mapping of martian water sublimation during early northern summer using OMEGA/Mars Express. Astronomy & Astrophysics 441, L9–L12. doi:10.1051/0004-6361:200500171.
- Erard and Calvin (1997) Erard, S., Calvin, W., 1997. New Composite Spectra of Mars, 0.4–5.7 m. Icarus 130, 449–460. doi:10.1006/icar.1997.5830.
- Gendrin et al. (2005) Gendrin, A., Mangold, N., Bibring, J.P., Langevin, Y., Gondet, B., Poulet, F., Bonello, G., Quantin, C., Mustard, J., Arvidson, R., Le Mouélic, S., 2005. Sulfates in Martian Layered Terrains: The OMEGA/Mars Express View. Science 307, 1587–1591. doi:10.1126/science.1109087.
- Hanley et al. (2015) Hanley, J., Chevrier, V.F., Barrows, R.S., Swaffer, C., Altheide, T.S., 2015. Near- and mid-infrared reflectance spectra of hydrated oxychlorine salts with implications for Mars. Journal of Geophysical Research (Planets) 120, 1415–1426. doi:10.1002/2013JE004575.
- Harish et al. (2020) Harish, Vijayan, S., Mangold, N., Bhardwaj, A., 2020. Water-Ice Exposing Scarps Within the Northern Midlatitude Craters on Mars. Geophysical Research Letters 47, e2020GL089057. doi:10.1029/2020GL089057.
- Head et al. (2003) Head, J.W., Mustard, J.F., Kreslavsky, M.A., Milliken, R.E., Marchant, D.R., 2003. Recent ice ages on Mars. Nature 426, 797–802. doi:10.1038/nature02114.
- Hecht et al. (2009) Hecht, M.H., Kounaves, S.P., Quinn, R.C., West, S.J., Young, S.M.M., Ming, D.W., Catling, D.C., Clark, B.C., Boynton, W.V., Hoffman, J., DeFlores, L.P., Gospodinova, K., Kapit, J., Smith, P.H., 2009. Detection of Perchlorate and the Soluble Chemistry of Martian Soil at the Phoenix Lander Site. Science 325, 64–67. doi:10.1126/science.1172466.
- Horgan and Bell (2012) Horgan, B., Bell, J. F., I., 2012. Widespread weathered glass on the surface of Mars. Geology 40, 391–394. doi:10.1130/G32755.1.
- Horgan et al. (2009) Horgan, B.H., Bell, J.F., Dobrea, E.Z.N., Cloutis, E.A., Bailey, D.T., Craig, M.A., Roach, L.H., Mustard, J.F., 2009. Distribution of hydrated minerals in the north polar region of Mars. Journal of Geophysical Research: Planets 114. doi:10.1029/2008JE003187.
- Jouglet et al. (2007) Jouglet, D., Poulet, F., Bibring, J.P., Langevin, Y., Gondet, B., 2007. Search for Carbonates on Mars with the OMEGA/Mars Express Data, in: Seventh International Conference on Mars, p. 3153.
- Jouglet et al. (2009) Jouglet, D., Poulet, F., Langevin, Y., Bibring, J.P., Gondet, B., Vincendon, M., Berthe, M., 2009. OMEGA long wavelength channel: Data reduction during non-nominal stages. Planetary and Space Science 57, 1032–1042. doi:10.1016/j.pss.2008.07.025.
- Jouglet et al. (2007) Jouglet, D., Poulet, F., Milliken, R.E., Mustard, J.F., Bibring, J.P., Langevin, Y., Gondet, B., Gomez, C., 2007. Hydration state of the Martian surface as seen by Mars Express OMEGA: 1. Analysis of the 3 µm hydration feature. Journal of Geophysical Research: Planets 112. doi:10.1029/2006JE002846.
- Klingelhöfer et al. (2004) Klingelhöfer, G., Morris, R.V., Bernhardt, B., Schröder, C., Rodionov, D.S., de Souza, P.A., Yen, A., Gellert, R., Evlanov, E.N., Zubkov, B., Foh, J., Bonnes, U., Kankeleit, E., Gütlich, P., Ming, D.W., Renz, F., Wdowiak, T., Squyres, S.W., Arvidson, R.E., 2004. Jarosite and Hematite at Meridiani Planum from Opportunity’s Mössbauer Spectrometer. Science 306, 1740–1745. doi:10.1126/science.1104653.
- Kokaly et al. (2017) Kokaly, R.F., Clark, R.N., Swayze, G.A., Livo, K.E., Hoefen, T.M., Pearson, N.C., Wise, R.A., Benzel, W.M., Lowers, H.A., Driscoll, R.L., Klein, A.J., 2017. USGS Spectral Library Version 7. USGS Numbered Series 1035. U.S. Geological Survey. Reston, VA. doi:10.3133/ds1035.
- Langevin et al. (2007) Langevin, Y., Bibring, J.P., Montmessin, F., Forget, F., Vincendon, M., Douté, S., Poulet, F., Gondet, B., 2007. Observations of the south seasonal cap of Mars during recession in 2004-2006 by the OMEGA visible/near-infrared imaging spectrometer on board Mars Express: OMEGA-SOUTH SEASONAL CAP OF MARS. Journal of Geophysical Research: Planets 112. doi:10.1029/2006JE002841.
- Langevin et al. (2005a) Langevin, Y., Poulet, F., Bibring, J.P., Gondet, B., 2005a. Sulfates in the North Polar Region of Mars Detected by OMEGA/Mars Express. Science 307, 1584–1586. doi:10.1126/science.1109091.
- Langevin et al. (2005b) Langevin, Y., Poulet, F., Bibring, J.P., Schmitt, B., Douté, S., Gondet, B., 2005b. Summer Evolution of the North Polar Cap of Mars as Observed by OMEGA/Mars Express. Science 307, 1581–1584. doi:10.1126/science.1109438.
- Leshin et al. (2013) Leshin, L.A., Mahaffy, P.R., Webster, C.R., Cabane, M., Coll, P., Conrad, P.G., Archer, P.D., Atreya, S.K., Brunner, A.E., Buch, A., Eigenbrode, J.L., Flesch, G.J., Franz, H.B., Freissinet, C., Glavin, D.P., McAdam, A.C., Miller, K.E., Ming, D.W., Morris, R.V., Navarro-González, R., Niles, P.B., Owen, T., Pepin, R.O., Squyres, S., Steele, A., Stern, J.C., Summons, R.E., Sumner, D.Y., Sutter, B., Szopa, C., Teinturier, S., Trainer, M.G., Wray, J.J., Grotzinger, J.P., Team, M.S., 2013. Volatile, Isotope, and Organic Analysis of Martian Fines with the Mars Curiosity Rover. Science 341. doi:10.1126/science.1238937.
- Liu et al. (2020) Liu, Y., Stachurski, F., Liu, Z., Zou, Y., 2020. Quantitative assessment of water content and mineral abundances at Gale crater on Mars with orbital observations. Astronomy & Astrophysics 637, A79. doi:10.1051/0004-6361/201937045.
- Liuzzi et al. (2020) Liuzzi, G., Villanueva, G.L., Crismani, M.M.J., Smith, M.D., Mumma, M.J., Daerden, F., Aoki, S., Vandaele, A.C., Clancy, R.T., Erwin, J., Thomas, I., Ristic, B., Lopez-Moreno, J.J., Bellucci, G., Patel, M.R., 2020. Strong Variability of Martian Water Ice Clouds During Dust Storms Revealed From ExoMars Trace Gas Orbiter/NOMAD. Journal of Geophysical Research: Planets 125, e2019JE006250. doi:10.1029/2019JE006250.
- Luginin et al. (2020) Luginin, M., Fedorova, A., Ignatiev, N., Trokhimovskiy, A., Shakun, A., Grigoriev, A., Patrakeev, A., Montmessin, F., Korablev, O., 2020. Properties of Water Ice and Dust Particles in the Atmosphere of Mars During the 2018 Global Dust Storm as Inferred From the Atmospheric Chemistry Suite. Journal of Geophysical Research: Planets 125, e2020JE006419. doi:10.1029/2020JE006419.
- Massé et al. (2010) Massé, M., Bourgeois, O., Le Mouélic, S., Verpoorter, C., Le Deit, L., Bibring, J., 2010. Martian polar and circum-polar sulfate-bearing deposits: Sublimation tills derived from the North Polar Cap. Icarus 209, 434–451. doi:10.1016/j.icarus.2010.04.017.
- Massé et al. (2012) Massé, M., Bourgeois, O., Le Mouélic, S., Verpoorter, C., Spiga, A., Le Deit, L., 2012. Wide distribution and glacial origin of polar gypsum on Mars. Earth and Planetary Science Letters 317-318, 44–55. doi:10.1016/j.epsl.2011.11.035.
- Melchiorri et al. (2007) Melchiorri, R., Encrenaz, T., Fouchet, T., Drossart, P., Lellouch, E., Gondet, B., Bibring, J.P., Langevin, Y., Schmitt, B., Titov, D., Ignatiev, N., 2007. Water vapor mapping on Mars using OMEGA/Mars Express. Planetary and Space Science 55, 333–342. doi:10.1016/j.pss.2006.05.040.
- Meslin et al. (2013) Meslin, P.Y., Gasnault, O., Forni, O., Schroder, S., Cousin, A., Berger, G., Clegg, S.M., Lasue, J., Maurice, S., Sautter, V., Le Mouelic, S., Wiens, R.C., Fabre, C., Goetz, W., Bish, D., Mangold, N., Ehlmann, B., Lanza, N., Harri, A.M., Anderson, R., Rampe, E., McConnochie, T.H., Pinet, P., Blaney, D., Leveille, R., Archer, D., Barraclough, B., Bender, S., Blake, D., Blank, J.G., Bridges, N., Clark, B.C., DeFlores, L., Delapp, D., Dromart, G., Dyar, M.D., Fisk, M., Gondet, B., Grotzinger, J., Herkenhoff, K., Johnson, J., Lacour, J.L., Langevin, Y., Leshin, L., Lewin, E., Madsen, M.B., Melikechi, N., Mezzacappa, A., Mischna, M.A., Moores, J.E., Newsom, H., Ollila, A., Perez, R., Renno, N., Sirven, J.B., Tokar, R., de la Torre, M., d’Uston, L., Vaniman, D., Yingst, A., MSL Science Team, 2013. Soil Diversity and Hydration as Observed by ChemCam at Gale Crater, Mars. Science 341, 1238670–1238670. doi:10.1126/science.1238670.
- Michalski et al. (2005) Michalski, J.R., Kraft, M.D., Sharp, T.G., Williams, L.B., Christensen, P.R., 2005. Mineralogical constraints on the high-silica martian surface component observed by TES. Icarus 174, 161–177. doi:10.1016/j.icarus.2004.10.022.
- Milliken (2020) Milliken, R., 2020. RELAB Spectral Library Bundle doi:10.17189/1519032.
- Milliken et al. (2007) Milliken, R.E., Mustard, J.F., Poulet, F., Jouglet, D., Bibring, J.P., Gondet, B., Langevin, Y., 2007. Hydration state of the Martian surface as seen by Mars Express OMEGA: 2. H2O content of the surface. Journal of Geophysical Research: Planets 112. doi:10.1029/2006JE002853.
- Murchie et al. (2000) Murchie, S., Kirkland, L., Erard, S., Mustard, J., Robinson, M., 2000. Near-infrared spectral variations of martian surface materials from ism imaging spectrometer data. Icarus 147, 444–4–71. doi:10.1006/icar.2000.6446.
- Niles et al. (2020) Niles, P.B., Delmonte, B., Baccolo, G., Snead, C., Keller, L., Michalski, J., 2020. Mechanisms for Jarosite Formation at Cryogenic Temperatures on Mars, in: Lunar and Planetary Science Conference, p. 2700.
- Niles and Michalski (2009) Niles, P.B., Michalski, J., 2009. Meridiani Planum sediments on Mars formed through weathering in massive ice deposits. Nature Geoscience 2, 215–220. doi:10.1038/ngeo438.
- Ody et al. (2012) Ody, A., Poulet, F., Langevin, Y., Bibring, J.P., Bellucci, G., Altieri, F., Gondet, B., Vincendon, M., Carter, J., Manaud, N., 2012. Global maps of anhydrous minerals at the surface of Mars from OMEGA/MEx: OMEGA/MEX MINERALOGICAL MAPS OF MARS. Journal of Geophysical Research: Planets 117, n/a–n/a. doi:10.1029/2012JE004117.
- Pimentel et al. (1974) Pimentel, G.C., Forney, P.B., Herr, K.C., 1974. Evidence about hydrate and solid water in the Martian surface from the 1969 Mariner infrared spectrometer. Journal of Geophysical Research 79, 1623–1634. doi:10.1029/JB079i011p01623.
- Poitras et al. (2018) Poitras, J., Cloutis, E., Salvatore, M., Mertzman, S., Applin, D., Mann, P., 2018. Mars analog minerals’ spectral reflectance characteristics under Martian surface conditions. Icarus 306, 50–73. doi:10.1016/j.icarus.2018.01.023.
- Pommerol et al. (2011) Pommerol, A., Beck, P., Schmitt, B., Montes-Hernandez, G., Quirico, E., 2011. Deciphering the Hydration State of the Martian Surface from Near-Infrared Spectroscopy, in: Lunar and Planetary Science Conference, p. 1890.
- Pommerol and Schmitt (2007) Pommerol, A., Schmitt, B., 2007. Near-IR bidirectional reflection spectra (i=0°/e=30°) of volcanic tuff with different amounts of adsorbed H2O at -30°C. doi:10.26302/SSHADE/EXPERIMENT_BS_20191231_001.
- Pommerol and Schmitt (2008a) Pommerol, A., Schmitt, B., 2008a. Strength of the H2O near-infrared absorption bands in hydrated minerals: Effects of measurement geometry. Journal of Geophysical Research: Planets 113. doi:10.1029/2008JE003197.
- Pommerol and Schmitt (2008b) Pommerol, A., Schmitt, B., 2008b. Strength of the H2O near-infrared absorption bands in hydrated minerals: Effects of particle size and correlation with albedo. Journal of Geophysical Research: Planets 113. doi:10.1029/2007JE003069.
- Pommerol et al. (2009) Pommerol, A., Schmitt, B., Beck, P., Brissaud, O., 2009. Water sorption on martian regolith analogs: Thermodynamics and near-infrared reflectance spectroscopy. Icarus 204, 114–136. doi:10.1016/j.icarus.2009.06.013.
- Poulet et al. (2010) Poulet, F., Arvidson, R., Bibring, J.P., Gondet, B., Jouglet, D., Langevin, Y., Morris, R., 2010. Mineralogy of the Phoenix landing site from OMEGA observations and how that relates to in situ Phoenix measurements. Icarus 205, 712–715. doi:10.1016/j.icarus.2009.10.007.
- Poulet et al. (2005) Poulet, F., Bibring, J.P., Mustard, J.F., Gendrin, A., Mangold, N., Langevin, Y., Arvidson, R.E., Gondet, B., Gomez, C., 2005. Phyllosilicates on Mars and implications for early martian climate. Nature 438, 623–627. doi:10.1038/nature04274.
- Poulet et al. (2007) Poulet, F., Gomez, C., Bibring, J.P., Langevin, Y., Gondet, B., Pinet, P., Belluci, G., Mustard, J., 2007. Martian surface mineralogy from Observatoire pour la Minéralogie, l’Eau, les Glaces et l’Activité on board the Mars Express spacecraft (OMEGA/MEx): Global mineral maps. Journal of Geophysical Research: Planets 112. doi:10.1029/2006JE002840.
- Poulet et al. (2008) Poulet, F., Langevin, Y., Boubin, G., Jouglet, D., Bibring, J.P., Gondet, B., 2008. Spectral variability of the Martian high latitude surfaces. Geophysical Research Letters 35. doi:10.1029/2008GL035450.
- Schmitt et al. (2018) Schmitt, B., Bollard, P., Albert, D., Garenne, A., Gorbacheva, M., Bonal, L., Volcke, P., the SSHADE Partner’s Consortium, 2018. SSHADE: "Solid Spectroscopy Hosting Architecture of Databases and Expertise". doi:10.26302/SSHADE.
- Schmitt and Trotta (1996) Schmitt, B., Trotta, F., 1996. Mid-IR Transmission spectra of crystalline Ih H2O ice at different temperatures (145K to 17K). doi:10.26302/SSHADE/EXPERIMENT_BS_20120924_001.
- Seelos et al. (2008) Seelos, K.D., Arvidson, R.E., Cull, S.C., Hash, C.D., Heet, T.L., Guinness, E.A., McGuire, P.C., Morris, R.V., Murchie, S.L., Parker, T.J., Roush, T.L., Seelos, F.P., Wolff, M.J., 2008. Geomorphologic and mineralogic characterization of the northern plains of Mars at the Phoenix Mission candidate landing sites. Journal of Geophysical Research 113, E00A13. doi:10.1029/2008JE003088.
- Sinton (1967) Sinton, W., 1967. On the composition of martian surface materials. Icarus 6, 222–228. doi:10.1016/0019-1035(67)90018-8.
- Smith (2004) Smith, M.D., 2004. Interannual variability in TES atmospheric observations of Mars during 1999-2003. Icarus 167, 148–165. doi:10.1016/j.icarus.2003.09.010.
- Smith (2006) Smith, M.D., 2006. TES atmospheric temperature, aerosol optical depth, and water vapor observations 1999-2004, in: Mars Atmosphere Modelling and Observations, p. 211.
- Smith et al. (2009) Smith, P.H., Tamppari, L.K., Arvidson, R.E., Bass, D., Blaney, D., Boynton, W.V., Carswell, A., Catling, D.C., Clark, B.C., Duck, T., DeJong, E., Fisher, D., Goetz, W., Gunnlaugsson, H.P., Hecht, M.H., Hipkin, V., Hoffman, J., Hviid, S.F., Keller, H.U., Kounaves, S.P., Lange, C.F., Lemmon, M.T., Madsen, M.B., Markiewicz, W.J., Marshall, J., McKay, C.P., Mellon, M.T., Ming, D.W., Morris, R.V., Pike, W.T., Renno, N., Staufer, U., Stoker, C., Taylor, P., Whiteway, J.A., Zent, A.P., 2009. H2O at the Phoenix Landing Site. Science 325, 58–61. doi:10.1126/science.1172339.
- Stcherbinine et al. (2020) Stcherbinine, A., Vincendon, M., Montmessin, F., Wolff, M.J., Korablev, O., Fedorova, A., Trokhimovskiy, A., Patrakeev, A., Lacombe, G., Baggio, L., Shakun, A., 2020. Martian Water Ice Clouds During the 2018 Global Dust Storm as Observed by the ACS-MIR Channel Onboard the Trace Gas Orbiter. Journal of Geophysical Research: Planets 125, e2019JE006300. doi:10.1029/2019JE006300.
- Sutter et al. (2012) Sutter, B., Boynton, W., Ming, D., Niles, P., Morris, R., Golden, D., Lauer, H., Fellows, C., Hamara, D., Mertzman, S., 2012. The detection of carbonate in the martian soil at the Phoenix Landing site: A laboratory investigation and comparison with the Thermal and Evolved Gas Analyzer (TEGA) data. Icarus 218, 290–296. doi:10.1016/j.icarus.2011.12.002.
- Szantai et al. (2021) Szantai, A., Audouard, J., Forget, F., Olsen, K.S., Gondet, B., Millour, E., Madeleine, J.B., Pottier, A., Langevin, Y., Bibring, J.P., 2021. Martian cloud climatology and life cycle extracted from Mars Express OMEGA spectral images. Icarus 353, 114101. doi:10.1016/j.icarus.2020.114101.
- Tanaka and Hayward (2008) Tanaka, K.L., Hayward, R.K., 2008. Mars’ North Circum-Polar Dunes: Distribution, Sources, and Migration History, in: Planetary Dunes Workshop, pp. 69–70.
- Tanaka et al. (2005) Tanaka, K.L., Skinner, J.A., Hare, T.M., 2005. Geologic Map of the Northern Plains of Mars. USGS Numbered Series 2888. U.S. Geological Survey. doi:10.3133/sim2888.
- Toner et al. (2014) Toner, J., Catling, D., Light, B., 2014. Soluble salts at the Phoenix Lander site, Mars: A reanalysis of the Wet Chemistry Laboratory data. Geochimica et Cosmochimica Acta 136, 142–168. doi:10.1016/j.gca.2014.03.030.
- Trokhimovskiy et al. (2015) Trokhimovskiy, A., Fedorova, A., Korablev, O., Montmessin, F., Bertaux, J.L., Rodin, A., Smith, M.D., 2015. Mars’ water vapor mapping by the SPICAM IR spectrometer: Five martian years of observations. Icarus 251, 50–64. doi:10.1016/j.icarus.2014.10.007.
- Trotta (1996) Trotta, F., 1996. Détermination Des Constantes Optiques de Glaces Dans l’infrarouge Moyen et Lointain : Application Aux Grains Du Milieu Interstellaire et Des Enveloppes Circumstellaires. These de doctorat. Grenoble 1.
- Vincendon et al. (2015) Vincendon, M., Audouard, J., Altieri, F., Ody, A., 2015. Mars Express measurements of surface albedo changes over 2004–2010. Icarus 251, 145–163. doi:10.1016/j.icarus.2014.10.029.
- Vincendon et al. (2010) Vincendon, M., Forget, F., Mustard, J., 2010. Water ice at low to midlatitudes on Mars. Journal of Geophysical Research: Planets 115. doi:10.1029/2010JE003584.
- Vincendon et al. (2007) Vincendon, M., Langevin, Y., Poulet, F., Bibring, J.P., Gondet, B., 2007. Recovery of surface reflectance spectra and evaluation of the optical depth of aerosols in the near-IR using a Monte Carlo approach: Application to the OMEGA observations of high-latitude regions of Mars. Journal of Geophysical Research (Planets) 112, E08S13. doi:10.1029/2006JE002845, arXiv:1103.0384.
- Vincendon et al. (2009) Vincendon, M., Langevin, Y., Poulet, F., Pommerol, A., Wolff, M., Bibring, J.P., Gondet, B., Jouglet, D., 2009. Yearly and seasonal variations of low albedo surfaces on Mars in the OMEGA/MEx dataset: Constraints on aerosols properties and dust deposits. Icarus 200, 395--405. doi:10.1016/j.icarus.2008.12.012, arXiv:1103.3426.
- Vincendon et al. (2011) Vincendon, M., Pilorget, C., Gondet, B., Murchie, S., Bibring, J.P., 2011. New near-IR observations of mesospheric CO2 and H2O clouds on Mars. Journal of Geophysical Research 116. doi:10.1029/2011JE003827.
- Wray et al. (2009) Wray, J.J., Murchie, S.L., Squyres, S.W., Seelos, F.P., Tornabene, L.L., 2009. Diverse aqueous environments on ancient Mars revealed in the southern highlands. Geology 37, 1043--1046. doi:10.1130/G30331A.1.
- Wyatt et al. (2004) Wyatt, M.B., McSween, Harry Y., J., Tanaka, K.L., Head, James W., I., 2004. Global geologic context for rock types and surface alteration on Mars. Geology 32, 645. doi:10.1130/G20527.1.