The nuclear stellar disc of the Milky Way:
A dynamically cool and metal-rich component possibly formed from the central molecular zone
Abstract
Context. The nuclear stellar disc (NSD) is, together with the nuclear star cluster (NSC) and the central massive black hole, one of the main components in the central parts of our Milky Way. However, until recently, only a few studies of the stellar content of the NSD have been obtained owing to extreme extinction and stellar crowding.
Aims. We study the kinematics and global metallicities of the NSD based on the observations of K/M giant stars via a dedicated KMOS (VLT, ESO) spectroscopic survey.
Methods. We traced radial velocities and metallicities, which were derived based on spectral indices (Na I and CO) along the NSD, and compared those with a Galactic bulge sample of APOGEE (DR16) and data from the NSC.
Results. We find that the metallicity distribution function and the fraction of metal-rich and metal-poor stars in the NSD are different from the corresponding distributions and ratios of the NSC and the Galactic bulge. By tracing the velocity dispersion as a function of metallicity, we clearly see that the NSD is kinematically cool and that the velocity dispersion decreases with increasing metallicity contrary to the inner bulge sample of APOGEE (). Using molecular gas tracers (, CO(4-3)) of the central molecular zone (CMZ), we find an astonishing agreement between the gas rotation and the rotation of the metal-rich population. This agreement indicates that the metal-rich stars could have formed from gas in the CMZ. On the other hand, the metal-poor stars show a much slower rotation profile with signs of counter-rotation, thereby indicating that these stars have a different origin.
Conclusions. Coupling kinematics with global metallicities, our results demonstrate that the NSD is chemically and kinematically distinct with respect to the inner bulge, which indicates a different formation scenario.
Key Words.:
Galaxy: nucleus, structure, stellar content – stars: fundamental parameters: abundances -infrared : stars1 Introduction
The nuclear stellar disc (NSD) is a dense stellar structure in the centre of our Milky Way. It is embedded in the bulge and surrounds the nuclear star cluster (NSC) with its central massive black hole (Launhardt et al. 2002). The NSD extends up to a radius of () with a scale height of , Launhardt et al. 2002, Nishiyama et al. 2013, Nogueras-Lara et al. 2020a, Gallego-Cano et al. 2020). It contains large amount of interstellar dust (Schultheis et al. 2009, Schödel et al. 2014, Nogueras-Lara et al. 2018a), making it necessary to study the stellar population in the infrared.
While in recent years studies were focussed on the NSC itself (see e.g. Neumayer et al. 2020, Schödel et al. 2020), very little work has been done on the NSD so far. Nuclear stellar discs are also detected in extragalactic systems and are quite common in spiral galaxies (Pizzella et al. 2002, Gadotti et al. 2019). This indicates a nuclear stellar discs have a different formation scenario (Pizzella et al. 2002).
Figer et al. (2004) determine, for the first time, the star formation history (SFH) in some pencil beam fields located in the NSD using deep HST (NICMOS) observations. These authors conclude a quasi-continuous SFH with no signs of a starburst activity. Nogueras-Lara et al. (2020a) determined the SFH of the NSD by analysing the luminosity function compared to stellar evolutionary models based on deep GALACTICNUCLEUS data (Nogueras-Lara et al. 2019). These authors find that the bulk of the stars in the NSD is old and formed at least 8 Gyr ago followed by an extended phase of quiescence and recent star formation activity about 1 Gyr ago, where 5% of the mass of the NSD was formed very quickly. With a similar technique, Schödel et al. (2020) trace the SFH of the NSC, also finding that of its stars are at least about 10 Gyr old. These authors also find signs of an intermediate-age population (), but contrary to the NSD the NSC shows no signs of star formation about 1 Gyr ago. Their results indicate different formation histories for the NSD and NSC. Schönrich et al. (2015) use the kinematics of APOGEE stars to trace the rotation velocity of the nuclear disc (), suggesting that the NSD is kinematically cool with a small vertical extent of 50 pc and a truncation radius of (see also Gallego-Cano et al. 2020). In addition, these authors show that the NSD is rotating with similar velocities as the molecular gas in the central molecular zone (CMZ), thus indicating that these two components could be linked together and that the stars in the NSD could originate from the dense CMZ gas (Sormani et al. 2020). With additional data from APOGEE DR16 (Ahumada et al. 2020) and SiO maser data of AGB stars in the inner Galaxy from Messineo et al. (2005), Sormani et al. (2020) fit axisymmetric Jeans dynamical models and determine the total mass of the NSD of , which is lower than the photometric mass found by Launhardt et al. (2002).
From a theoretical point of view, hydrodynamic simulations of Milky-Way like galaxies have shown that the formation of the bar triggers gas funnelling to the centre of the Milky Way forming a kinematically cold, rotating NSD (see e.g. Fux 1999, Li et al. 2015, Ridley et al. 2017, Sormani et al. 2018a, Sormani et al. 2018b, Sormani & Barnes 2019, Tress et al. 2020). The age distribution of the stars in the NSD can give us therefore hints about the formation epoch of the bar (Baba & Kawata 2020, Gadotti et al. 2019). These authors also show that 3D velocity information is an effective way to reduce the contamination of bulge stars in the NSD as stars in the NSD are kinematically cool in contrast to the bulge. While a lot of effort has been dedicated lately to obtaining precise chemical abundances (Rich et al. 2017, Thorsbro et al. 2020) and global metallicities in the NSC (Do et al. 2015, 2018, Feldmeier-Krause et al. 2017, 2020), very little similar work has been done so far on the NSD. Schultheis et al. (2020) use the latest APOGEE DR16 data to trace the chemistry and the kinematics of the NSD stars. The chemical abundances and the metallicity distribution function (MDF) show differences between the NSC and the NSD, suggesting a different formation scenario. However, owing to the high interstellar extinction, APOGEE could only target the brightest sources in the NSD including AGB stars and supergiant stars (Zasowski et al. 2013, 2017). Interestingly, Schultheis et al. (2020) discovered a relatively high number of supergiant stars, which is consistent with the SFH during the last 200–300 Myr (Nogueras-Lara et al. 2020a).
In this paper we use dedicated observations of the NSD obtained with the KMOS spectrometer at the ESO VLT. The detailed survey strategy and the data reduction are described in detail by Fritz et al. (2020) (paper I). For their sample of stars, these authors derive radial velocities with a median velocity error of 5 km/s. They use the NaI index and the CO index in the K band to measure global metallicities, which were calibrated against available medium- and high-resolution metallicities. We refer to paper I for a detailed description of the survey, instrument set-up, data reduction, and analysis. We use global metallicities and radial velocities to trace the chemical and kinematical properties of the NSD and compare these properties with the Galactic bulge (Ahumada et al. 2020) and the NSC (Feldmeier-Krause et al. 2020).
2 Samples
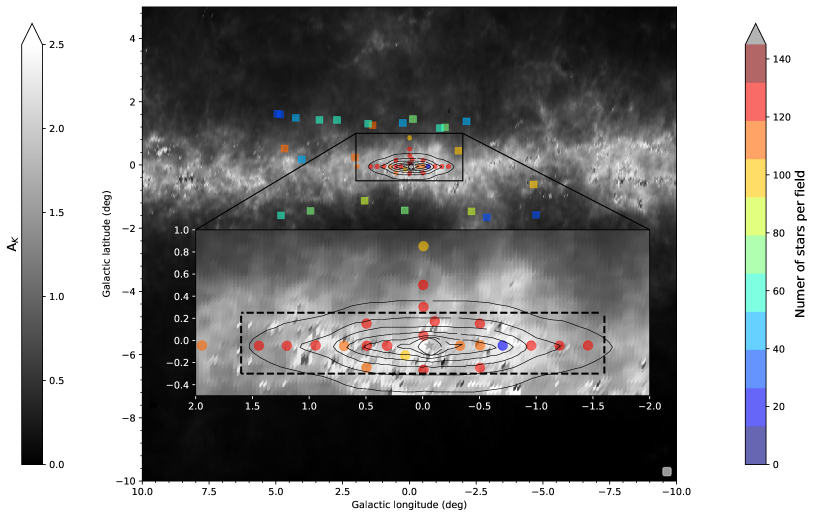
Figure 1 shows the location of our fields inside the NSD denoted by the dashed box with colours indicating the number of objects in each KMOS field. In addition four fields in the Galactic bulge were observed, three along the minor axis and one in the Galactic plane. We limited our sample to a signal-to-noise ratio (S/N) better than 30 and we used only primary targets. All stars have effective temperatures cooler than 5500 K and were selected based on the dereddened K magnitudes with , which corresponds to (see also paper I).
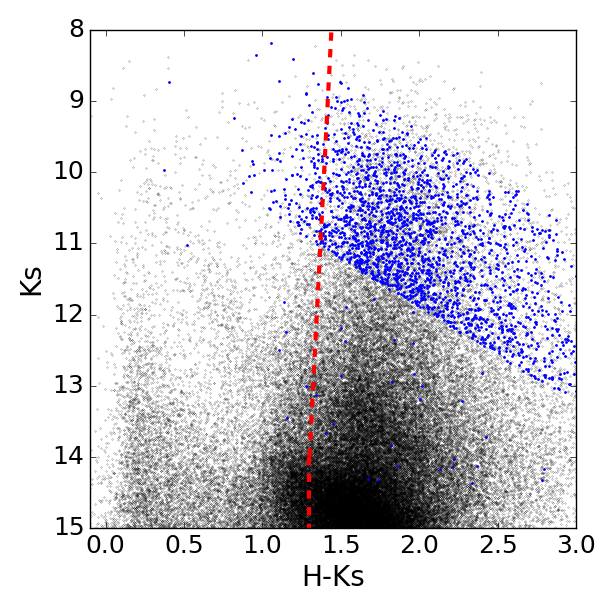
In total our bulge sample consists of 448 stars, while our NSD sample consists of 2118 stars. We used data from paper I, where part of the foreground population was excluded using colour cut H-Ks. To remove the remaining foreground sources that might affect our results, we applied more restrictive cuts following previous studies on the NSD and the innermost bulge (e.g. Nogueras-Lara et al. 2018b, Nogueras-Lara et al. 2019, Sormani et al. 2020). Given the high differential extinction (Nogueras-Lara et al. 2020b) and its variation on arcsecond scales in the Galactic centre (GC, Nogueras-Lara et al. 2018a), we applied different H-Ks cuts for each of the considered regions. Fig. 2 shows the applied colour cut for the NSD (), where the red line shows the colour cut to remove foreground stars. For the bulge fields we used variable colour cuts for each field (3,4,5 and 28) individually allowing us to avoid disc foreground and background stars.
The overall S/N is pretty high with the majority of our targets lying in the range . We transformed the heliocentric radial velocities to galactocentric velocities by assuming where is the heliocentric radial velocity and (l,b) galactic longitude and galactic latitude. We used the metallicity calibration from paper I, which depends on the equivalent width of the CO band at 2.3m and the Na I line (m). The typical standard deviation compared to their reference sample (APOGEE, XSL, FIRE) is about 0.32 dex containing most (72%) of the stars (see Fig. 10 of paper I).
As a comparison sample we took the latest APOGEE DR16 dataset (Ahumada et al. 2020) and constructed our bulge sample by applying a cut in the galactocentric distance in the same way as described in Rojas-Arriagada et al. (2020). In addition, we used the KMOS sample of K/M giants of Feldmeier-Krause et al. (2020)[FK20] located in the NSC. In order to get a consistent estimate of the metallicities, we applied our technique based on spectral indices (see paper I for a detailed description) to the dataset of the latter authors. We recall that Feldmeier-Krause et al. (2017) do a full spectral fitting (STARKIT code) by using synthetic spectra to derive the stellar parameters (, log g, and ) by obtaining the best fit of the stellar spectrum. Their mean uncertainties are , , and , respectively. However, as mentioned by Feldmeier-Krause et al. (2017) the absolute metallicities are derived from synthetic spectra extending to , but only calibrated on empirical spectra for . For this reason, metallicities at may be overestimated, while their systematic uncertainties may be underestimated. The metallicity measurements of Fritz et al. (2020) are calibrated using empirical spectra and extrapolated beyond this value. High-resolution spectroscopic studies did not find metallicities higher than 0.6 dex in the Galactic centre (see e.g. Rich et al. 2017, Thorsbro et al. 2020). Figure 3 shows a comparison between the NSC sample by FK20 and our metallicities based on the CO and NaI index (see paper I). The median difference is 0.015 dex with a standard deviation of 0.35 dex, which is smaller than the uncertainties of each of the methods assuring that there is no systematic bias introduced by our method. We note however that for very metal-rich stars (), FK20 shows significantly higher metallicities.

3 Metallicity distribution function
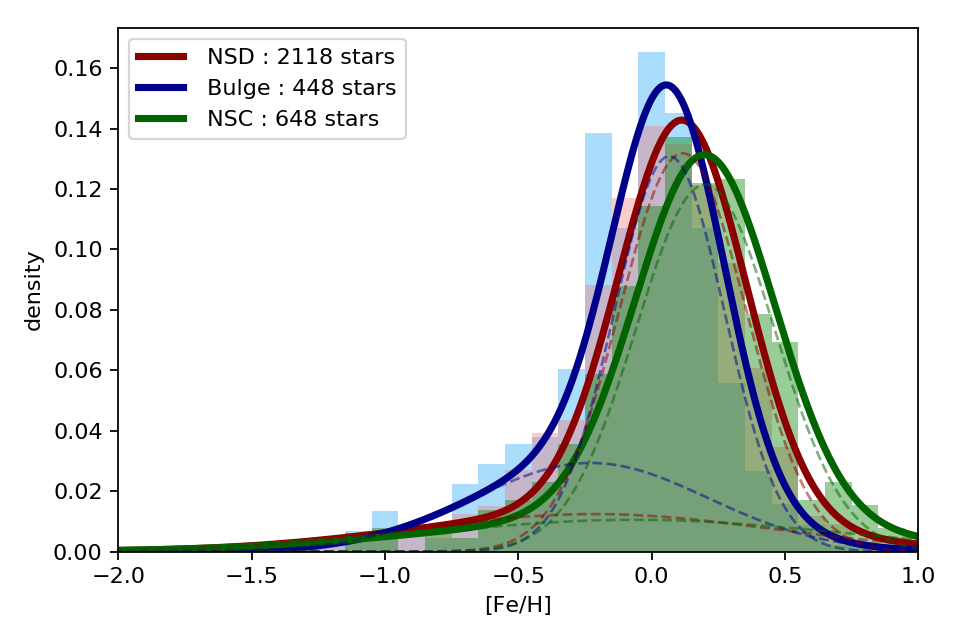
To study the MDF, we performed a Gaussian mixture modelling (GMM) decomposition, which is a parametric probability density function given by the weighted sum of a number of Gaussian components. The GMM parameters are estimated as those that show the best representation of the dataset density distribution structure. The expectation-maximisation algorithm determines the best parameters of a mixture model for a given number of Gaussian components. In order to constrain the number of Gaussians, which is a priori not known, we adopted the Bayesian information criterion (BIC). Figure 4 shows the results of our GMM analysis for our NSD sample as well as our bulge and NSC sample. In all cases the GMM gives preference to a two Gaussian component solution for the three regions. We see for the three samples (NSD, bulge, and NSC) a very prominent metal-rich peak and a much weaker metal-poor peak. When we compare our bulge MDF with that of APOGEE (Rojas-Arriagada et al. 2020), we notice that APOGEE finds three distinct Gaussian components with nearly constant metallicity positions (i.e. independent of Galactic latitude) at +0.32 dex, -0.17 dex, and -0.66 dex. While the positions of these three Gaussian components remain constant in the bulge, their relative weights vary and are responsible for the vertical variations of the density shape of the MDF. However, Rojas-Arriagada et al. (2020) also show that if we use a smaller sample of stars (e.g. 600) or they have larger metallicity uncertainties, which is the case for our sample, the three components are smoothed out to two main major peaks (metal-rich and metal-poor). This is similar to what we see in our MDF (see Fig. 4), where our metal-poor peak is less prominent than seen in APOGEE.
We note the dominant metal-rich peak (89% of the weight) of the NSC sample with a peak position of the metal-rich peak at 0.22 dex (see Tab. 1), which is 0.2 dex more metal-rich than the bulge sample and 0.1 dex compared to the NSD. We clearly see three distinct populations, and in Tab. 1 we show the corresponding values based on our GMM analysis such as the peak position and their dispersion as well as the weights. A two sample Kolmogorov-Smirnov (KS) test confirms this hypothesis where the p-values are extremely small (), indicating that we can reject the null hypothesis, and therefore the three samples do not come from the same population. We also performed a k-sample Anderson-Darling test, which confirms the findings of the KS test (p-value is ).
| MR | MP | |||||
|---|---|---|---|---|---|---|
| Bulge | 0.04 | -0.55 | 0.21 | 0.33 | 0.82 | 0.18 |
| NSD | 0.12 | -0.22 | 0.24 | 0.64 | 0.78 | 0.22 |
| NSC | 0.22 | -0.41 | 0.35 | 0.18 | 0.89 | 0.11 |
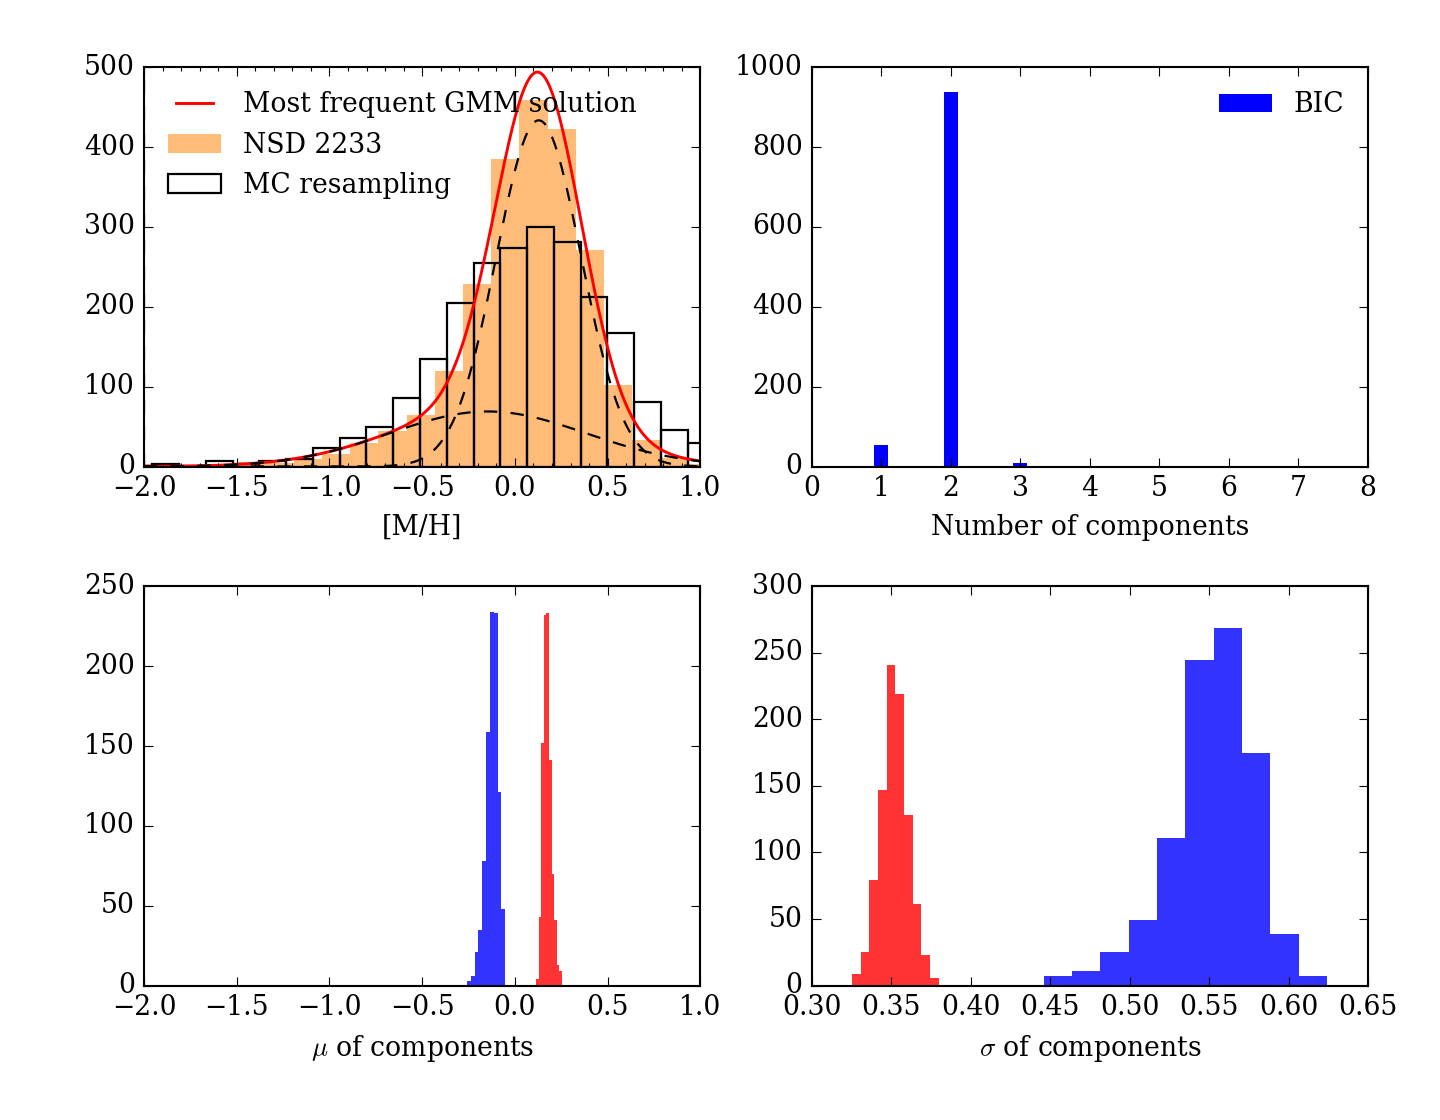
To evaluate the robustness of these solutions, we performed a Monte Carlo (MC) resampling by drawing 1000 MC resamplings of the individual metallicities for each star by assuming a typical Gaussian error of 0.3 dex in which is the error based on the calibration (see paper I). This is a conservative error since the median error is about 0.12 dex based on the S/N ratio. Figure 5 shows a typical example for the NSD, where the upper left panel shows the original dataset and a random perturbation of the original distribution. The most frequent GMM solution is also indicated together with their individual Gaussian components. The GMM parametrisation was calculated 1000 times considering mixtures with N=1-8 Gaussian components and using the BIC to identify the best model in each case. As shown on the right upper panel, a bimodal solution was found to be in 95% cases the optimal solution. The lower panels in Fig. 5 show the distributions of the centroids and the widths of the individual Gaussian components as fitted to each of the 1000 MC resamplings. The narrowness of these distributions indicates that the individual Gaussian component parameters are robust over the MC resampling and that in general the observed density distribution can be fairly well described by a mixture of two Gaussians.
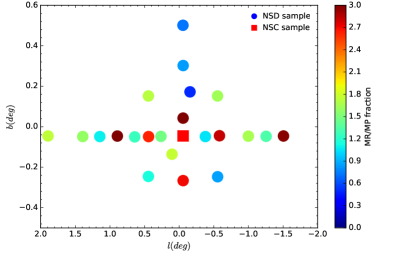
We split our samples into two large metallicity bins, a metal-rich sample (MR) with , and a metal-poor sample (MP) with , similar to how it was done for the GIBS data by Zoccali et al. (2017) or Schultheis et al. (2019) for the inner Galactic bulge, including the Galactic centre. In Fig. 6, we trace the fraction of MR to MP stars as a function of Galactic longitude and latitude. We note that at higher latitudes the MP fraction increases, while for the majority of the fields in the NSD the MR fraction is rather high (see also Sect. 3.1). Interestingly, we find a rather large variation of the MR/MP fraction inside the NSD with a variation of up to nearly a factor of 10. We do not find any hint of an asymmetric distribution in the MR/MP ratio in the NSD as was found recently on much smaller scales in the NSC by FK20. In particular, we do not see any difference in the MDF between negative and positive Galactic longitudes; a KS test results in a high p-value of 0.5. We conclude therefore that we are dealing with a symmetric behaviour in the chemistry of the NSD.
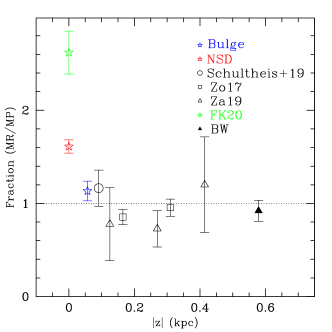
As shown in Fig. 4, the Gaussian decomposition of the MDF in the NSD, the bulge comparison field, and the NSC seem to show distinct Gaussian components. Figure 7 shows a compilation of the inner bulge data from different literature works taken from Schultheis et al. (2019) updated with our work, the NSD, the bulge field, and the NSC (FK20). As already discussed in Schultheis et al. (2019), the fields in the bulge show a nearly constant fraction of about 50% of MR and MP stars. Our bulge comparison field perfectly agrees with this number. The corresponding error bars were calculated as , where f is the number ratio of MR to MP stars and MR the number of MR stars. We see that for the NSD the fraction of MR to MP stars rises up to 1.5, while for the NSC we see an extremely high fraction of metal-rich stars as already pointed out by Schultheis et al. (2019), Do et al. (2015), Feldmeier-Krause et al. (2017), and FK20. We note that to be consistent we applied the same method to derive metallicities as in our NSD and bulge samples for the NSC sample. Figure 7 affirms our conclusion that the three components are chemically distinct with a steadily increasing fraction of MR stars for the bulge, the NSD, and the NSC, respectively.
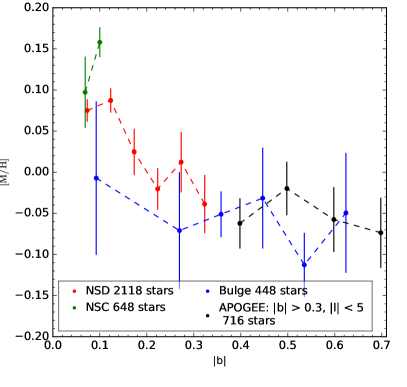
In Fig. 8 we trace the vertical metallicity gradient of each of the three components. We firstly note that we see a negative metallicity gradient for the NSD with a slope of dex/deg, which is much steeper than our comparison bulge field with a slope of dex/deg. Owing to the small scale height of the NSD (), the vertical gradient could be due to an increasing contamination with bulge stars. For comparison we also show APOGEE stars in the bulge within , where we see a slope of dex/deg, which is in general in good agreement between APOGEE and our low-resolution bulge sample. As already shown by Rich et al. (2007), Nogueras-Lara et al. (2018b), and Schultheis et al. (2019), we confirm the flat metallicity gradient in the inner bulge. On the contrary, the NSC shows a distinct behaviour being more metal-rich and no signs of a negative gradient (see also FK20). We also checked for radial (i.e. longitudinal) metallicity gradients by folding the data with respect to the minor axis. We do not detect any gradient and therefore the NSD seems to be radially homogeneous in metallicity.
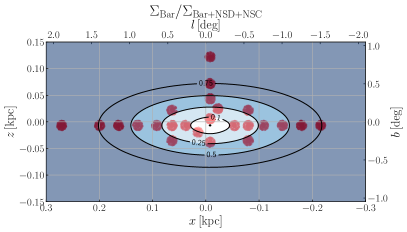
To better quantify the contamination of stars not belonging to the NSD (i.e. belonging to the bulge/bar), we use models of the Galactic bulge and bar, the NSD, and the NSC indicated in Fig. 9. This figure shows the surface density ratio of the bulge/bar model from Section 4.2 of Launhardt et al. (2002) to the sum of the fiducial NSD model (model 3) of Sormani et al. (2020), the best fitting NSC model of Chatzopoulos et al. (2015), and the bulge/bar model in Launhardt et al. (2002). Assuming that the probability of a given star ending up in our sample is independent of the star belonging to the bar/bulge or to the NSD, this ratio can be taken as a crude estimation of the expected contamination due to bulge/bar stars in the sample along each line of sight. While the contamination rate is low in the inner parts of the NSD (ratio smaller than 0.25), the ratio reaches 0.5 (corresponding to a expected contamination of 50%) around longitude 1 deg, meaning that we expect a significant contamination in the outer parts of the disc.
.
4 Metallicity and kinematics
Schönrich et al. (2015) showed based on APOGEE data that the NSD shows a clear signature of rotation. Our larger dataset confirms this rotation as seen in Fig. 10. While the black line shows the full dataset, we split our sample (see Sect. 3) into a MR and MP sample. We note at this point a clearly faster rotation for the MR stars compared to the MP with the most metal-rich stars in our sample () showing the highest rotation velocities (see Sect. 4.1 for a further discussion). Contrary to Schultheis et al. (2020) and Schönrich et al. (2015), we cover in this work the full spatial range of the NSD allowing us to trace more precisely the rotation pattern of the NSD. In Tab. 2, we list the obtained slopes for different metallicity regimes, their associated errors, and the rotation velocities assuming a disc length of 100 pc (column 4) and 150 pc (column 5), respectively. Assuming a disc length of 100 pc would result in a rotation velocity of 85 km/s for the MR part and 30 km/s for the MP component much slower than found in Schultheis et al. (2020). Interestingly, stars with (magenta line) show a very flat rotation with signs of a counter-rotating pattern, which could be a sign of a different origin of this metal-poor population such as by accretion from disrupted stellar clusters (Tsatsi et al. 2017). The typical uncertainties in the rotational velocities (see also column 3 of Tab. 2) is of the order of . On the other hand, some of these stars could be on elongated x1-like orbits that belong to the Galactic bar (Molloy et al. 2015, Aumer & Schönrich 2015, Sormani et al. 2015). We evaluate the statistical significance of the potential negative slope of the velocity trend of these metal-poor stars. We computed 1000 MC resamplings of the points, given their uncertainties, and from them estimated the standard error of the slope. Based on the slope and its standard error, we computed a one-sided value for the null hypothesis of a flat or positive slope with respect to the alternative hypothesis of a negative one. The resulting value of 0.13 implies that we cannot reject the null hypothesis to the 5% nor to the 10% of significance level. To further quantify this, we computed the 70% confidence interval of the measured slope and found a range of (-13.8, -0.3), which is consistent with a negative slope to that confidence level. We can see that although our data suggest some evidence of a negative slope, the result is not conclusive and further data will be needed to settle this issue. Do et al. (2020) recently found evidence of a kinematically and chemically distinct metal-poor component in the NSC, where the MP component rotates faster than the MR component, which could be a remnant of a massive star cluster formed a few kiloparsec away from the Galactic centre (Tsatsi et al. 2017, Arca Sedda et al. 2020). On the other hand, the metal-poor population could be similar to the non-rotating, old, metal-poor component of the bulge (Kunder et al. 2020).
Counter-rotating nuclear stellar discs are also observed in extragalactic systems such as the central disc of NGC 4458, which is counter-rotating. This disc is old, metal-rich, and alpha-enhanced (Morelli et al. 2004). The NSD of NGC 4478 is also counter-rotating with respect to its host galaxy but is younger and more metal-rich. To account for the counter-rotation, an external origin of the gas has been claimed. (Morelli et al. 2004). Precise proper motion measurements together with detailed dynamical modelling and resulting orbital calculations would be essential to trace the origin of these metal-poor stars.
| slope | ||||
|---|---|---|---|---|
| full | 46.9 | 8.7 | 67.7 | 45.1 |
| 20.2 | 9.7 | 29.1 | 19.4 | |
| 20.3 | 6.7 | 29.6 | 19.5 | |
| 62.9 | 9.8 | 90.8 | 60.5 | |
| 73.5 | 13.2 | 106.1 | 70.7 | |
| -7.0 | 10.5 | -10.1 | -6.7 |
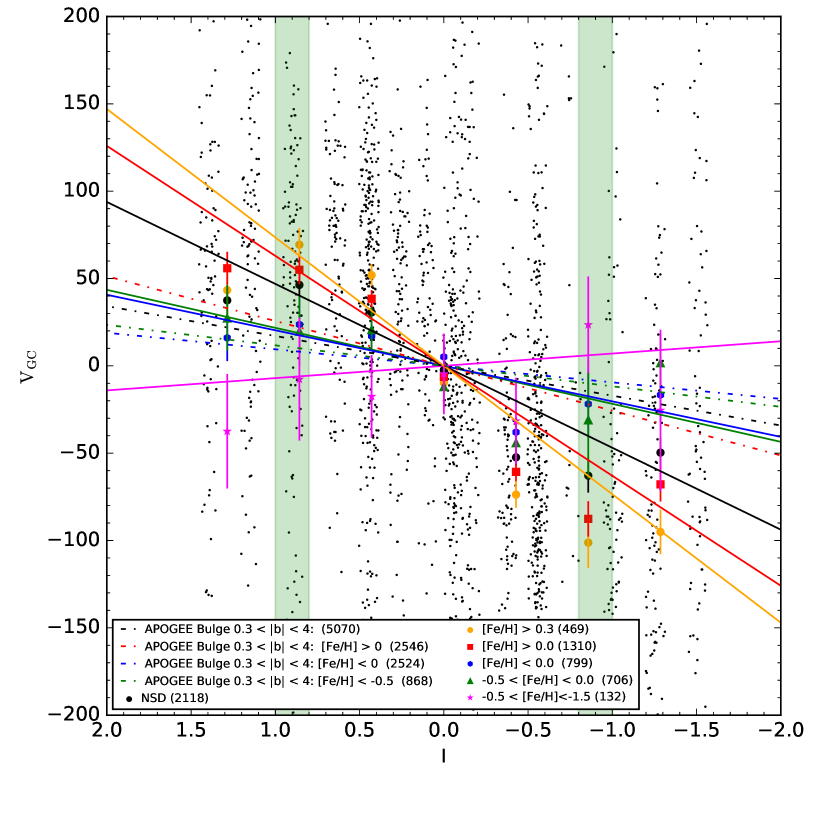
For comparison, we show in Fig. 10 a Galactic bulge sample of APOGEE DR16 stars selected in the same way as described in Rojas-Arriagada et al. (2020), covering the latitude range and and cutting at the galactocentric distance of ; this ensures a pure inner bulge sample in which we exclude the NSD component. The APOGEE bulge sample shows a small difference in the rotation velocity between metal-rich and metal-poor stars. We find a slope of for the metal-rich stars, while for stars with and a slope of and , respectively. Recent studies of the rotation curve of the Galactic bulge already revealed this difference in the rotation velocity as a function of metallicity, that is metal-rich stars rotate faster than metal-poor stars (see e.g. Clarkson et al. 2018, Rojas-Arriagada et al. 2020). Clarkson et al. (2018) speculate that this could be due to the bar formation, which would lead to a higher fraction of metal-rich stars showing more elongated orbits compared to metal-poor stars. This would be also consistent with the fact that the X-shape structure of the bulge contains mostly metal-rich stars, indicating different orbital motions between MR and MP stars (see e.g. Babusiaux et al. 2010, Ness et al. 2013, Rojas-Arriagada et al. 2017). However, based on Fig. 10 we see a much more pronounced difference in the rotation velocity between the MR and the MP population indicating that the NSD shows a kinematically distinct structure with respect to the Galactic bulge with a much faster rotation than the bulge. We also see a clear drop in the galactocentric velocities at around (shown in Fig. 10 as the green area), which indicates the radius of the NSD. We see a similar feature from star counts ( Nishiyama et al. 2013) declining steeply from 0.6–0.8 degrees outwards, suggesting a smaller disc length. The MP population seems to be dominated by bulge-like kinematics (see Fig. 10, Fig. 13), which is very similar to that seen in Galactic bulge studies (e.g. Rojas-Arriagada et al. 2020). In order to disentangle the combined MP population of bulge and NSD, proper motions would be necessary.
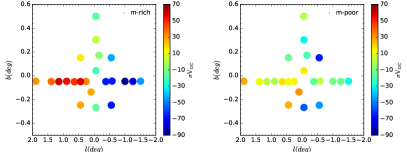
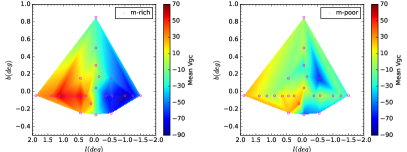
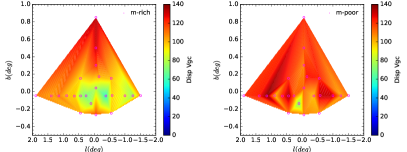
Figure 11 shows the galactocentric radial velocity of our sample separated into a MR sample (left panel) and a MP sample (right panel). For illustration purposes we also show a linear interpolation of our dataset using a rectangular grid and displaying the contour surfaces. The MR sample shows a clearly pronounced rotation pattern around the minor axis. This pattern is a well-known characteristic for the Galactic bulge studies (see e.g. Zoccali et al. 2014, Zasowski et al. 2016) and for the latest updated APOGEE data release by Rojas-Arriagada et al. (2020). However, we note a much more uniform rotation pattern with a much slower rotation for the MP component, as shown in Fig. 10.
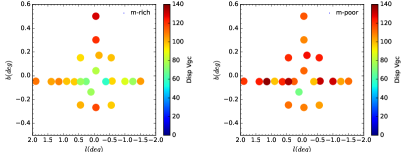
The patterns of the velocity dispersion (see Fig. 12) also show some significant differences between the MR and MP components. In general, we see that the velocity dispersion decreases with increasing metallicity, that is the most metal-rich stars are dynamically cool. A similar picture on a more global scale extended to the Galactic bulge was carried out by Zoccali et al. (2017) using GIBS data, whereas in this work we concentrate on the inner degree where the GIBS data only have one data point. Our map (see lower panel of Fig. 12) nicely shows some structures with low velocity dispersion for the MR population within in Galactic latitude where the dispersion is highest at higher Galactic latitudes with a pronounced enhancement at around . This would be the spatial limit of the NSD, indicating that the NSD might have in general a lower velocity dispersion and is therefore kinematical cooler than the Galactic bulge. The MP population shows in general a higher radial velocity dispersion in the bulge, but shows for the NSD some low velocity dispersion windows that match the kinematically cool component of the MR part in the NSD.
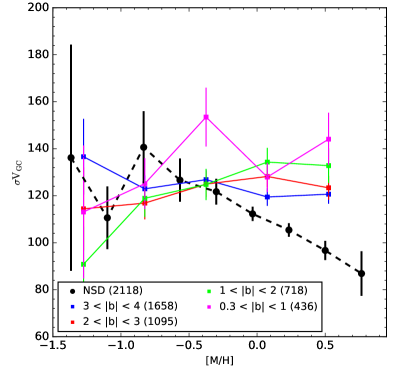
We then ask if we see any trend of the kinematic behaviour with the global metallicity. We trace in Fig. 13 the velocity dispersion as a function of metallicity. As a comparison sample we take the latest APOGEE DR16 dataset (Ahumada et al. 2020) and constructed our bulge sample by applying a cut in galactocentric distance in the same way as described in Rojas-Arriagada et al. (2020). We show in Fig. 13 the APOGEE bulge data sample at different Galactic latitudes, , , , and , and our NSD sample in black. As already noted by Zoccali et al. (2017) and Rojas-Arriagada et al. (2020), we see a higher velocity dispersion for metal-poor stars than for metal-rich stars for stars at . For we see that the curves get flatter resulting in a similar velocity dispersion for MP and MR stars, while for we clearly see an inverse trend in the sense that the velocity dispersion increases with higher metallicity. A similar trend is already noted by Zoccali et al. (2017) where they find based on GIBS data a reverted behaviour for stars closer to the plane at around . Their sample is just split up into two metallicity bins (MR and MP with super and sub-solar metallicities). However Fig. 13 shows the trend in absolute metallicities , where our NSD sample is indicated by the black-dashed line showing an opposite trend in the sense that the velocity dispersion decreases with increasing metallicity and where clearly the bulk of our metal-rich stars are kinematically cool compared to the bulge sample. This is a strong indication that the NSD is chemically and kinematically a distinct component from the Galactic bulge for metallicities , while for metal-poorer stars with the correlation between metallicity and velocity dispersion overlaps with the Galactic bulge.
4.1 Possible formation of metal-rich stars of the NSD in the CMZ
The CMZ is spatially associated with the NSD. The molecular gas in the CMZ is characterised by its high kinetic temperature and a much higher density compared to other star forming regions in the Galaxy. To compare the kinematics of the gas with that of the stellar content, we use two tracers of the gas: First, the molecule, which is ubiquitous and traces all the molecular gas, especially in high density regions such as the CMZ (Ao et al. 2013). Ginsburg et al. (2016) mapped the inner 300 pc of the CMZ with the J=3–2 para-formaldehyde (p-) transition using the APEX-1 instrument on the Atacama Pathfinder Experiment (APEX) telescope. These data are publicly available and we retrieved the positions (in Galactic coordinates) and the velocities, which have been transformed to the galactocentric velocities. The spectral resolution is about 30 with about 1 km/s resolution in velocity. Second, the CO (J=4–3) data at 461.041 GHz from the AST/RO survey of Martin et al. (2004), which is found to be coextensive with lower J transitions of CO (e.g J=1-0). The data span the longitude range of and a latitude range of . The angular resolution is about 2′, which is lower than other general surveys in the GC region; but these data have the advantage that they are publicly available. We used the FITS datacubes and extracted along each pixel in (l,b) the velocity information, which we again transformed to the galactocentric system.
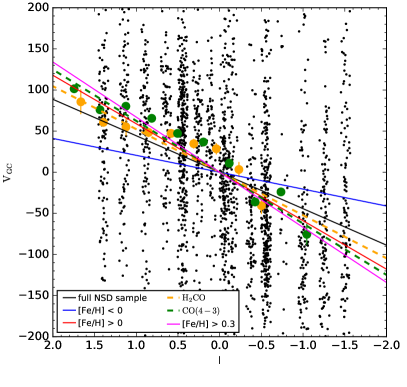
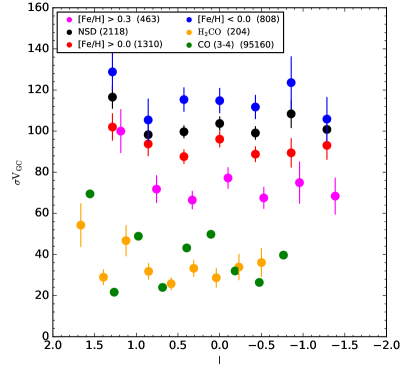
Figure 14 shows a similar diagram as in Fig. 10, where we now include the molecular gas of the CMZ, both the CO (J=4-3) and the molecule. We see that both tracers show very similar rotation pattern (left panel) with similar velocity dispersions (right panel), although the CO molecule shows a larger variation in the velocity dispersion compared to which could be due to the lower spatial resolution of the CO(J=4-3) data. In addition, we show the rotation curve of super metal-rich stars () in magenta. By comparing the rotation velocities of the molecular gas, we see from Fig. 14 (left panel) that the molecular gas clearly shows similar rotation patterns to our MR populations. This could be an indication that the MR stars originate from the CMZ. On the right panel the velocity dispersions of our NSD sample as well of the molecular gas are shown where we see that the mean velocity dispersion of the gas is of the order of 30-40 km/s, which is in very good in agreement with other literature studies (see e.g. Morris& Serabyn 1996, Güsten & Philipp 2004), while the MR stars are kinematically hotter with velocity dispersions of the order of . Mackereth et al. (2019) trace age-velocity dispersion relation in the disc and find that for the inner disc the stellar populations are dynamically heated both by giant molecular clouds and spiral arms. The CMZ is well known to have a high density of molecular clouds with unusually high densities on spatial scales of about 1 pc (Kauffmann et al. 2017). This could be the cause of the higher dispersion of the stars compared to the gas.
Nogueras-Lara et al. (2020a) find some evidence of a recent star formation burst 1 Gyr ago, which could be linked to the formation of the most metal-rich stars. Measurements of the interstellar medium in the Galactic centre also indicate super -solar metallicities (Shields & Ferland 1994, Maeda et al. 2002).
4.2 Formation mechanisms and their link to extragalactic nuclear discs
Galactic bars play a major role in galaxy formation and evolution. They have been identified at high redshifts (Simmons et al. 2014), suggesting that bars influence the evolution of their host galaxies over long timescales up to 10 Gyr. There is now more and more proof that the bar drives the formation of the so-called boxy/peanut bulges owing to the secular internal evolution of the disc (Combes et al. 1990). In addition, bars can create substructures in the nuclear region of disc galaxies such as nuclear discs and nuclear rings by redistributing angular momentum (Combes & Gerin 1985). There is now growing evidence that nuclear discs and nuclear rings are built from gas that was funnelled to the centre by the bar (see e.g. Athanassoula 1992, Kim et al. 2011, Fragkoudi et al. 2016). However, it is still unclear which physical mechanism determines the size of these structures. Gadotti et al. (2020) find correlations between the bar length and the size of nuclear discs and nuclear rings.
Another formation scenario of nuclear discs could be initiated by galaxy mergers (Mayer et al. 2008, Eliche-Moral et al. 2011 Chapon et al. 2013). However, galaxy mergers fail to reproduce the sizes of typically observed nuclear discs in nearby galaxies (such as the MUSE TIMER project Gadotti et al. 2019) and they cannot reproduce the detailed kinematical maps as discussed in Gadotti et al. (2020).
In our work, we see that metal-poor stars show a very similar kinematical behaviour with as the Galactic bulge and it is most likely that the metal-poor population of the NSD overlaps strongly with the Galactic bulge. The metal-rich stars () are dynamically cold with a must faster rotation pattern than the bulge and they seem to show a very distinct kinematics compared to the bulge population. This is what is expected if the nuclear disc has formed from a bar-driven secular evolution process.
We see a similar behaviour when comparing with extragalactic nuclear discs. Gadotti et al. (2020) find that extragalactic nuclear discs have dynamically distinct features with respect to the main galaxy disc: faster rotation and lower velocity dispersion with near-circular orbits. The TIMER survey also indicates that the nuclear disc is a separate component from the main galactic disc. In terms of chemistry, the TIMER project suggests (Bittner et al. 2020) that nuclear discs are metal-richer and younger with lower abundances than their surroundings (see their Fig. 5).
Age dating such as isotopic ratios of as well as elements and iron-peak elements using high-resolution spectroscopy would be essential to study the detailed formation history of the NSD. The forthcoming new generation of instruments such as CRIRES+ or MOONS at the VLT will allow us to determine ages and therefore trace the detailed SFH in the NSD.
5 Conclusions
Using a KMOS survey of 2118 stars located in the NSD, We trace the metallicities and kinematics by comparing this survey with the NSC and a bulge comparison sample. We find that
-
i)
The MDF of the NSD is more metal-rich than the bulge sample and less metal-rich than the NSC sample. A KS test confirms that these three samples do not come from the same population.
-
ii)
Splitting the sample into metal-rich () and metal-poor populations (), the fraction of MR to MP stars is about 1 for the bulge, while this fraction increases to 1.6 for the NSD and reaches a peak of 2.6 for the NSC. This confirms the distinction in chemistry for these three populations.
-
iii)
Bulge stars are in general kinematically hot while the NSD shows a kinematically cool component, where the velocity dispersion decreases with increasing metallicity contrary to the Galactic bulge.
-
iv)
The metal-rich population rotates faster than the metal-poor component.
We use molecular gas tracers such as CO(3-4) and and find evidence that the gas rotation velocity corresponds suprisingly well with those of the MR population in the NSD. This is a strong argument that the metal-rich stars have been formed in the CMZ, while in contrast the metal-poor population with a much lower rotation velocity might have a different origin. We conclude that the NSD is chemically and kinematically distinct to the Galactic bulge and the NSC, and that its formation is most likely not related to the NSC or the bulge. Comparing our results with the TIMER survey, we find similar properties of extragalactic nuclear discs and the Milky Way NSD, that is a dynamically cold, fast rotating and metal-rich distinct component from the surrounding disc or bulge.
This agrees with the findings of Nogueras-Lara et al. (2020a), in which they clearly identify a different and very specific SFH compared to the Galactic bulge and the NSC. In the future, precise chemical abundances in the NSD will be required to confirm our findings.
Acknowledgements.
MS acknowledges the Programme National de Cosmologie et Galaxies (PNCG) of CNRS/INSU, France, for financial support. We want to thank Karl Menten for discussing the molecular gas data. R. S. acknowledges financial support from the State Agency for Research of the Spanish MCIU through the “Center of Excellence Severo Ochoa” award for the Instituto de Astrofísica de Andalucía (SEV-2017-0709). R. S. acknowledges financial support from national project PGC2018-095049-B-C21 (MCIU/AEI/FEDER, UE). FNL and NN acknowledge funding by the Deutsche Forschungsgemeinschaft (DFG, German Research Foundation) – Project-ID 138713538 – SFB 881 (“The Milky Way System”, subproject B08). MCS acknowledges financial support from the German Research Foundation (DFG) via the collaborative research center (SFB 881,Project-ID 138713538) “The Milky Way System” (subprojects B1, B2, and B8) and from the European Research Council via the ERC Synergy Grant “ECOGAL – Understanding our Galactic ecosystem: from the disc of the Milky Way to the formation sites of stars and planets” (grant855130). ARA acknowledges support from FONDECYT through grant 3180203.References
- Ahumada et al. (2020) Ahumada, R., Allende Prieto, C., Almeida, A., et al. 2020, ApJS, 249, 3
- Ao et al. (2013) Ao, Y., Henkel, C., Menten, K. M., et al. 2013, A&A, 550, A135
- Arca Sedda et al. (2020) Arca Sedda, M., Gualandris, A., Do, T., et al. 2020, ApJ, 901, L29
- Athanassoula (1992) Athanassoula, E. 1992, MNRAS, 259, 345
- Aumer & Schönrich (2015) Aumer, M. & Schönrich, R. 2015, MNRAS, 454, 3166
- Baba & Kawata (2020) Baba, J. & Kawata, D. 2020, MNRAS, 492, 4500
- Babusiaux et al. (2010) Babusiaux, C., Gómez, A., Hill, V., et al. 2010, A&A, 519, A77
- Bittner et al. (2020) Bittner, A., Sánchez-Blázquez, P., Gadotti, D. A., et al. 2020, A&A, 643, A65
- Chapon et al. (2013) Chapon, D., Mayer, L., & Teyssier, R. 2013, MNRAS, 429, 3114
- Chatzopoulos et al. (2015) Chatzopoulos, S., Fritz, T. K., Gerhard, O., et al. 2015, MNRAS, 447, 948
- Clarkson et al. (2018) Clarkson, W. I., Calamida, A., Sahu, K. C., et al. 2018, ApJ, 858, 46
- Combes et al. (1990) Combes, F., Debbasch, F., Friedli, D., & Pfenniger, D. 1990, A&A, 233, 82
- Combes & Gerin (1985) Combes, F. & Gerin, M. 1985, A&A, 150, 327
- Do et al. (2020) Do, T., David Martinez, G., Kerzendorf, W., et al. 2020, ApJ, 901, L28
- Do et al. (2018) Do, T., Kerzendorf, W., Konopacky, Q., et al. 2018, ApJ, 855, L5
- Do et al. (2015) Do, T., Kerzendorf, W., Winsor, N., et al. 2015, ApJ, 809, 143
- Eliche-Moral et al. (2011) Eliche-Moral, M. C., González-García, A. C., Balcells, M., et al. 2011, A&A, 533, A104
- Feldmeier-Krause et al. (2020) Feldmeier-Krause, A., Kerzendorf, W., Do, T., et al. 2020, MNRAS
- Feldmeier-Krause et al. (2017) Feldmeier-Krause, A., Kerzendorf, W., Neumayer, N., et al. 2017, MNRAS, 464, 194
- Figer et al. (2004) Figer, D. F., Rich, R. M., Kim, S. S., Morris, M., & Serabyn, E. 2004, ApJ, 601, 319
- Fragkoudi et al. (2016) Fragkoudi, F., Athanassoula, E., & Bosma, A. 2016, MNRAS, 462, L41
- Fritz et al. (2020) Fritz, T. K., Patrick, L., Feldemier-Krause, A., et al. 2020, arXiv e-prints, arXiv:3494084
- Fux (1999) Fux, R. 1999, A&A, 345, 787
- Gadotti et al. (2020) Gadotti, D. A., Bittner, A., Falcón-Barroso, J., et al. 2020, A&A, 643, A14
- Gadotti et al. (2019) Gadotti, D. A., Sánchez-Blázquez, P., Falcón-Barroso, J., et al. 2019, MNRAS, 482, 506
- Gallego-Cano et al. (2020) Gallego-Cano, E., Schödel, R., Nogueras-Lara, F., et al. 2020, A&A, 634, A71
- Ginsburg et al. (2016) Ginsburg, A., Henkel, C., Ao, Y., et al. 2016, A&A, 586, A50
- Gonzalez et al. (2012) Gonzalez, O. A., Rejkuba, M., Zoccali, M., et al. 2012, A&A, 543, A13
- Kauffmann et al. (2017) Kauffmann, J., Pillai, T., Zhang, Q., et al. 2017, A&A, 603, A89
- Kim et al. (2011) Kim, S. S., Saitoh, T. R., Jeon, M., et al. 2011, ApJ, 735, L11
- Kunder et al. (2020) Kunder, A., Pérez-Villegas, A., Rich, R. M., et al. 2020, AJ, 159, 270
- Launhardt et al. (2002) Launhardt, R., Zylka, R., & Mezger, P. G. 2002, A&A, 384, 112
- Li et al. (2015) Li, Z., Shen, J., & Kim, W.-T. 2015, ApJ, 806, 150
- Mackereth et al. (2019) Mackereth, J. T., Bovy, J., Leung, H. W., et al. 2019, MNRAS, 489, 176
- Maeda et al. (2002) Maeda, Y., Baganoff, F. K., Feigelson, E. D., et al. 2002, ApJ, 570, 671
- Martin et al. (2004) Martin, C. L., Walsh, W. M., Xiao, K., et al. 2004, ApJS, 150, 239
- Mayer et al. (2008) Mayer, L., Kazantzidis, S., & Escala, A. 2008, Mem. Soc. Astron. Italiana, 79, 1284
- Messineo et al. (2005) Messineo, M., Habing, H. J., Menten, K. M., et al. 2005, A&A, 435, 575
- Molloy et al. (2015) Molloy, M., Smith, M. C., Evans, N. W., & Shen, J. 2015, ApJ, 812, 146
- Morelli et al. (2004) Morelli, L., Halliday, C., Corsini, E. M., et al. 2004, MNRAS, 354, 753
- Nagayama et al. (2003) Nagayama, T., Nagashima, C., Nakajima, Y., et al. 2003, in Society of Photo-Optical Instrumentation Engineers (SPIE) Conference Series, Vol. 4841, Instrument Design and Performance for Optical/Infrared Ground-based Telescopes, ed. M. Iye & A. F. M. Moorwood, 459–464
- Ness et al. (2013) Ness, M., Freeman, K., Athanassoula, E., et al. 2013, MNRAS, 430, 836
- Neumayer et al. (2020) Neumayer, N., Seth, A., & Böker, T. 2020, A&A Rev., 28, 4
- Nishiyama et al. (2006) Nishiyama, S., Nagata, T., Kusakabe, N., et al. 2006, ApJ, 638, 839
- Nishiyama et al. (2013) Nishiyama, S., Yasui, K., Nagata, T., et al. 2013, ApJ, 769, L28
- Nogueras-Lara et al. (2018a) Nogueras-Lara, F., Gallego-Calvente, A. T., Dong, H., et al. 2018a, A&A, 610, A83
- Nogueras-Lara et al. (2018b) Nogueras-Lara, F., Schödel, R., Dong, H., et al. 2018b, A&A, 620, A83
- Nogueras-Lara et al. (2019) Nogueras-Lara, F., Schödel, R., Gallego-Calvente, A. T., et al. 2019, A&A, 631, A20
- Nogueras-Lara et al. (2020a) Nogueras-Lara, F., Schödel, R., Gallego-Calvente, A. T., et al. 2020a, Nature Astronomy, 4, 377
- Nogueras-Lara et al. (2020b) Nogueras-Lara, F., Schödel, R., Neumayer, N., et al. 2020b, A&A, 641, A141
- Pizzella et al. (2002) Pizzella, A., Corsini, E. M., Morelli, L., et al. 2002, ApJ, 573, 131
- Rich et al. (2007) Rich, R. M., Origlia, L., & Valenti, E. 2007, ApJ, 665, L119
- Rich et al. (2017) Rich, R. M., Ryde, N., Thorsbro, B., et al. 2017, AJ, 154, 239
- Ridley et al. (2017) Ridley, M. G. L., Sormani, M. C., Treß, R. G., Magorrian, J., & Klessen, R. S. 2017, MNRAS, 469, 2251
- Rojas-Arriagada et al. (2017) Rojas-Arriagada, A., Recio-Blanco, A., de Laverny, P., et al. 2017, A&A, 601, A140
- Rojas-Arriagada et al. (2020) Rojas-Arriagada, A., Zasowski, G., Schultheis, M., et al. 2020, MNRAS, 499, 1037
- Schödel et al. (2014) Schödel, R., Feldmeier, A., Kunneriath, D., et al. 2014, A&A, 566, A47
- Schödel et al. (2020) Schödel, R., Nogueras-Lara, F., Gallego-Cano, E., et al. 2020, A&A, 641, A102
- Schönrich et al. (2015) Schönrich, R., Aumer, M., & Sale, S. E. 2015, ApJ, 812, L21
- Schultheis et al. (2019) Schultheis, M., Rich, R. M., Origlia, L., et al. 2019, A&A, 627, A152
- Schultheis et al. (2020) Schultheis, M., Rojas-Arriagada, A., Cunha, K., et al. 2020, A&A, 642, A81
- Schultheis et al. (2009) Schultheis, M., Sellgren, K., Ramírez, S., et al. 2009, A&A, 495, 157
- Shields & Ferland (1994) Shields, J. C. & Ferland, G. J. 1994, ApJ, 430, 236
- Simmons et al. (2014) Simmons, B. D., Melvin, T., Lintott, C., et al. 2014, MNRAS, 445, 3466
- Sormani & Barnes (2019) Sormani, M. C. & Barnes, A. T. 2019, MNRAS, 484, 1213
- Sormani et al. (2015) Sormani, M. C., Binney, J., & Magorrian, J. 2015, MNRAS, 449, 2421
- Sormani et al. (2020) Sormani, M. C., Magorrian, J., Nogueras-Lara, F., et al. 2020, MNRAS, 499, 7
- Sormani et al. (2018a) Sormani, M. C., Sobacchi, E., Fragkoudi, F., et al. 2018a, MNRAS, 481, 2
- Sormani et al. (2018b) Sormani, M. C., Treß, R. G., Ridley, M., et al. 2018b, MNRAS, 475, 2383
- Thorsbro et al. (2020) Thorsbro, B., Ryde, N., Rich, R. M., et al. 2020, ApJ, 894, 26
- Tress et al. (2020) Tress, R. G., Sormani, M. C., Glover, S. C. O., et al. 2020, MNRAS, 499, 4455
- Tsatsi et al. (2017) Tsatsi, A., Mastrobuono-Battisti, A., van de Ven, G., et al. 2017, MNRAS, 464, 3720
- Zasowski et al. (2017) Zasowski, G., Cohen, R. E., Chojnowski, S. D., et al. 2017, AJ, 154, 198
- Zasowski et al. (2013) Zasowski, G., Johnson, J. A., Frinchaboy, P. M., et al. 2013, AJ, 146, 81
- Zasowski et al. (2016) Zasowski, G., Ness, M. K., García Pérez, A. E., et al. 2016, ApJ, 832, 132
- Zoccali et al. (2014) Zoccali, M., Gonzalez, O. A., Vasquez, S., et al. 2014, A&A, 562, A66
- Zoccali et al. (2017) Zoccali, M., Vasquez, S., Gonzalez, O. A., et al. 2017, A&A, 599, A12