Two-step deswelling in the Volume Phase Transition of thermoresponsive microgels
Abstract
Thermoresponsive microgels are one of the most investigated types of soft colloids, thanks to their ability to undergo a Volume Phase Transition (VPT) close to ambient temperature. However, this fundamental phenomenon still lacks a detailed microscopic understanding, particularly regarding the presence and the role of charges in the deswelling process. This is particularly important for the widely used Poly(N-isopropylacrylamide)-based microgels, where the constituent monomers are neutral but charged groups arise due to the initiator molecules used in the synthesis. Here we address this point combining experiments with state-of-the-art simulations to show that the microgel collapse does not happen in a homogeneous fashion, but through a two-step mechanism, entirely attributable to electrostatic effects. The signature of this phenomenon is the emergence of a minimum in the ratio between gyration and hydrodynamic radii at the VPT. Thanks to simulations of several microgels with different crosslinker concentrations, charge contents and charge distributions, we provide evidence that peripheral charges arising from the synthesis are responsible for this behavior and we further build a universal master-curve able to predict the two-step deswelling. Our results have direct relevance on fundamental soft condensed matter science and on microgel applications ranging from materials to biomedical technologies.
Responsive particles have recently captured the interest of scientists working under many diverse fields fernandez2011microgel ; lee2017stimuli ; mihut2017assembling . Indeed, their ability to adapt to the environmental conditions has enormous advantages for potential applications from biochemistry to nanomedicine medeiros2011stimuli ; quinn2017glutathione ; wagner2018advanced ; wang2019assembling , but also as smart sensors for various analytes jia2018order ; shin2018synthesis . The versatility of these soft objects lies in the manifold routes in which the chemical components can be synthesized and in the transfer of the single-particle properties to the mesoscopic and macroscopic level.
In particular, most of these responsive particles are macromolecular colloids, whose inner structure relies on a polymeric system which controls the behavior at the colloidal scale. The prototypical example, that is most actively studied in the literature nowadays, is that of microgel particles, i.e. colloidal-scale realizations of a crosslinked polymer network fnieves_lyon ; synthesis . In their most elementary version, these microgels are composed by a single monomeric component. Among all possible compounds, Poly(N-isopropylacrylamide) (pNIPAM) is thermoresponsive and undergoes a solubility transition from good to bad solvent conditions at a temperature . For responsive microgels this phenomenon is called Volume Phase Transition (VPT), by which particles are able to reversibly swell and de-swell across . Microgels can be routinely synthesized in a wide range of sizes roughly going from 50 nm to 100 in diameter, reason for which they are applicable to a variety of purposes and can be investigated with different experimental techniques, from neutron fuzzy and x-ray scattering ninarello2019modeling up to optical methods and microfluidics seiffert2010microfluidic . In addition, their complex internal structure and collective behaviour, involving particle deformation and interpenetration, can nowadays be resolved with single-particle detail thanks to recent advancements in super-resolution microscopy conley2017jamming ; conley2019relationship ; scheffold2020pathways ; bergmann2018super . The possibility to be studied with these fascinating tools make them also one of the favorite model systems for fundamental science both in bulk suspensions synthesis ; bergman2018new and adsorbed at interfaces camerin2020microgels ; rey2020poly ; fernandez2020microgels .
For all the above reasons, it is legitimate to say that the volume phase transition occurring in pNIPAM microgels is one of the most studied phenomena in soft condensed matter. Despite the huge amount of experimental and theoretical work on this topic, that is witnessed by the large number of recent reviews yunker2014physics ; brijitta2019responsive ; karg2019nanogels ; quesada_review ; rovigatti_review ; oberdisse2020recent , there are still fundamental aspects of the VPT that remain poorly understood. In particular, pNIPAM microgels are often treated as neutral systems, since electrostatic interactions are usually thought not to play an important role in their behaviour, apart from the stabilization against aggregation given to the suspension, especially at high temperatures. However, the typical batch synthesis procedure of pNIPAM microgels usually includes charged compounds, in particular those from the initiators of the polymerisation process. While their presence may be effectively neglected or screened out by the addition of salt ninarello2019modeling , recent works pointed out a relevant effect of peripheral charges in concentrated suspensions scotti2016role . At present, the influence of these charges on the VPT has not been clarified yet.
One of the reasons for which these aspects have not been investigated so far may be the lack of detailed numerical simulations able to treat a single microgel in a realistic way. To address these gaps, we recently developed a computational method gnan2017in to assemble disordered networks with desired crosslinker concentration and a core-corona structure that closely reproduces experimental behaviour ninarello2019modeling ; camerin2019microgels . After imposing the correct internal structure, we extended our method to properly include the presence of charged monomers with explicit counterions del2019numerical , again validating our results in the presence of explicit solvent and comparing with available experiments del2020charge . For these reasons, we are now in the condition to carefully assess the effect of initiator charges on the deswelling mechanism of pNIPAM microgels across the VPT.
By combining simulations with static and dynamic light scattering experiments, here we show that the presence of these charges strongly affects, from a qualitative point of view, the deswelling transition, inducing an inhomogeneous two-step collapse of the microgels with increasing temperature. This is due to the different solvophobicity of pNIPAM and charged groups, respectively, which manifests in the emergence of a minimum in the ratio between the gyration and hydrodynamic radii at the VPT. First of all, we show that such a minimum is absent for neutral microgels. Second, we analyse in detail the role of the charge distribution throughout the microgel network to assess whether the initiator groups are preferentially located on the surface of the microgels, as previously hypothesized scotti2016role , but never effectively proven so far. In order to be able to predict the onset of the two-step deswelling, we further study different combinations of crosslinking ratio, charge content and charge distribution, establishing clear trends in the occurrence of the minimum in . Notably, we obtain a master-curve for the observed minimum for all simulated microgels when we plot it as a function of the average charge content per chain on the microgel surface, which turns out to be the simplest indicator of the presence of the two-step collapse.
Our work sheds light on the fundamental electrostatic interactions influencing microgel deswelling, which are crucial to correctly describe their assembly and collective behaviour at high temperatures. In addition, it opens up the possibility to a priori design microgels with desired characteristics and tunable onset of two-step deswelling, which could be exploited to enhance or adjust the potential applications of microgels as smart micro-objects.
Results
Experimental results: swelling curves and
The ratio between gyration and hydrodynamic radii is a relevant quantity in polymer science, widely used as a shape index haydukivska2020universal ; kok1981relationship . These two lengths differently characterize the average polymer distribution inside the macromolecular volume. While is the radius obtained from the standard deviation of the mass distribution around the centre of mass, is an effective size extracted from the self-diffusion coefficient of the particle. For hard spheres (HS) moving in an ideal continuous solvent, considering a uniform distribution of the mass within the particle, a value of is found roovers1989hard . For pNIPAM microgels obtained through radical polymerisation, this quantity at low is usually smaller than the HS value senff1999temperature , since particles consist of a denser core with a density profile gradually fading into the corona. The latter is characterized by the presence of long external chains, the so-called dangling ends, that eventually manifest in an increase of the measured , because of their contribution to the drag, but would not affect significantly the value of nojd2018deswelling . At high temperatures, instead, where microgels are completely collapsed, the ratio should tend to the homogeneous HS limit. Since these two lengths carry complementary information, it is instructive to compare their behavior for microgels across the VPT, in particular to capture the occurrence of internal inhomogeneities of the macromolecular structure upon collapse.
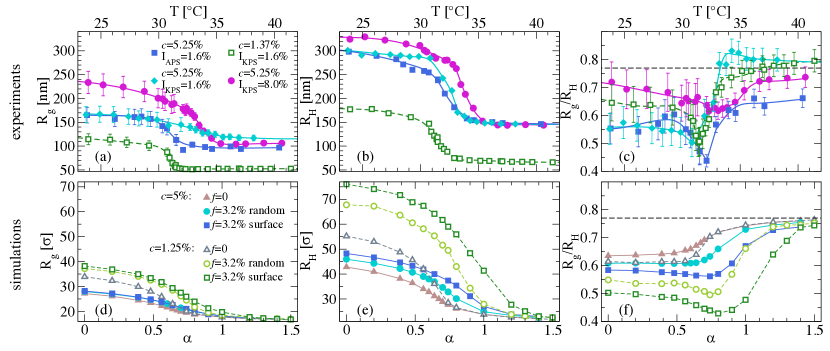
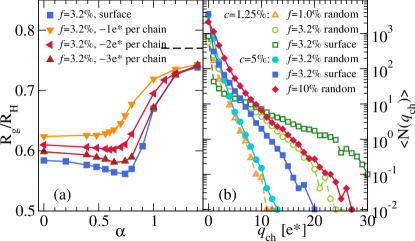
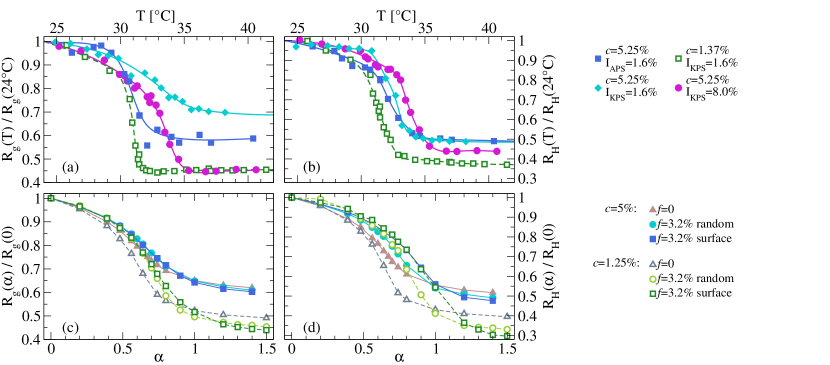
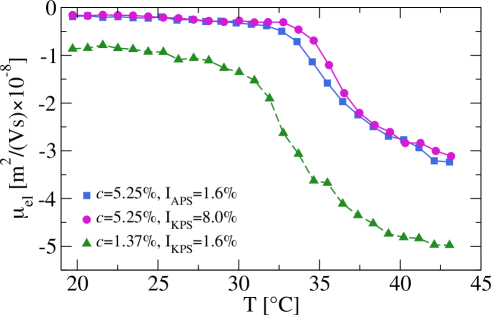
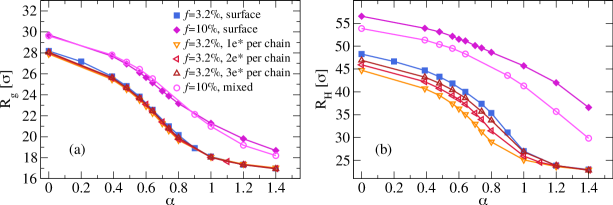
We start by showing experimental results for the size variation of microgels in Fig. 1, where both (a) and (b) are reported as a function of temperature for the different microgel suspensions investigated in this work. We consider pNIPAM microgels synthesized with a fixed amount of potassium persulfide (KPS), which brings into the network a negative charge for each radical unit used in the polymerisation reaction. We use a reference sample (i) with a molar fraction of KPS equal to and a crosslinker concentration , in surfactant free conditions, while varying crosslinker content, initiator content and type respectively for three other samples, to systematically assess the effect of each aspect. Namely, we also investigate: (ii) and (with added surfactant, see Methods), primarily to assess the role of crosslinker; (iii) =8.0% and to evaluate the role of the amount of initiator; (iv) microgels where ammonium persulfide (APS) instead of KPS, is used as initiatior, giving the same charge to the polymer network and differing only on the counterion species (\chNH3+ versus \chK+). For the latter case, the amount of initiator and crosslinker are the same as in the reference sample (, ).
We observe in Fig. 1(a) that both samples with initiator amount of have comparable gyration radius of roughly 150 nm. In contrast, the sample with enhanced KPS amount has a much larger gyration radius ( nm). Concerning the hydrodynamic radius, all three samples with c=5.25% have a comparable size, close to 300 nm, and a similar swelling ratio roughly equal to 2, as also shown in the Supplementary Information (SI) in Fig. S1. We notice as well that microgels with c=1.37% are sensibly smaller, due to the addition of surfactant, and display a larger swelling ratio, as expected for loosely crosslinked microgels. From the swelling curves, we estimate the VPT temperature using a phenomenological function, as described in the SI. We find that the VPT temperature associated to depends on the amount of initiator, since for , while it is higher for . This result can be rationalized by considering the electric charge brought by initiator molecules. Indeed, in agreement with previous studies on charged microgels capriles2008coupled ; del2020charge , a shift of to higher values is found when the amount of charges increases. In addition, we observe that, for all studied samples, the VPT transition is encountered at a lower temperature, by , for with respect to . This could be tentatively interpreted in terms of the presence of charged molecules preferentially within the surface of the network zhou2012correlation , an aspect that will be further analyzed later.
Fig. 1(c) shows as a function of for all samples. At low temperatures, all studied microgels display a lower ratio with respect to the HS limit, indicating a less homogeneous mass distribution. We observe a higher value for b/oth for loosely crosslinked microgels (c=1.37%) and for those carrying a high amount of charges (). The fact that in the former case the particles have a more compact shape, as suggested by the value of a/t low , may be caused by the presence of surfactants. Instead, for the latter case, the larger number of chain ends (constituted by the initiator molecules) may result in shorter chains, which, combined with the small crosslinking effect of KPS virtanen2016persulfate , may lead to higher monomers density in the corona. However, for large , all microgels become more and more compact with tending to converge toward the homogeneous HS value. Although experimental uncertainties prevent us from drawing definite conclusions on the specific values and trends observed for the different samples, we clearly identify that all samples display a minimum in close to the VPT temperature estimated from the hydrodynamic radius (see Table S1). In particular, the three microgels with the same initiator amount display a minimum close to , which is instead found at a slightly larger temperature for microgels with . Interestingly, in this case, the minimum is rather shallow, as opposed to those of the other samples where it is more pronounced. The presence of a minimum in h/as been previously observed in a few experimental studies arleth2005volume ; sun2005investigation , including one from some of the present authors truzzolillo2018overcharging for large and loosely crosslinked microgels. However, most of such previous studies reported only a few data points around the VPT, so that the presence of the minimum was hinted, but not totally evident. In the present work, the fine resolution in temperature allows us to unambiguously observe the minimum for all samples. This can be interpreted in terms of a non-uniform collapse of the microgels, that could be intuitively attributed to the underlying inhomogeneous core-corona structure of the microgels. An alternative explanation could be found in the role played by the initiator charged groups on the deswelling behaviour truzzolillo2018overcharging ; scotti2016role . In particular, arguments in favour of a specific distribution of these charges have been put forward zhou2012correlation ; huang2017hollow ; daly2000temperature , suggesting that during polymerisation, the charged groups try to minimize their mutual electrostatic repulsion by remaining far from each other, thus being located mostly at the periphery rather than in the core of the microgels. Nonetheless, no direct evidence for the location and the arrangement of these groups has been provided so far.
Numerical results: unveiling the role of charges
To provide a microscopic understanding of this issue, we rely on numerical simulations. We focus on microgels that closely match the experimental ones, by imposing very similar crosslinking contents, namely c=1.25% and 5%. We compare the case of perfectly neutral microgels with charged ones, having the same charged monomers fraction () as the initiator groups in experimental systems. For this specific value of , we also vary the charge distribution by considering a random arrangement of the charges either throughout the network, hereafter named random charge distribution, or only onto surface chains (see Methods), that we refer to as surface charge distribution. In this way, we are able to assess how the deswelling behaviour is affected by the charge arrangement upon increasing temperature.
Our coarse-grained modelling accounts for the presence of a disordered network with a realistic core-corona distribution ninarello2019modeling . In the presence of charges, our treatment explicitly includes the presence of counterions, as these turn out to be crucial to provide a proper description of the local inhomogeneities arising in the network del2019numerical . In addition, charged monomers do not change their affinity to the solvent as we vary the temperature in order to properly capture the experimental situation del2020charge . A detailed description of the model is provided in Methods.
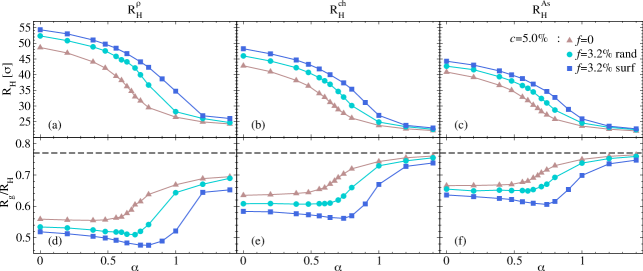
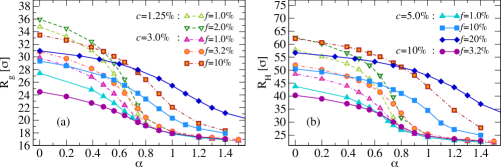
Numerical results for the radius of gyration are reported in Fig. 1(d) as a function of the solvophobic parameter , which plays the role of an effective temperature in simulations. As expected, the gyration radius is found to be mostly influenced by the crosslinker concentration, with being much larger for than for . On the other hand, the presence of charges has a small effect on the gyration radius, which increases only slightly with . Notably, the effect of charge arrangement within the network is almost absent, being very similar for random and surface distributions. To estimate numerically , we rely on an operative definition that is discussed in Methods and further validated in the SI also by comparing previously published data ninarello2019modeling (see Figs. S3,S4). The resulting are reported in Fig. 1(e) as a function of the solvophobic parameter , displaying a behaviour that looks rather similar to that of . An important difference, however, arises when comparing the two different charge distributions. Indeed, we find a significant increase of in the presence of a surface charge distribution compared to the case with random charges due to the accumulation of charges in the corona of the microgel which keeps the latter much more expanded.
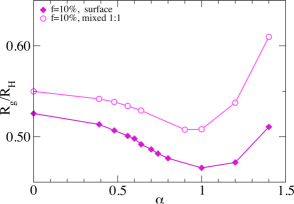
The calculated ratio is shown in Fig. 1(f) as a function of . First of all, we notice that our numerical definition of allows us to obtain estimates for the ratio that are, within statistical uncertainties, in reasonable agreement with experimental ones and that correctly tend to the HS value at large in all cases. While we observe the emergence of a minimum in u/nder specific conditions of charge content and charge distribution, it is important to highlight that such a minimum is completely absent for perfectly neutral microgels, independently of the value of . This result allows us to unambiguously exclude that the appearance of the minimum stems from the underlying core-corona topology of the microgels. Rather, it turns out to be related to the presence of the initiator charges, which therefore plays an explicit role in the VPT of pNIPAM microgels. Such a role, not often recognized in the literature, appears to be important to properly capture the internal modifications of the microgels upon collapse, as also confirmed by electrophoretic mobility measurements across the VPT for a subset of the samples investigated in this work (see Fig. S2) truzzolillo2018overcharging ; sennato2021double .
By examining in more detail the specific features of the microgel for which a minimum in i/s present, we find that, for both studied values of , microgels with charges arranged on the surface display a very pronounced minimum that occurs roughly at the VPT in agreement with experimental findings. Instead, for randomly located charges, the presence of a minimum is evident only for c=1.25%, while it is absent for . Since a minimum is observed for all samples in experiments, this suggests that initiator charges are not randomly spread throughout the network, but rather they are preferentially located close to the microgel surface.
Microscopic origin of the two-step collapse
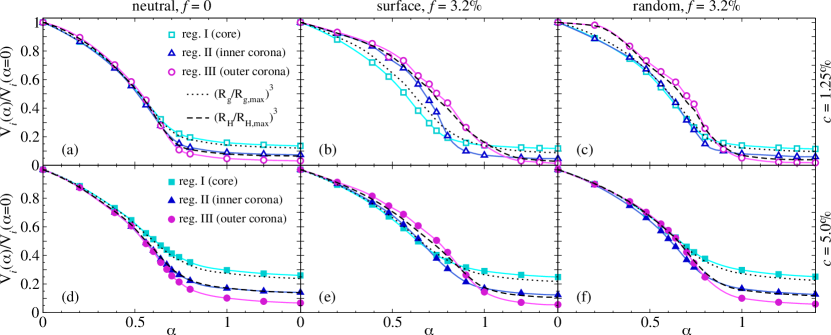
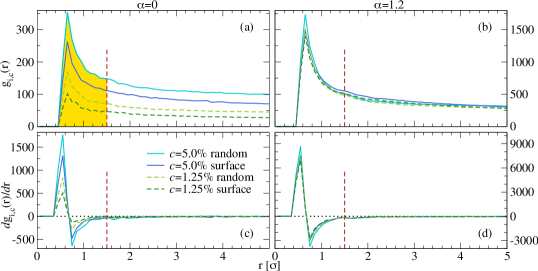
In order to unveil the microscopic mechanism that gives rise to the presence of a minimum in , we analyse the microgels by selecting different regions within their volume and calculating their relative swelling in a so-called “local swelling” approach. We define the internal regions by fixing the number of particles within each of them on the basis of their distance from the centre of mass, so that, upon varying , we monitor the true volume variation of a given portion of the microgel. The three regions are defined as follows: (region I) the core region roughly having the same volume as a sphere of radius equal to the gyration radius; (region II) the inner corona region, corresponding to an intermediate shell, whose volume —together with that of the core— roughly coincides with that delimited by the hydrodynamic radius, and (region III) the outer corona shell. More details on the choices of the three regions are given in Methods and in the SI (see Fig. S5).
We start by discussing the behavior of neutral microgels. For both values of the examined crosslinked concentrations, reported in Fig. 2(a) and (d), we observe that the deswelling transition, monitored by the volume change of each region, occurs roughly at the same value of the solvophobic parameter for all regions. These results indicate that a purely neutral microgel deswells in a homogeneous fashion, independently on the internal structure and thus on its intrinsic core-corona topology. This is due to the fact that all monomers experience the same affinity to the solvent, which induces a simultaneous collapse of the whole particle. No difference is observed between the two values of , except for a more pronounced swelling ratio for the less crosslinked microgels, as expected.
We now turn to the surface-charged microgel with , whose local swelling behaviour is reported in Fig. 2(b) and (e). In this case, it is evident that the collapse of the three regions does not occur simultaneously, with the core (region I) showing a deswelling transition which takes place at a sensibly lower value of with respect to the outer corona (region III). In addition, a clear difference is present for the two values of regarding the inner corona region (region II): while its collapse is approximately the same as that of the core for (panel e), a clear delay in is present for the less crosslinked microgel (panel b). In the latter case, a clear sequence of inflection points is found when going from the inner to the outer region. Similarly to the neutral case, we still observe that the behaviour of the sphere of radius roughly follows that of the core, while that of radius is very close to that of the corona region. These results clearly show that the development of a minimum in the ratio between and , as reported in Fig. 1, can be easily interpreted in terms of the different collapse behaviour that involves, respectively, the core and the corona region, the latter intended as a whole.
We thus refer to this phenomenology for simplicity as a ‘two-step’ collapse, although the number of steps may depend on the level of heterogeneity of the underlying microgels. Its microscopic origin can be traced back to the different affinity of the charged monomers with respect to the solvent and to their different electrostatic screening conditions. Indeed, since charges remain solvophilic at all values of and are accumulated in the corona, this provides the microgel with a heterogeneous collapse mechanism which differentiates the core (where charges are absent) from the corona (where most of the charges are located).
While surface-charged microgels unambiguously show a two-step collapse for both studied values, the situation is different for randomly-charged microgels with , reported in Figs. 2(c,f), which display a different behaviour according to the value of : while for the outer corona is found to undergo a deswelling transition at a larger value of with respect to the core, this is not the case for . This is reflected in the occurrence of a minimum in o/nly for the randomly charged case with , while this is absent for , as previously shown in Fig. 1(f).
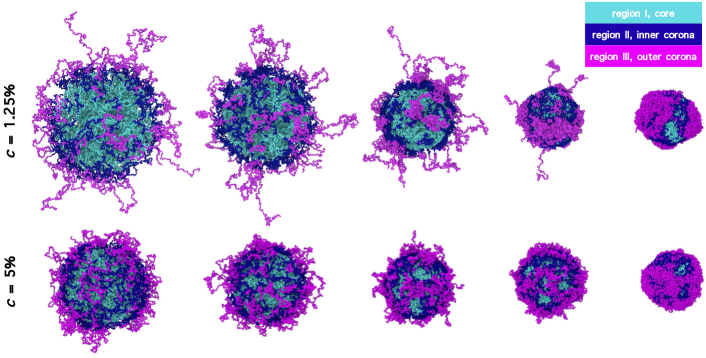
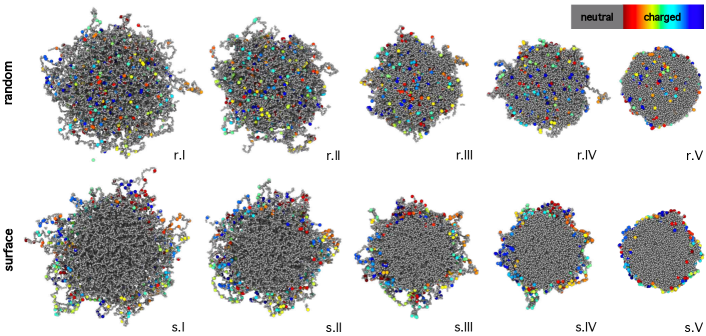
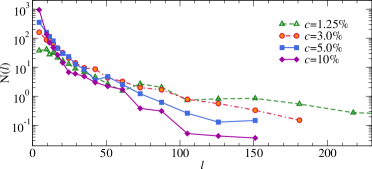
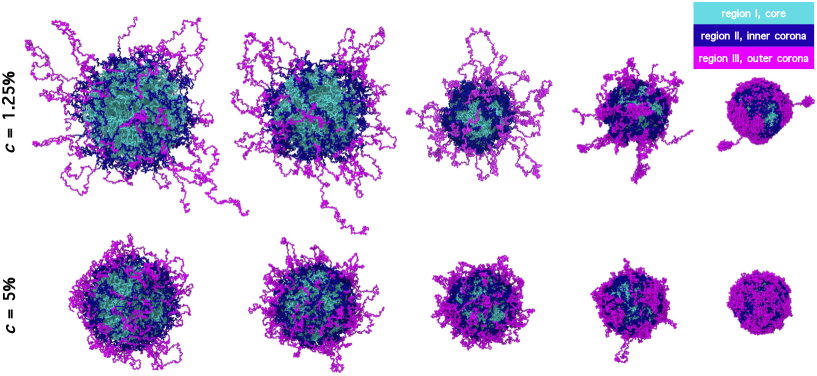
To further confirm that the presence of the minimum is associated to a non-homogeneous internal deswelling of the microgels, we report the snapshots of randomly-charged microgels for the two studied -values in Fig. 3. Starting with the microgel, we clearly see that long dangling chains remain in rather extended configurations even when the internal portions of the networks have already collapsed. This is also evident at values slightly above the VPT, where both core and inner corona are found in a compact spherical shape, while the outer chains are still protruding out of the sphere, giving the microgel an anisotropic global structure. It is instructive to focus on the outer corona monomers at intermediate values of , where the external chains are formed by a mixture of collapsed and extended regions, due to the different solvophobic interactions of charged and neutral monomers, respectively. Although the charge distribution is random, the large amount of long chains in a low-crosslinked microgel (see Fig. S6) makes it favourable to have several charged groups in these regions. This triggers the onset of a minimum in , precisely by the same mechanism occurring in surface-charged microgels. However, such behaviour is not observed for , where the larger amount of crosslinkers limits the chain length in the corona region, thus inhibiting the mutual influence of charges on the dangling chains, as also visible in the snapshots of Fig. 3, illustrating a rather homogenous deswelling for the randomly charged microgel at all values of . For comparison, corresponding snapshots for surface-charged microgels are reported in Fig. S7.
On the basis of the above evidence, we can thus associate the occurrence of a minimum in t/o the two-step collapse of the microgel, differentiating core and corona behaviour. While the underlying topology is not responsible for such a mechanism, it facilitates its onset even for randomly-charged microgels at low , due to the more heterogeneous nature of the network under these conditions.
Effect of crosslinker concentration, charge amount and charge distribution on the minimum in /missing
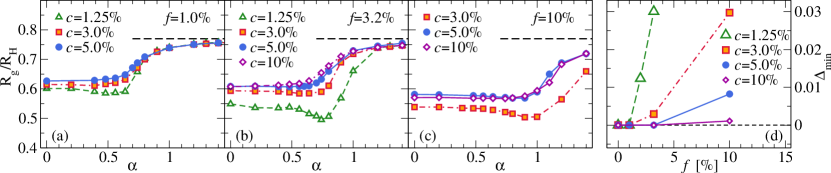
In the previous subsection we provided evidence that the presence of charged groups is a necessary condition for the occurrence of a minimum in , but also that this is found to depend on the specific charge distribution and on the crosslinker concentration. While for microgels decorated with surface charges for , we observed the minimum for both studied values of , which can be intuitively understood in terms of the delayed collapse of charged surface chains, the situation is more complex for randomly-charged microgels, where the presence of the minimum is found to depend also on . To shed light on this aspect, we perform additional simulations of microgels with random charge distributions and investigate the effect of varying as well as . The behaviour of a/s a function of effective temperature is reported in Figs. 4(a-c) for a large variety of microgels, with varying between 1.25% and 10% and exploring a range from to .
We observe that, upon decreasing while leaving unchanged, the minimum becomes more and more evident in agreement with unpublished experimental results sun2005investigation . In addition, Fig. 4 shows that the minimum is more pronounced with increasing at the same value of , also shifting to larger and larger values of . In all cases, the decrease of a/t the minimum is also accompanied by its decrease at small , indicating that the growth of is not compensated by that of under swollen conditions. At large most curves tend to recover the HS value, except for the most charged microgels, that are expected to completely collapse at much larger effective temperatures capriles2008coupled ; del2020charge , beyond those explored in the present simulations.
From all data in Fig. 4(a), we can build a plot reporting the depth of the minimum (defined in Methods) as a function of charge content, reported in Fig. 4(d), for different values of , identifying regions in the parameter space where no minimum is observed (homogeneous deswelling), as opposed to others where this is present (two-step deswelling). Clearly, no minimum is found for low and low . However, at very large , the minimum is also inhibited for very large charge content. Finally, the results in Fig. 4 allow us to exclude the presence of a minimum in f/or highly cross-linked charged microgels.
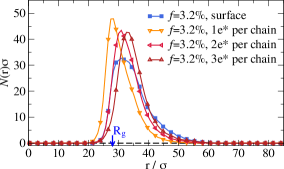
Having shown that the minimum arises also in randomly-charged microgels above a certain charge fraction for each considered , we now further clarify the role of the specific charge distribution by tuning it ad hoc. To this aim, we investigate microgels where charges are located on the surface but with the additional constraint that a fixed number of charges per (surface) chain should be present, varying this number from one to three. In this way we want to assess the role played by charge correlations and whether there exists a minimum amount of charges per chain required to observe the minimum in . The behaviour of f/or these cases is reported in Fig. 5(a), where we clearly find confirmation that there is no minimum when only one charge per chain is present, even if they are all located on the surface (as shown by the charged monomers radial distributions in Fig. S9). A tiny minimum appears when two charges per surface chain are present and finally a well-defined minimum occurs for three charges per chain. The systematic increase of the number of charges per surface chain makes the behaviour of m/ore and more similar to the originally considered case of surface charges that are randomly distributed throughout the corona, thus mimicking the experimental situation of a pNIPAM microgel with a given amount of initiator arranged on the outer part of the microgel surface in a disordered fashion. Not only the minimum becomes more pronounced, but its position also moves towards larger effective temperatures. Additional data for and “mixed” charge distribution (partially located on the surface and partially random) are reported in the SI (Fig. S10).
It is important to notice that, in the case of standard surface charge distribution with , the average charge per surface chain is roughly equal to only. However, the minimum is much more pronounced in this case than when the charge is set to be . In this case, the variance of the number of charges per chain is not negligible, as displayed in Fig. 5(b). In this plot, we report the distribution of the number of charges per chain for random and surface charge distributions with varying and , showing that all curves referring to microgels not displaying the two-step collapse are rather well-described by a single exponential decay, while those with a well-developed minimum reveal the onset of a tail in the distribution. This suggests the development of a characteristic correlation between charges on long chains, which makes the heterogeneous deswelling mechanism much more efficient. The standard deviation of the distribution of charges per chain is further enhanced at , due to the underlying network topology, making the minimum in a/lways more pronounced for low-crosslinked microgels than for the corresponding ones at higher .
To visualize what happens at the level of single chains, we show in Fig. 6 the snapshots of microgel cross-sections for different values of . In particular, we compare random and surface charge distributions with and , and we draw with the same color charges belonging to the same chain. In this way, we aim to visualize the presence of multiple charges per chain and how the deswelling process is affected. We see that for randomly-charged microgels the charged chains, despite a few isolated cases, play a minor role in the overall collapse of the network, probably because they are rare and pulled by the neighboring neutral monomers towards the collapsed network with increasing . Instead, for surface charged microgels, there are many more charged chains, each in turn with several charged monomers which prevent the chains from a full collapse. These microgels are thus found to maintain an extended conformation up to large values of , even beyond the VPT. Hence, prior to the final collapse at very large , the microgel clearly looks like an inner compact sphere decorated by many non-compact chains (see, for instance, Fig. 6(s.IV)).
Predicting the two-step collapse: a simple indicator
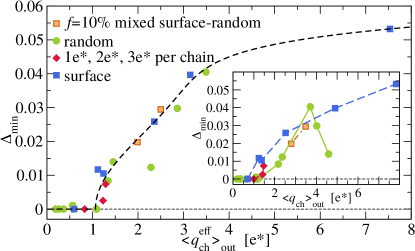
To take full advantage of the predictive ability of the simulations, we are now in the position to establish an indicator that may be useful in predicting the appearance of the minimum in . Since we demonstrated that the two-step collapse is due to the explicit presence of charged groups in the microgels and preferentially to their arrangement on the microgel corona, we propose to identify the average number of charges per chain on the microgel surface, defined as as the observable that controls the onset and the development of the minimum. To verify that this is the case, we plot the dependence of the minimum depth as a function of in the inset of Fig. 7. We find that microgels with the same charge distribution, either surface or random, independently of their values of and , display characteristic behaviours that are roughly monotonic in , except when this is very large in the case of randomly charged microgels (see below). We also notice that no minimum is observed when , meaning that on average more than one charge per surface chain is needed in order to develop the onset of the two-step collapse. Then, as increases, the depth of the minimum gets more and more pronounced both for surface-charged microgels and for those where we impose a fixed number of charges per chain. A similar behaviour is observed for microgels with random charges at low content, and thus low . However, when this increases, we find first a sudden growth of , which even exceeds that of surface-charged microgels at the same , followed by a drastic reduction and a highly non-monotonic behaviour, calling for a further refining of the chosen indicator.
To this aim, we exploit the explicit charge treatment in our simulations and consider the screening effect of the counterions, so that rather than the bare charge, we consider an effective charge per surface chain (see Methods and SI). Therefore, in Fig. 7 we plot the minimum depth as a function of . Remarkably, a master plot is found where data for all simulated microgels ( different systems in total) fall on the same curve manifesting the same behaviour. We notice that a couple of points are found to slightly deviate from the master curve, which may well be attributed to the statistical uncertainty of our calculations, which are carried out for a single topology and charge realization for each microgel. However, it is noteworthy that the use of the effective charge is able to completely remove the non-monotonicity of the data for randomly charged microgels as a function of bare charge, indicating the overall correctness of our procedure. In this respect, we remark that this is due to the fact that screening effects are much more effective for random rather than for surface charged microgels, which can be intuitively understood in terms of an overall reduced electrostatic repulsion experienced by the counterions when charges are distributed throughout the entire network, thus facilitating the microgel collapse.
Discussion
In this work, we thoroughly investigated the swelling behaviour of microgels across the VPT upon varying crosslinker concentration and charge distribution. The study was motivated by experimental measurements of gyration and hydrodynamic radii that showed the appearance of a characteristic minimum in the ratio a/t a temperature close to the VPT one. Such a minimum indicates that a different rate of collapse with increasing temperature takes place between the inner mass of the microgel, quantified in size by the gyration radius, and its outer mass, associated to the hydrodynamic radius. A similar evidence was also reported in few previous works arleth2005volume ; sun2005investigation , but its microscopic origin was not investigated in detail so far. The new measurements reported in this paper for four different samples unambiguously reveal the presence of such a minimum. In a previous experimental work by some of us truzzolillo2018overcharging , the minimum was tentatively associated to the presence of initiator charges, manifesting their effect under collapsed conditions even for simple pNIPAM microgels. This conjecture was supported by electrophoretic mobility measurements also displaying a rapid increase of the signal for temperatures above the VPT, thus providing evidence that, in the high temperature regime, pNIPAM microgels have to be considered as charged micro-objects scotti2016role ; braibanti2016impact ; sennato2021double . However, a legitimate doubt concerned whether the minimum in w/ould be solely due to charges or could be attributed to other ingredients, such as the inhomogeneous core-corona topology of pNIPAM microgels synthesized by precipitation polymerisation methods. For these reasons, the primary purpose of the present work was to correctly assess the role of charges on the occurrence of the minimum.
We thus performed an extensive set of simulations for several realistic microgels, with different crosslinker concentration, charge content and distribution. First of all, we found that the minimum does not occur for purely neutral microgels, even for very low cross-linked concentrations (like , the lowest value investigated in this work), where the inhomogeneous internal structure of the microgels is enhanced. Hence, we can safely exclude that the two-step collapse is associated to the topology, whereas it must be attributed to additional interactions emerging at the VPT which modify the homogeneous deswelling that would take place in a perfectly neutral microgel. Incidentally, it is important to notice that, to our knowledge, it is currently not possible to synthesize strictly uncharged microgels made of pNIPAM, the only example being for microgels made of (non-thermoresponsive) polystyrene van2017fragility , thus preventing confirmation of the present numerical predictions. Alternatively, experiments could be performed in the presence of added salt that would screen electrostatic interactions braibanti2016impact , though at the same time favoring microgel-microgel aggregation at high temperatures.
The additional mechanism giving rise to the two-step deswelling is thus attributed to electrostatic effects. In particular, charged initiator groups interact with the solvent in a different way with respect to NIPAM monomers as temperature increases, since they always maintain a solvophilic character, acting against collapse. When the amount of initiator is very low as in common synthesis procedures, these effects can be very subtle and may depend on the location of these charges. Therefore, it is important to discriminate between random location of charges throughout the network and surface arrangement at the periphery of the corona. Indeed, the latter case seems to be appropriate to model charged initiators which start the polymerisation process and then possibly remain confined in the outer part of the microgel to minimize mutual electrostatic interactions. In this way, being localized on the surface, upon particle collapse the charged groups would experience a strong mutual repulsion, thus influencing the corona deswelling as demonstrated in the previous sections. On the other hand, a random distribution of charges would ‘dilute’ the effect of the electrostatic contribution throughout the whole particle, including the core, unlikely affecting the collapse of the particle during the VPT.
The simulation results presented here clearly show that, for typical amounts of initiators used in synthesis of pNIPAM microgels () and standard crosslinker concentration (c=5%), a random distribution of charges does not give rise to a minimum in , while this is present when charges are distributed only on the surface. Actually, the minimum for random charge arrangement only manifests at much higher or lower , a numerical prediction that awaits for experimental confirmation. In this respect, it would be useful to perform measurements of for ionic microgels, e.g. in the presence of a second component such as PAAc. In this case, due to different reaction rates, the co-monomers might still be inhomogeneously distributed stefanie , so it remains to be verified whether a random distribution of charges may still apply in certain cases.
On the other hand, our simulations showed that microgels with surface charge distribution seem to be the appropriate model to describe the occurrence of the minimum in pNIPAM microgels, in agreement with experimental measurements and with previous hypothesis howe ; zhou2012correlation ; daly2000temperature , although a direct proof of charge location in experiments would be very valuable. To this purpose, super-resolution microscopy experiments conley2017jamming could be helpful when combined with selective labeling of the surface or even of the initiators, as well as studies where the average bare charge and screening electrostatic conditions of the polymer chains would be systematically varied, as recently done in Ref. bergman2020controlling . Additionally, one could rely on neutron scattering measurements, where differentiations of the molecular components could be achieved by contrast variation mohanty2017interpenetration ; nojd2018deswelling ; scotti2018hollow . The numerical results of the present work will further provide a framework to interpret experimental data thanks to the master curve reported in Fig. 7, which makes use of a single quantity, the screened average charge per surface chain , to describe the two-step deswelling process. These experiments could also be used to estimate such an effective charge.
Another important point to be addressed in the future is to systematically vary the amount of initiator, a relatively unexplored parameter. It will be interesting to see to which extent it can be exploited, given that too large amount of initiator could give rise to synthesis by-products that would not necessarily be part of the microgel network. In addition, it could be possible that above some threshold, the charges would start to penetrate in the interior of the microgel giving rise to ‘mixed’ surface-random distribution, as discussed in Ref. huang2017hollow . Indeed, looking at the experimental behavior for =8% (Fig. 1), we observe that this sample displays larger values of at low temperatures and a shallower minimum at the VPT, in qualitative agreement with the effect of mixed charge distributions shown in the SI. These findings seem to suggest that increasing the initiator molar fraction in the synthesis does not simply give rise to an augmented charge distribution peaked at the microgel periphery, but presumably homogenizes the initiator (and possibly the mass) distribution radially within the microgel.
Finally, the outcomes of this work will also be relevant for the study of the collective behaviour of pNIPAM microgels at high temperatures, where numerical/theoretical works are currently lacking. While it is now established that the effective potential for swollen microgels can be described as a soft repulsion rovigatti2019elasticity ; bergman2018new , at high temperatures attractive interactions should become important howe ; schweizer2021viscoelasticity , albeit mediated by the electrostatic interactions of the initiator. It will be therefore necessary to appropriately assess their contribution to the collective and rheological behaviour of dense microgel suspensions.
Models, Materials and Methods
Synthesis
Surfactant-free radical polymerisation has been used to synthesize different batches of pNIPAM microgels. Specifically, we used methylene-bis-acrylamide (BIS) as crosslinker agent and two cationic initiators: potassium persulfate (\chK2S2O8, KPS) and ammonium persulfate (\ch(NH4)2S2O8, APS). Three different batches with of BIS have been synthesized with the following initiator content and type: of KPS; of APS; of KPS. Since our main focus is to scrutinize the role of initiator charges, we primarily use microgels obtained via surfactant-free emulsion polymerization, which allows us to minimize the impact of residual ionic surfactants on microgel deswelling. However, we also carried out one synthesis in the presence of surfactant and used the sample after purification, in order to test the possible impact of surfactant addition, while at the same time reducing both the microgel size for low crosslinker content and the associated error on the measurement. In this way, we obtained a batch of smaller particles, which has been prepared through the addition of an amount of of sodium dodecyl-sulfate (SDS). In this case microgels are synthesized with of BIS and of KPS. All samples have been further purified through 3 consecutive cycles of centrifugation and supernatant replacement with deionized water. Finally, 2 of sodium azide \chNaN3 have been added to the final samples to prevent bacterial growth.
Experiments
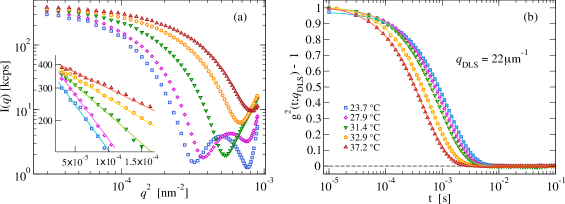
To characterize the structure of particles in suspension we employed static and dynamic light scattering (SLS, DLS). For all the samples an aliquot of the mother batches ( of NIPAM) has been diluted 60 times so to reach a mass fraction of of NIPAM, equivalent to microgel volume fractions lower than 0.4% as determined by viscosimetry following the method detailed in Ref. truzzolillo2015bulk . All scattering experiments have been performed by using the same laser source (). Before each data acquisition, each sample has been thermostatted for via a recirculating bath with accuracy and light has been collected by varying the scattering angle for SLS measurements with accuracy. We extracted the average gyration radius of microgels, fitting the low scattering-vector part of the intensity with the functional form (Guinier approximation) as discussed in the SI (see Fig. S11). For all samples data could be reliably fitted in the entire range . The uncertainty on Rg is given by the fit error, the latter being less than of the best-fit value. For all the samples, has been measured over a range of scattering wave-vectors going from to .
Through dynamic light scattering we measured the autocorrelation function of the scattered intensity at a fixed value of . At high dilution, this can be put in relation with the square of the self intermediate scattering function , which for simply diffusive systems has the functional shape of a convolution of exponential decays, taking into account the effects of polydispersity. The analysis of has been performed by cumulant analysis, up to the second central moment of the distribution of decay rates:
| (1) |
where is the average self-diffusion coefficient and is related to the second moment of the distribution of of the molecules in the sample. Using Stokes formula we obtain the average hydrodynamic radius as , and the corresponding dispersion is , where is the Boltzmann’s constant, the bath temperature and is the zero-shear viscosity of the solvent. For microgels with we measured the intensity time-correlation function at , corresponding to an angle of , while for microgels with we gathered data at both and (the latter corresponding to an angle of ) in order to possibly detect and reject spurious effects of polydispersity when was close to a value correspondent to the first minimum of the microgel form factor. The polydispersity indexes of the samples , calculated at , are: (i) for and , (ii) for and , (iii) for and , and (iv) for and .
Numerical simulations
We simulate monomer-resolved microgels of beads exploiting a recently developed protocol gnan2017in able to generate fully-bonded, disordered polymer networks. By appropriately tuning the internal polymer distribution, the model faithfully reproduces measured swelling properties and form factors of neutral microgels across the VPT ninarello2019modeling . The resulting network structure is made of equal-size beads, representing polymer segments interacting with the well-established Kremer-Grest potential grest1986molecular . In this model, all beads experience a steric repulsion, modeled with the Weeks-Chandler-Anderson (WCA) potential:
| (2) |
where and are the energy and length units, respectively. Connected beads also interact via the finitely extensible nonlinear elastic potential (FENE):
| (3) |
where is the maximum bond distance and is a stiffness parameter influencing the rigidity of the bond. These bonds cannot break during the simulation, mimicking strong covalent bonding. Beads that are linked via FENE to two neighbours represent NIPAM monomers, while those mimicking crosslinkers have fourfold valence. We analyse in detail values of the crosslinker fraction similar to the experimental ones, i.e. 1.25% and 5.0%. In order to be more quantitative on the -dependence of results, we also provide specific additional results for 3.0%, 7.5% and 10%.
We consider that microgels obtained via free-radical polymerisation embed a certain amount of ionic groups in their backbone, in this case \chSO4-, resulting from the dissociation of APS/KPS after a further thermal splitting of the ions \chS2O8^2-, starting the reaction and remaining attached to the network. This is modeled by providing a fraction of the beads with a negative charge and inserting an equivalent number of counterions with positive charge to preserve overall electro-neutrality. Counterions sterically interact among each other and with microgel beads through the WCA potential. Their diameter is set to to avoid spurious effects from excluded volume del2019numerical , while electrostatic interactions are given by the Coulomb potential , where and are the charges of the beads, and is the reduced unit for the charge, embedding the vacuum and relative dielectric constants, and . and are set to the values or whether it refers to charged beads or counterions. For different values of we consider several values for the fraction of charged monomers. We analyse in detail the case , corresponding to an initiator concentration , that matches the nominal charge content in some of the performed experiments. We also consider , a relatively high charge fraction that should mimic the experimental situation with a nominal initiator content of , assuming that in a synthesis process with a large quantity of highly reactive initiator radicals, a non-negligible amount of charged groups would end up in low molecular mass byproducts, that will be removed by filtration at the end of the process. For comparison, we also study the neutral case () to highlight effects entirely attributable to charges. Simulations are performed for both random and surface charge distributions. In the former case, charged beads are randomly distributed throughout the network (except on crosslinkers), while for the latter they are found only on surface chains. To this aim, we randomly choose beads located in the exterior corona, whose distance from the microgel centre of mass is greater than . In all simulations the solvent is implicitly taken into account through an effective potential which mimics the change in the polymer-solvent affinity by raising temperature:
| (4) |
where is the solvophobicity parameter representing the effective temperature, which is varied from (good solvent conditions) to (bad solvent conditions) to reproduce the swelling curve from the swollen state to the most collapsed ones. Here and are constants defining the functional shape of the potential soddemann2001generic . We showed in a previous work del2020charge that, for a correct description of charge effects, only neutral monomers should interact with the additional potential. Instead, charged monomers retain a solvophilic character at all temperatures, i.e. for the interaction among charged beads and other charged or neutral ones we always set . The equations of motion are integrated through a Nosé-Hoover thermostat in the constant NVT ensemble for the equilibration, and through a Velocity-Verlet algorithm in the constant-energy ensemble for the production runs, with an integration time-step , where is the reduced time unit. All simulations are performed with the LAMMPS package LAMMPS at fixed temperature . Long-range Coulomb interactions are computed with the particle-particle-particle-mesh method p3m . The equilibration of each system is carried out for , followed by a production run of from which we extracted the equilibrium averages of the main observables of interest, such as the gyration radius and the density profile, defined as the average density at a fixed distance from the centre of mass, .
To estimate in simulations, we instantaneously approximate the microgel as an effective ellipsoid rovigatti2019elasticity and then calculate the hydrodynamic friction using the approach developed by Hubbard and Douglas hubbard1993hydrodynamic . For each configuration, we first compute the convex hull containing all the beads of the microgel, then evaluate the gyration tensor of all the simplices it is made of and finally determine the ellipsoid with the same gyration tensor rovigatti2019elasticity . The hydrodynamic friction of each ellipsoid is calculated as hubbard1993hydrodynamic :
| (5) |
where is the solvent viscosity and is the electrostatic capacitance. Eqn. S3 is based on a solution of the Navier-Stokes equation for steady flow of rigid particles with stick boundary conditions, where the hydrodynamic interactions are described by the isotropic angular averaged Oseen tensor hubbard1993hydrodynamic . In this approximation, the Navier-Stokes equation for the momentum flux density taked the same form of the Poisson’s equation for electrostatics, thereby the hydrodynamic radius becomes mathematically equivalent to the electrostatic capacitance, which for rigid ellipsoids is hubbard1993hydrodynamic :
| (6) |
where , , are the principal semiaxes. More details on the calculation of are provided in the SI.
To evidence the differences in the local structure of the microgels, we calculated the local swelling curve as the volume of three different regions, defined on the basis of the quantity of monomers they contain. Ordering the polymer beads according to their distance from the centre of mass, at each time we associate the most inner fraction of monomers of beads to the core (region I), the subsequent fraction of them to the inner corona shell (region II), and the farthest fraction of beads to the outer corona shell (region III). We choose the fraction in such a way that the core region has an overall constant density profile at all and values. The values of and are chosen in such a way that the monomers density profile at the boundary separating the two corona shells takes a value close to half the average density of the core region, to separate the more crosslinked inner part of the corona from the most external region with low density dangling chains (see Fig. S5). The volumes of the three regions, and their outer surfaces, are calculated as the convex hulls enclosing all the beads associated to them.
To quantify the distributions of charges per chain, we calculate the chain length distribution, where each chain is defined as the sequence of monomers between crosslinkers, and we count the number of charged monomers for each chain (). To build the master plot in Fig. 7, we define the extent of the minimum as the difference between the value of a/t and at its minimum. We also define the average number of charges per chain on the microgel surface , where is averaged only over chains whose distance from the microgel’s centre of mass is greater than . To take into account screening effects, we also consider the effective charge per surface chain , that is obtained by considering an average screened charge based on the integration of the ion-counterion pair-distribution function up to a determined distance, as discussed in the SI (see Fig. S12).
Acknowledgements.
We thank E. Buratti, E. Lattuada, J. Ruiz-Franco, P. Schurtenberger and F. Sciortino for valuable discussions. We acknowledge financial support from the European Research Council (ERC Consolidator Grant 681597, MIMIC), from the European Union’s Horizon 2020 research and innovation programme (Grant 731019, EUSMI), from MIUR (FARE project R16XLE2X3L, SOFTART), and from the Agence Nationale de la Recherche (ANR) (Grant N∘ ANR-20-CE06-0030-01, THELECTRA). The authors gratefully acknowledge the computing time granted by EUSMI on the supercomputer JURECA at the Jülich Supercomputing Centre (JSC).Competing interests
The authors declare no conflict of interest.
Supplemental Materials: Two-step deswelling in the Volume Phase Transition of thermoresponsive microgels
Giovanni Del Monte,1,2,3 Domenico Truzzolillo,4,* Fabrizio Camerin,2,1 Andrea Ninarello,2,1 Edouard Chauveau,4 Letizia Tavagnacco,2,1 Nicoletta Gnan,2,1 Lorenzo Rovigatti,1,2 Simona Sennato,2,1 Emanuela Zaccarelli2,1,*
Corresponding authors (*): domenico.truzzolillo@umontpellier.fr, emanuela.zaccarelli@cnr.it
Swelling ratio and transition temperatures
In Figure S1 we report the normalized version of the swelling curves for both and from experiments and simulations, reported in Fig. 1 of the main text. This highlights the similar swelling ratios between low and high temperature obtained for experimental samples and numerical calculations, reinforcing our confidence in the employed method to estimate in simulations.
In addition, we discuss the transition temperatures of both and for the experimental samples, and the analogous effective temperatures for the simulated microgels. For numerical data we simply calculate as the inflection point of a spline fit of the data. In experiments it is more convenient to extract from fits of the swelling curves through the phenomenological function
| (S1) |
that is able to accurately capture the behavior of both and in the whole investigated temperature range, avoiding spurious effects from the large fluctuations. We do not rely on the Flory-Rehner equation, that involves several free parameters, and moreover it has been argued not to be able to quantitatively describe the experimental swelling of PNIPAM microgels lopez2017flory . In Tab. S1 the experimental transition temperatures for and are reported.
| Fits with Eq.S1 | Fit errors | ||||
|---|---|---|---|---|---|
| [%mol] | [%mol] | [℃] | [℃] | [℃] | [℃] |
| 5.25 | 1.6 (KPS) | 31.6 | 32.4 | 0.5 | 0.8 |
| 5.25 | 1.6 (APS) | 30.9 | 32.1 | 1.1 | 3.4 |
| 5.25 | 8.0 (KPS) | 33.3 | 33.7 | 0.4 | 2.4 |
| 1.37 | 1.6 (KPS) | 30.9 | 31.3 | 0.3 | 1.8 |
First of all we notice that the value of is similar for all three samples with of crosslinker, as expected. In addition, we find that the VPT temperature is slightly lower for with respect to by about ℃. For the highly charged sample, with a nominal initiator concentration of , we find a larger for both and , in agreement with previous studies on charged microgels del2020charge ; capriles2008coupled .
This scenario is in qualitative agreement with simulations data, for which the values of are summarised in Table S2.
| [%] | [%] | ||
|---|---|---|---|
| 1.25 | 0 | 0.62 | 0.65 |
| 3.0 | 0 | 0.64 | 0.66 |
| 5.0 | 0 | 0.68 | 0.69 |
| 10.0 | 0 | 0.60 | 0.65 |
| [%] | [%] | ||
|---|---|---|---|
| 1.25 | 1.0 | 0.66 | 0.69 |
| 3.0 | 1.0 | 0.63 | 0.69 |
| 5.0 | 1.0 | 0.66 | 0.68 |
| 1.25 | 2.0 | 0.70 | 0.77 |
| 1.25 | 3.2 | 0.76 | 0.78 |
| 3.0 | 3.2 | 0.73 | 0.82 |
| 5.0 | 3.2 | 0.69 | 0.75 |
| 10.0 | 3.2 | 0.69 | 0.72 |
| 3.0 | 10 | 0.89 | 1.04 |
| 5.0 | 10 | 0.79 | 1.04 |
| [%] | [%] | ||
|---|---|---|---|
| 1.25 | 3.2 | 0.72 | 0.87 |
| 3.0 | 3.2 | 0.69 | 0.95 |
| 5.0 | 3.2 | 0.63 | 0.90 |
| 10.0 | 3.2 | 0.77 | 0.86 |
| 5.0 | 10 | 0.66 | - |
| [%] | per chain [] | ||
|---|---|---|---|
| 5.0 | 1 | 0.72 | 0.72 |
| 5.0 | 2 | 0.68 | 0.78 |
| 5.0 | 3 | 0.68 | 0.87 |
Similarly to what observed in experiments, the value of is found to depend on the amount of charges on the microgels, while the dependence on crosslinker concentration seems to be negligible. Indeed, for a given value of , differences in the data are found to be within the error, considering this to be of the order of 0.05, given the used sampling of . In particular, we find that it increases with increasing and also moving from a random to a surface distribution of the ionic monomers. Again, we also find that the estimated is slightly larger when estimated from than from . We notice that for a microgel with c=5% and f=10% arranged on the surface, a robust value of could not be estimated because we did not detect the full collapse of the microgel.
Electrophoretic mobility
In Fig. S2 we show the -dependence of the electrophoretic mobility measured for three of the samples discussed in the manuscript. In agreement with previous works truzzolillo2018overcharging , we find that a strong increase of is observed close to the VPT transition. In particular, we observe that c=5% microgels (squares and circles in Fig. S2) at low have much lower values of with respect to c=1.37% microgels (triangles in Fig. S2) at the same charge fraction. This may be due to the larger size of the former, since in the swollen state they have lower diffusivity and better screening conditions (lower surface-to-volume ratio). The transition temperature seems to increase with increasing initiator concentration while not being affected from the crosslinker concentration. Surprisingly, microgels with different initiator quantities but of roughly the same size show quite similar values of . This may be due to different factors: on one hand, we expect that, for large , a non-negligible part of the initiator comes out in low molecular weight byproducts, given the high reactivity of these molecules, resulting in a bare charge for final microgels particles which is lower than the nominal one; on the other hand, the higher the bare charge, the stronger is the electrostatic screening, resulting in an effective charge which is not proportional to the bare one, if not for very low values. Further experiments assessing the dependence of on initiator content in a more systematic fashion would be needed in order to properly understand this behavior, which is beyond the scope of the present work.
On the estimate of
As reported in the main text, the hydrodynamic radius is a measure of the diffusivity of the particles, that is defined as the radius of a spherical particle moving in a continuous viscous fluid with small Reynolds number (Stokes radius):
| (S2) |
where is the long-time diffusion coefficient, the thermal energy, and the dynamic viscosity. For suspensions of Hard Spheres (HS) roughly corresponds to the geometrical radii of the particles, while for polymeric soft particles, for which a sharp geometrical surface cannot be defined, it still depends on the extension of the external polymeric chains and their density. Since in our simulations with implicit solvent treatment the diffusion coefficient cannot be computed, and simulations in explicit solvent (with even coarse-grained particles) are out of our disposal of computing resources, we are left to estimate from static equilibrium properties.
Several approximated methods have been proposed to compute estimated values of from equilibrium configurations of polymeric particles, each with different limitationsmansfield2007comparison . All of them consider the solvent as a continuous medium flowing through and around the particles. We did not consider methods based on the approximation of the macromolecule as a continuous porous mediumbrinkman1949calculation ; ooms1970frictional , since this approximation is not suitable for polymeric particles with low chains density in the corona, such as microgels. We also avoided the use of the Kirkwood double-sum formulakirkwood1996general , which does not account for long range correlations in the hydrodynamic force field, and it has been applied successfully only to simple polymer chains. The most accurate methods for estimating the hydrodynamic radius are based on numerical or approximated steady-state solutions of the Navier-Stokes equations for ensembles of spherical bead scatterersswan2016rapid ; ortega2011prediction , which are highly computationally demanding for large sized macromolecules. In any case, for systems such as microgels, the main effect on the diffusivity of the particles is given by the polymer chains on the corona, hence it is convenient to define a particle surfacemansfield2007comparison and then estimate as the hydrodynamic radius associated to that shape. In this work we pursue that way, which represents a trade-off among accuracy and computational feasibility.
In this work, we instantaneously approximate the microgel to an effective ellipsoid rovigatti2019elasticity and then calculate the hydrodynamic friction using the approach developed by Hubbard and Douglas hubbard1993hydrodynamic . For each instantaneous configuration, we first compute the convex hull containing all the beads of the microgel and then evaluate the gyration tensor of all the simplices it is made of. Finally, we determine the ellipsoid having the same gyration tensor as previously done in Ref. rovigatti2019elasticity . To compute the hydrodynamic friction of each ellipsoid we exploited the relation hubbard1993hydrodynamic :
| (S3) |
where is the solvent viscosity and is the electrostatic capacitance. This relation has been shown to well approximate the friction acting on brownian rigid particles and to be valid for objects of arbitrary shape douglas1994hydrodynamic . Eqn. S3 is based on a solution of the Navier-Stokes equation for steady flow of rigid particles with stick boundary conditions, where the hydrodynamic interactions are described by the isotropic angular averaged Oseen tensor hubbard1993hydrodynamic . In this approximation, the Navier-Stokes equation for the momentum flux density assumes the same form of the Poisson’s equation for electrostatics, thereby the hydrodynamic radius becomes mathematically equivalent to the electrostatic capacitance, which for rigid ellipsoids is hubbard1993hydrodynamic :
| (S4) |
where , , are the principal semiaxes.
Here we show the comparison among three methods to compute by defining an effective surface for the microgel. For the first one we approximate the microgel as a sphere of radius such that the equilibrium monomers density profile assumes the value at this distance from the center of mass, as also done in a previous work ninarello2019modeling . This definition results to be rough as compared to the other two methods, because it does not account for thermal and shape fluctuations. For the other two methods we compute for each equilibrium configuration a surface mesh, approximating the microgel as a hard ellipsoid having the same gyration tensor of the surface faces, of which we compute the hydrodynamic radius as explained in the main text. The difference among them consists in the way the surface mesh is constructed. In one case the convex hull has been computed, obtaining the estimated hydrodynamic radius , which is the value used in the computations of the main text. The other case involves the computation of the surface mesh with the Alpha-shape methodstukowski2014computational , which is based on a Delaunay tessellation of the microgels’ beads, thereby the space regions are considered as empty or occupied whether the radius of a circumscribing sphere is greater or smaller than a certain probing radius , after that a surface mesh is constructed. At the same way, from this surface mesh (computed exploiting the Ovito python package) is obtained the hydrodynamic radius estimate , which obviously depends on the probing sphere radius . The last two methods lead to comparable results, but the convex hull method is parameter-free and the values of the ratio at small and large values of the solvophobic parameter seems to be more in agreement with the experimental observations, hence we decided to use that method throughout the manuscript.
In Fig. S3 we show the comparison among the three methods by observing the different estimates of (top panels) and the ratio (bottom panels) on microgels with crosslinker concentration (similar trends are observed for microgels with different values of , not shown), different charged beads fractions () and charge distributions (random, surface). The calculation of is found to be less accurate with respect to the other two methods, due to the low statistics of monomers for densities , well in the outer corona region. In addition, the other two methods both tend to the correct HS value for a/t large . Importantly, all three methods give an overall qualitatively similar behavior, with the onset of a minimum in for microgel with surface arrangement of charges, while the neutral microgel does not show such a minimum for all three definitions of hydrodynamic radius.
To further validate our current definition of , we here perform a quantitative comparison with experimental data reported in Ref. ninarello2019modeling . In this case, a very large amount of salt was added to the samples in order to screen electrostatic effect, so that the comparison can be performed using neutral microgels. Fig. S4 reports measured by DLS as a function of that is compared to the hydrodynamic radius estimated in simulations within the three approaches described above. The comparison is performed using the experimental-numerical mapping established in Ref. ninarello2019modeling based on the -dependence of the form factors, i.e. without employing additional fit parameters.
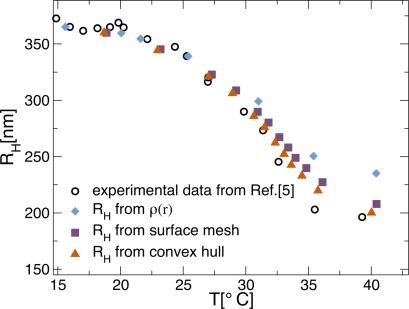
We find a significant improvement of the agreemenent between experiments and simulations when adopting the present definition of , particularly with respect to the one based on . Indeed, the full collapse of the microgel appears to be well reproduced by the simulations. These findings provide additional robustness to the present method used to define . However, it will be important in the future to perform a similar kind of comparison with experiments, based on the form factors, also for charged microgels.
Local swelling in monomers profiles
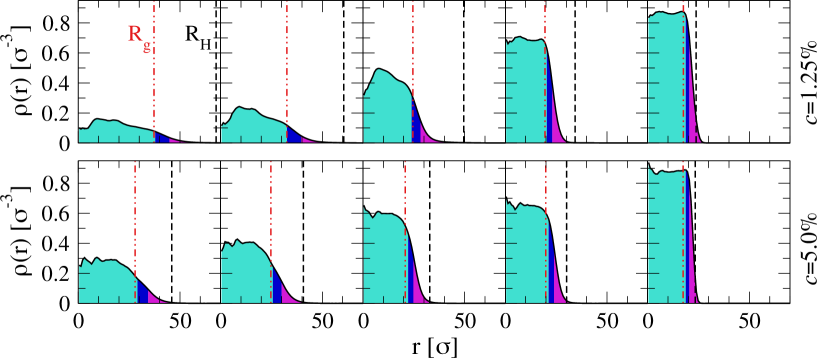
In Fig. S5 we show the monomer density profiles calculated from simulations of microgels with (top and bottom panels, respectively) and randomly distributed charges as a function of . The coloured regions beneath the curves represent the three different regions used in the analysis of the local swelling of Fig. 2 of the main text, highlighting the core (region I, containing 65% of most inner particles), the inner corona (region II, consisting of 20% of monomers nearest to the core beads) and the outer corona (region III, comprising the 15% most exterior beads) of the microgels. Representative snapshots corresponding to microgels in each panel of the figure are shown in Fig. 3 of the main text. As it can be seen, the gyration radius roughly corresponds to the extension of the core region at all and values, sharing similar swelling properties as evident from Fig. 2 of the main text, while the hydrodynamic radius embeds also the corona regions, and its value is clearly dependent on the extension of the outer chains, with differences among the cases and . For completeness, we notice that the nonmonotonicities observable at low-distance are due to the fact that these data are not averaged over multiple initial configurations. They would be removed by considering several microgel topologies, as shown in our previous works ninarello2019modeling , and do not affect the local swelling discussion.
Chain length distributions
Fig. S6 shows the number distribution of the chain length of the microgels. The behavior of all the curves is consistent with a superposition of two exponential distributions, one for low values, mainly accounting for the chains in the core region, and another for high values of , which is mostly given by the long chains that can be found in the corona of the microgels. This is due to the radial distribution of the crosslinkers used in the assembly process of the network topology ninarello2019modeling , with the aim to realistically mimic the mass distribution of microgels. Of course, it is evident that as decreases, small chains become less and less populated while longer chains increase in number and also in length. Again, the noise of the data at large would be easily improved by considering averages over multiple microgel topologies, as already done in Ref. ninarello2019modeling .
Local swelling for surface charged microgels
For the sake of completeness, we report in Fig. S7 the snapshots showing the local swelling of surface-charged microgels for and with a charge fraction .
Effects of charge fraction for randomly charged microgels
In Fig. S8 we show the swelling curves of and for randomly charged microgels, whose ratio i/s reported in Fig. 4(a) of the main text. The swollen size of microgels and the transition temperature increase as increases, as shown in previous studies. The swelling ratio, defined as the ratio between the swollen and the collapsed radius, is found to be inversely proportional to , as expected.
Charged monomers distributions in microgels with charges on the surface
In Fig. S9 we show the radial distribution of charged monomers in the four kinds of surface charges distributions with displayed in Fig. 5 of the main text.
Effect of charge distribution
Fig. S10 shows the swelling curves of and for surface charged microgels whose ratio i/s displayed in Fig. 5 of the main text.
Different ways to distribute charged beads on the microgels’ corona are considered. We report the case of standard surface-charged microgels, for which charges are randomly distributed in the region on a neutral equilibrated configuration with the constraint that two consecutive beads on a chain cannot both be charged. In addition, we consider microgels in which charges are distributed in a constant number for each chain on the most exterior chains. As we can notice, is almost not affected by the charge distribution, while significantly increases as the number of charges per chain grows. We also consider, for the highly charged microgel (), the case in which half of the charges are distributed randomly throughout the network, half being on the surface (mixed distribution). Also in this case the distribution has a negligible effect on the swelling properties of , while having a strong effect on , for which we cannot observe a transition in the range of examined values.
In Fig. S10 we also report f/or charged microgels with different surface distributions, in particular focusing on high charge content . In this case, we do not observe a total collapse of the microgel at high , but still we find a rather deep minimum in f/or . Such a minimum appears to be wider with respect to that occurring at low values, but the total hindering of the collapse indicates that probably such surface-charged microgel is not realizable in the experiments, given the high charge content. Hence, in addition, we analysed mixed charge distributions, still with but where half of the charges are located at random and half on the surface (mixed 1:1 distribution). These systems display an intermediate behaviour between the random and the surface charged ones.
Guinier plots and cumulants analysis
We extracted the average gyration radius of microgels, fitting the low scattering-vector part of the intensity with the functional form (Guinier approximation) as:
| (S5) |
where is a constant depending on the number of particles in the scattering volume and on the scattering factor of a single particle beaucage1995approximations , while is their radius of gyration, defined as:
| (S6) |
and is the magnitude of the scattering vector. The Guinier regime for our microgels is attained for coherently with previously reported microgel syntheses clara2012structural ; gasser2014form . For all samples Eq. S5 reliably fitted the available data in the entire range . The uncertainty on is given by the fit error, the latter being less than of the best-fit value.
Charges screening
In the top panels of Fig. S12 the cross radial distribution functions for ions and counterions are shown, for the swollen (a) and the collapsed (b) state. The vertical dashed line indicates the cutoff value of , that we used to calculate the screened charge per chain used to predict the presence of the minimum in ,/shown in Fig. 7 of the main text. As we see from the bottom panels in Fig. S12(c,d), roughly indicates the distance at which the derivative of becomes roughly zero. Integrating up to we estimate the amount of counterions which can be considered as “bounded” to charged beads, that we use to compute the effective charges .
References
- (1) Fernandez-Nieves A, Wyss H, Mattsson J, Weitz DA (2011) Microgel suspensions: fundamentals and applications. (John Wiley & Sons).
- (2) Lee J, et al. (2017) Stimuli-responsive, shape-transforming nanostructured particles. Advanced materials 29(29):1700608.
- (3) Mihut AM, Stenqvist B, Lund M, Schurtenberger P, Crassous JJ (2017) Assembling oppositely charged lock and key responsive colloids: A mesoscale analog of adaptive chemistry. Science advances 3(9):e1700321.
- (4) Medeiros S, Santos A, Fessi H, Elaissari A (2011) Stimuli-responsive magnetic particles for biomedical applications. International journal of pharmaceutics 403(1-2):139–161.
- (5) Quinn JF, Whittaker MR, Davis TP (2017) Glutathione responsive polymers and their application in drug delivery systems. Polymer Chemistry 8(1):97–126.
- (6) Wagner AM, Spencer DS, Peppas NA (2018) Advanced architectures in the design of responsive polymers for cancer nanomedicine. Journal of applied polymer science 135(24):46154.
- (7) Wang M, et al. (2019) Assembling responsive microgels at responsive lipid membranes. Proceedings of the National Academy of Sciences 116(12):5442–5450.
- (8) Jia S, Tang Z, Guan Y, Zhang Y (2018) Order–disorder transition in doped microgel colloidal crystals and its application for optical sensing. ACS applied materials & interfaces 10(17):14254–14258.
- (9) Shin DS, et al. (2018) Synthesis of microgel sensors for spatial and temporal monitoring of protease activity. ACS biomaterials science & engineering 4(2):378–387.
- (10) Lyon LA, Fernandez-Nieves A (2012) The polymer/colloid duality of microgel suspensions. Annual review of physical chemistry 63:25–43.
- (11) Pelton R, Hoare T (2011) Microgels and their synthesis: An introduction. Microgel Suspensions: Fundamentals and Applications 1:1–32.
- (12) Stieger M, Richtering W, Pedersen JS, Lindner P (2004) Small-angle neutron scattering study of structural changes in temperature sensitive microgel colloids. The Journal of chemical physics 120(13):6197–6206.
- (13) Ninarello A, et al. (2019) Modeling microgels with a controlled structure across the volume phase transition. Macromolecules 52(20):7584–7592.
- (14) Seiffert S, Weitz DA (2010) Microfluidic fabrication of smart microgels from macromolecular precursors. Polymer 51(25):5883–5889.
- (15) Conley GM, Aebischer P, Nöjd S, Schurtenberger P, Scheffold F (2017) Jamming and overpacking fuzzy microgels: Deformation, interpenetration, and compression. Science advances 3(10):e1700969.
- (16) Conley GM, Zhang C, Aebischer P, Harden JL, Scheffold F (2019) Relationship between rheology and structure of interpenetrating, deforming and compressing microgels. Nature communications 10(1):2436.
- (17) Scheffold F (2020) Pathways and challenges towards a complete characterization of microgels. Nature Communications 11(1):1–13.
- (18) Bergmann S, Wrede O, Huser T, Hellweg T (2018) Super-resolution optical microscopy resolves network morphology of smart colloidal microgels. PCCP 20(7):5074–5083.
- (19) Bergman MJ, et al. (2018) A new look at effective interactions between microgel particles. Nature communications 9(1):1–11.
- (20) Camerin F, et al. (2020) Microgels at interfaces behave as 2d elastic particles featuring reentrant dynamics. Physical Review X 10(3):031012.
- (21) Rey M, Fernandez-Rodriguez MA, Karg M, Isa L, Vogel N (2020) Poly-n-isopropylacrylamide nanogels and microgels at fluid interfaces. Accounts of chemical research 53(2):414–424.
- (22) Fernandez-Rodriguez MA, Martín-Molina A, Maldonado-Valderrama J (2021) Microgels at interfaces, from mickering emulsions to flat interfaces and back. Adv. Coll. Interf. Sci. 288:102350.
- (23) Yunker PJ, et al. (2014) Physics in ordered and disordered colloidal matter composed of poly (n-isopropylacrylamide) microgel particles. Reports on Progress in Physics 77(5):056601.
- (24) Brijitta J, Schurtenberger P (2019) Responsive hydrogel colloids: Structure, interactions, phase behaviour, and equilibrium and non-equilibrium transitions of microgel dispersions. Current Opinion in Colloid & Interface Science 40:87–103.
- (25) Karg M, et al. (2019) Nanogels and microgels: From model colloids to applications, recent developments, and future trends. Langmuir 35(19):6231–6255.
- (26) Martín-Molina A, Quesada-Pérez M (2019) A review of coarse-grained simulations of nanogel and microgel particles. Journal of Molecular Liquids 280:374–381.
- (27) Rovigatti L, Gnan N, Tavagnacco L, Moreno AJ, Zaccarelli E (2019) Numerical modelling of non-ionic microgels: an overview. Soft matter 15(6):1108–1119.
- (28) Oberdisse J, Hellweg T (2020) Recent advances in stimuli-responsive core-shell microgel particles: synthesis, characterisation, and applications. Coll. Pol. Sci. 298:921–935.
- (29) Scotti A, et al. (2016) The role of ions in the self-healing behavior of soft particle suspensions. Proceedings of the National Academy of Sciences 113(20):5576–5581.
- (30) Gnan N, Rovigatti L, Bergman M, Zaccarelli E (2017) In silico synthesis of microgel particles. Macromolecules 50(21):8777–8786.
- (31) Camerin F, et al. (2019) Microgels adsorbed at liquid–liquid interfaces: A joint numerical and experimental study. ACS nano 13(4):4548–4559.
- (32) Del Monte G, et al. (2019) Numerical insights on ionic microgels: structure and swelling behaviour. Soft matter 15(40):8113–8128.
- (33) Del Monte G, et al. (2020) Charge affinity and solvent effects in numerical simulations of ionic microgels. Journal of Physics: Condensed Matter 33(8):084001.
- (34) Haydukivska K, Blavatska V, Paturej J (2020) Universal size ratios of gaussian polymers with complex architecture: radius of gyration vs hydrodynamic radius. Sci. Rep. 10(1):1–11.
- (35) Kok CM, Ruin A (1981) Relationship between the hydrodynamic radius and the radius of gyration of a polymer in solution. Die Makromolekulare Chemie 2(11):655–659.
- (36) Roovers J, Martin J (1989) The hard-sphere model for linear and regular star polybutadienes. Journal of Polymer Science Part B: Polymer Physics 27(12):2513–2524.
- (37) Senff H, Richtering W (1999) Temperature sensitive microgel suspensions: Colloidal phase behavior and rheology of soft spheres. The Journal of chemical physics 111(4):1705–1711.
- (38) Nöjd S, et al. (2018) Deswelling behaviour of ionic microgel particles from low to ultra-high densities. Soft Matter 14(20):4150–4159.
- (39) Capriles-González D, Sierra-Martín B, Fernández-Nieves A, Fernández-Barbero A (2008) Coupled deswelling of multiresponse microgels. The Journal of Physical Chemistry B 112(39):12195–12200.
- (40) Zhou J, et al. (2012) Correlation between dielectric/electric properties and cross-linking/charge density distributions of thermally sensitive spherical pnipam microgels. Macromolecules 45(15):6158–6167.
- (41) Virtanen O, Mourran A, Pinard P, Richtering W (2016) Persulfate initiated ultra-low cross-linked poly (n-isopropylacrylamide) microgels possess an unusual inverted cross-linking structure. Soft matter 12(17):3919–3928.
- (42) Arleth L, Xia X, Hjelm RP, Wu J, Hu Z (2005) Volume transition and internal structures of small poly (n-isopropylacrylamide) microgels. J. Pol. Sci. B: Polymer Physics 43(7):849–860.
- (43) Sun Y (2005) Investigation of volume phase transition from the different properties of particles. arXiv:physics/0511160.
- (44) Truzzolillo D, et al. (2018) Overcharging and reentrant condensation of thermoresponsive ionic microgels. Soft Matter 14(20):4110–4125.
- (45) Huang C, Kobayashi H, Moritaka M, Okubo M (2017) Hollow particles are produced by the burying of sulfate end-groups inside particles prepared by emulsion polymerization of styrene with potassium persulfate as initiator in the absence/presence of a nonionic emulsifier. Polymer Chemistry 8(45):6972–6980.
- (46) Daly E, Saunders BR (2000) Temperature–dependent electrophoretic mobility and hydrodynamic radius measurements of poly (n-isopropylacrylamide) microgel particles: structural insights. Physical Chemistry Chemical Physics 2(14):3187–3193.
- (47) Sennato S, Chauveau E, Casciardi S, Bordi F, Truzzolillo D (2021) The double-faced electrostatic behavior of pnipam microgels. Polymers 13(7):1153.
- (48) Braibanti M, Haro-Pérez C, Quesada-Pérez M, Rojas-Ochoa LF, Trappe V (2016) Impact of volume transition on the net charge of poly-n-isopropyl acrylamide microgels. Physical Review E 94(3):032601.
- (49) Van Der Scheer P, Van De Laar T, Van Der Gucht J, Vlassopoulos D, Sprakel J (2017) Fragility and strength in nanoparticle glasses. ACS nano 11(7):6755–6763.
- (50) Hofzumahaus C, Hebbeker P, Schneider S (2018) Monte carlo simulations of weak polyelectrolyte microgels: ph-dependence of conformation and ionization. Soft Matter 14:4087–4100.
- (51) Mansfield ML, Douglas JF, Irfan S, Kang EH (2007) Comparison of approximate methods for calculating the friction coefficient and intrinsic viscosity of nanoparticles and macromolecules. Macromolecules 40(7):2575–2589.
- (52) Howe AM, et al. (2009) Anomalous viscosity jump during the volume phase transition of poly (n-isopropylacrylamide) particles. Advances in colloid and interface science 147:124–131.
- (53) Bergman MJ, Pedersen JS, Schurtenberger P, Boon N (2020) Controlling the morphology of microgels by ionic stimuli. Soft matter 16(11):2786–2794.
- (54) Mohanty PS, et al. (2017) Interpenetration of polymeric microgels at ultrahigh densities. Scientific Reports 7(1):1–12.
- (55) Scotti A, et al. (2018) Hollow microgels squeezed in overcrowded environments. The journal of chemical physics 148(17):174903.
- (56) Rovigatti L, Gnan N, Ninarello A, Zaccarelli E (2019) Connecting elasticity and effective interactions of neutral microgels: The validity of the hertzian model. Macromolecules 52(13):4895–4906.
- (57) Chaudhary G, et al. (2021) Linear and nonlinear viscoelasticity of concentrated thermoresponsive microgel suspensions. arXiv:2103.02108.
- (58) Truzzolillo D, Roger V, Dupas C, Mora S, Cipelletti L (2015) Bulk and interfacial stresses in suspensions of soft and hard colloids. Journal of Physics: Condensed Matter 27(19):194103.
- (59) Grest GS, Kremer K (1986) Molecular dynamics simulation for polymers in the presence of a heat bath. Physical Review A 33(5):3628.
- (60) Soddemann T, Dünweg B, Kremer K (2001) A generic computer model for amphiphilic systems. The European Physical Journal E 6(1):409–419.
- (61) Plimpton S (1995) Fast parallel algorithms for short-range molecular dynamics. Journal of Computational Physics 117(1):1–19.
- (62) Deserno M, Holm C (1998) How to mesh up ewald sums. i. a theoretical and numerical comparison of various particle mesh routines. J. Chem. Phys. 109(18):7678–7693.
- (63) Hubbard JB, Douglas JF (1993) Hydrodynamic friction of arbitrarily shaped brownian particles. Physical Review E 47(5):R2983.
- (64) Brinkman HC (1949) A calculation of the viscous force exerted by a flowing fluid on a dense swarm of particles. Flow, Turbulence and Combustion 1(1):27–34.
- (65) Ooms GPFM, Mijnlieff PF, Beckers HL (1970) Frictional force exerted by a flowing fluid on a permeable particle, with particular reference to polymer coils. The Journal of Chemical Physics 53(11):4123–4130.
- (66) Kirkwood JG (1996) The general theory of irreversible processes in solutions of macromolecules. Journal of Polymer Science Part B: Polymer Physics 34(4):597–610.
- (67) Swan JW, Wang G (2016) Rapid calculation of hydrodynamic and transport properties in concentrated solutions of colloidal particles and macromolecules. Physics of Fluids 28(1):011902.
- (68) Ortega A, Amorós D, De La Torre JG (2011) Prediction of hydrodynamic and other solution properties of rigid proteins from atomic-and residue-level models. Biophysical journal 101(4):892–898.
- (69) Douglas JF, Zhou HX, Hubbard JB (1994) Hydrodynamic friction and the capacitance of arbitrarily shaped objects. Physical Review E 49(6):5319.
- (70) Stukowski A (2014) Computational analysis methods in atomistic modeling of crystals. Jom 66(3):399–407.
- (71) Beaucage G (1995) Approximations leading to a unified exponential/power-law approach to small-angle scattering. Journal of Applied Crystallography 28(6):717–728.
- (72) Clara-Rahola J, Fernandez-Nieves A, Sierra-Martin B, South AB, Lyon LA, Kohlbrecher J, Fernandez Barbero A (2012) Structural properties of thermoresponsive poly (N-isopropylacrylamide)-poly (ethyleneglycol) microgels. The Journal of chemical physics 136(21):214903.
- (73) Gasser U, Hyatt JS, Lietor-Santos JJ, Herman ES, Lyon LA, Fernandez-Nieves A (2014) Form factor of pNIPAM microgels in overpacked states. The Journal of chemical physics 141(3):034901.
- (74) Lopez CG, Richtering W (2017) Does Flory–Rehner theory quantitatively describe the swelling of thermoresponsive microgels?. Soft Matter 13(44):8271–8280.